el paso water 2019 drinking water report
TRANSCRIPT
Versión en Español al reverso.
This annual report, required by the U.S. Environmental Protection Agency (EPA), describes the source and quality of your drinking water and our efforts to ensure a high quality water supply. We test our water for potentially harm-ful substances and put it through a purification process before delivering it to the community. Thanks to improved treatment methods and the increasing sophistication of laboratory instrumentation, water quality in El Paso is better than it has ever been. The sources of both tap water and bottled water include rivers, lakes, streams, ponds, reservoirs, springs and wells. As water travels over the surface of the land or through the ground, it dissolves naturally-occurring minerals and can pick up substances resulting from the presence of animals or from human activity.
Contaminants that may reasonably be present in source water include:n Microbial contaminants, such as viruses and bacteria, which may come from wastewater treat- ment plants, septic systems, agricultural livestock operations and wildlife. n Inorganic contaminants, such as salts and metals, which can be naturally-occurring or result from urban stormwater run- off, industrial or domestic wastewater discharges, oil and gas produc- tion, mining or farming. n Pesticides and herbicides, which may come from sources such as agri- culture, urban stormwater runoff and residential uses.n Organic chemical contaminants, including synthetic and volatile organic chemicals, which are by-products of industrial processes and petroleum production, and can also come from gas stations, urban stormwater runoff and septic systems. n Radioactive contaminants, which can be naturally occurring or the
result of oil and gas production and mining activities.
In order to ensure that tap water is safe to drink, the EPA prescribes regu-lations that limit the amount of certain contaminants in water provided by public water systems. Food and Drug Administration regulations establish
limits for contaminants in bottled water that must provide the same protection for public health. Drinking water, including bottled
water, may reasonably be expected to contain at least small amounts of some contaminants. The presence of contam-
inants does not necessarily indicate that water poses a health risk. Contaminants might be found in drinking water that may cause taste, color or odor problems. These types of problems are not necessarily causes for health concerns. For more information on the taste, odor or color of drinking water, please call 915-594-5733.
More information about contaminants and potential health effects can be obtained by calling the EPA’s Safe
Drinking Water Hotline (800-426-4791).
Required Additional Health InformationYou may be more vulnerable than the general population to cer-
tain microbial contaminants, such as Cryptosporidium, in drinking wa-ter. Infants; some elderly or immuno-compromised persons such as those undergoing chemotherapy for cancer; those who have undergone organ transplants; those who are undergoing treatment with steroids; and peo-ple with HIV/AIDS or other immune system disorders can be particular-ly at risk from infections. You should seek advice about drinking water from your physician or health care provider. Additional guidelines on appropriate means to lessen the risk of infection by Cryptosporidium are available from the Safe Drinking Water Hotline (800-426-4791).
We Take Water Quality Seriously
E l P a s o W a t e r
2019 Drinking Water Report
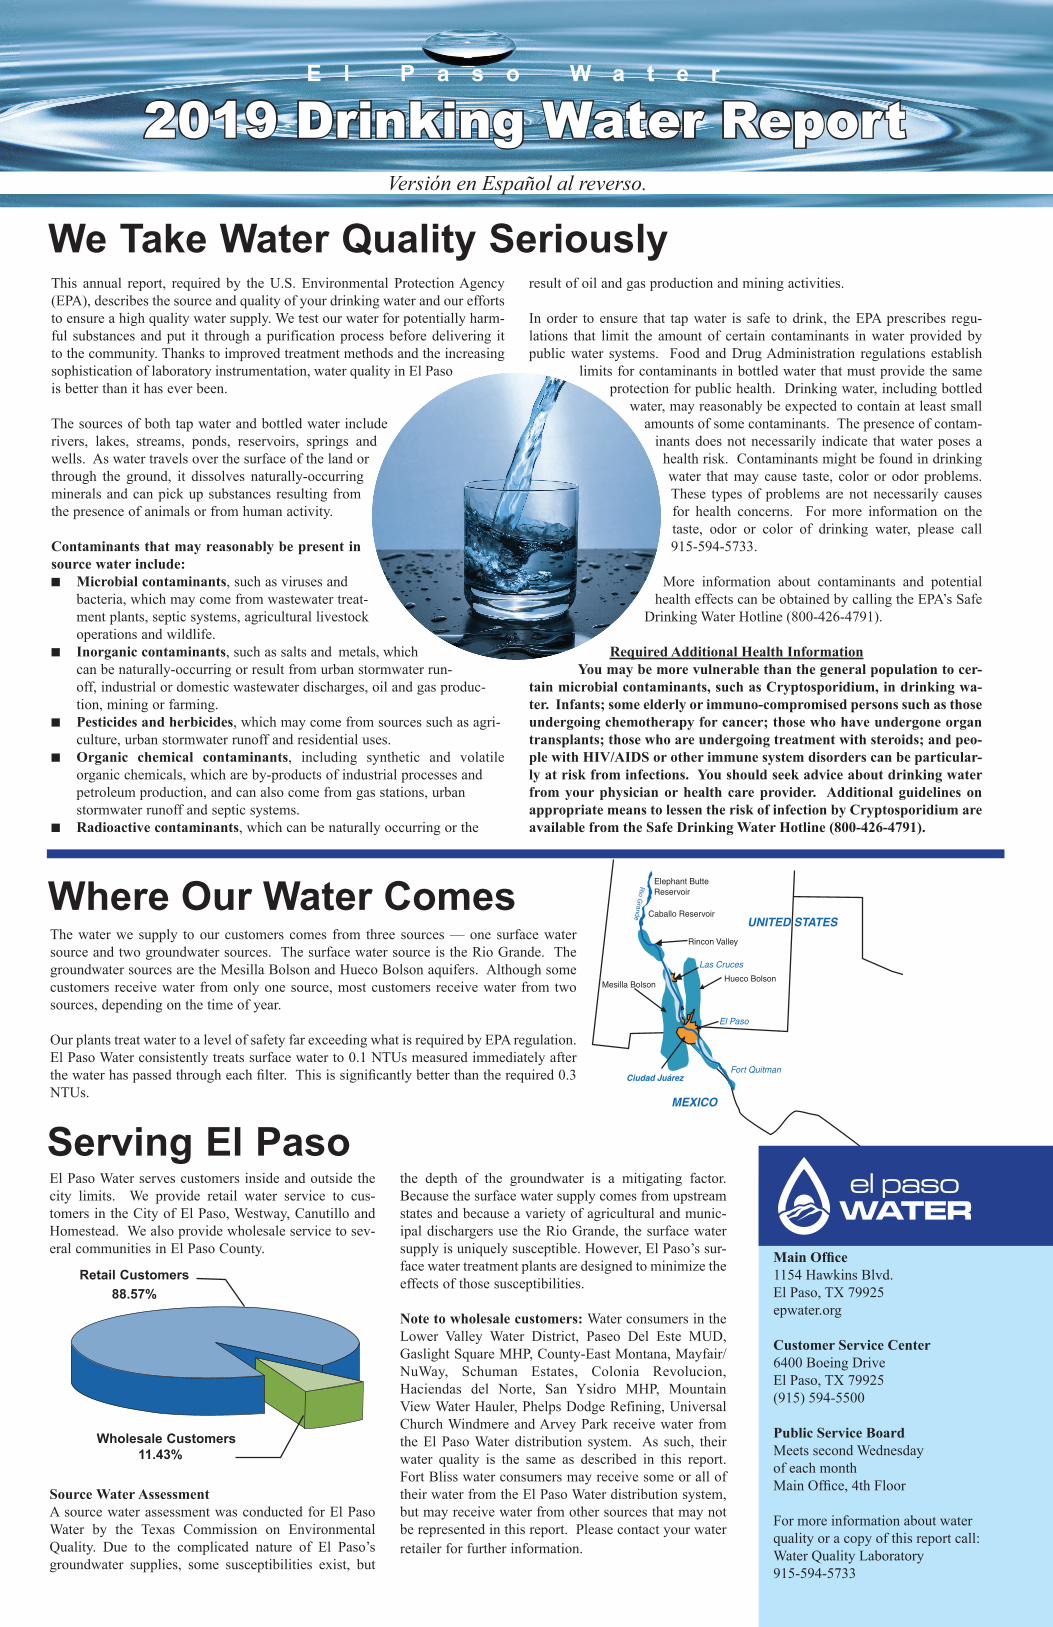
The water we supply to our customers comes from three sources — one surface water source and two groundwater sources. The surface water source is the Rio Grande. The groundwater sources are the Mesilla Bolson and Hueco Bolson aquifers. Although some customers receive water from only one source, most customers receive water from two sources, depending on the time of year.
Our plants treat water to a level of safety far exceeding what is required by EPA regulation. El Paso Water consistently treats surface water to 0.1 NTUs measured immediately after the water has passed through each filter. This is significantly better than the required 0.3 NTUs.
Main Office1154 Hawkins Blvd. El Paso, TX 79925epwater.org
Customer Service Center6400 Boeing DriveEl Paso, TX 79925(915) 594-5500
Public Service Board Meets second Wednesday of each monthMain Office, 4th Floor
For more information about water quality or a copy of this report call:Water Quality Laboratory 915-594-5733
Where Our Water Comes
El Paso Water serves customers inside and outside the city limits. We provide retail water service to cus-tomers in the City of El Paso, Westway, Canutillo and Homestead. We also provide wholesale service to sev-eral communities in El Paso County.
Source Water AssessmentA source water assessment was conducted for El Paso Water by the Texas Commission on Environmental Quality. Due to the complicated nature of El Paso’s groundwater supplies, some susceptibilities exist, but
the depth of the groundwater is a mitigating factor. Because the surface water supply comes from upstream states and because a variety of agricultural and munic-ipal dischargers use the Rio Grande, the surface water supply is uniquely susceptible. However, El Paso’s sur-face water treatment plants are designed to minimize the effects of those susceptibilities.
Note to wholesale customers: Water consumers in the Lower Valley Water District, Paseo Del Este MUD, Gaslight Square MHP, County-East Montana, Mayfair/NuWay, Schuman Estates, Colonia Revolucion, Haciendas del Norte, San Ysidro MHP, Mountain View Water Hauler, Phelps Dodge Refining, Universal Church Windmere and Arvey Park receive water from the El Paso Water distribution system. As such, their water quality is the same as described in this report. Fort Bliss water consumers may receive some or all of their water from the El Paso Water distribution system, but may receive water from other sources that may not be represented in this report. Please contact your water retailer for further information.
Serving El Paso
Retail Customers 88.57%
Wholesale Customers 11.43%

Substance Units Sample Range of Average MCL MCLG Violation Possible Source Year Samples Level Inorganic ContaminantsArsenic ppb 2019 0 - 14 4.8 10 0 No Erosion of natural depositsBarium ppm 2019 0.017-0.013 0.08 2 2 No Erosion of natural depositsChromium ppb 2019 0 - 6 2.3 100 100 No Erosion of natural depositsFluoride ppm 2019 0.13 - 0.65 0.44 4 4 No Erosion of natural depositsNitrate as Nitrogen ppm 2019 0 - 2.3 0.77 10 10 No Runoff from fertilizer useNitrite as Nitrogen ppm 2019 0 - 0.09 0.03 10 10 No Runoff from fertilizer use Radioactive Contaminants Gross Alpha, excluding pCi/L 2019 3.0 - 3.0 3.0 15 0 No Erosion of natural deposits radon and uraniumUranium ppb 2019 2.5 - 2.5 2.5 30 0 No Erosion of natural depositsDisinfection Byproducts Bromate ppb 2019 0 - 4 1.33 10 0 No By-product of drinking water disinfectionChlorite ppm 2019 0 - 0.0199 0.003 1 0.8 No By-product of drinking water disinfectionVolatile Organic ContaminantsTotal Xylenes ppb 2019 0 - 1.38 0.000 10000 10000 No Discharge from rubber and chemical factoriesUnregulated ContaminantsChloroform ppb 2019 0 - 60.5 4.14 N/A 70 N/A By-product of drinking water disinfectionBromoform ppb 2019 0 - 28.7 1.76 N/A 0 N/A By-product of drinking water disinfectionBromodichloromethane ppb 2019 0 - 30.6 3.17 N/A 0 N/A By-product of drinking water disinfectionDibromochloromethane ppb 2019 0 - 17.7 3.11 N/A 60 N/A By-product of drinking water disinfectionLead and Copper Units Sample Range of 90th Action MCLG Violation Possible Source Year Samples Percentile LevelCopper ppm 2019 0.006 - 0.55 0.24 1.3 1.3 No Corrosion of household plumbing systemsLead ppb 2019 0 - 84 (1) 10 15 0 No Corrosion of household plumbing systemsDisinfection Byproducts Units Sample Range of Highest MCL MCLG Violation Possible Source Year Samples LRAATotal Halocetic Acids (THAA) ppb 2019 0.0 - 37.4 16.9 60 N/A No By-product of drinking water disinfectionTotal Trihalomethanes (TTHM) ppb 2019 0.0 - 110 48.3 80 N/A No By product of drinking water disinfectionDisinfection Residual Units Sample Range of Average MRDL MRDLG Violation Possible Source Year Samples LevelChlorine ppm 2019 1.47 - 2.2 1.76 4 4 No Water additive used to control microbesChlorine Dioxide ppb 2019 0 - 0 0 800 800 No Water additive used to control microbesTotal Organic Carbon Sample Range of Average Possible Source Year Samples LevelRemoval Ratio 2019 1.19 - 2.67 1.77 Naturally present in the environment
Coliform Bacteria Units Sample Highest Total No. of Positive MCL MCLG Violation Possible Source Year No. of E. coli or Fecal Positive Coliform SamplesTotal Coliform % 2019 0.4 N/A See below (2) 0 No Naturally present in the environmentFecal Coliform or E. coli 2019 N/A 0 See below (2) 0 No Naturally present in the environment Turbidity Units Sample Level Detected Limit (Treatment Technique) Violation Possible Source Year Highest single measurement NTU 2019 0.28 1 No Soil runoff Lowest monthly % meeting limit NTU 2019 100% 0.30 No Soil runoff
DRINKING WATER ANALYSIS
Health Effects Language
Turbidity (NTU) - Turbidity has no health effects. Turbidity is monitored because it can interfere with disin-fection and provide a medium for microbial growth.
Arsenic (ppb) - While your drink-ing water meets EPA’s standard for arsenic, it does contain low levels of arsenic. EPA’s standard balances the current understanding of arsenic’s possible health effects against the costs of removing arsenic from drink-ing water. EPA continues to research the health effects of low levels of arsenic, which is an element known to cause cancer in humans at high concentrations and is linked to other health effects such as skin damage and circulatory problems.
DEFINITIONSAction Level - The concentration of a contaminant which, if exceeded, trig-gers treatment or other requirements that a water system must follow.
Maximum Contaminant Level (MCL) - The highest level of a contaminant that is allowed in drinking water. MCLs are set as close to maximum contaminant level goals as feasible using the best available treatment technology.
Maximum Contaminant Level Goal (MCLG) - The level of a contaminant in drinking water below which there is no known or expected risk to health. MCLGs allow for a margin of safety.
Maximum Residual Disinfectant Level (MRDL) - The highest level of a disinfectant allowed in drinking water. There is convincing evidence that addi-tion of a disinfectant is necessary for control of microbial contaminants.
Maximum Residual Disinfectant Level Goal (MRDLG) - The level of a drinking water disinfectant below which there is no known or expected risk to health. MRDLGs do not reflect the ben-efits of the use of disinfectants to control microbial contaminants.
Location Running Annual Average (LRAA) - The average of sample ana-lytical results for samples taken at a particular monitoring location during the previous four calendar quarters.
N/A - not applicable
Nephelometric Turbidity Unit (NTU) - A measure of turbidity (cloudiness).
Parts per Billion (ppb) - or micrograms per liter. An example of one part per bil-lion is one packet of artificial sweetener sprinkled into an Olympic-sized swim-ming pool full of water.
Parts per Million (ppm) - or milligrams per liter. An example of one part per million is one packet of artificial sweet-ener sprinkled into 250 gallons of water.
Picocuries per liter (pCi/L) - A mea-sure of radioactivity.
Treatment Technique - A required pro-cess intended to reduce the level of a contaminant in drinking water.
Unregulated Contaminants - Those contaminants for which EPA has not established drinking water standards. The purpose of unregulated contaminant monitoring is to assist EPA in determin-ing the occurrence of unregulated con-taminants in drinking water and whether future regulation is warranted.
(1) Eight samples were found to be above the action level for lead. Some samples were collected in error when sampled at the wrong location; El Paso Water is working with the Texas Commission on Environmental Quality to have these samples recollected and reanalyzed to report these results.(2) Total Coliform MCL: 5% of monthly samples are positive; Fecal Coliform or E. coli MCL: A routine sample and a repeat sample are total coliform positive, and one is also fecal coliform or E. coli positive.
Treatment Technique
System in compliance, yearlyremoval ratio is 1.00 or greater
Information About LeadIf present, elevated levels of lead can cause serious health problems, especially for pregnant women and young children. Lead in drinking water is primarily from materi-als and components associated with sevice lines and home plumbing. El Paso Water is responsible for providing high quality drinking water but cannot control the variety of materials used in plumbing components. When your water has been sitting for several hours, you can minimize the potential for lead exposure by flushing your tap for 30 seconds to two minutes before using water for drinking or cooking. If you are concerned about lead in your water, consider having your water tested. Information on lead in drinking water, testing methods and steps you can take to minimize exposure is available from the Safe Drinking Water Hotline or at www.epa.gov/safewater/lead or call the Water Quality Laboratory at 915-594-5733.

En este informe anual que exige la Agencia de Protección Ambiental de los Estados Unidos (EPA, por sus siglas en inglés) se describe el origen y la calidad del agua potable que consumimos, así como los esfuerzos que se realizan para garantizar que haya un suministro de agua de alta calidad. Nuestra agua se analiza para detectar sustancias potencialmente nocivas y se somete a un proceso de depuración intensiva antes de entregarla a la comunidad. Gracias a la optimización de los métodos de tratamiento y los cada vez más sofisticados instrumentos de labora-torio, la calidad del agua de El Paso está mejor que nunca.
Las fuentes de las que se obtiene el agua que sale de la llave y el agua embotellada son ríos, lagos, arroyos, lagunas, embalses, manantiales y pozos. Cuando el agua recorre la superficie de la tierra o pasa por el suelo, va disolviendo minerales de origen natural y puede recoger sustancias derivadas de la presencia de animales o de actividades humanas.
Algunos de los contaminantes que pueden estarpresentes en las fuentes de suministro de agua son: • Contaminantes microbianos, como los virus y las bac-
terias, que pueden provenir de las plantas de tratamiento de aguas residuales, de los sistemas sépticos, de las opera-ciones agropecuarias y de los animales silvestres.
• Contaminantes inorgánicos, como sales y metales, que pueden presentarse en forma natural o a consecuencia del escurrimiento del drenaje pluvial urbano, de las descargas de aguas residuales industriales o domésticas, de la producción de aceite y gas, de la minería o de la agricultura.
• Plaguicidas y herbicidas, que pueden provenir de fuentes como la agricultura, los escurrimientos de aguas pluviales urbanas y las actividades de tipo domésti- co.
• Contaminantes químicos orgánicos, incluyendo compuestos orgánicos sintéti- cos y volátiles, que son subproductos de procesos industriales y de la producción de petróleo, y que también pueden provenir de estaciones de gasolina, escurrimientos del drenaje pluvial urbano y de los sistemas sépticos. • Contaminantes radioactivos, que pueden presentarse en la naturaleza o pueden ser resultado de las actividades de minería y de la producción de aceite y gas.
Con el fin de asegurar que el agua de la llave sea segura para beber, la EPA establece normas que limitan la cantidad de ciertos contaminantes en el agua que suministran los organismos operadores de servicios públicos. La normatividad de la Dirección de Control de Alimentos y Fármacos (FDA, por sus siglas en inglés) establece el mismo tipo de límites para los contaminantes en el agua embotellada, con el fin de prote-
ger la salud pública. De manera razonable se puede prever que el agua potable, incluyendo el agua embotellada, contenga al menos pequeñas cantidades
de algunos contaminantes, pero no significa necesariamente que el agua represente un riesgo para la salud. En el agua potable a veces
se encuentran contaminantes que pueden causar problemas de sabor, color y olor; sin embargo, estos tipos de elementos no
necesariamente provocan problemas de salud. Para obtener más información sobre el sabor, olor o color que debe tener el agua potable, por favor llame al 915-594-5733.
Se puede obtener más información sobre los contami-nantes y sus posibles efectos en la salud llamando a la línea de Agua Potable Segura de la EPA al (800-426-4791).
Información adicional sobre salud Hay personas que son más vulnerables que la población
en general a ciertos contaminantes microbianos que se en-cuentran en el agua potable, como el patógeno Cryptospo-
ridium. Los bebés, algunos ancianos o las personas con sistemas inmunológicos comprometidos, como las que se están sometiendo a
quimioterapia contra el cáncer, quienes han recibido transplantes de órganos, quienes reciben tratamiento con esteroides y las personas con VIH/SIDA u otros trastornos del sistema inmunológico, pueden sufrir un mayor riesgo de contraer infecciones. Si usted pertenece a alguno de estos grupos debe consultar a su médico o proveedor de servicios de salud sobre el consumo de agua potable. Para más orientación sobre las medidas que deben tomarse para reducir el ries-go de contraer una infección por Cryptosporidium llame a la línea telefónica de Agua Potable Segura [Safe Drinking Water Hotline] al 800-426-4791.
Tomamos en serio la calidad del agua
El agua que surtimos a nuestros clientes proviene de tres fuentes: una fuente superficial y dos fuentes subterráneas. La fuente superficial es el Rio Grande. Las fuentes de agua subterránea son los acuíferos del Bolsón de Mesilla y del Bolsón de Hueco. Aunque algunos clientes reciben agua proveniente de una sola fuente, la mayoría la recibe de dos fuentes distintas, dependiendo de la temporada del año.
Nuestras plantas potabilizan el agua hasta llevarla a un nivel de seguridad muy superior al requerido por la normatividad de la EPA. El Paso Water da tratamiento constantemente al agua superficial a un nivel de 0.1 UNT, medido inmediatamente después de que el agua ha pasado a través de cada filtro. Este es un nivel considerablemente mejor que las 0.3 UNT que exigen las normas.
El Paso Water sirve a clientes dentro y fuera de los límites de la ciudad. Proporcionamos servicio de agua al menudeo a los clientes de la ciudad de El Paso, Westway y Canutillo. También proporcionamos servicio al mayoreo a varias comu-nidades en el condado de El Paso.
Evaluación de la fuente de suministro de agua La Comisión de Calidad Ambiental de Texas realizó en el 2003 una evaluación de las fuentes de suministro de agua para El Paso Water. Debido a la complicada naturaleza de las fuentes subterráneas de agua de El Paso, existen algunas sus-ceptibilidades, pero la profundidad del agua subterránea es
un factor mitigante. Dado que el suministro de agua superfi-cial proviene de estados que se encuentran corriente arriba, y como una gran variedad de usuarios de tipo agrícola y munic-ipal descargan sus aguas hacia el Río Bravo, el suministro de agua superficial es sumamente susceptible. Sin embargo, las plantas potabilizadoras de El Paso están diseñadas para mini-mizar esos efectos.
Nota a los consumidores: Los consumidores de agua de los Distritos de Lower Valley [Valle Bajo], Paseo Del Este MUD, Gaslight Square MHP, County-East Montana, Haciendas del Norte, San Ysidro MHP, Freeport McMoran, Universal Church Windmere, Fort Bliss Main Post Area, East Biggs y Arvey Park reciben agua del sistema de distribución de EPWater, por lo cual la calidad del agua que reciben es igual a la que se describe en este informe. Fort Bliss, pueden recibir una parte o la totalidad del agua que consumen del sistema de distribución de El Paso Water, pero también de otras fuentes que no se mencionan en este informe. Sírvase comunicarse con su proveedor de agua pota-ble para obtener más información al respecto.
Oficina principal1154 Hawkins Blvd. El Paso, TX 79925epwater.org
Centro de atención al cliente6400 Boeing DriveEl Paso, TX 79925(915) 594-5500
Public Service Board Reunión el 2º miércoles de cada mes Oficina principal, 4º piso
Para obtener más información acerca de la calidad del agua o una copia de este informe llame al:Laboratorio de Calidad del Agua
¿De dónde proviene nuestra agua?
Sirviendo agua en y para El Paso
Clientes Al Menudeo 88.57%
Clientes Al Mayoreo 11.43%
E l P a s o W a t e r
Reporte de Calidad del Agua 2019

ANÁLISIS DEL AGUA POTABLE
Sobre los efectos en la salud
Turbiedad (NTU) - La turbiedad no provoca ningún efecto sobre la salud. Sin embargo, puede interferir con la desin-fección y servir como medio para el crecimiento de los microbios.
Arsénico (ppb) - Aunque el agua potable que usted recibe cumple con las normas sobre arsénico de la EPA, sí contiene bajos niveles de este elemento. La norma estable-cida por la EPA pretende equilibrar lo que se sabe actualmente sobre los posibles efectos del arsénico en la salud, con el costo de elim-inarlo del agua potable. La EPA continúa investigando que efectos tiene el arsénico en un nivel bajo, ya que se sabe que este miner-al, en altas concentraciones, puede provocar cáncer en los seres humanos, y está relacio-nado con otros problemas de salud como daños a la piel y problemas circulatorios.
DEFINICIONES(*Las siglas corresponden a la abreviatura en inglés)
Nivel de Acción – La concentración de un contaminante, que si se excede, genera la necesidad de establecer requisitos de tratamiento u otro requerimiento que el sistema de agua debe de sequir.
Nivel Máximo de Contaminante (MCL) – El nivel más alto de un contaminante que se permite en el agua potable. Los MCLs se establecen lo más cerca posible de las metas de contenido máximo de contaminantes, usando la mejor tecnología de tratamiento disponible.
Meta de Nivel Contaminante Maximo (MCLG) - El nivel de un contaminante en el agua potable, debajo del cual no se conocen o esperan riesgos para la salud. Los MCLGs permiten tener un margen de seguridad.
Nivel máximo de desinfectante residual (MRDL) - El nivel más alto de desinfec-
tante permitido en el agua potable. Existe evidencia convincente de que es necesario agregar un desinfectante para controlar los contaminantes microbianos.
Meta del nivel máximo de desinfectante residual (MRDLG) – El nivel de un desinfectante de agua potable por debajo del cual no se conoce ni se espera ningún riesgo para la salud. Las metas del nivel máximo de desinfectante residual no reflejan los beneficios del uso de desin-fectantes para controlar los contaminantes microbianos.
Promedio anual de funcionamiento por ubicación (LRAA) - El promedio de los resultados de los análisis de las muestras tomadas en una ubicación de monitoreo particular durante los cuatro trimestres anteriores.
N/A – no aplica
Unidad de turbulencia nefelométrica (NTU) – Una medida del nivel de turbu-lencia (nebulosidad).
Partes por Billón (ppb) – o microgramos por litro. Una parte por billón es igual a un sobrecito de endulzante artificial (sucaril) disuelto en una alberca olímpica.
Partes por Millón (ppm) – o miligramos por litro. Una parte por millón es igual a un sobrecito de endulzante artificial (sucaril) disueltoen 250 galones de agua.
Picocuries por Litro (pCi/L) – Una medida de radioactividad.
Técnica de Tratamiento – Un proceso requerido, cuyo propósito es reducir el nivel de un contaminante en el agua potable.
Contaminantes no regulados - Aquellos contaminantes sobre los cuales la EPA no ha establecido estándares para el agua potable. El propósito del monitoreo de contaminantes no regulados es ayudar a la EPA a determinar la incidencia de contam-inantes no regulados en el agua potable y si a futuro se requiere su regulación
(1) Se encontró que ocho muestras estaban por encima del nivel de acción del plomo. Algunas muestras se recolectaron por error cuando se tomaron muestras en la ubicación incorrecta. El Paso Water se está coordinando con la Comisión de Calidad Ambiental de Texas para que estas muestras se recojan y se vuelvan a analizar para reportar los resultados.(2) MCL de coliformes totales: 5% de las muestras mensuales son positivas; MCL de coliformes fecales o E. coli: Una muestra de rutina y una muestra repetida dieron resultado positivo en coliformes totales, y una también salió positiva en coliformes fecales o E. coli.
Sistema en cumplimiento, la tasa deeliminación anual es 1.00 o mayor
Número total demuestras positivas
de E. coli o coliformes fecales
Treatment Technique
INFORMACIÓN SOBRE EL PLOMO Si están presentes, los niveles elevados de plomo pueden causar serios problemas de salud, especialmente en mujeres embarazadas y niños pequeños. El plomo en el agua potable proviene principalmente de materiales y componentes asociados con las líneas de sevicio y plomería de su casa. EPWater es responsable de proporcionar agua potable de alta calidad, pero no puede controlar la variedad de materiales utilizados en los componentes de plomería. Cuando el agua ha estado en reposo durante varias horas usted puede minimizar la probabilidad de exposición al plomo dejando correr el agua de 30 segundos a dos minutos antes de usar el agua para beber o cocinar. Si usted está preocupado por el plomo en su agua, es posible que desee analizar el agua. Información sobre el plomo en el agua potable, métodos de prueba y los pasos que puede tomar para minimizar la exposición es la forma disponible la línea directa de Agua Potable Segura o en http://www.epa.gov/safewater/lead o llamar el Laboratorio de Calidad del Agua 594-5733.
Substancis Unidad Año de Rango de Nivel MCL MCLG Violación Posible Fuente Prueba las Muestras Promedio Contaminantes InorganicosArsénico ppb 2019 0 - 14 4.8 10 0 No Desgaste de depósitos naturalesBario ppm 2019 0.017 - 0.013 0.08 2 2 No Desgaste de depósitos naturalesCromo ppb 2019 0 - 6 2.3 100 100 No Desgaste de depósitos naturalesFluoruro ppm 2019 0.13 - 0.65 0.44 4 4 No Desgaste de depósitos naturalesNitrato como Nitrógeno ppm 2019 0 - 2.3 0.77 10 10 No Deslize por uso de fertilizantesNitrito como Nitrógeno ppm 2019 0 - 0.09 0.03 10 10 No Deslize por uso de fertilizantesContaminantes Radioactivos Alfa Gruesa Ajustada, pCi/L 2019 3.0 - 3.0 3.0 15 0 No Desgaste de depósitos naturales excluyendo radón y uranioUranio ppb 2019 2.5 - 2.5 2.5 30 0 No Desgaste de depósitos naturalesSubproductos de la Desinfección Bromato ppb 2019 0 - 4 1.33 10 0 No Sub-producto de la desinfección del agua potableClorito ppm 2019 0 - 0.0199 0 0003 1 0.8 No Sub-producto de la desinfección del agua potableContaminantes Orgánicos VolátilesXilenos totales ppb 2019 0 - 1.38 0.000 10000 10000 No Descarga de fábricas de hule y productos químicosContaminantes no ReguladosCloroformo ppb 2019 0 - 60.5 4.14 N/A 70 N/A Sub-producto de la desinfección del agua potableBromoformo ppb 2019 0 - 28.7 1.76 N/A 0 N/A Sub-producto de la desinfección del agua potableBromodiclorometano ppb 2019 0 - 30.6 3.17 N/A 0 N/A Sub-producto de la desinfección del agua potableDibromoclorometano ppb 2019 0 - 17.7 3.11 N/A 60 N/A Sub-producto de la desinfección del agua potablePlomo y Cobre Unidad Año de Rango de Percentil Nivel de MCLG Violación Posible Fuente Prueba las Muestras 90 AcciónCobre ppm 2019 0.006 - 0.55 0.24 1.3 1.3 No Corrosión de tuberías domésticasPlomo ppb 2019 0 - 84 (1) 10 15 0 No Corrosión de tuberías domésticasSubproductors de la Unidad Año de Rango de LRAA MCL MCLG Violación Posible FuenteDesinfección Prueba las Muestras más altoTotal de Ácidos Haloacéticos (THAA) ppb 2019 0.0 - 37.4 16.9 60 N/A No Sub-producto de la desinfección del agua potableTotal de Trihalometanos (TTHM) ppb 2019 0.0 - 110 48.3 80 N/A No Sub-producto de la desinfección del agua potableResiduo Desinfección Unidad Año de Rango de Nivel MRDL MRDLG Violación Posible Fuente Prueba las Muestras PromedioCloro ppm 2019 1.47 - 2.2 1.76 4 4 No Aditivo para controlar los microbios en el aguaDióxido de Cloro ppb 2019 0 - 0 0 800 800 No Aditivo para controlar los microbios en el agua Carbono Orgánico Total Año de Rango de Nivel Técnica de tratamiento Posible Fuente Prueba las Muestras Promedio(Proporción de Eliminación) 2019 1.19 - 2.67 1.77 Presente en el medio ambiente
Bacterias Coliformes Unidad Ano de Mayor MCL MCLG Violación Posible Fuente Prueba Número de Positivos Coliformes totales % 2019 0.4 N/A Ver abajo (2) 0 No Presente en el medio ambiente Coliformes fecales o E. coli 2019 N/A 0 Ver abajo (2) 0 No Presente en el medio ambiente
Turbidez Units Año de Nivel Límite Violación Posible Fuente Prueba detectado (técnica de tratamiento) Medida individual más alta NTU 2019 0.28 1 No Deslice de suelo % mensual más bajo que cumple con el límite NTU 2019 100% 0.30 No Deslice de suelo