el-nakheil oil shale: material … · shale, duwi formation, quseir variegated shale and nubia...
TRANSCRIPT

Oil Shale, 2011, Vol. 28, No. 4, pp. 528–547 ISSN 0208-189X doi: 10.3176/oil.2011.4.06 © 2011 Estonian Academy Publishers
EL-NAKHEIL OIL SHALE: MATERIAL CHARACTERIZATION AND EFFECT OF ACID LEACHING
A. F. MUHAMMAD(a)*, M. S. EL SALMAWY(a), A. M. ABDELAALA(a), S. SAMEAH(b) (a) Mining Engineering Department, Faculty of Petroleum and Mining Engineering,
Suez Canal University, Egypt (b) The Egyptian Mineral Resources Authority, Cairo, Egypt
The ever increasing demand for energy and the progressive depletion of crude oil resources, have renewed interest in oil shale as an alternative fuel resource. Weathered oil shale samples were assembled from El-Nakheil phosphate mine in Quseir area, Eastern desert, Egypt. The oil shale samples were prepared and analyzed by XRD (X-ray diffraction), XRF (X-ray flourescence spectrometry), and optical microscopic techniques. Rock-Eval pyrolysis and total organic carbon were used to study shale hydrocarbon potential. A leaching procedure using inorganic and organic acids was used to selectively dissolve the oil shale associated ash forming minerals. XRD results showed that calcite is the dominant carbonate mineral, whereas primary silicate minerals are quartz and montmorillonite. SEM (Scanning Electron Microscopy) observations indicated that the organic matter is dispersed throughout the rock matrix. The acid soluble fraction upon leaching was determined to be 37.59 and 42.74 wt% by using 5% HCl and 10% HCl, respectively. The TOC has been increased from 20.78 to 29.88 and 34.09 wt% by using 5% HCl and 10% HCl, respectively.
Background
It is generally agreed that worldwide petroleum supply will eventually reach its productive limit. It is a reasonable course for the energy industries and governmental agencies to renew interest in oil shale as an alternative promising source of oil or solid fuel supplement.
The term ‘‘oil shale’’ does not have a definite geological definition nor a specific chemical formula, but is a general term used for usually fine-grained sedimentary rocks containing organic matter that yield significant amounts of shale oil upon pyrolysis [1–2]. Lithologically, oil shale covers a broad range of rocks from shales to marl and carbonates, which consist of * Corresponding author: e-mail [email protected]

El-Nakheil Oil Shale: Material Characterization and Effect of Acid Leaching
529
a mixture of tightly bound organic and inorganic materials [3]. Most of the organic matter is in the form of kerogen, which is insoluble in ordinary organic solvents. Some of the organic matter is bitumen that is soluble in organic solvents [2].
Black shale is widely distributed in Egypt in several horizons of different geologic ages. The discovery of oil shale in Egypt was reported by Said’s [4] statement according to which black shale from Duwi mine close to Quseir caught fire. It is difficult to give the true figure of exact areas that this combustible material occupies. A useful criterion for a rough estimation is “where phosphate deposits can be found; combustible shale accompanies” [5]. The phosphate belt is well developed in three regions, namely, the Quseir-Safaga region (along the Red Sea coast), the Idfu region (along the Nile Valley), and the Kharga-Dakhla region in the western desert, (Abu-Tartur area) [6–7]. Black shale also occurs in the area of Abu-Zinema in Southwest Sinai and the area of Al-Maghara coal mine, North Sinai [8–9].
Geologically and stratigraphically the Abu-Tartur area, Esna-Idfu region (Nile Valley) and Qusier area have similar sedimentary successions [4, 8]. According to Said [4], the succession is as follows from top to bottom: Nakheil Formation, Thebes Formation, Esna Shale, Tarawan Chalk, Dakhla Shale, Duwi Formation, Quseir Variegated Shale and Nubia Sandstone. A notable feature of the Qusier, lower Dakhla and the intervening Duwi formations is the presence of black (oil) shale within and above the phosphatic beds. These shales are rich in organic matter [4-5, 7, 10–11]. The oil shale of El-Nakheil phosphate mine in Quseir area is the most enriched in organic matter [11].
It was impossible to estimate precisely the real oil shale potential of Egypt as long as unweathered or fresh samples were not available. However, the Red Sea area (Safaga – Quseir) was estimated to have about 4.5 billion barrels of in-place shale oil and that in the Western Desert, the Abu Tartour area contained about 1.2 billion barrels [12]. A research project was conducted by the Egyptian Geological Survey and Mining Authority during 1994-1998 on the availability of oil shale in Egypt. 15 billion tonnes of oil shale could be estimated in the Quseir mines [7].
Many authors have attempted to provide some information on geology and sedimentology of black and carbonaceous shale in Egypt [6, 10, 12–13]. Black shale in Egypt was also studied petrographically, mineralogically and geochemically by many workers [11, 14–16]. Little work was found concerning beneficiation of the Egyptian oil shale into a concentrate [5].
The present work is part of an ongoing research program to perform an integrated characterization relevant to beneficiation of oil shale samples assembled from El-Nakheil phosphate mine in Quseir area, and to study the beneficiation potential of these oil shale samples. The characterization work was intended to evaluate the features that would influence the yield of oil and the relevant possible cleaning processes, and provide a better framework for future economic assessments.

A. F. Muhammad et al.
530
Experimental
The Experimental work, unless otherwise stated, was conducted in the mineral processing laboratory of the Faculty of Petroleum and Mining Engineering, Suez Canal University, Egypt. Material characterization and hydrocarbon potential
Material
Oil shale samples were obtained from El-Nakheil phosphate mine in Qusier area that is a region of the Eastern Desert of Egypt near the Red Sea Coast. It is worth mentioning that obtaining fresh samples was impossible, because the phosphate mines where the exposure of the shale deposits could be found were closed. Weathered samples were obtained from shale stocks stored in the mine area, formerly produced as tailings or waste materials while phosphate mining was taking place.
El-Nakheil oil shale is thinly laminated, fissile, and very fine grained to cryptocrystalline, exhibiting obvious lamination and of dark brownish black color. It is rich in organic matter as indicated by distinctive oily odor and easy ignition on heating. The samples are characterized by the presence of disseminated chalk particles of maximum 3 mm in accordance with the description of Abdelrahman and Khaled [5]. Fossil remains that are highly reactive with dilute HCl are also observed. Representative portions of the oil shale samples were ground to less than about 63 µm using a laboratory gyro-mill (Glen Creston limited, England), and retained for different analyses. Distilled water was used for solution preparation and washing throughout the experimental work.
X-ray diffraction (XRD)
X-ray diffractometry was used for identification of the minerals composing the oil shale material. The bulk sample was digested with hydrogen peroxide (H2O2) for semi-quantitative determination of the organic matter. Digestion involved continual additions of concentrated hydrogen peroxide to a known weight of the sample until sample frothing ceased. Then the sample was dried and weighed. Organic matter was determined by gravimetric determination of sample weight loss. The hydrogen peroxide digested bulk sample was analyzed using Bruker AXS: D8 ADVANCE diffractometer. Scans were run at room temperature from 4° to 60° 2θ, with 0.02° step and 0.4 second step time. The proportions of the minerals composing the sample were semi-quantitatively calculated using the instrument software. X-ray fluorescence spectrometry (XRF)
X-ray fluorescence spectrometry was used to identify the major components of the oil shale samples. The bulk sample was calcined at 1000 °C, and

El-Nakheil Oil Shale: Material Characterization and Effect of Acid Leaching
531
analyzed using a Philips PW 1410 X-ray fluorescence spectrometer system. The proportions of the elements were calculated using the instrument soft-ware. Optical microscopy
Observation of thin sections for the El-Nakheil oil shale samples was carried out in transmitted light using a Zeiss polarizing microscope, with an attached computer program (Olympus analysis digital image solution 5).
The XRD, XRF, and optical microscopy were conducted at the Egyptian Central Metallurgical Research and Development Institute (CMRDI).
Rock-Eval pyrolysis and total organic carbon (TOC)
Bulk sample was analyzed by a TOC module-equipped Rock-Eval 6 type instrument to determine the organic potential and thermal maturity of the source rock. Rock-Eval pyrolysis and analyses of total organic carbon were conducted in the organic geochemistry laboratory at the Egyptian Petroleum Research Institute (EPRI). Samples were pyrolyzed at 300 °C for 3–4 min, followed by a programmed pyrolysis at 25 °C per min to 650 °C, both con-ducted in nitrogen atmosphere. The rock Eval 6 provides several measure-ments. A flame ionization detector (FID) senses any organic compounds generated during pyrolysis. Released CO and CO2 are monitored by means of an infra-red cell (IR) during pyrolysis and combustion. A thermocouple is used to measure the temperature during pyrolysis. Measured parameters include the presence of free hydrocarbons S1 (mg HC/g rock), the hydro-carbon generation potential of the rock, S2 (mg HC/g rock), the amount of carbon dioxide evolved during pyrolysis, S3 (mg CO2/g rock), temperature at which the maximum rate of S2 hydrocarbon evolution takes place, Tmax (°C), and the total organic carbon content, TOC (wt%). Several additional parameters including Hydrogen Index (HI) corresponding to the quantity of pyrolyzable hydrocarbons relative to the total organic carbon in the sample (S2/TOC·100), Oxygen Index (OI), which corresponds to the quantity of carbon dioxide formed from pyrolyzable organic compounds relative to the total organic carbon of (S3/TOC·100), and Production Index (PI), which is defined as the ratio (S1/(S1+S2)) were calculated from these measured values. Scanning Electron Microscopy (SEM)
Scanning electron microscopy for a polished section of the oil shale sample was conducted using JOEL scanning electron microscope model JSM-5410 equipped with an EDX unit (Energy-dispersive X-ray spectroscopy) at an accelerating voltage of 30kV. These measurements were conducted in the labs of the National Research Center, Egypt.
A. F. Muhammad et al.
532
Proximate and ultimate analysis
Proximate and ultimate analyses for the bulk sample were conducted in the central chemical laboratories of the Egyptian Electricity Holding Company. Analytical methods followed the American Society for Testing and Materials standards for coal analyses (ASTM D-5373, ASTM D-1552, ASTM D-3174, ASTM D-3175, and ASTM D3173). Ash content and combustible recovery
One gram of oil shale was placed inside a silica crucible (diameter is 5 cm) and placed in a muffle furnace (MLW Veb Elektro, Bad Frankenhausen, Germany). The temperature was raised slowly to 750 ºC. The sample was maintained at this temperature for one hour where constant weight was obtained. The residue was cooled and then weighed. The ash content is the mass of ash expressed as a percentage of the initial samples weight taken. Low temperature ashing was also conducted with the same procedure at 500 ºC for 90 min. Bitumen removal
Bitumen was extracted using a Soxhlet extractor charged with 350 ml of chloroform for 72 h. The extraction process continued till the solvent in the Soxhlet arm became colourless. Bitumen-free oil shale was then dried and weighed. The extractable dissolved organic matter was determined by weight loss percentage. Acid Digestion
The inorganic mineral matrix of El-Nakheil oil shale, in which the desired organic materials are trapped, is composed primarily of carbonates. The dominant carbonate mineral is calcite and dolomite may exist in trace amounts. Acid treatment of the oil shale material would digest the carbonate minerals and yield in a concentrate of combustible matter. Chemicals
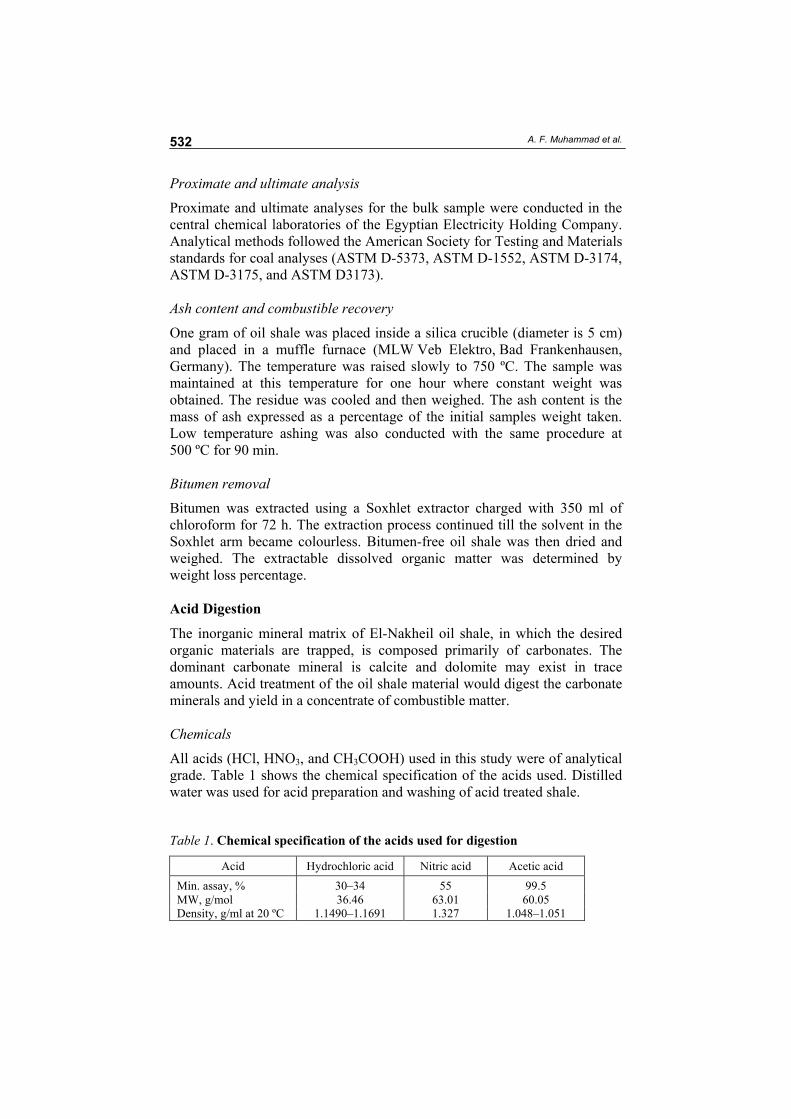
All acids (HCl, HNO3, and CH3COOH) used in this study were of analytical grade. Table 1 shows the chemical specification of the acids used. Distilled water was used for acid preparation and washing of acid treated shale.
Table 1. Chemical specification of the acids used for digestion
Acid Hydrochloric acid Nitric acid Acetic acid
Min. assay, % 30–34 55 99.5 MW, g/mol 36.46 63.01 60.05 Density, g/ml at 20 ºC 1.1490–1.1691 1.327 1.048–1.051

El-Nakheil Oil Shale: Material Characterization and Effect of Acid Leaching
533
Equipment and procedure
Preliminary acid leaching tests were conducted using 5% HCl to determine the optimum particle size fraction and sample dosage for acid leaching. A leaching procedure was conducted using inorganic and organic acids includ-ing HCl, HNO3, and CH3COOH acid with concentrations of 5, 10 and 20%, respectively. The mixing was done using Clifton Hotplate magnetic stirrer until boiling was attained. The mixture was filtered using a laboratory vacuum pump (Telstar Company) and then washed with excess amount of distilled water to remove acid residues. The solid residue was dried for 36 h at a tem-perature of 75 °C to remove moisture using Function Line drying oven and retained for analysis.
Results and discussions Mineralogy
The oil shale is a complex mixture of organic and mineral substances form-ing a very hard and nonporous material. The presence of organic material in the shale matrix acts as a binding material giving the matrix its resilience and toughness. The organic portion of the oil shale sample was semi-quanti-tatively determined using H2O2 digestion and found to be 21 wt%. The XRD pattern for the H2O2 digested oil shale sample is shown in Fig. 1. Figure 1 illustrates the major minerals composing the bulk sample of El-Nakheil oil shale. Calcite is the dominant carbonate mineral, whereas primary silicate minerals are quartz and montmorillonite. Fluorapatite was also identified. The organic matter can be divided into kerogen and bitumen. The bitumen can be extracted from the oil shale using organic solvents. Bitumen repre-
Fig. 1. XRD pattern of the H2O2 digested oil shale sample.

A. F. Muhammad et al.
534
sented 2 wt% of the sample. The relative proportions of all these components are given in Table 2. As seen from this table, the major inorganic constituent in El-Nakheil oil shale is calcite (about 70% of the inorganic matrix). Similar mineral composition has been reported by some other authors [17–18].
Table 2. Average semi-quantitative mineral composition of El-Nakheil oil shale sample
Composition Weight % Organic portion 21 Inorganic portion 79 Total 100
Composition of inorganic portion Weight % Calcite 70 Quartz 12.2 Fluorapatite 9.1 Montmorillonite 8.8 Total 100
Chemical composition
The proportions of major elements in the samples analyzed by XRF and expressed as the relevant oxides are given in Table 3. Table 3 indicates that the loss on ignition (L.O.I.) of the oil shale sample was 41.1%. This weight loss is attributed to proportions of CO2 and H2O, issued by decomposition of the carbonate and clay minerals, respectively, in addition to the percentage of organic carbon. Major oxides of silica, alumina and calcium reflect the composition of the oil shale sample detected by the XRD. Presence of sodium, potassium, magnesium and iron oxides reflect the contribution of clay minerals, possible iron oxides, and perhaps minor dolomite.
Table 3. Chemical composition of El-Nakheil oil shale sample
Phase SiO2 CaO TiO2 Al2O3 K2O SO3 Fe2O3 MgO Na2O P2O5 L.O.I. Wt% 21.49 21.05 0.18 5.8 0.72 1.76 1.24 1.61 0.61 4.45 41.1
Proximate and ultimate analysis
Table 4 shows the proximate and ultimate analysis of El-Nakheil oil shale (as received basis). One can see that El-Nakheil oil shale is a low grade fuel with high content of ash and volatiles. It was found that most of the organic carbon is in the form of volatile matter (40.73%) whereas the fixed carbon represents a very small portion of the organic carbon (0.7%). The Gross calorific value obtained was about 2360 kcal/kg indicating higher calorific value if the shales were used for direct burning in power plants. Higher sulphur content could be attributed to sulphur bearing minerals such as pyrite, or to organic sulphur. Mohamed et al. [7] reported similar results.

El-Nakheil Oil Shale: Material Characterization and Effect of Acid Leaching
535
These results indicate some similarities to that of El-Lajjun deposit, which is considered to be the largest deposit in Jordan [19].
Table 4. Proximate Analysis and Ultimate Analysis of El-Nakheil oil shale sample (as-received basis)
Proximate Analysis Wt% Ultimate Analysis Wt% Total Sulphur 4.13 Gross calorific value
(kcal/kg) 2360 Total Hydrogen 2.92 Moisture 1.24 Total Nitrogen 0.03 Volatile matter 40.73 Total Oxygen* 11.16 Fixed carbon* 0.70 Total Carbon 24.43 Ash 57.33 Ash 57.33 Total 100.00 Total 100.00
* By difference Microscopic studies
Observations of El-Nakheil oil shale thin section have given a description of oil shale sample mineralogy and nature of kerogen distribution. Thin section observations are indicated in Fig. 2 (a, b, c, d, e, and f). The shale matrix is composed of alternating dark and light lamina. The lamination is mostly flat but sometimes undulant and distorted around tests and detrital grains. The thickness of the alternating lamina ranges between 20–30 µm.
The light lamina are comprised of carbonate lamina and nodules. Carbonates consist of finely precipitated materials and small particles of organically fixed carbonate. The size of the nodules ranges from 80 to 110 µm for small nodules (Fig. 2a) and 220 µm for larger ones (Fig. 2f). The dark lamina consisted mainly of argillaceous material that is rich in organic matter.
Quartz occurs as very fine angular grains. Many small planktonic fora-minifera were observed; their chambers were filled with calcite whereas some other tests showed that they were totally empty. The whole matrix was stained with hematite (Fig. 2d).
Kerogen is homogeneously distributed through the shale matrix and is lining the walls of calcite nodules. Kerogen particle size was measured and found to be less than 6 µm (Fig. 2d, e, and f). Calcite nodules were observed as being covered or wetted by organic matter (Fig. 2b and c). This will make the upgrade potential of the oil shale material challenging as the matrix seems homogeneous and kerogen is uniformly disseminated within the bulk material.
Scanning electron microscopy (SEM)
Table 5 shows the elemental composition of the studied oil shale samples. The electron microprobe equipped with an energy dispersive x-ray (EDX) unit was used to produce two-dimensional images for the elemental distribu-tion of a polished section of El-Nakheil oil shale. Fig. 3 indicates the relative percentage of the elements composing the oil shale sample. The map is

A. F. Muhammad et al.
536
printed so that the dots are white on a dark background. Changes in the density of the dots indicate changes in the elemental concentration.
Fig. 2. Typical thin section observations of El-Nakheil oil shale.
Table 5. The elemental composition as determined by EDX of El-Nakheil oil shale sample
Element C O Ca Si P S Al Wt% 40.50 30.48 12.59 5.39 4.46 2.16 1.45
Element F Fe Mg K Cr V Wt% 1.37 0.64 0.31 0.31 0.18 0.17
(b)(a)
(d)(c)
(f)(e)

El-Nakheil Oil Shale: Material Characterization and Effect of Acid Leaching
537
Inspection of Fig. 3 shows that some elements are uniformly distributed in the oil shale matrix, some of them exist in minor concentrations, such as chromium, vanadium, potassium, iron, fluorine, sodium and magnesium. Other elements exist in higher concentrations such as carbon and oxygen. The elemental composition reflects the mineral composition previously determined by XRD. The higher density of dots of the phosphorus and calcium gives a reasonable outline of a crystal of fluorapatite. Quartz crystals are also identified by higher silicon distribution density through the matrix.
Fig. 3. SEM elemental mapping images of polished section of El-Nakheil oil shale.
90 µm
OMg
K
F
Cr V
Fe
Al C Ca
S Si P

A. F. Muhammad et al.
538
Low and high temperature ashing
High temperature ashing of oil shale conducted at 750 oC for 60 min is suit-able only for determination of the amount of ash remaining after complete combustion of the oil shale material. However, it is not suitable for determination of the upgrade potential of the combustible material contained in the oil shale matrix. El-Nakheil oil shale material is composed primarily of carbonates; the dominant carbonate mineral is calcite. Beneficiation may separate calcite either into the concentrate or into the reject. The decomposi-tion of the calcite during high temperature ashing would result in consider-able ash reduction that cannot be attributed to the enrichment of the organic matter and would lead to a misleading interpretation.
Preliminary experiments of calcium carbonates combustion at 750 oC for 60 min resulted in a weight loss of 59.3%, whereas low temperature combus-tion at 500 oC for 90 min resulted in less than 0.5% weight loss. This revealed that low temperature ashing at these conditions would avoid the decomposition of calcite. This would give more reasonable guidelines for evaluating the upgrade potential of the organic matter contained in the bulk sample. It was decided to use low temperature ashing side by side with high temperature ashing throughout this study.
Rock-Eval pyrolysis
Rock-Eval pyrolysis is used for rapid evaluation of hydrocarbon potential of a source rocks. It provides information about the quantity, type and thermal maturity of the associated organic matter [20]. Rock-Eval 6/TOC results for El-Nakheil oil shale sample are summarized in Table 6.
Table 6. Rock-Eval Pyrolysis and TOC for El-Nakheil oil shale sample
TOC, wt% 20.78 S1, mg HC/g rock 2.31 S2, mg HC/g rock 165.4 S3, mg HC/g rock 4.57 HI 608 OI 22 PI 0.01 Tmax, OC 418
Quantity of organic matter. The quantity of organic matter of the source rocks is usually estimated using the total organic carbon content (TOC, wt%). TOC is determined by direct combustion method: crushed samples are acid treated in a filtering crucible, combusted at about 1000 °C, and analyzed as carbon dioxide [20]. Comparable results can be obtained by using Rock-Eval pyrolysis. The Rock-Eval 6 determines the TOC by

El-Nakheil Oil Shale: Material Characterization and Effect of Acid Leaching
539
summing the carbon in pyrolyzate with that obtained by oxidizing the residual organic matter at 650 °C [21].
Table 7 and Table 8 show how TOC, S2 and hydrogen index (HI) are used to describe potential source rocks. El-Nakheil oil shale samples showed high TOC and S2 values of 20.78 wt% and 165.4 mg HC/g rock, respectively. According to the criterion given in Table 7, El-Nakheil oil shale samples showed a very good hydrocarbon generation potential. Wolela [22] mentioned that if S2 is more than 60 kg/tonne the rock is commercially exploitable.
Table 7. Geochemical parameters describing hydrocarbon generation potential of source rocks [9]
Quantity TOC, wt%
S1, mg HC/g
rock
S2, mg HC/g
rock Poor 0.5 0–0.5 0–2.5 Fair 0.5–1 0.5–1 2.5–5 Good 1–2 2 5–10 Very good 2+ 2+ 10+
Table 8. Geochemical parameters describing type of generated hydro-carbons [9]
Type HI, mg HC/gCorg S2/S3
Gas 0–150 0–3 Gas and oil 150–300 3–5 Oil 300+ 5+
Type of organic matter. The most common method of classifying the type of organic matter is the van Krevelen or atomic H/C versus O/C diagram. In this diagram different types of kerogen are identified: Type I (highly oil prone), Type II (oil prone), and Type III (gas prone). The thermal maturation of each type of kerogen is described by pathways; the most mature samples are near the lower left corner. Rock-Eval method can be used to derive the same information with no need for kerogen isola-tion [20].
El-Nakheil oil shale shows high hydrogen index HI (S2/TOC) of 608 as determined by Rock-Eval pyrolysis. According to the criterion given in El-Nakheil oil shale is oil source rock. Plot of hydrogen index HI versus oxygen index (OI) (Pseudo-van Krevelen diagram) based on Rock-Eval information is also commonly used to assess the kerogen type. The van Krevelen diagram for the bulk sample shown in Fig. 4 indicates that the analyzed bulk sample is of Type II kerogen.
Source rock maturity. The level of thermal maturation can be estimated based on Tmax and PI values. According to Peters [20], when PI is less than 0.1 and Tmax is less than 445 oC, this indicates immature source rock. El-Nakheil oil shale showed Tmax value of 418 °C and production index of 0.01. This indicates thermally immature organic matter. This conclusion regarding thermal maturity should be supported by additional geochemical analyses such as vitrinite reflectance or thermal alteration index [20].

A. F. Muhammad et al.
540
Fig. 4. van Krevelen plot of Rock-Eval data for the studied bulk sample.
Acid leaching
Preliminary acid leaching test results are shown in Fig. 5 and Fig. 6. Effect of particle size was investigated using different size fractions. The initial HCl concentration and the solid to acid ratio were kept constant at 5% and 1:4 (g/ml), respectively. Mixing continued till boiling was attained. Analysis of Fig. 5 shows that the particle size has a significant effect on the dis-solution of the carbonates contained in the bulk matrix of oil shale. The highest weight reduction (37.59%) was attained with the size fraction of –250 + 90 µm. The ash content of the product at 750 oC is 50.71%. This might be the size at which calcite nodules are exposed. The influence of the solid to acid ratio was also investigated. The size fraction –250 + 90 µm was used while keeping the acid (HCl) concentration at 5%. 5% HCl with a solid to acid ratio of 1:4 (g/ml) could dissolve up to 37.59% of the shale matrix (Fig. 6). Therefore, it was decided to perform the digestion procedure
Fig. 5. Effect of particle size on 5% HCl leaching using 1:4 solid to acid ratio.

El-Nakheil Oil Shale: Material Characterization and Effect of Acid Leaching
541
Fig. 6. Effect of solid to acid ratio on –250 + 90 µm size fraction acid leaching.
with 100 g of oil shale, with the –250 + 90 µm size fraction mixed with 400 ml of inorganic and organic acids including HCl, HNO3 and CH3COOH with concentrations of 5, 10 and 20%, respectively. Effect of HCl Leaching
Hydrochloric acid digestion of El-Nakheil oil shale was conducted using acid solutions with concentrations of 5, 10, and 20%. A comparison between the XRD patterns of the residue after digestion with HCl is shown in Fig. 7. Inspection of Fig. 7 shows that the peaks of calcite and fluroapatite disappear
Fig. 7. XRD patterns of oil shale residue after treatment with HCl solutions of various concentrations with semi-quantitative % of sample composing minerals.

A. F. Muhammad et al.
542
in the residue after treatment with 5% HCl solution. Quartz, clay minerals and organic matter remain unattacked in the residue.
Figure 8 indicates that the acid soluble fraction of the sample increases when HCl concentration increases. The ash content of the residue at 750 °C decreases to some extent with the increase of the acid concentration. How-ever the ash content at 500 °C shows a remarkable decrease with increasing the concentration of the acid. Figure 8 depicts that the acid soluble fraction after leaching with 5, 10 and 20% HCl was determined to be 37.59, 42.74 and 44 wt%, respectively.
Fig. 8. Ash and weight reduction percentage for oil shale residue after treatment with various acids.
Figure 9 illustrates the values of TOC, S1, S2, S3 of oil shale residue
determined by Rock-Eval pyrolysis techniques after treatment with various acids. The residue TOC and oil yield, S2 increases by increasing the HCl
Fig. 9. TOC, S1, S2 and S3 obtained by Rock-Eval 6 analysis for oil shale residue after treatment with various acids.

El-Nakheil Oil Shale: Material Characterization and Effect of Acid Leaching
543
concentration. The TOC was increased from 20.78 to 29.88, 34.39, and 34.39 wt% by using 5, 10 and 20% HCl, respectively. The oil yield from cracking of the kerogen was increased from 165.4 to 238.2, 266 and 268.2 (mg HC/g rock) by using 5, 10 and 20% HCl respectively. This result can be attributed to the fact that HCl reacts quickly with calcium carbonate that exists in abundant levels in El-Nakheil oil shale. Effect of HNO3 leaching
The XRD patterns of the residues after treatment with various concentrations of nitric acid are shown in Fig. 10. It is noted that, 10% HNO3 solution is enough to dissolve all fluorapatite present in the sample while 20% HNO3 solution was enough to dissolve almost all carbonates. Figure 10 indicates that the intensity of the calcite and fluoroapatite peaks decrease with the increase of concentrations of HNO3.
Fig. 10. XRD patterns of oil shale residue after treatment with HNO3 solutions of various concentrations with semi-quantitative % of sample composing minerals.
It can be seen from Fig. 8 that the acid soluble fraction increases while the ash percentage decreases with increasing acid concentration. The oil yield of the oil shale samples digested by nitric acid increased with the increase of acid concentration up to 10%. However, after the treatment with 20% HNO3 (Fig. 9), there was a drastic decrease in the oil yield and a sharp increase in S3. This could be explained by the fact that nitric acid is a strong oxidizing agent, which reacts with the kerogen, resulting in a non-condens-

A. F. Muhammad et al.
544
able lower molecular weight compounds that produce high amounts of gases during the Rock-Eval pyrolysis [23]. Effect of CH3COOH leaching
The XRD patterns of the residues after treatment with various concentrations of acetic acid are shown in Fig. 11. Fluorapatite was not dissolved with increasing acetic acid concentration. 20% CH3COOH was enough to dis-solve almost all carbonates. The acid soluble fraction of the sample increases with a decrease in the ash content as acetic acid concentration increases. However, acetic acid leaching produces the lowest value of TOC and oil yield (Fig. 9).
Comparing the ash content as an evaluation technique for the upgrade potential of the oil shale material with Rock-Eval pyrolysis, there was a significant increase in the TOC and oil yield with CH3COOH leaching. However, the ash content at 750 oC showed slight decrease from that of the bulk sample of maximum 1.5 % using 10 and 20% CH3COOH. On the other hand, 10% reduction of the ash content of the CH3COOH treated sample can be noticed at 500 °C. Low temperature ashing may give better guidelines for evaluating the upgrade potential particularly for oil shale having a con-siderable proportion of carbonate minerals.
Fig. 11. XRD patterns of oil shale residue after treatment with CH3COOH solutions of various concentrations with semi-quantitative % of sample composing minerals.

El-Nakheil Oil Shale: Material Characterization and Effect of Acid Leaching
545
Conclusions
1. The inorganic portion of El-Nakheil oil shale determined by XRD and XRF is composed primarily of carbonate minerals. The dominant carbonate mineral is calcite. Clay minerals are primary montmorillonite and kaolinite. Quartz, fluorapatite, hematite and pyrite were also identified. Some rare elements are uniformly distributed in minor con-centrations in the oil shale matrix (e.g. chromium and vanadium). The organic portion of the oil shale sample was determined semi-quantitatively and found to be 21 wt%. Bitumen represented 2 wt% of the bulk sample.
2. Thin section observations showed that kerogen is very finely dis-seminated throughout the shale matrix and was noticed lining the walls of calcite nodules with the particle size of less than 6 µm.
3. The proximate and ultimate analyses indicated that El-Nakheil weathered oil shale samples are a low grade fuel with high content of ash, volatile matter and sulphur. Most of the organic carbon is in the form of volatile matter (40.73%) whereas, the fixed carbon represents a very small portion of the organic carbon (0.7%). The Gross calorific value obtained was about 2360 kcal/kg. Total sulphur content was 4.13%.
4. Rock-Eval pyrolysis of El-Nakheil weathered oil shale samples showed a good hydrocarbon potential that is indicated by high TOC (20.78 wt%), high S2 (165.4 mg HC/g rock) and high HI (608). The organic matter is of Type II kerogen as indicated by modified van Krevelen. Tmax and PI indicated immature source rock.
5. Acid leaching of El-Nakheil weathered oil shale samples would open up potential for more future studies. The acid soluble fraction of the sample increases with a decrease in the ash content as acetic acid concentration increases. Acetic acid leaching produces the lowest value of TOC and oil yield.
• Calcite and fluorapatite disappeared from the residue after treat-ment with 5% HCl solution. The acid soluble fraction was determined to be 37.59 and 42.74 wt% by using 5 and 10% HCl, respectively. The TOC increased from 20.78 to 29.88 and 34.09 wt% by using 5 and 10% HCl, respectively.
• 10% HNO3 solution is enough to dissolve all fluorapatite present in the sample whereas 20% HNO3 solution was enough to dissolve almost all carbonates. There was a substantial decrease in the oil yield of S2 with higher HNO3 concentrations.
• Fluorapatite was not dissolved with increasing acetic acid con-centration. 20% CH3COOH solution was enough to dissolve almost all carbonates. Acetic acid produces the lowest value of TOC and oil yield when compared to HCl and HNO3 leaching.
6. Low temperature ashing at 500 oC for 90 min may give better guidelines for evaluating the upgrade potential of oil shale particularly those having

A. F. Muhammad et al.
546
a considerable proportion of calcite mineral. The decomposition of calcium carbonates will be avoided.
REFERENCES
1. Tissot, B. P., Welte, D. H. Petroleum Formation and Occurrence. 2nd ed. – Berlin: Springer-Verlag, 1984. xxi, 699 p.
2. Dyni, J. R. Geology and resources of some world oil-shale deposits // Oil Shale. 2003. Vol. 20, No. 3. P. 193–252.
3. Altun, N. E., Hicyilmaz, C., Hwang, J.-Y., Bagci, A. S., Kök, M. V. Oil shales in the world and Turkey; reserves, current situation and future prospects: a review // Oil Shale. 2006. Vol. 23, No. 3. P. 211–227.
4. Said, R. The Geology of Egypt. – New York: Elsevier, 1962. 5. Abdelrahman, A. A., Khaled, K. A. Preliminary evaluation of some black shales
of the Eastern Desert of Egypt // The 3rd Conference of Chemical Engineer-ing,TESCE. Cairo, 1988. P. 169–184.
6. Bock, W., Faatz, U., Ganz, H., Tröger, U. Phosphorites and oil shale of the eastern Sahara // Interim report 41. 1983, The Egyptian Geological Survey and Mining Authority. P. 1–12.
7. Mohamed, A., Naim, G. , Aziz, M., Atia, B. Strategic fuel of the future: using oil shale as a fuel for thermal power generation // World Energy Council, 18th congress, Buenos Aires, October 2001. P. 1–12.
8. Temraz, M. A. Mineralogical and Geochemical Studies of Carbonaceous Shale Deposits from Egypt. – Berlin: Ph.D., Technische Universität Berlin (Berlin Institute of Technology). 113 p.
9. Seifelassr, A. S., Abdelrahman, A. A., Elgibaly, A. A. Hydrocarbon potential of magharah coal measure shales // Journal of Engineering and Applied Sciences. Faculty of Engineering, Cairo University. 1993. Vol. 40, No. 4. P. 879–892.
10. Darwish, M. Optimistic hydrocarbon potentialities of the oil shales in the Quseir-Safaga land stretch, Egypt // Bulletin of the Faculty of Science, Zagazig University. 1984. Vol. 6, No. P. 107–117.
11. El Kammar, A. M., Darwish, M.M., Philip, G., El Kammar, M. M. Composition and origin of black shale from Quseir area, Red Sea coast, Egypt // Journal of University of Kuwait (Science). 1990. Vol. 17, P. 177–190.
12. Tröger, U. The oil shale potential of Egypt // Berliner Geowiss., Abh.(A) 1984. Vol. 50. P. 375–380.
13. Mustafa, A., Ghaly, E. L. Survey of Qusseir shales and other carbonaceous shales in Egypt. chemical and Engineering Data // J. Chem. Eng. Data. 1964. Vol. 9, No. 4. P. 557–567.
14. Khaled, K. A., Abdel Ghany, A. R., Abdelrahman, A. A., El Fadly, A. M. Laterial variation of the geochemical characteristics of some oil shale beds in Quseir-Safaga environs, Eastern Desert, Egypt // The Second Confernce on Mining, Petroleum and Metallurgical Engineering. – Suez: Suez Canal University, 1989.p. 105–119.
15. El Kammar, M. M. Stratigraphical and Mineralogical Studies on the Black Shale at Quseir Area, Red Sea Coast, Egypt. – 1987. M.Sc. Thesis, Cairo University, Egypt.

El-Nakheil Oil Shale: Material Characterization and Effect of Acid Leaching
547
16. El Kammar, M. M., Organic and inorganic components of the Upper Cretaceous-Lower Tertiary black shales from Egypt and their hydrocarbon potentialities. – 1993. Ph.D. Thesis, Faculty of Science, Cairo University, Egypt.
17. El-Sabagh, S. M., Basta, J. S., Ahmed, F. S., Barakat, M. A. Characterization of selected Egyptian oil shales from the Red Sea area: composition of inorganic matrix and potential of organic matters // Energ. Source. 2000. Vol. 22, No. 10. P. 901–911.
18. Al-Wakeel, M. I., El-Adly, R. A. A novel application of Egyptian oil shale as a filler in the production of lithium lubricating grease // Energ. Source. 2005. Vol. 27, No. 16. P. 1511–1522.
19. Al-Otoom, A. Y., Shawabkeh, R. A., Al-Harahsheh, A. M., Shawaqfeh, A. T. The chemistry of minerals obtained from the combustion of Jordanian oil shale // Energy. 2005. Vol. 30, No. 5. P. 611–619.
20. Peters, K. E., Guidelines for evaluating petroleum source rock using pro-grammed pyrolysis // AAPG Bull. 1986. Vol. 70, No. 3. P. 318–329.
21. Behar, F., Beaumont, V., De B. Penteado, H. L. Rock-Eval 6 technology: per-formances and developments // Oil Gas Sci. Technol. 2001. Vol. 56, No. 2. P. 111–134.
22. Wolela, A. Fossil fuel energy resources of Ethiopia: Oil shale deposits // J. Afr. Earth Sci. 2006. Vol. 46, No. 3. P. 263–280.
23. Al-Harahsheh, A., Al-Harahsheh, M., Al-Otoom, A., Allawzi, M., Effect of demineralization of El-lajjun Jordanian oil shale on oil yield // Fuel Process. Technol. 2009. Vol. 90, No. 6. P. 818–824.
Presented by J. Boak Received April 11, 2011