el dorado ounty redevelopment feasibility study …
TRANSCRIPT

EL DORADO COUNTY REDEVELOPMENT FEASIBILITY STUDY
County of El Dorado
December 2007

TABLE OF CONTENTS
I. INTRODUCTION .................................................................. 1 Purpose of the Study ............................................................................1 Approach to Selecting the Study Areas ................................................3 Contents of this Study Report ...............................................................3 II. MEETING THE REDEVELOPMENT REQUIREMENTS ......................4 Project Area Criteria..............................................................................4 Study Areas ..........................................................................................5 Existing Land Uses .............................................................................15 Historical Landmarks ..........................................................................16 Urbanization........................................................................................16 Physical Conditions of the Study Area................................................17 Economic Conditions ..........................................................................22 Summary of Physical Blight ................................................................25 III. TAX INCREMENT REVENUE ............................................................27 Tax Increment Revenue Projection.....................................................27 Distribution of Tax Increment Revenues .............................................31 IV. CONCLUSION....................................................................................33 Recommendations..............................................................................33 Next Step ............................................................................................34
El Dorado County Redevelopment Feasibility Study Page i

TABLES Table 1 Study Areas ..................................................................................6 Table 2 Percentage of Existing Land .......................................................15 Table 3 Urbanization Analyses ................................................................17 Table 4 Age of Buildings..........................................................................18 Table 5 Results of the Building Conditions Survey by Parcel ..................19 Table 6 Zoning Conformance ..................................................................21 Table 7 Comparison of Taxable Sales 2005............................................22 Table 8 Commercial Lease Rates............................................................23 Table 9 Common Characteristics of Physical Blight and Recommended
Study Area ..................................................................................25 Table 10 Net Tax Increment Projection 2 % and 4 % Annual Growth........28 Table 11 Total Study Area Redevelopment Project – Tax Increment 2%
Annual Growth ............................................................................29 Table 12 Total Study Area Redevelopment Project – Tax Increment 4%
Annual Growth ............................................................................30 Table 13 Potential Use of Tax Increment Funds Assuming a Two and Four
% Annual Growth Rate Over a 45-Year Period...........................32
FIGURES Figure 1 El Dorado Redevelopment Study Areas .......................................2 Figure 2 Georgetown Study Area ...............................................................7 Figure 3 North Cameron Park Study Area ..................................................8 Figure 4 South Cameron Park and Shingle Springs Study Areas...............9 Figure 5 Missouri Flat and Diamond Springs Study Areas .......................10 Figure 6 El Dorado Study Area .................................................................11 Figure 7 Camino Study Area.....................................................................12 Figure 8 Somerset/Mt. Aukum Study Area................................................13 Figure 9 Meyers Study Area .....................................................................14 Figure 10 Crime Rate Per 1,000 Persons...................................................24 Figure 11 2005 California Crime Index Rates.............................................24
El Dorado County Redevelopment Feasibility Study Page ii

EL DORADO COUNTY REDEVELOPMENT FEASIBILITY STUDY
I. INTRODUCTION
Purpose of the Study
The County of El Dorado (“County) is concerned about the declining physical and economic conditions in unincorporated communities within the County. Certain areas currently exhibit signs of blight, including deteriorated or obsolete buildings, underutilized properties, inadequate public improvements and environmental concerns that could pose health and safety risks to the residents and businesses of these communities. Any one or all of these conditions of blight may also impact the economic growth. In response to these concerns, the County has conducted a study to determine the potential feasibility of using redevelopment as a tool for economic revitalization.
Redevelopment is a powerful and effective tool used by redevelopment agencies to improve physical and economic conditions existing in a city or county. By establishing a redevelopment agency and initiating a redevelopment effort focused in areas identified by this study, the County could assist in rehabilitating and revitalizing businesses, improving residential living conditions and providing additional public improvements. These redevelopment projects and programs would be funded through tax increment revenues that are generated from the increase in assessed property values of the area.
The County has conducted a feasibility study to determine areas within the unincorporated county that could benefit from redevelopment. For the purposes of this study, ten preliminary survey areas (“Study Areas”) have been identified and their locations are shown in Figure 1. The Study Areas include:
1. Georgetown 2. North Cameron Park 3. South Cameron Park 4. Shingle Springs 5. Missouri Flat 6. Diamond Springs 7. El Dorado 8. Camino 9. Somerset/Mt. Aukum 10. Meyers
The purpose of this feasibility study is three-fold: 1) to determine if the Study Areas, together and individually, qualify as a redevelopment project area based on criteria under California Community Redevelopment Law (“Redevelopment Law”); 2) to project the potential tax increment revenues from redevelopment; and 3) to assess the feasibility of establishing a redevelopment agency and initiating a redevelopment program.
El Dorado County Redevelopment Feasibility Study Page 1

Georgetown
North Cameron Park
South Cameron Park
ShingleSprings
Missouri FlatCamino
DiamondSprings
El Dorado
SomersetMt. Aukum
Meyers
50
49
49
193
Not to Scale
Figure 1
EL DORADO REDEVELOPMENT STUDY AREAS
El Dorado County Redevelopment Feasibility Study Page 2

Approach to Selecting the Study Areas
The project approach involves identifying the Study Areas in the County’s unincorporated areas that meet Redevelopment Law’s definition of “blight” – which will be defined in greater detail later in this study. To assist the County, GRC Associates, Inc. (“GRC”) initiated a systematic, parcel-by-parcel survey of each of property within the ten Study Areas. The survey database included information that could be determined from public right-of-ways regarding the existing land use, the physical condition of buildings and property, design elements, documentation of compatibility with adjacent uses, and other observed physical constraints to the use of the parcel. Based on observations from the field survey conducted in January through March 2007, GRC outlined general areas that exhibit conditions that may warrant the use of redevelopment. Rather than survey all parcels within the various communities, GRC concentrated its effort on parcels designated in the County’s General Plan for commercial and industrial uses. Parcels designated for residential or agricultural uses were not surveyed. For the Meyers Study Area the Meyers Community Plan adopted by the Tahoe Regional Planning Agency was used to identify the survey area.
In total, the combined ten Study Areas include 1,417 parcels encompassing approximately 2,660 acres of land. The boundary lines of each Study Area are approximations and parcel information is a combination of data from the El Dorado County Office of the Assessor and from the field survey conducted by GRC.
Contents of this Study Report
Following this Introduction, Section II of this study assesses the conditions of physical and economic blight observed in the Study Areas. This is followed by Section III, which examines the current property values of the Study Areas and projects the potential short- and long-term tax increment revenues that a redevelopment program could generate. Finally, Section IV discusses the recommendations of this feasibility study and the redevelopment plan adoption process, if the county decides to move forward with this effort.
El Dorado County Redevelopment Feasibility Study Page 3

II. MEETING THE REDEVELOPMENT REQUIREMENTS Redevelopment is a key financial and administrative mechanism used to eliminate existing conditions of blight in an area. One of the first steps in the redevelopment process is to create and adopt a project area that meets the statutory requirements of Redevelopment Law.
Project Area Criteria
The Redevelopment Law sets forth a variety of conditions that must exist if an area is to be included in a redevelopment project area. The proposed project area must be:
1. Predominantly urbanized – not less than 80 percent of the land in the Project Area must be or has been urbanized. (Section 33320.1)
2. Characterized by one or more conditions of physical blight (Section 33031(a)), including:
Buildings in which it is unsafe or unhealthy for persons to live or work. These conditions may be caused by serious building code violations, serious dilapidation and deterioration caused by long-term neglect, construction that is vulnerable to serious damage from seismic or geologic hazards, and faulty or inadequate water or sewer utilities.
Conditions that prevent or substantially hinder the viable use or capacity of buildings or lots. These conditions may be caused by buildings of substandard, defective, or obsolete design or construction given the present general plan, zoning, or other development standards.
Adjacent or nearby incompatible land uses that prevent the development of those parcels or other portions of the project area.
The existence of subdivided lots that are in multiple ownership and whose physical development has been impaired by their irregular shapes and inadequate sizes, given present general plan and zoning standards and present market conditions.
3. Characterized by one or more conditions of economic blight (Section 33031(b)), including:
Depreciated or stagnant property values.
Impaired property values, due in significant part, to hazardous waste on property where the agency may be eligible to use its authority as specified in Article 12.5 (commencing with Section 33459).
Abnormally high business vacancies, abnormally low lease rates, high number of abandoned buildings.
A serious lack of necessary commercial facilities that are normally found in neighborhoods, including grocery stores, drug stores, and banks and other lending institutions.
El Dorado County Redevelopment Feasibility Study Page 4

Serious residential overcrowding that has resulted in significant public health or safety problems. As uses in this paragraph, “overcrowding” means exceeding the standards referenced in Article 5 (commencing with Section 32) of Chapter I of Title 25 of the California code of Regulations.
An excess of bars, liquor stores, or adult-oriented businesses that has resulted in significant public health, safety, or welfare problems.
A high crime rate that constitutes a serious threat to the public safety and welfare.
4. Necessary for the effective redevelopment of the blighted area (Section 33321). A project area need not be restricted to buildings, improvements, or lands which are detrimental or inimical to the public health, safety, or welfare, but may consist of an area in which such conditions predominate and injuriously affect the entire area. A project area may include lands, buildings, or improvements which are not detrimental to the public health, safety or welfare, but whose inclusion is found necessary for the effective redevelopment of the area of which they are a part.
It is important to note that the above project area criteria reflect the new changes in Redevelopment Law that significantly redefined both the physical and economic standards for what qualifies as blight. The new legislation (SB 1206), which took effect January 1, 2007, narrowed the definition of blight and made it more difficult to designate an area for redevelopment. In general, physical blight must be evidenced by long-term neglect and show a serious health and safety risk to residents and businesses.
Study Areas
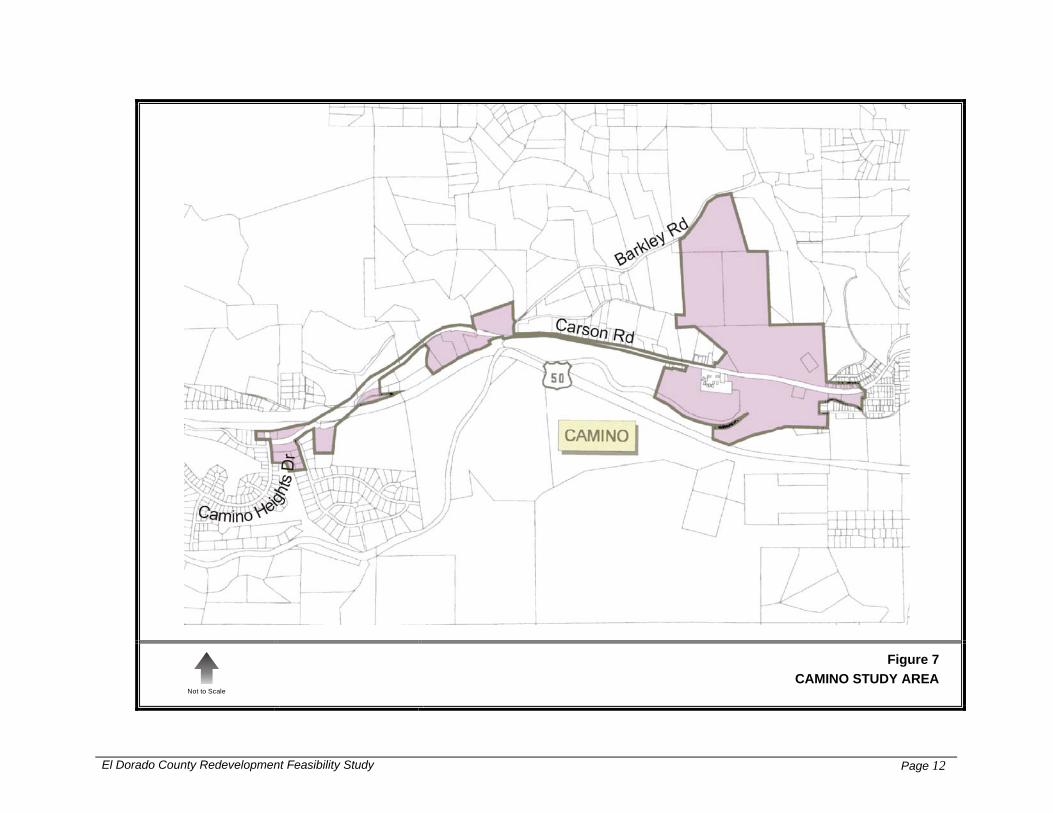
The ten Study Areas include land designated for commercial and industrial uses within unincorporated communities within the county. The size and boundaries of each Study Area are presented in Table 1 and illustrated in Figures 2 to 8.
Georgetown. This Study Area generally includes the Main Street area of the historic community of Georgetown. It includes 117 parcels and totals 104 acres.
North Cameron Park. This Study Area includes both commercial and industrial designated land located in the vicinity of Cameron Park Drive and Green Valley Road. It includes 100 parcels totaling 143 acres, which also includes the Cameron Air Park Airport.
South Cameron Park. Located in the vicinity of the Highway 50 and Cameron Park Drive, this Study Area has experienced new retail commercial and office development north of Highway 50. There are 149 parcels totaling 334 acres.
Shingle Springs. This Study Area is immediately east of Cameron Park South in the vicinity of Highway 50 and South Shingle Road. New industrial development is occurring in the western portion of the Study Area. There are 236 parcels totaling 523 acres.
Missouri Flat. This is the largest of the Study Areas with 364 parcels totaling 864 acres. It is a rapidly growing commercial and industrial area with recent developments north of Highway 50 and in the vicinity of the new Wal-Mart
El Dorado County Redevelopment Feasibility Study Page 5

development at Missouri Flat Road and Forni Road. As a result of high traffic volumes, the Missouri Flat Road/Pleasant Valley Road connector is proposed.
Diamond Springs. An historic community located along Pleasant Valley Road (Route-49). This Study Area includes 92 parcels totaling 94 acres.
El Dorado. This Study Area is located in the center of the historic community of El Dorado. All 123 parcels in this Study Area are designated commercial with the exception of one industrial parcel (lumber mill). This Study Area encompasses 119 acres.
Camino. The Camino Study Area is located along Carson Road which parallels Highway 50. The General Plan designates both Commercial and Industrial land uses. The dominant industry is Sierra Pacific lumber, however, the area is experiencing growth in the wine industry. There are 38 parcels totaling 227 acres.
Somerset/Mt. Aukum. This Study Area includes three relatively small non-contiguous areas along Mt. Aukum Road (E-16). The three areas totaling 30 parcels and 110 acres.
Meyers. The unincorporated community of Meyers is located along Highway 50 south of the city of South Lake Tahoe. The Study Area boundaries are based on the Meyers Community Land Use Concept Plan developed by the Tahoe Regional Planning Agency. The Study Area includes 168 parcels and totals 142 acres.
Table 1 STUDY AREAS
Study Areas No. of Parcels
Parcel Acres
Streets/ROW Acres
Total Acres
Georgetown 117 76.6 27.4 104.0
North Cameron Park 100 111.0 31.7 142.7
South Cameron Park 149 282.2 51.9 334.1
Shingle Springs 236 441.8 81.6 523.4
Missouri Flat 364 778.7 85.5 864.2
Diamond Springs 92 82.4 11.7 94.1
El Dorado 123 108.8 9.9 118.6
Camino 38 197.3 29.7 227.0
Somerset/Mt. Aukum 30 99.9 10.0 109.9
Meyers 168 102.0 40.0 142.0
Total Study Area 1,417 2,280.7 379.3 2,660.0
Source: GRC Associates, Inc.
El Dorado County Redevelopment Feasibility Study Page 6

Not to Scale
Figure 2
GEORGETOWN STUDY AREA
El Dorado County Redevelopment Feasibility Study Page 7

Not to Scale
Figure 3
NORTH CAMERON PARK STUDY AREA
El Dorado County Redevelopment Feasibility Study Page 8

Not to Scale
Figure 4
SOUTH CAMERON PARK AND SHINGLE SPRINGS STUDY AREAS
El Dorado County Redevelopment Feasibility Study Page 9

Not to Scale
Figure 5
MISSOURI FLAT AND DIAMOND SPRINGS STUDY AREAS
El Dorado County Redevelopment Feasibility Study Page 10

Not to Scale
Figure 6
EL DORADO STUDY AREA
El Dorado County Redevelopment Feasibility Study Page 11
Not to Scale
Figure 7
CAMINO STUDY AREA
El Dorado County Redevelopment Feasibility Study Page 12

Not to Scale
Figure 8
SOMERSET/MT. AUKUM STUDY AREA
El Dorado County Redevelopment Feasibility Study Page 13

Not to Scale
Figure 9
MEYERS STUDY AREA
El Dorado County Redevelopment Feasibility Study Page 14

Existing Land Uses
The primary focus of a redevelopment effort is to revitalize the County’s commercial and industrial areas. While all of the land in the Study Areas is designated for commercial or industrial uses, these uses only represent 18.6 percent and 18.0 percent of the total Study Area’s existing land uses, respectively. Of the ten Study Areas, South Cameron Park has the highest percentage of current commercial acreage at 30.4 percent. As shown in Table 2, almost one-third (30.6%) of the total Study Area land is undeveloped. Based on the survey, there are approximately 824 acres of vacant land within the total Study Area and the Shingle Springs and Missouri Flat Study Areas account for approximately 450 acres or over one half of the total vacant land.
Residential uses also represent a significant number of parcels. According to the survey, 246 parcels are single-family or multi-family residential uses. This translates into at least 260 units in the total Study Area. This is a conservative figure because some parcels identified as commercial may include a residential unit (mixed-use) on the property. The Study Areas with the largest proportion of land used for residential purposes include El Dorado (32.1%) and Diamond Springs (26.5%).
Table 2
PERCENTAGE OF EXISTING LAND
Study Areas
SF R
esid
entia
l.
MF
Res
iden
tial
Com
mer
cial
.
Indu
stria
l
Publ
ic
Vaca
nt
Stre
ets/
RO
W
Tota
l
Georgetown 18.6% 2.4% 26.8% 1.0% 4.5% 20.5% 26.4% 100.0%
North Cameron Park 0.7% 0.0% 26.1% 4.9% 29.7% 16.3% 22.2% 100.0%
South Cameron Park 0.1% 0.0% 30.4% 9.0% 0.0% 44.9% 15.5% 100.0%
Shingle Springs 6.3% 0.2% 19.1% 13.0% 0.5% 43.0% 17.8% 100.0%
Missouri Flats Corridor 21.5% 0.0% 14.2% 21.0% 4.0% 26.5% 12.8% 100.0%
Diamond Springs 24.1% 2.4% 18.8% 0.0% 7.9% 34.1% 12.7% 100.0%
El Dorado 27.2% 4.9% 7.0% 17.7% 1.5% 33.5% 8.3% 100.0%
Camino 1.5% 0.3% 11.4% 70.7% 0.0% 3.0% 13.1% 100.0%
Somerset/Mt. Aukum 13.1% 0.0% 26.6% 0.0% 5.1% 46.1% 9.1% 100.0%
Meyers 1.6% 0.0% 17.6% 6.7% 19.5% 26.3% 28.2% 100.0%
Total Study Area 11.9% 0.5% 18.6% 18.0% 4.7% 30.6% 15.6% 100.0%
Source: GRC Associates, Inc.
El Dorado County Redevelopment Feasibility Study Page 15

Historical Landmarks
El Dorado County has numerous historical landmarks that center around the Gold Rush era. As such, California Historical Landmarks within the Study Areas include the Towns of Diamond Springs, El Dorado, Georgetown and Shingle Springs. To be designated as a California Historical Landmark, a site must be of statewide historical significance and meet at least one of the established criteria: 1) be approved for designation by the County Board of Supervisors or the City/Town Council in whose jurisdiction it is located; 2) be recommended by the State Historical Resources Commission; and 3) be officially designated by the Director of California State Parks. The Office of Historic Preservation (OHP) is responsible for administering federal and state mandated historic preservation programs in California.
As El Dorado County possesses multiple California Historical Landmarks, special considerations and regulations will be required to assure the preservation of buildings deemed historically significant. The added powers, authority and resources of the redevelopment agency may be needed to successfully address these concerns.
Urbanization
Section 33320.1 of the Redevelopment Law mandates that not less than 80 percent of the land in a redevelopment project area must be or have been urbanized. As shown in Table 3, the total Study Area is almost one-third (30.6%) vacant and over two-thirds (69.4%) urbanized land, which also includes streets, highways and public rights of way. Therefore, all the Study Areas together would not qualify as a single redevelopment project area. This analysis has not reviewed permits to determine prior development; however, much of the larger vacant parcels did not appear to have prior development. A review of any building permits on each vacant parcel would provide a more accurate indication of any prior development.
At the Study Area level, only Camino and North Cameron Park meet the urbanization test at 97.0 percent and 83.7 percent urbanized, respectively. Georgetown, at 79.5 percent urbanized, could possibly qualify since it is an older town and some of the vacant land could previously have been developed. In spite of recent new commercial development in South Cameron Park, only 55.1 percent of this Study Area is currently developed. In order to meet the urbanization requirement, the Study Area boundary lines could be revised to exclude certain large vacant parcels located at the edges of a Study Area. The exclusion of large vacant parcels could qualify Study Areas such as South Cameron Park, Shingle Springs, Missouri Flat and Meyers.
El Dorado County Redevelopment Feasibility Study Page 16

Table 3 URBANIZATION ANALYSES
Study Areas Percent Vacant Percent Urbanized
Georgetown 20.5% 79.5%
North Cameron Park 16.3% 83.7%
South Cameron Park 44.9% 55.1%
Shingle Springs 43.0% 57.0%
Missouri Flats Corridor 26.5% 73.5%
Diamond Springs 34.1% 65.9%
El Dorado 33.5% 66.5%
Camino 3.0% 97.0%
Somerset/Mt. Aukum 46.1% 53.9%
Meyers 26.3% 73.7%
Total Study Area 30.6% 69.4% Source: GRC Associates, Inc.
Physical Conditions of the Study Area
Based on the field survey and the review of El Dorado County Assessor’s data, GRC concludes that some of the Study Areas would meet the physical blight requirements for establishing a project area under the Redevelopment Law. Below is an overview of physical conditions in the Study Area.
Building Condition
According to Redevelopment Law, buildings that are unsafe or unhealthy for persons to live or work including serious building code violations, dilapidation and deterioration caused by long-term neglect, or vulnerability to seismic activity are characteristics of physical blight conditions.
Much of the deterioration of buildings in the Study Areas is the result of their age. As shown in Table 4, the median age of buildings in the total Study Area is 32 years. Therefore, one-half of the existing structures (residential and non-residential buildings) in the total Study Area were constructed prior to 1975. The oldest median ages of homes were in Georgetown, El Dorado and Diamond Springs. In these three Study Areas, one-half of the existing structures were built before 1950, and according to the Assessor’s information, Georgetown has 16 parcels with buildings constructed prior to 1900, with the earliest built in 1850.
El Dorado County Redevelopment Feasibility Study Page 17
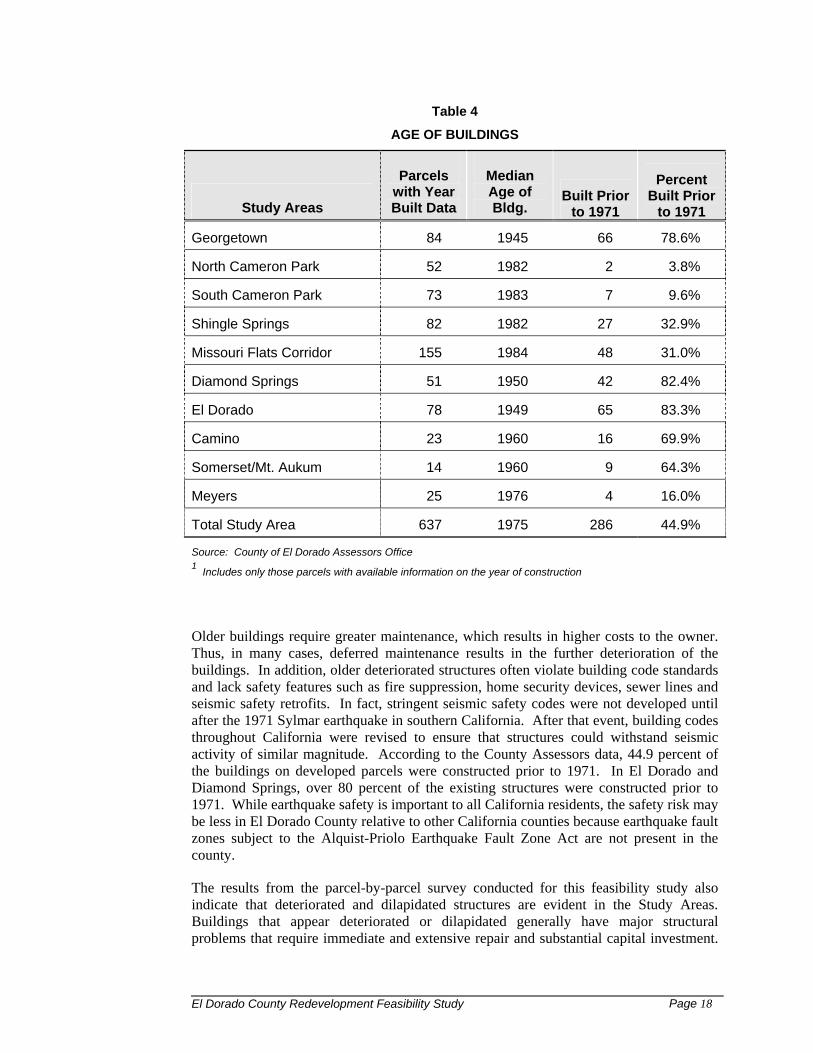
Table 4
AGE OF BUILDINGS
Study Areas
Parcels with Year Built Data
Median Age of Bldg.
Built Prior to 1971
Percent Built Prior
to 1971
Georgetown 84 1945 66 78.6%
North Cameron Park 52 1982 2 3.8%
South Cameron Park 73 1983 7 9.6%
Shingle Springs 82 1982 27 32.9%
Missouri Flats Corridor 155 1984 48 31.0%
Diamond Springs 51 1950 42 82.4%
El Dorado 78 1949 65 83.3%
Camino 23 1960 16 69.9%
Somerset/Mt. Aukum 14 1960 9 64.3%
Meyers 25 1976 4 16.0%
Total Study Area 637 1975 286 44.9%
Source: County of El Dorado Assessors Office 1 Includes only those parcels with available information on the year of construction
Older buildings require greater maintenance, which results in higher costs to the owner. Thus, in many cases, deferred maintenance results in the further deterioration of the buildings. In addition, older deteriorated structures often violate building code standards and lack safety features such as fire suppression, home security devices, sewer lines and seismic safety retrofits. In fact, stringent seismic safety codes were not developed until after the 1971 Sylmar earthquake in southern California. After that event, building codes throughout California were revised to ensure that structures could withstand seismic activity of similar magnitude. According to the County Assessors data, 44.9 percent of the buildings on developed parcels were constructed prior to 1971. In El Dorado and Diamond Springs, over 80 percent of the existing structures were constructed prior to 1971. While earthquake safety is important to all California residents, the safety risk may be less in El Dorado County relative to other California counties because earthquake fault zones subject to the Alquist-Priolo Earthquake Fault Zone Act are not present in the county.
The results from the parcel-by-parcel survey conducted for this feasibility study also indicate that deteriorated and dilapidated structures are evident in the Study Areas. Buildings that appear deteriorated or dilapidated generally have major structural problems that require immediate and extensive repair and substantial capital investment.
El Dorado County Redevelopment Feasibility Study Page 18

The survey indicates a building was deteriorated when it exhibited conditions such as poor foundation, large cracks in walls, rotting or sagging roofs, or other damages that impact the structural integrity of the building. These conditions, if left untreated, could result in the collapse of a portion or all of the building and endanger the safety of its occupants. In some cases, total repair cost would exceed the existing improvement value of the building, and therefore, would be a potential candidate for replacement.
Table 5 presents the results of the physical conditions survey in the Study Area. The results, which are based solely on visual assessments of the exterior of the structure as observed from the street, indicate that 132 parcels, or 13.3 percent of the total 990 developed parcels within the Study Areas, exhibit signs of building deterioration or dilapidation. Of the ten Study Areas, Georgetown had the highest number and percentage of parcels exhibiting deterioration. Approximately one-third (32.3%) of the developed parcels in Georgetown were blighted. The least blighted was South Cameron Park, which includes numerous newly developed parcels.
Table 5
RESULTS OF THE BUILDING CONDITIONS SURVEY BY PARCEL
Building Condition Total Study Areas
Deteriorated Good Condition
Georgetown 31 (32.3%)
65 (67.7%)
96 (100.0%)
North Cameron Park 3 (4.3%)
67 (95.7)
70 (100.0%)
South Cameron Park 1 (0.9%)
112 (99.1%)
113 (100.0%)
Shingle Springs 16 (10.7%)
133 (89.3%)
149 (100.0%)
Missouri Flats Corridor 26 (9.4%)
251 (90.6%)
277 (100.0%)
Diamond Springs 14 (21.5%)
51 (78.5%)
65 (100.0%)
El Dorado 15 (16.3%)
77 (83.7%)
83.7 (100.0%)
Camino 10 (28.6%)
25 (71.4%)
35 (100.0%)
Somerset/Mt. Aukum 4 (20.0%)
16 (80.0%)
20 (100.0%)
Meyers 12 (16.4%)
61 (83.6%)
73 (100.0%)
Total Study Area 132 (13.3%)
858 (86.7%)
990 (100.0%)
Source: GRC Associates, Inc.
El Dorado County Redevelopment Feasibility Study Page 19
Sewer Facilities
Another factor of physical blight is the lack of adequate sewer facilities. According to the County, much of the older Study Areas such as Georgetown, Camino and Somerset/Mt. Aukum are still dependent on septic tanks for sewer disposal. Parts of Shingle Springs and Missouri Flat are served by the sewer systems and most of the areas of North and South Cameron Park, El Dorado, Diamond Springs and Meyers have sewer lines to the county sewer system.
Code Enforcement
Code enforcement is also a factor used to determine blight. The County issues violation citations to property owners that do not comply with the existing code. According to information provided by the County’s Code Enforcement Unit, there are approximately 1,300 open code enforcement cases throughout the county. Approximately 900 cases are related to structure violations and approximately 250 are zoning violation cases. Unfortunately, code enforcement information by parcel is not available to the public; however, the County recently plotted all cases and found that code enforcement cases were evenly spread countywide according to population density. No specific area within the county had a significantly higher concentration of code enforcement cases, and therefore, it is not a factor distinguishing blight in one area over another.
General Plan/Zoning Conformance
Factors that prevent or substantially hinder the viable use or capacity of buildings or lots include properties exhibiting conditions of substandard design or obsolete design or construction given present general plan standards, zoning designations or other development standards.
Incompatible uses in the Study Areas relative to planned uses are a significant blighting problem. According to the County General Plan Land Use Element, it is a policy that development in which residential use is the sole or primary use shall be prohibited on commercially and industrially designated lands. Since all the Study Areas are designated for either commercial or industrial uses, any residential use is considered nonconforming. However, any nonconforming use may be allowed to continue its use subject to limitation established in the zoning ordinance, such as not allowing the use to expand, enlarge or otherwise extend either on the same or adjoining parcel of land without a special use permit. It is considered a legally nonconforming use if the use was legally established in the zone in which it was located, but the use is not currently permitted in the zone. These nonconforming uses may continue to operate or occupy legally established properties, even if not in compliance with the current code (sometime referred to as a “grandfathered” use).
In addition, development standards for commercial and industrial districts include minimum lot sizes, maximum building coverage, minimum lot width, and yard and maximum building height. For the purposes of this study, minimum lot size and maximum building coverage were analyzed based on the Assessor’s parcel data. The minimum lot area is 5,000 square feet for commercial and 10,000 square feet for industrial. The maximum building coverage is 60 percent of the lot in both commercial and industrial districts.
El Dorado County Redevelopment Feasibility Study Page 20

Based on both the permitted uses and development standards, 386 parcels or approximately one-quarter (27.3%) of the total parcels are considered nonconforming. Table 6 shows that El Dorado has the highest nonconforming percentage at 61.8 percent and Meyers has the lowest at 8.9 percent. For the most part, many of the Meyers parcels conformed to the permitted uses and development standards. However, Meyers homeowners are required to install Best Management Practices (BMPs) to help control runoff, which is a contributing factor to the water quality of Lake Tahoe. Examples of BMPs include installing trenches to filter roof and driveway runoff, paving driveways, and covering bare soils. In most cases, these BMPs were not evident on residential parcels surveyed for this study.
Such nonconforming uses create circulation problems, an increased exposure to pollution, and a visual hodgepodge that does not promote private investment and thus inhibits economic development.
Table 6
ZONING CONFORMANCE
Study Areas Nonconformance Percent
Georgetown 51 43.6%
North Cameron Park 23 32.9%
South Cameron Park 35 23.5%
Shingle Springs 60 25.4%
Missouri Flats Corridor 73 20.0%
Diamond Springs 32 34.8%
El Dorado 76 61.8%
Camino 13 34.2%
Somerset/Mt. Aukum 8 26.7%
Meyers 15 8.9%
Total Study Area 386 27.3% Source: GRC Associates, Inc.
El Dorado County Redevelopment Feasibility Study Page 21

Economic Conditions
Taxable Sales
Key indicators of a City’s economic condition are taxable sales and property values. Table 7 presents a comparison of 2005 taxable sales in the unincorporated County with the cities of Placerville and South Lake Tahoe combined and the state as a whole. Because of varying population sizes, a comparison of taxable sales is shown on a per capita basis. As indicated in the table, the unincorporated County’s total taxable sales per capita ($6,023) are significantly less than the taxable sales per capita of the combined two cities ($19,640) and the state ($14,435). This indicates a potential sales “leakage” which occurs when household income is spent in areas outside the unincorporated area.
Table 7
COMPARISON OF TAXABLE SALES 2005
Population
Taxable Sales (000)
Sales Per Capita
Unincorporated County 142,788 $860,042 $6,023
Placerville and South Lake Tahoe
33,849 $665,103 $19,649
California 37,195,240 $536,904,428 $14,435
Source: State Department of Finance and the State Board of Equalization
As previously discussed, the 2005 sales per capita in the unincorporated County is less than one-half the statewide average; however, taxable sales in the unincorporated county have increased significantly between 2000 and 2005. During this five-year period, taxable sales in the unincorporated County increased from $570.1 million to $860.0 million or an increase of 50.9 percent. In comparison, the two cities of Placerville and South Lake Tahoe combined experienced an increase in taxable sales of only 20.8 percent, while statewide, taxable sales increased by 21.5 percent. With more commercial retail development occurring in El Dorado Hills, Cameron Park, and Missouri Flat, the taxable sales gap between unincorporated county and the cities will narrow.
Commercial Retail and Office Lease Rates
An analysis was completed of the Study Areas’ commercial retail and office lease rates. Owners and brokers representing 14 properties available for lease in the Study Area were contacted. The Study Areas’ rates were compared with rates of available commercial space in unincorporated El Dorado Hills, which represents new and modern development. In comparison to El Dorado Hills, available commercial space in the Study Areas is
El Dorado County Redevelopment Feasibility Study Page 22
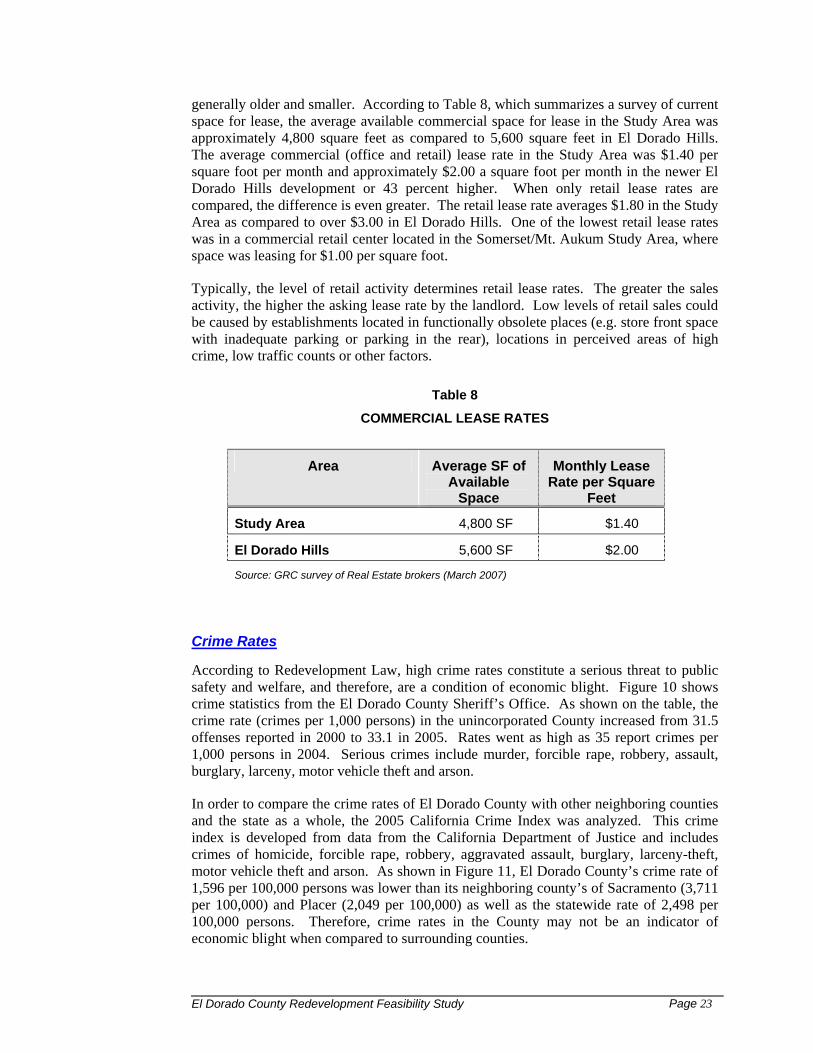
generally older and smaller. According to Table 8, which summarizes a survey of current space for lease, the average available commercial space for lease in the Study Area was approximately 4,800 square feet as compared to 5,600 square feet in El Dorado Hills. The average commercial (office and retail) lease rate in the Study Area was $1.40 per square foot per month and approximately $2.00 a square foot per month in the newer El Dorado Hills development or 43 percent higher. When only retail lease rates are compared, the difference is even greater. The retail lease rate averages $1.80 in the Study Area as compared to over $3.00 in El Dorado Hills. One of the lowest retail lease rates was in a commercial retail center located in the Somerset/Mt. Aukum Study Area, where space was leasing for $1.00 per square foot.
Typically, the level of retail activity determines retail lease rates. The greater the sales activity, the higher the asking lease rate by the landlord. Low levels of retail sales could be caused by establishments located in functionally obsolete places (e.g. store front space with inadequate parking or parking in the rear), locations in perceived areas of high crime, low traffic counts or other factors.
Table 8
COMMERCIAL LEASE RATES
Area Average SF of Available
Space
Monthly Lease Rate per Square
Feet
Study Area 4,800 SF $1.40
El Dorado Hills 5,600 SF $2.00
Source: GRC survey of Real Estate brokers (March 2007)
Crime Rates
According to Redevelopment Law, high crime rates constitute a serious threat to public safety and welfare, and therefore, are a condition of economic blight. Figure 10 shows crime statistics from the El Dorado County Sheriff’s Office. As shown on the table, the crime rate (crimes per 1,000 persons) in the unincorporated County increased from 31.5 offenses reported in 2000 to 33.1 in 2005. Rates went as high as 35 report crimes per 1,000 persons in 2004. Serious crimes include murder, forcible rape, robbery, assault, burglary, larceny, motor vehicle theft and arson.
In order to compare the crime rates of El Dorado County with other neighboring counties and the state as a whole, the 2005 California Crime Index was analyzed. This crime index is developed from data from the California Department of Justice and includes crimes of homicide, forcible rape, robbery, aggravated assault, burglary, larceny-theft, motor vehicle theft and arson. As shown in Figure 11, El Dorado County’s crime rate of 1,596 per 100,000 persons was lower than its neighboring county’s of Sacramento (3,711 per 100,000) and Placer (2,049 per 100,000) as well as the statewide rate of 2,498 per 100,000 persons. Therefore, crime rates in the County may not be an indicator of economic blight when compared to surrounding counties.
El Dorado County Redevelopment Feasibility Study Page 23

Figure 10
29
30
31
32
33
34
35
36
2000 2001 2002 2003 2004 2005
CRIME RATE PER 1,000 PERSONSUnincorporated El Dorado County
Source: El Dorado County Sheriff’s Office
Figure 11
0
500
1000
1500
2000
2500
3000
3500
4000
Sacramento California Placer El Dorado
2005 CALIFORNIA CRIME INDEX RATESPer 100,000 Population
Source: California Department of Justice
El Dorado County Redevelopment Feasibility Study Page 24

Summary of Physical Blight
Table 9 summarizes the physical blight witnessed in the Study Area
Table 9
COMMON CHARACTERISTICS OF PHYSICAL BLIGHT AND RECOMMENDED STUDY AREA
Study Area No. of Blighted Parcels
Common Characteristics of Physical Blight
Recommended Project Area
Georgetown 60 Older buildings – median age of building is approximately 60 years Structural deterioration Nonconformance to general plan/zoning
and development standards Inadequate storm drain system Inadequate sewer utility
YES
North Cameron Park
22 Buildings are relatively new and in good condition
NO
South Cameron Park
36 Buildings are relatively new and in good condition
NO
Shingle Springs
68 Structural deterioration Inadequate sewer facility YES
Revise Study Area boundary by
deleting vacant parcels and new
industrial developments
Missouri Flat 89 Structural deterioration Inadequate storm drain system Inadequate sewer utility
YES
Revise Study Area boundary by
deleting vacant parcels and new
commercial developments
Diamond Springs
39 Older buildings – median age of building is approximately 55 years Structural deterioration Nonconformance to general plan/zoning
and development standards
YES
El Dorado County Redevelopment Feasibility Study Page 25

Table 9 (Cont.)
COMMON CHARACTERISTICS OF PHYSICAL BLIGHT AND RECOMMENDED STUDY AREA
Study Area No. of
Blighted Parcels
Common Characteristics of Physical Blight
Recommended Project Area
El Dorado 78 Older buildings – median age of building is approximately 55 years Structural deterioration Nonconformance to general plan/zoning
and development standards
YES
Camino 21 Older buildings – median age of building is approximately 45 years Structural deterioration Nonconformance to general plan/zoning
and development standards Inadequate sewer utility
YES
Somerset/ Mt. Aukum
10 Older buildings – median age of building is approximately 45 years Inadequate sewer utility
YES
Revise Study Area boundaries
by deleting vacant parcels
Meyers 21 Structural deterioration Non-conformance with general
plan/zoning and development standards
YES
Revise Study Area boundaries
by deleting vacant parcels
El Dorado County Redevelopment Feasibility Study Page 26

III. TAX INCREMENT REVENUE If the County decides to implement a redevelopment program for the Study Areas, tax increment revenue generated from the increase in assessed property value will be the primary source of funding. This revenue can be used to pay County debts associated with the programs, which result from the County’s commitment to eliminate blight within the redevelopment project area. Tax increment revenues can also be used to pay for the construction and financing of public improvements that benefit the project area.
Tax increment revenue, which results from the increase in assessed property value from redevelopment activity, is distributed back to the County. To illustrate this point, the County General Fund currently receives approximately 21 cents of every property tax dollar. According to the 2005-06 El Dorado County Tax Assessor property tax information, the assessed land and improvement value of the recommended Study Areas totals approximately $236.1 million. This is based on the Study Areas, which exclude large vacant land and recent developments. The Study Areas of North Cameron Park and South Cameron Park are not recommended for redevelopment based on the survey results which indicated that these Study Areas did not exhibit significant conditions of physical blight to be considered as a project area.
With redevelopment, the County could receive tax increment revenues approximately equal to one percent of the increased assessed values. From these tax increment revenues, the County is required under Redevelopment Law to set aside 20 percent into a fund to be used for low- and moderate-income housing and to comply with the statutory pass-through requirements.
The County could utilize any one or a combination of other methods to implement redevelopment programs in addition to tax increment, including: owner participation agreements, disposition and development agreements, tax increment bonds, cooperation agreements, loans or any other legal means.
Tax Increment Revenue Projection Tables 10, 11 and 12 present the projected tax increment revenue that is anticipated for the Study Area over a 45-year period. These projections assume a 2008 base year with an assessed value of approximately $246.1 million. Given that the redevelopment plan adoption process takes approximately 12 months, the base year assessment for a new project area would be at the earliest 2008. Table 10 presents the potential tax increment based on an assumed annual growth rate in the property value of two percent and four percent. A growth factor of two percent for property values is conservative and represents the two percent growth allowed by Proposition 13. Tables 11 and 12 present a more detailed tax increment project based on a two and four percent annual increase in assessed property value. A two-percent growth scenario would result in projected net tax increment to the County – with housing set-aside funds and pass through payments taken out – of $10.0 million in 25 years and $32.5 million in 45 years. As shown in Table 12, if assessed values increase by four percent per year, the projected cumulative net tax increment would be $88.7 million.
El Dorado County Redevelopment Feasibility Study Page 27
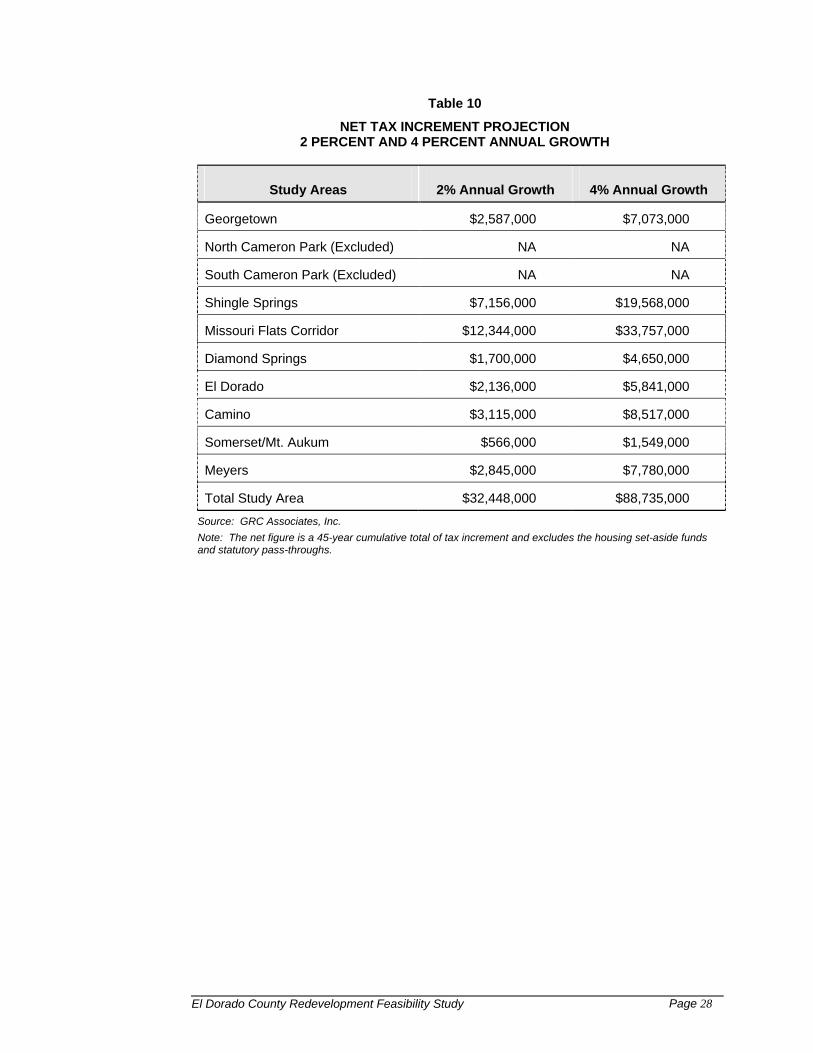
Table 10
NET TAX INCREMENT PROJECTION 2 PERCENT AND 4 PERCENT ANNUAL GROWTH
Study Areas 2% Annual Growth 4% Annual Growth
Georgetown $2,587,000 $7,073,000
North Cameron Park (Excluded) NA NA
South Cameron Park (Excluded) NA NA
Shingle Springs $7,156,000 $19,568,000
Missouri Flats Corridor $12,344,000 $33,757,000
Diamond Springs $1,700,000 $4,650,000
El Dorado $2,136,000 $5,841,000
Camino $3,115,000 $8,517,000
Somerset/Mt. Aukum $566,000 $1,549,000
Meyers $2,845,000 $7,780,000
Total Study Area $32,448,000 $88,735,000
Source: GRC Associates, Inc. Note: The net figure is a 45-year cumulative total of tax increment and excludes the housing set-aside funds and statutory pass-throughs.
El Dorado County Redevelopment Feasibility Study Page 28

Table 11
TOTAL STUDY AREA REDEVELOPMENT PROJECT -- TAX INCREMENT 2 PERCENT ANNUAL GROWTH
(Values in thousands) a. Tax Rate: 1.000% d. Pass-through rate: Years 1-10 25.0% b. Base Year A.V. 246,054 + Years 11-30 21.0% c. Annual Growth/Resale: 2.00% + Years 31-45 14.0%
YearAssessed
Valuation(2)
(000s)
Gross Tax Increment
Housing Set-Aside
First Tier Pass Throughs
2nd Tier Pass Throughs
3rd Tier Pass Throughs
Total Pass Throughs
Total Available to Agency
Net Available for Non-Housing
Programs and Projects (000s)
Base(1) 246,0542009 250,975 49 10 10 10 39 302010 255,995 99 20 20 20 80 602011 261,114 151 30 30 30 120 902012 266,337 203 41 41 41 162 1222013 271,663 256 51 51 51 205 1542014 277,097 310 62 62 62 248 1862015 282,639 366 73 73 73 293 2202016 288,291 422 84 84 84 338 2532017 294,057 480 96 96 96 384 2882018 299,938 539 108 108 108 431 3232019 305,937 599 120 120 10 130 469 3492020 312,056 660 132 132 20 152 508 3762021 318,297 722 144 144 31 175 547 4032022 324,663 786 157 157 42 199 587 4302023 331,156 851 170 170 52 223 628 4582024 337,779 917 183 183 64 247 670 4872025 344,535 985 197 197 75 272 713 5162026 351,426 1,054 211 211 86 297 756 5462027 358,454 1,124 225 225 98 323 801 5762028 365,623 1,196 239 239 110 349 846 6072029 372,936 1,269 254 254 123 376 892 6392030 380,394 1,343 269 269 135 404 940 6712031 388,002 1,419 284 284 148 432 988 7042032 395,762 1,497 299 299 161 460 1,037 7372033 403,678 1,576 315 315 174 490 1,087 7712034 411,751 1,657 331 331 188 519 1,138 8062035 419,986 1,739 348 348 202 550 1,190 8422036 428,386 1,823 365 365 216 580 1,243 8782037 436,954 1,909 382 382 230 612 1,297 9152038 445,693 1,996 399 399 245 644 1,352 9532039 454,607 2,086 417 417 260 10 687 1,399 9812040 463,699 2,176 435 435 275 20 731 1,446 1,0112041 472,973 2,269 454 454 291 31 775 1,494 1,0402042 482,432 2,364 473 473 307 41 820 1,543 1,0712043 492,081 2,460 492 492 323 52 867 1,593 1,1012044 501,922 2,559 512 512 339 63 914 1,645 1,1332045 511,961 2,659 532 532 356 74 962 1,697 1,1652046 522,200 2,761 552 552 373 86 1,011 1,750 1,1982047 532,644 2,866 573 573 391 97 1,062 1,804 1,2312048 543,297 2,972 594 594 409 109 1,113 1,860 1,2652049 554,163 3,081 616 616 427 121 1,165 1,916 1,3002050 565,246 3,192 638 638 446 134 1,218 1,974 1,3362051 576,551 3,305 661 661 465 147 1,272 2,033 1,3722052 588,082 3,420 684 684 484 159 1,328 2,093 1,4092053 599,844 3,538 708 708 504 173 1,384 2,154 1,446Total $18,043,279 $69,708 $13,942 $13,942 $8,060 $1,317 $23,319 $46,390 $32,448
El Dorado County Redevelopment Feasibility Study Page 29
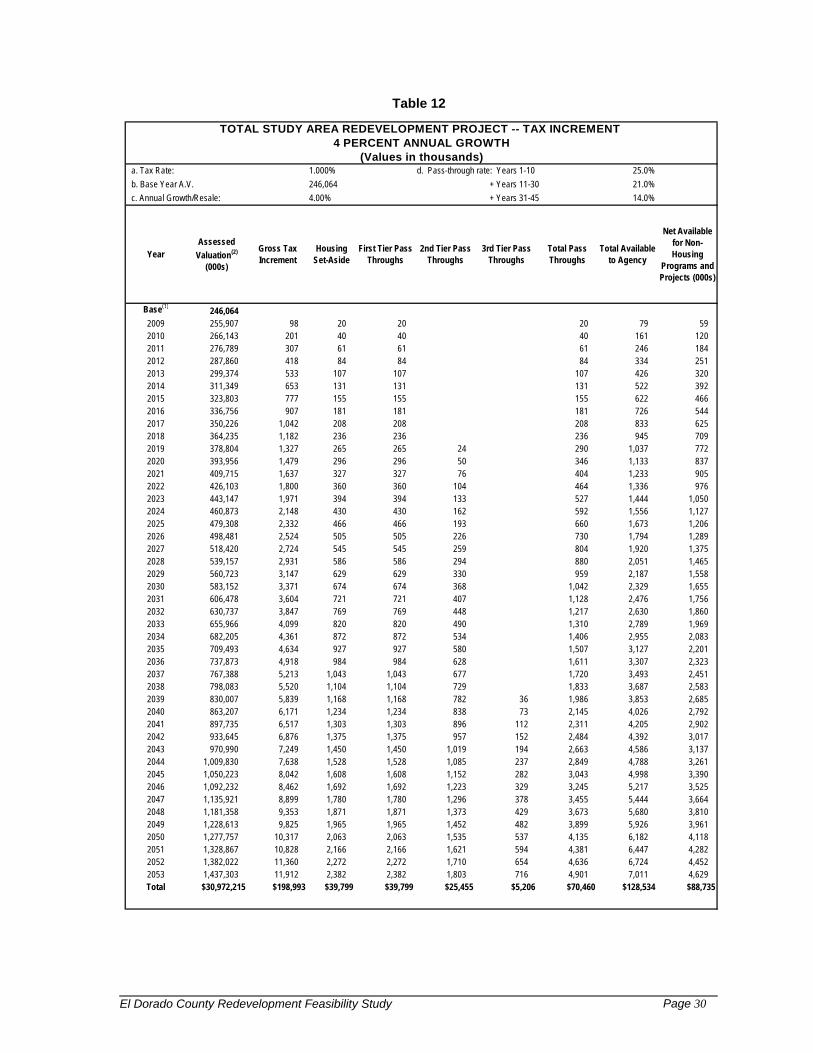
Table 12
TOTAL STUDY AREA REDEVELOPMENT PROJECT -- TAX INCREMENT 4 PERCENT ANNUAL GROWTH
(Values in thousands) a. Tax Rate: 1.000% d. Pass-through rate: Years 1-10 25.0% b. Base Year A.V. 246,064 + Years 11-30 21.0% c. Annual Growth/Resale: 4.00% + Years 31-45 14.0%
YearAssessed
Valuation(2)
(000s)
Gross Tax Increment
Housing Set-Aside
First Tier Pass Throughs
2nd Tier Pass Throughs
3rd Tier Pass Throughs
Total Pass Throughs
Total Available to Agency
Net Available for Non-Housing
Programs and Projects (000s)
Base(1) 246,0642009 255,907 98 20 20 20 79 592010 266,143 201 40 40 40 161 1202011 276,789 307 61 61 61 246 1842012 287,860 418 84 84 84 334 2512013 299,374 533 107 107 107 426 3202014 311,349 653 131 131 131 522 3922015 323,803 777 155 155 155 622 4662016 336,756 907 181 181 181 726 5442017 350,226 1,042 208 208 208 833 6252018 364,235 1,182 236 236 236 945 7092019 378,804 1,327 265 265 24 290 1,037 7722020 393,956 1,479 296 296 50 346 1,133 8372021 409,715 1,637 327 327 76 404 1,233 9052022 426,103 1,800 360 360 104 464 1,336 9762023 443,147 1,971 394 394 133 527 1,444 1,0502024 460,873 2,148 430 430 162 592 1,556 1,1272025 479,308 2,332 466 466 193 660 1,673 1,2062026 498,481 2,524 505 505 226 730 1,794 1,2892027 518,420 2,724 545 545 259 804 1,920 1,3752028 539,157 2,931 586 586 294 880 2,051 1,4652029 560,723 3,147 629 629 330 959 2,187 1,5582030 583,152 3,371 674 674 368 1,042 2,329 1,6552031 606,478 3,604 721 721 407 1,128 2,476 1,7562032 630,737 3,847 769 769 448 1,217 2,630 1,8602033 655,966 4,099 820 820 490 1,310 2,789 1,9692034 682,205 4,361 872 872 534 1,406 2,955 2,0832035 709,493 4,634 927 927 580 1,507 3,127 2,2012036 737,873 4,918 984 984 628 1,611 3,307 2,3232037 767,388 5,213 1,043 1,043 677 1,720 3,493 2,4512038 798,083 5,520 1,104 1,104 729 1,833 3,687 2,5832039 830,007 5,839 1,168 1,168 782 36 1,986 3,853 2,6852040 863,207 6,171 1,234 1,234 838 73 2,145 4,026 2,7922041 897,735 6,517 1,303 1,303 896 112 2,311 4,205 2,9022042 933,645 6,876 1,375 1,375 957 152 2,484 4,392 3,0172043 970,990 7,249 1,450 1,450 1,019 194 2,663 4,586 3,1372044 1,009,830 7,638 1,528 1,528 1,085 237 2,849 4,788 3,2612045 1,050,223 8,042 1,608 1,608 1,152 282 3,043 4,998 3,3902046 1,092,232 8,462 1,692 1,692 1,223 329 3,245 5,217 3,5252047 1,135,921 8,899 1,780 1,780 1,296 378 3,455 5,444 3,6642048 1,181,358 9,353 1,871 1,871 1,373 429 3,673 5,680 3,8102049 1,228,613 9,825 1,965 1,965 1,452 482 3,899 5,926 3,9612050 1,277,757 10,317 2,063 2,063 1,535 537 4,135 6,182 4,1182051 1,328,867 10,828 2,166 2,166 1,621 594 4,381 6,447 4,2822052 1,382,022 11,360 2,272 2,272 1,710 654 4,636 6,724 4,4522053 1,437,303 11,912 2,382 2,382 1,803 716 4,901 7,011 4,629Total $30,972,215 $198,993 $39,799 $39,799 $25,455 $5,206 $70,460 $128,534 $88,735
El Dorado County Redevelopment Feasibility Study Page 30

As required by Redevelopment Law, 20 percent of the tax increment revenues must be set-aside into a housing fund of the County for improving and expanding the supply of low- and moderate-income housing anywhere in the unincorporated County, as these housing funds are not restricted to the project area. As shown in the table, approximately $13.9 million under a two percent growth rate and $39.8 million under a four percent growth rate would be set-aside into this special fund over the 45-year redevelopment period.
In addition, Redevelopment Law requires an agency to pass through statutory amounts to the various taxing agencies, such as the schools and special districts that levy and collect property taxes in the project area and are not available to fund either housing or non-housing redevelopment activities. The basic statutory formula is a tiered payment where the County will receive more money at the beginning of the project and less money toward the end. This statutory agreement is the same for all taxing agencies and is not negotiated. Under the assumed two percent annual growth rate approximately $23.3 million of the total tax increment revenue is distributed to taxing agencies and $70.5 million under a four percent annual growth rate.
These projections must be reviewed with caution because property values do not always grow at a constant rate, but rather up or down depending on various economic factors. The recent short-term trend indicates that the total assessed property value of the county increased by an average annual rate of almost 12 percent. However, a continuation of double-digit growth rates is optimistic and unrealistic over the long-term. A two percent growth rate is conservative and a four percent growth rate is more realistic of long-term future trends.
Distribution of Tax Increment Revenues
While it is still uncertain how the County will distribute the future tax increment revenue, this study assumes that the focus of the County’s redevelopment program will be to improve the public infrastructure and implement economic development programs. Public improvement programs could include paving existing streets, constructing sidewalks and gutters, improving sewer facilities, installing stormdrains, and other infrastructure facilities. Additionally, tax increment revenues can be used to facilitate commercial and industrial rehabilitation, business assistance, attraction and retention programs, property acquisition and assemblage and business relocation. Other redevelopment programs may include housing acquisition and rehabilitation. These programs would be in addition to the 20 percent housing set-aside funds from tax increment that must be used for rehabilitation and/or development of low- and moderate-income housing in the unincorporated County.
Table 13 illustrates the possible allocation of tax increment revenues into various redevelopment programs for the future project area.
El Dorado County Redevelopment Feasibility Study Page 31
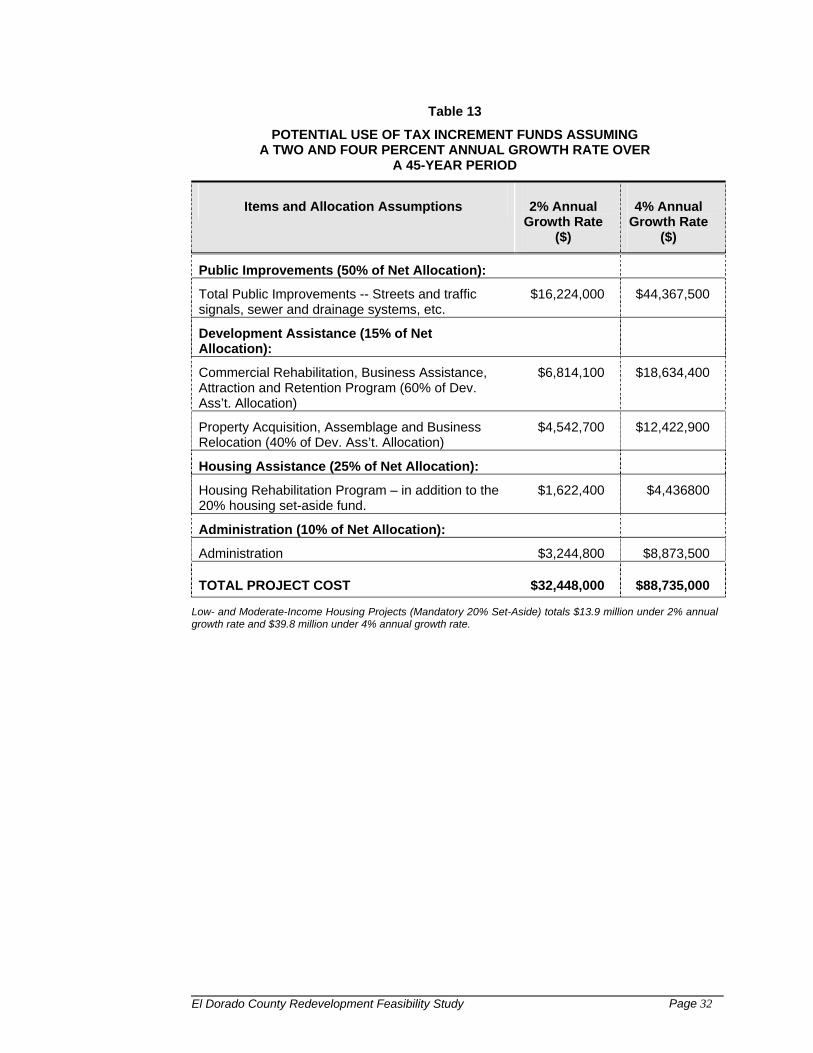
Table 13
POTENTIAL USE OF TAX INCREMENT FUNDS ASSUMING A TWO AND FOUR PERCENT ANNUAL GROWTH RATE OVER
A 45-YEAR PERIOD
Items and Allocation Assumptions 2% Annual Growth Rate
($)
4% Annual Growth Rate
($)
Public Improvements (50% of Net Allocation):
Total Public Improvements -- Streets and traffic signals, sewer and drainage systems, etc.
$16,224,000 $44,367,500
Development Assistance (15% of Net Allocation):
Commercial Rehabilitation, Business Assistance, Attraction and Retention Program (60% of Dev. Ass’t. Allocation)
$6,814,100 $18,634,400
Property Acquisition, Assemblage and Business Relocation (40% of Dev. Ass’t. Allocation)
$4,542,700 $12,422,900
Housing Assistance (25% of Net Allocation):
Housing Rehabilitation Program – in addition to the 20% housing set-aside fund.
$1,622,400 $4,436800
Administration (10% of Net Allocation):
Administration $3,244,800 $8,873,500
TOTAL PROJECT COST $32,448,000 $88,735,000
Low- and Moderate-Income Housing Projects (Mandatory 20% Set-Aside) totals $13.9 million under 2% annual growth rate and $39.8 million under 4% annual growth rate.
El Dorado County Redevelopment Feasibility Study Page 32
IV. CONCLUSION
This final section presents the major options available to the County to improve the physical and economic conditions in the Study Areas.
Recommendations Based on the results of the survey, GRC’s opinion is that the Georgetown, Diamond
Springs, El Dorado, Somerset/Mt. Aukum, Meyers and portions of Shingle Springs and Missouri Flat Study Areas meet the Redevelopment Law’s conditions for including properties within a redevelopment project area. Portions of Missouri Flat could be included into the Diamond Springs Study Area. It is recommended that the County consider a redevelopment effort because it is the primary tool available to address and eliminate adverse conditions in the various communities. The County should be authorized to use its redevelopment powers, including the ability to collect tax increment, to improve physical and economic conditions in the Study Areas.
In the short-term (within the first five years from Redevelopment Plan adoption), the generation of tax increment will be marginal. However, in the long-term (after 15 years), the County could benefit from a revenue source of approximately $31.9 million over a 45-year period assuming a conservative two percent annual growth rate in assessed property value. The tax increment revenues should be used to support and implement housing, capital improvement and economic development programs.
Start the redevelopment plan adoption process as early as possible for those study areas in greatest need, such as Georgetown and Camino where the existing sewer facilities are inadequate. Generally the adoption process will take approximately one year. The process includes the selection of a project area, documentation of blight, preparation of a legal description and map, environmental analysis in the form of an Environmental Impact Report (EIR), a public participation process and a joint public hearing.
Perhaps the most controversial issue facing any redevelopment agency is the use or perceived use of “eminent domain”. The County may consider the use of eminent domain powers, if necessary and as a last resort, to acquire real property within the designated project area for the purpose of assembling lots for development. Should the agency authorize the use of eminent domain powers, it is recommended that eminent domain apply only to non-residential uses. In addition, clear and accurate information about the use and benefits of eminent domain powers must be highlighted to the community. The benefits of eminent domain or condemnation include: 1) establishes a fair-market value by a third party; 2) allows the transfer of the property tax base if comparable property is found in the same county; 3) defers the capital gains tax for two years; and 4) allows the County to assemble properties when one property owner adversely impacts a potential development that could benefit the community.
It is critical for the success of the redevelopment program, that the residents, property owners and tenants fully understand the public benefits of redevelopment and are aware of the County’s intent from the very start of the project. To gain the support of the community and minimize the adverse impact of rumors, the most effective method is to provide simple and accurate information through an extensive
El Dorado County Redevelopment Feasibility Study Page 33

community outreach program. This program should be on-going throughout the adoption process.
Perhaps the key finding of this study is the need to redefine the boundaries of the Study Areas in order to meet the 80 percent urbanization requirement set forth in Redevelopment Law. It is recommended that vacant land along the perimeters of some of the Study Areas and newer commercial developments, such as those recently constructed in the Missouri Flat Study Area, be excluded from the proposed project area if this redevelopment project is to succeed.
Next Step
The process to adopt one or two initial redevelopment project areas – if the County so chooses – will take approximately one year. The length of the adoption process may vary according to the level of controversy, the environmental review process, and the scale of the public participation program.
The formation of a redevelopment project area follows a process established under Redevelopment Law. The adoption process includes the following key steps:
Designation of a survey area. The Study Areas identified in this study could serve as the survey area.
Selection of a project area based on the blight assessment.
Preparation and approval of the Preliminary Plan, Preliminary Report, Redevelopment Plan, Owner Participation Rules, Methods for Relocation and the Report to the Board of Supervisors. The adoption of the Redevelopment Plan will occur at a Joint Public Hearing of the Agency Board and the County Board of Supervisors.
Preparation and certification of an environmental documentation required under Redevelopment Law and the California Environmental Quality Act (CEQA). For a new project area, an Environmental Impact Report (EIR) is required.
Implementation of a public participation program with residents, tenants, property owners and taxing agencies.
A summary and schedule of key milestones in the redevelopment plan adoption process is presented below.
El Dorado County Redevelopment Feasibility Study Page 34

PRELIMINARY REPORT&
FINANCIAL PROJECTIONS
PRELIMINARY REPORT&
FINANCIAL PROJECTIONS
LIGHT ANALYSIS/SELECTION OFPROJECT AREA
SELECTION OFPROJECT AREA
PLAN ADOPTIONPLAN ADOPTION
JOINT PUBLIC HEARINGFINAL REDEVELOPMENT
PLAN & EIR
JOINT PUBLIC HEARINGFINAL REDEVELOPMENT
PLAN & EIR
DRAFT REDEVELOPMENTPLAN & DRAFT EIR
DRAFT REDEVELOPMENTPLAN & DRAFT EIR
Public Hearingon Draft EIR
2nd Series ofCommunityMeetings
Joint PublicHearing
MONTHS KEY STEPS PUBLIC INPUT
1st Series ofCommunityMeetings
El Dorado County Redevelopment PlanAdoption Process
1
3
8
11
12
.
Initial Community Workshop
El Dorado County Redevelopment Feasibility Study Page 35