eindhoven university of technology master comparing … fileeindhoven, september 2013 bsc....
TRANSCRIPT

Eindhoven University of Technology
MASTER
Comparing out of the box ERP and best practice processes for the utilities industry
a study of a new ERP implementation method using goal based process comparisonand process documentation within the ERP system
Tollenaere, Y.S.B.
Award date:2013
DisclaimerThis document contains a student thesis (bachelor's or master's), as authored by a student at Eindhoven University of Technology. Studenttheses are made available in the TU/e repository upon obtaining the required degree. The grade received is not published on the documentas presented in the repository. The required complexity or quality of research of student theses may vary by program, and the requiredminimum study period may vary in duration.
General rightsCopyright and moral rights for the publications made accessible in the public portal are retained by the authors and/or other copyright ownersand it is a condition of accessing publications that users recognise and abide by the legal requirements associated with these rights.
• Users may download and print one copy of any publication from the public portal for the purpose of private study or research. • You may not further distribute the material or use it for any profit-making activity or commercial gain
Take down policyIf you believe that this document breaches copyright please contact us providing details, and we will remove access to the work immediatelyand investigate your claim.
Download date: 17. Jul. 2018

Eindhoven, September 2013
BSc. Electrical Engineering — TU/e 2011
Student identity number 0596377
in partial fulfilment of the requirements for the degree of
Master of Science
in Operations Management and Logistics
Supervisors:
dr.ir. H. Eshuis, TU/e
dr.ir. A.J.D. Lambert, TU/e
Comparing out of the box ERP and
best practice processes for the
utilities industry.
A study of a new ERP implementation method using goal
based process comparison and process documentation
within the ERP system.
By:
Yannick S.B. Tollenaere

1
TUE. School of Industrial Engineering.
Series Master Theses Operations Management and Logistics
Subject headings: processes, enterprise resource planning, energy market, information systems
implementation

2
Acknowledgements This report is the result of my master thesis project, conducted in partial fulfillment for the degree of
Master of Science in Operations Management and Logistics at Eindhoven University of Technology. The
research is conducted at Avanade in Almere, the Netherlands.
I would like to use this opportunity to express my gratitude to a number of people who have helped me
during my Master and thesis research. First of all this would be my mentor dr. ir. Rik Eshuis who during
the past two years has guided me in the choices made. He enabled me to raise the bar and always tried to
find ways to improve my results by using informative discussions that forced me to be critical and
evaluate the results so far and look for possibilities to improve them. I would like to thank dr. ir. Fred
Lambert, my second supervisor, for the pleasant discussions and the new perspectives I would get from
our meetings, even though we only met a few times.
At Avanade I would like to thank Richard van Os for the possibility and freedom he gave me to prove
myself and discover the consulting world. Gijs Ramakers I would like to thank for his guidance
throughout my internship. I’m also thankful to Philip Wagenaar, Hans Jonkman and the other colleagues
who have helped me during my internship.
I wouldn’t have been able to get to this point without my friends and study buddies through the years; so
also thank you to: Sven, Jan, Tim, Robin, Marco, Lonneke, Koen, Bart, Charl, Elien, Gert and all those
who I had the pleasure to get to know at the university.
The most gratitude however I must express to my parents, grandparents, and little brother for their
support, love and patience throughout the years. Thanks for supporting my decisions and giving me the
possibilities to discover the world and myself. This has made it possible for me to become who I am
today, from the bottom of my heart, thank you for that!
Yannick Tollenaere
Eindhoven, September 10, 2013

3
Summary This document describes the research performed on a new Enterprise Resource Planning (ERP)
implementation method called RapidResults. The implementation method is developed by the IT
consulting company Avanade. Avanade intends to use the method for the Microsoft ERP solution
Dynamics AX. Current ERP implementations based on Dynamics AX are often highly customized to
specific organizations and processes. The current implementation projects are because of this flexibility
relative long and have only limited specific business knowledge out of the box. The business knowledge
in these implementations mostly comes from the organization implementing the system and the
consulting company.
The RapidResults implementation method intends to improve the business knowledge in the out of the
box ERP implementations by adding more and better best practice processes to the ERP system. The
processes are added to the system during the implementation using a business process modeling (BPMN)
tool called RapidValue, developed by a third party. This enables implementations that are more standard
and providing the ERP system on “Software as a Service” (SaaS) base with short implementation times
and strong out the box processes. The business processes added to the solution are industry specific and
originate from management consulting experience from Accenture.
The utilities industry is one of the industries for which a RapidResults ERP implementation is developed.
The utilities industry produces transports and, sells power and energy (electricity, gas, water, heat) to
consumers (B2C) and business customers (B2B). This research focusses on the ERP solution for B2C
utilities suppliers. The HPUM is a best practice process architecture for the utilities industry developed by
Accenture. The RapidResults method intends to add these processes to the utilities specific ERP add-on
“MECOMS”, developed by a third party as well. The MECOMS system can handle all contracts,
customer information, meter data, billing, credit and utility settlement processes for the organizations.
The BPMN modeling tool RapidValue is a part of the Dynamics AX ERP system and does not work
stand-alone. All BPMN activities can be linked to the relevant ERP forms and tables; clicking on BPMN
activities opens the required ERP-form for the user. The tool can automatically generate all
documentation required to execute the processes. This should improve the implementation project and
process knowledge transfer according to the developers of the tool.
This research intends to determine if the best practice HPUM models are a valuable addition to the ERP
system over the standard out of the box MECOMS processes and if the claims that the BPMN modeling
tool is able to transfer this knowledge is valid. The results will provide arguments to motivate the use of
the process models and modeling tool by utilities organizations while implementing the Dynamics
AX/MECOMS ERP solution.
The HPUM and MECOMS processes are modeled for different audiences, the HPUM processes target a
management/business audience and include all actions and activities of utility processes, not only
activities related to an ERP system. The MECOMS processes on the other hand are pure ERP processes
targeted at a more technical audience and describe only activities executed in the ERP system. What
happens outside the system is included in HPUM but not in MECOMS. This makes it not possible to
compare the processes 1 to 1 in for example simulations.
For this reason, the comparison is made on a higher (macro) level by looking at the goal performance of
the utilities processes. Goal performance provides information about the ability of a process to meet the

4
goals of different stakeholders. The utilities organizations are selected as the stakeholder in this research.
Goals for the processes are derived on three hierarchical levels; strategic, tactical and operational. The
goals originate from market research, utilities reports, financial records and expert opinions.
The strategic goals for the utilities organizations are: reducing the cost to serve and improving customer
satisfaction. The cost to serve is an important performance measure in the utilities industry. In the
deregulated market, the cost to serve is among the only things utilities suppliers can compete on. The
customer satisfaction is important to prevent customers from switching to other utilities suppliers before
the account has become profitable. To the strategic goals, tree operational goals are related; have the
ability to meet regulatory demands, reduce customer churn and have high product flexibility. Products for
utilities organizations are both utility and non-utility products (for example; smart thermostats, energy
conserving products and advice, home isolation etc.) The achievement of these goals determines the
expected performance of utility processes.
The HPUM processes are modeled using the BPMN modeling tool in the ERP system and validated by
utilities experts. The MECOMS processes are extracted from the user manuals of the ERP system and
modeled in BPMN. The validation determines if the processes do what they are intended to do and if they
are still valid. The process will have to meet current regulatory demands and are up to date with the
current requirements of the industry. For all the processes, the goal accomplishment is discussed. This
determines which goals are important for specific processes and can identify critical problems related to
the goal accomplishment of certain processes. This research limits the scope of the processes to a number
of important utility processes relating to customer data management, billing and products.
Two surveys determine the expected goal performance and importance for every process on all 14 goals.
In addition, the performance of the process on four other dimensions is scored: time, cost/effort,
flexibility, and quality. These four orthogonal dimensions are the “devil’s quadrangle” and are able to
score the performance of a process. The theory behind it states that the area span by the four criteria
cannot change. Improving one dimension will result in a lower score of the other dimensions. The
combination of the expected goal performance and the score on the devil’s quadrangle compares the
HPUM processes with their equivalent MECOMS processes. Next the results are aggregated in order to
compare the HPUM and MECOMS processes as a whole.
HPUM outperforms the MECOMS processes on goal achievement and quality. MECOMS outperforms
HPUM on the cost/effort, time, and flexibility dimensions. One HPUM process in the scope is outdated
and for this reason dropped from the comparison. One MECOMS process is dropped because no HPUM
equivalent is present. Overall it can be concluded that the HPUM processes are better able to meet the
goals of utilities organizations and customizing the ERP system to be able to support the processes will
result in a better ERP solution for the utilities organizations.
There still are gaps between the MECOMS system and the HPUM processes. In most of these cases, the
ERP system does not yet support the order of execution of HPUM activities. The ERP system will have to
be customized to certain extend in order to close the gaps.
For the second part of the research an experiment tests the claim of the BPMN modeling tool supplier that
the tool is able to better communicate process knowledge. Three out of the box MECOMS processes are
modeled in the BPMN tool with the BPMN activities linked to the relevant ERP forms. The experiment
cannot use HPUM processes because of gaps still present between the current MECOMS version and the
HPUM processes. A group of junior ERP consultants with no utilities knowledge is asked to perform the

5
tasks described in the processes. They have the modeling tool with the process models linked to the ERP
system and the process description at their disposal. The control group has the same assignments but uses
the standard ERP documentation. The group with the process models is better able to perform the task.
They require less help, make fewer errors and complete the task faster.
At the end of the experiment, the subjects rate the process models on readability, ease of use,
understandability and completeness. The subjects provide feedback on the process models and indicate in
which situations they consider the models and the modeling tool useful. The main advantage is expected
to be experienced in communicating with key users during the implementation and after the going live of
the ERP system. The models provide a process-oriented view of the system as a whole, rather than a
transaction-oriented view that is classically given by ERP documentation. Key users are expected to get a
better view of the system and how it works using the BPMN models. The BPMN models and the tool
score higher on all four the criteria.
The conclusion of this research is that the HPUM models are a valuable addition to the ERP solution and
can include better business knowledge to the ERP solution. The BPMN modeling tool used during the
implementation to capture these processes is expected to be able to transfer the process knowledge to end-
and key-users better than the standard ERP documentation.
6
Contents Acknowledgements ....................................................................................................................................... 2
Summary ....................................................................................................................................................... 3
List of figures ................................................................................................................................................ 8
List of tables .................................................................................................................................................. 9
List of Definitions ....................................................................................................................................... 10
1. Introduction ......................................................................................................................................... 11
1.1. Background ................................................................................................................................. 12
1.1.1. Avanade .............................................................................................................................. 12
1.1.2. Utilities ................................................................................................................................ 12
1.1.3. Microsoft Dynamics AX and MECOMS ............................................................................ 13
1.1.4. High Performance Utility Model (HPUM) ......................................................................... 14
1.2. Problem description .................................................................................................................... 15
1.2.1. As-is situation ..................................................................................................................... 15
1.2.2. To-Be situation .................................................................................................................... 16
1.3. Research objectives ..................................................................................................................... 17
1.4. Constraints and requirements ...................................................................................................... 18
1.5. Research questions ...................................................................................................................... 19
1.6. Processes in scope ....................................................................................................................... 19
1.7. Method ........................................................................................................................................ 20
1.8 Report structure ................................................................................................................................. 21
2. Goals for utilities processes ................................................................................................................ 23
2.1. Method ........................................................................................................................................ 23
2.2. Utilities goals .............................................................................................................................. 23
2.2.2. Conclusion .......................................................................................................................... 31
3. MECOMS process evaluation ............................................................................................................. 33
3.1. Method ........................................................................................................................................ 33
3.2. High level process description: Process lifecycles ...................................................................... 34
3.3. Process description and expert opinion ....................................................................................... 34
3.4. Conclusion .................................................................................................................................. 40
4. HPUM process evaluation .................................................................................................................. 41
4.1. Method ........................................................................................................................................ 41
4.2. Process description and expert opinion ....................................................................................... 41

7
4.3. Conclusion .................................................................................................................................. 46
5. Expected process performance comparisons. ..................................................................................... 47
5.1. Background ................................................................................................................................. 47
5.2. Method ........................................................................................................................................ 48
5.3. Survey results .............................................................................................................................. 51
5.4. Conclusion .................................................................................................................................. 55
6. The use of RapidResults BPMN models. ............................................................................................ 57
6.1. Background on BPMN models in RapidResults ......................................................................... 57
6.2. Method ........................................................................................................................................ 58
6.3. Experiment results ...................................................................................................................... 59
6.4. Conclusion .................................................................................................................................. 60
7. Conclusions and further research ........................................................................................................ 62
7.1. Future research ............................................................................................................................ 64
7.2. Recommendations for Avanade .................................................................................................. 64
Bibliography ............................................................................................................................................... 65
List of Appendixes ...................................................................................................................................... 68

8
List of figures Figure 1 - HPUM level 5 example ............................................................................................................. 14
Figure 2 Goal model Dark green: make, Light green: help, red: hurt, dark red: break, orange neutral. ..... 27
Figure 3 Cost to serve ................................................................................................................................. 30
Figure 4 Devil's Quadrangle ....................................................................................................................... 48
9
List of tables Table 1 Implementation methodologies ..................................................................................................... 15
Table 2 Goal relations ................................................................................................................................. 28
Table 3 Process lifecycles ........................................................................................................................... 34
Table 4 Process Hierarchy .......................................................................................................................... 42
Table 5 Process mapping ............................................................................................................................ 52
Table 6 Goal Realization ............................................................................................................................ 52
Table 7 Goal mapping ................................................................................................................................. 53
Table 8 Dimension weight factors .............................................................................................................. 53
Table 9 MECOMS Process score................................................................................................................ 54
Table 10 HPUM process score.................................................................................................................... 54
Table 11 Enterprise score ............................................................................................................................ 54
Table 12 Devil's quadrangle score .............................................................................................................. 55
Table 13 Process closeness ......................................................................................................................... 55
Table 16 Experiment results ....................................................................................................................... 59
Table 17 Documentation feedback ............................................................................................................. 59

10
List of Definitions Accenture An international consulting corporation, owner of Avanade
Avanade An international IT consulting organization owned by Accenture and
Microsoft
B2B Business to Business
B2C Business to Consumer
Commodity Utility product
Cost to serve All costs associated to delivering products / service to a customer apart from
the actual production cost of the products / service. See 7.1 Goals for utilities
processes
Customer Consumer or Business buying products or services from the utilities
organizations
Dynamics AX A Microsoft ERP package
Ferranti Independent Software Vendor, developer of the MECOMS system
HPUM High Performance Utilities Model, a reference architecture of best practice
processes for utilities suppliers by Accenture
MECOMS Additional package by Ferranti Computers NV adding utilities functionality to
Dynamics AX
Non-utility product Product or service sold to customers by utilities suppliers other than utilities
products. For example thermostats, energy efficiency counseling etc.
RapidResults New ERP implementation method from Avanade.
RapidValue A BPMN modeling tool within the Microsoft Dynamics AX, it does not work
stand alone. In the tool ERP forms and tables can directly be linked to BPMN
activities. The organization and roles are modeled within the system and
process documentation and project deliverables can automatically be
generated.
Utilities supplier Utilities organization selling utilities to customers
Utility product Energy sold to a customer (B2B or B2C); gas, electricity, heat, water.

11
1. Introduction In order to a fulfill the requirements of the Master of Science program of industrial Engineering for the
master Operations Management and Logistics at Eindhoven University of technology a graduation
project has to be performed by the master students. I have chosen to perform my project at the IT
consulting and software company Avanade in Almere, the Netherlands.
This report is the result of a 6-month research project at Avanade and Eindhoven University of
technology. The research itself has two sponsors; the university and the company Avanade. For the
university the goal of this research is to generate scientific knowledge, with a solid foundation and
contribution to the scientific knowledgebase. For the company the research needs to be useful in its
operations and contribute to the organizational goals.
Avanade is developing a new delivery method for the Microsoft Dynamics AX ERP system called
RapidResults. A delivery method describes the phases of an implementation project, deliverables and
work done during the implementation. The delivery method is different from the old method in two very
distinct ways. First of all Avanade wants to include more industry knowledge, and processes within the
system than is currently the case in order to create additional value to the customers. In order to
accomplish this Avanade is willing to leverage on industry knowledge available within its owner;
Accenture. Accenture has a large amount of processes, process architectures and practices based upon
years of consulting experience that could be a valuable contribution to the ERP solution.
The second distinction is the use of a BPMN model tool called RapidValue in the implementation project.
The tool is used to model the business processes and (automatically) generate documentation and project
deliverables. The models can directly be linked to ERP functionality. Clicking on a BPMN activity opens
the relevant ERP form or table and provides the user with information on how to execute the activity. The
modeling tool should speed up the design phases of the implementation and provides more opportunities
for reusing models and documentation according to the developers.
Avanade is interested in determining if the addition of the new process models instead of the (limited)
standard ERP processes is valuable to the end user. If the new processes are valuable additions to the
system this will require customizations to the out of the box solution in order to support the new
processes. In addition, the potential use of the RapidValue modeling tool by the organization
implementing the ERP system after the system has gone live needs to be determined. This provides
arguments that Avanade can give to possible leads who are interested in implementing an ERP system
and motivate them to choose for Avanade and the RapidResults method.
The delivery method RapidResults is under development for different industries by teams around the
world. One of these industries is the utilities industry. The utilities solution is assigned to the Netherlands
and is based on a specific ERP system for the industry called MECOMS; a plugin to the Microsoft
Dynamics AX system. The best practice solution HPUM, the High Performance Utilities Model by
Accenture, is the best practice process architecture investigated to determine the advantages of the
process models to utilities organizations.
This report is interesting to read for those who are working with the RapidResults implementation method
and need a method to compare the best practice architectures of their solution with the out of the box
processes. It is also able to provide arguments on the usability of the RapidValue modeling tool in the

12
communication with key and end users. The method used to compare the process architectures is also
useful in other settings in which processes need to be compared at a macro level.
The research proposal and literature study done prior to this research are included in the appendix of this
report as appendix 1 and 2.
For confidentiality reasons not all appendixes are included in the public version of this report. Please
contact the author for further information.
1.1. Background
In order to provide a clear view on the background of this research project this section will provide a short
introduction to four main theme’s in this report. First the corporate sponsor, Avanade, is introduced. The
second part introduces the utilities industry. The third section describes the ERP system under research,
Microsoft Dynamics AX with the MECOMS utilities add-on. The fourth section provides an introduction
on the best practice reference architecture: High Performance Utilities Model (HPUM).
1.1.1. Avanade
Avanade is a consulting company providing solutions based on inside knowledge, innovation and deep
knowledge of the Microsoft technology in seven service lines: Enterprise Resource Planning (Microsoft
Dynamics AX), Application development, Collaboration, Business Intelligence, Customer Relation
Management, Managed services (Outsourcing), Technology infrastructure
The company operates in more than 20 countries. The headquarters in the Netherlands is located in
Almere and corporate headquarters are in Seattle, WA., USA. The global headcount is 18000, the
company was founded in 2000 and opened office in the Netherlands in 2004. The company is a joint
venture of Accenture and Microsoft and is a value added reseller of the Microsoft products and develops
custom solutions based on the Microsoft platform.
1.1.2. Utilities
The ERP system under investigation in this process is designed for the utilities industry. The following
section provides background information about the utilities market. The utilities are commodity products
such as electricity, gas, heat and water sold and delivered to customers. Utilities organizations are split
into different categories;
Utilities producers (plant owners like Vattenfall, RWE, Eneco),
Transport grid operators (owners of nationwide transportation grids like TenneT and GasUnie),
Distribution grid operators (local distributors such as Liander, Enexis and Endinet),
Utilities suppliers (organization that sells the utilities to customers such as Nuon, Essent, de
Nederlandse energie maatschappij and Oxxio)
The deregulation of the utilities market in Europe has led to an intensified competition in the market. The
United Kingdom, Ireland and the Netherlands in particular show a very competitive market as a result of
liberalizations in which suppliers are under constant pressure to remain profitable and churn rates are high
(Datamonitor, Oct. 2011). In the liberalized market there will always be a natural inclination to go for the
most affordable tariff and secure this option for a fixed period. New companies have entered the market,
resulting in more competition among existing companies to retain their customers.

13
Other European countries such as Belgium, Finland and Norway show smaller churn rates; in the Belgian
example this is due to the inefficient and inconvenient switching processes. In general a greater degree of
liberalization has led to higher churn rates; fueled by the lower prices offered by competing utility
companies and insufficient innovation in the products and services provided by the dominant supplier
(Datamonitor, Dec. 2011).
Previously utilities suppliers in Europe followed cost-based models for energy retail, focusing solely on
the purchase and sale of electricity and gas, which was made possible due to the dominant hold of a single
player over a market. The deregulation has forced suppliers to adapt a more service-based model
(Datamonitor, Dec. 2011). The additional services provided by suppliers have the potential to be more
profitable, as the investments required are usually far less than those related to the purchase or generation
of electricity. Examples of such services for consumers include training, energy audits, maintenance, etc.
Non-utility products are for example: smart thermostats, home isolation products, energy saving
appliances and many more. In the remainder of this report, both the non-utility products and services will
be addressed as non-utility products. The utilities supplier acts as a one-stop-shop for consumers and
facilitates the retention of customers for the utilities organizations. This innovative strategy is for example
confirmed by Vattenfall (Vattenfall, 2013) .
Energy retailers are increasingly introducing innovative, customer-friendly services. Services like loyalty
schemes, grants, and financial services such as loans and insurance not only attract new customers but
also help to retain existing customers. Loyalty schemes for staying with a supplier and grants for home
insulation are straightforward ways of promoting customer retention in a liberalized market where
customers have the choice of supplier (Datamonitor, Dec. 2011).
The service-oriented strategy of the utilities suppliers has imposed new requirements on the information
systems used in the organizations to provide these services.
1.1.3. Microsoft Dynamics AX and MECOMS
ERP systems by different vendors execute the majority of the utilities processes. In this study one of the
ERP systems by Microsoft, Microsoft Dynamics AX, is investigated. This section introduces the ERP
system and the specific utilities solution MECOMS.
Microsoft has a number of ERP systems on the market. Within the Microsoft Dynamics line, AX is the
ERP system designed for larger organization in the enterprise market. The system includes all common
ERP functionality such as; General Ledger, Bank Management, Customer Relationship Management,
Accounts Receivable, Accounts Payable, Inventory Management, Master Planning, Production, Product
Builder, Human Resources and Project Accounting.
A typical characteristic of Microsoft Dynamics AX is the highly flexible design. The solution is in the
current situation many cases tailored to the organization using a large number of parameters and
configuration settings. The object oriented programming language supports the tailoring of the out of the
box system.
Using independent software vendors (ISVs) Microsoft offers functionality for specific industries is
included in the system. These packages developed separately by ISVs are added to the ERP system. For
the utilities and energy industry a plugin for Dynamics® AX is MECOMS developed by Ferranti.
MECOMS stands for: MEtering and COntract Management System; this name roughly describes the
included functionality. It is a business support system combining meter data management and a customer

14
information system for different types of commodities; electricity, gas, water and heat. MECOMS
supports utility specific processes. These processes are rather generic and not documented detailed.
The MECOMS processes documented in the user manuals are rather limited. They describe how and in
which order organizations should execute tasks in the system. Activities or tasks outside the system are
out of scope in the MECOMS documentation.
1.1.4. High Performance Utility Model (HPUM)
The High Performance Utility Model (HPUM) is a best practice reference architecture for utilities
organizations from Accenture. It contains over 500 models for utilities organizations. The processes
originate from past projects and used to help utilities organizations to assess their performance. The
HPUM has 6 hierarchical levels; the first 4 levels (1 until 4) provide a function based hierarchical division
of the different processes. On level 5 and 6 flows are defined using event driven process chains (EPC’s).
In most cases the models on level 6 are SAP specific and harvested directly from past implementations
(Accenture, 2009). Error! Reference source not found. gives an example of a level 5 HPUM flow; for
confidentiality reasons this is not the complete process.
The HPUM contains models for almost all processes related to the utilities industry. A large number of
these processes however is not related to ERP systems or systems. The processes related to utilities
specific ERP systems are mostly grouped in the
level 1 platforms: “core operations & services”,
“field requests” and “customer advocacy”.
HPUM processes should according to experts be
used as blueprints or reference material for
utilities organizations to guide them through
process (re-)design projects. In this way the
currently used processes in the organizations
should be combined with knowledge and
experience from the HPUM and provide
benchmarking information. Completely
replacing processes by the HPUM is in most
cases not a preferred method. Although the
processes can be used to fill gaps of missing
processes which might not yet be used in an
organization or can provide a guideline in the
process standardization movement, which is
initiated by utilities organizations (Vattenfall,
2013).
Appendix 23 provides an overview of the
HPUM on levels 1 and two. For the lower levels
the process flows are also present in the
appendixes. Chapter 4 refers to the specific models as well.
Figure 1 - HPUM level 5 example
15
1.2. Problem description
This section introduces the objective of this research by giving the problem description. The next section
provides the actual objectives. The problem is described in the as-is situation which can be compared with
the desired outcome, the to-be situation, of the research. Information which will be gathered will
determine if and to which extent the proposed to-be situation is an improvement of the as-is situation.
1.2.1. As-is situation
Currently Avanade had developed methods and process methodology to deliver ERP systems to the
implementing organizations. These define project phases and guide the execution of the project. This
section provides the current situation for the delivery of ERP systems in general.
Avanade has two distinct delivery methods to implement ERP systems; the regular implementation
method (ACM), which describes how projects are executed and which deliverables should be produced.
This methodology should provide guidance to the consultant during the implementation. This
implementation method results in a custom tailored ERP system, customized for a specific organization.
The second method is the “Fast Implementation Track” (F.I.T.) in which a standardized ERP system is
implemented out of the box. Many items are pre-configured with standard datasets and much is
practically ready to go. This method is available for most common used ERP modules. Avanade wants to
update the second method into a new more flexible method called RapidResults; which is currently under
development. This method aims to bridge the gap between regular implementations and the Fast
Implementation Track, making the ERP solution non-standard and tailored for the specific organization,
while at the same time being able to deliver in a highly structured and standardized way. RapidResults
aims to add industry knowledge to the implementation. Using industry specific best practices, built on
Avanade and Accenture experience in order to add value to the ERP solution. The best practice processes
are documented using BPMN models in a BPMN modeling tool included in the ERP system called
RapidValue.
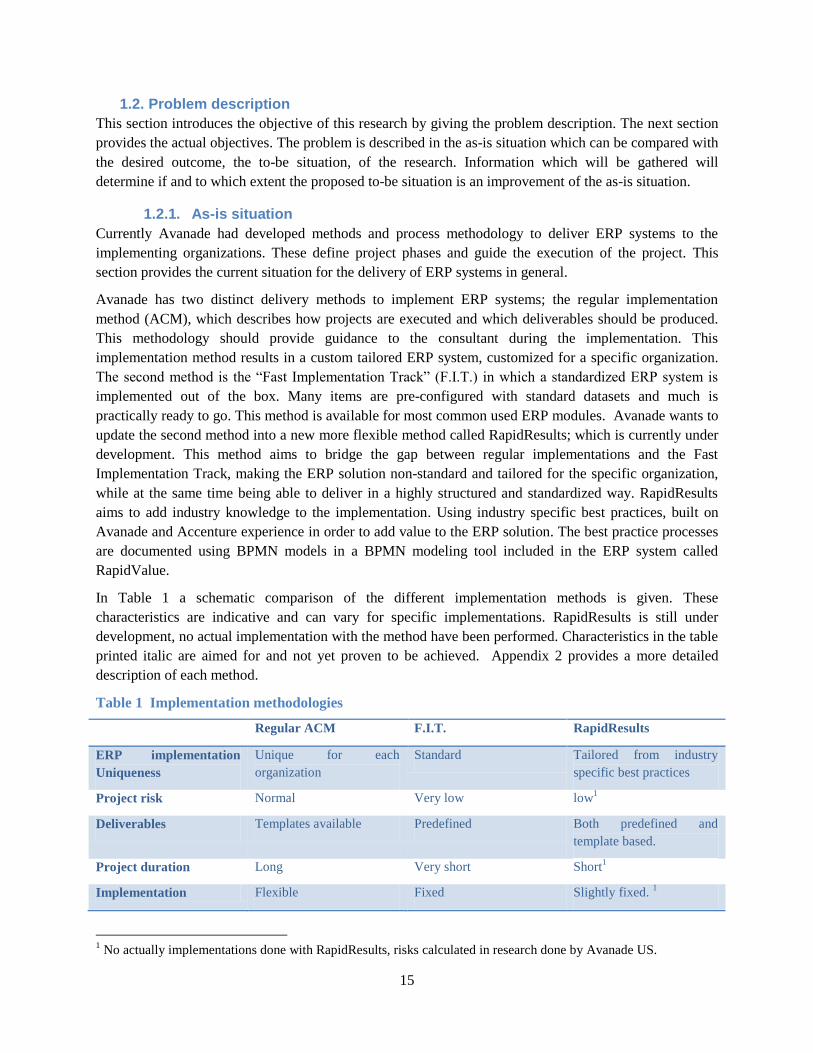
In Table 1 a schematic comparison of the different implementation methods is given. These
characteristics are indicative and can vary for specific implementations. RapidResults is still under
development, no actual implementation with the method have been performed. Characteristics in the table
printed italic are aimed for and not yet proven to be achieved. Appendix 2 provides a more detailed
description of each method.
Table 1 Implementation methodologies
Regular ACM F.I.T. RapidResults
ERP implementation
Uniqueness
Unique for each
organization
Standard Tailored from industry
specific best practices
Project risk Normal Very low low1
Deliverables Templates available Predefined Both predefined and
template based.
Project duration Long Very short Short1
Implementation Flexible Fixed Slightly fixed. 1
1 No actually implementations done with RapidResults, risks calculated in research done by Avanade US.
16
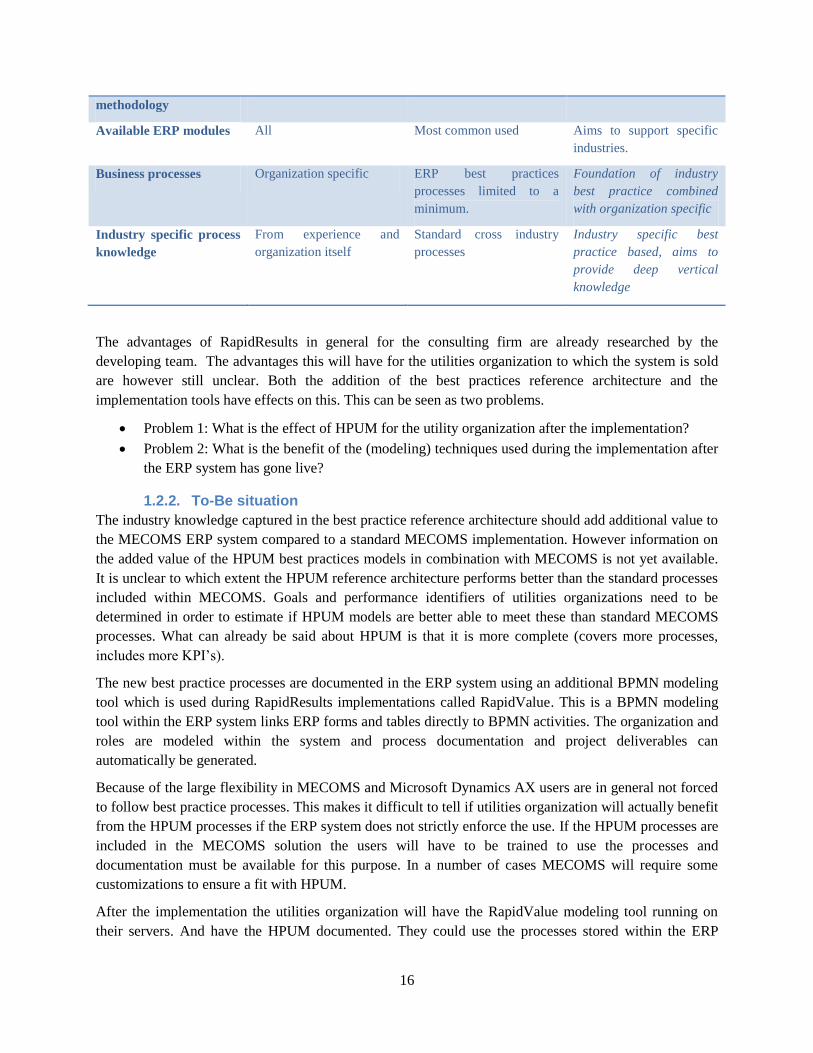
methodology
Available ERP modules All Most common used Aims to support specific
industries.
Business processes Organization specific ERP best practices
processes limited to a
minimum.
Foundation of industry
best practice combined
with organization specific
Industry specific process
knowledge
From experience and
organization itself
Standard cross industry
processes
Industry specific best
practice based, aims to
provide deep vertical
knowledge
The advantages of RapidResults in general for the consulting firm are already researched by the
developing team. The advantages this will have for the utilities organization to which the system is sold
are however still unclear. Both the addition of the best practices reference architecture and the
implementation tools have effects on this. This can be seen as two problems.
Problem 1: What is the effect of HPUM for the utility organization after the implementation?
Problem 2: What is the benefit of the (modeling) techniques used during the implementation after
the ERP system has gone live?
1.2.2. To-Be situation
The industry knowledge captured in the best practice reference architecture should add additional value to
the MECOMS ERP system compared to a standard MECOMS implementation. However information on
the added value of the HPUM best practices models in combination with MECOMS is not yet available.
It is unclear to which extent the HPUM reference architecture performs better than the standard processes
included within MECOMS. Goals and performance identifiers of utilities organizations need to be
determined in order to estimate if HPUM models are better able to meet these than standard MECOMS
processes. What can already be said about HPUM is that it is more complete (covers more processes,
includes more KPI’s).
The new best practice processes are documented in the ERP system using an additional BPMN modeling
tool which is used during RapidResults implementations called RapidValue. This is a BPMN modeling
tool within the ERP system links ERP forms and tables directly to BPMN activities. The organization and
roles are modeled within the system and process documentation and project deliverables can
automatically be generated.
Because of the large flexibility in MECOMS and Microsoft Dynamics AX users are in general not forced
to follow best practice processes. This makes it difficult to tell if utilities organization will actually benefit
from the HPUM processes if the ERP system does not strictly enforce the use. If the HPUM processes are
included in the MECOMS solution the users will have to be trained to use the processes and
documentation must be available for this purpose. In a number of cases MECOMS will require some
customizations to ensure a fit with HPUM.
After the implementation the utilities organization will have the RapidValue modeling tool running on
their servers. And have the HPUM documented. They could use the processes stored within the ERP

17
system itself and possibly even foster pride on their best practices. Differentiating their organization from
the competition and actively use it in their day-to-day work (van der Linden, 2013). The process models
could be used to train users and provide clear view on how the processes in the organization work.
The models documented in the ERP system by RapidValue do not influence the technical functionality of
the ERP system. The models are only usable as documentation and do not work as a workflow engine.
Users have to manually execute the steps described. However also activities not executed in the ERP
system can be modeled in the RapidValue models. Activities that are executed in the ERP system can be
linked to the appropriate ERP forms or tables. Clicking in the BPMN activity will open the associated
form for the user to execute the described task.
Related to the problems described in the as-Is section, what will be determined is:
1. The expected ability of the best practice reference architecture processes to meet the goals of utility
organizations in comparison to the standard ERP processes within MECOMS.
2. The way the utility organizations can use the best practice process models documented during the
implementation in their operations.
1.3. Research objectives
The previous section determined the problems that need to be resolved; this results in a number of
research objectives.
A method has to be defined in order to determine the added value of HPUM over out of the box
MECOMS processes and the use of the process models in the daily operations. A common way to
compare processes is using for example simulations or compare processes on an activity level measuring
for example throughput, lead-time, costs or output of the processes. In this case that however is not a very
strong method to compare the processes. This would require implementing the HPUM activities within
the MECOMS technology in order to determine for example the exact lead-time distribution.
Han, Kang, and Song (2009) state business process activities must be closely related to performance
metrics because the metrics are the drivers and evaluators of business processes. Since the metrics
indicate how well the business is doing relative to a defined strategy. They help managers to derive better
business decisions. Therefore, for effective process modeling, it is imperative to establish the relationship
among enterprise strategies, business processes and metrics. They propose a two-stage method to
compare business processes. In this method they split a macro- and microanalysis of the processes.
According to Van der Aalst, Weske, and Wirtz (2003), there are basically three types of business process
analysis (BPA): validation, verification and performance analysis. A macro process analysis must be
performed prior to these detailed process analyses, in order to determine which business processes are
linked or aligned to specific enterprise strategies to attain the business goals. In other words, for process
innovation or improvement, the most significant process to produce a successful performance should be
identified, as well as the performance indicators that are most significantly influenced when a specific
process is executed (Han, Kang, & Song, 2009).
The out of the box MECOMS processes and HPUM processes are designed with different purposes
which make a micro analysis as described by Han et al. (2009) not directly applicable. MECOMS
processes are developed to go along with the ERP system and are linked one-to-one to (technical)
functionality in the system. On the other hand HPUM processes are in the first case developed for a
management audience. It is less directed at the steps executed in the ERP system. In order to compare

18
processes this has to be taken into account. Expert opinions however can be asked to look at and compare
the processes from different angles at a macro level.
Han et al. (2009) use KPI’s for the macro analysis. They link KPI’s to processes in order to determine
which processes are suitable to attain a certain goal, although do not formalize the goals but rather see the
attainability of a KPI as a process goal. Kuziemsky et al. (2010) describe the linking of goals and KPI’s.
Using these goals and KPI’s it is possible to compare the MECOMS and HPUM processes on a macro
level and determine the potential “value” of the processes for utilities organizations. Goals are then
divided into three categories; strategic, tactical and operational.
Soffer, Golany, and Dori (2005) state that for organizations implementing an ERP system it is beneficial
to follow the ERP processes instead of customizing the system to follow their own processes This would
ensure a higher quality ERP system and less risk in the implementation process; risks such as going over
budget, bugs in the system, maintenance problems or time consuming customizations. In the stronger the
out of the box processes are, the stronger the arguments are to follow these processes. The HPUM
processes can turn out to be better than the MECOMS processes, which would result in a better ERP
implementation by using the RapidResults method.
After the value for utilities organizations of the HPUM best practices compared to the standard ERP
processes is determined it will be necessary to determine how the implementation method can aid the
implementation of the best practices and motivate users to follow them. The implementation tool
RapidValue will need to be evaluated in order to determine if this is a usable tool to achieve this. The
developers of the tool claim this; however it is not yet validated in practice. Answers to these issues are
needed to as arguments on why a customer should choose for this solution and not just buy an ERP
implementation from the cheapest vendor.
The combination of the preferred processes and implementation with RapidValue based models will
result in stronger out-of-the-box ERP solution for utilities organizations, which can be implemented and
used more efficient using RapidValue. This opens the door to for example SaaS solutions and cloud
implementations of future releases of the ERP system.
1.4. Constraints and requirements
The research is executed at Avanade and has as a goal to provide useful information for Avanade, the
corporate sponsor, on the RapidResults method. This gives a number of constraints to the research.
First, the HPUM models are used as best practice models, no other best practice architectures are used as
a comparison in this study. The HPUM is intellectual property of Accenture and the only utilities and
energy reference process architecture owned by Accenture or Avanade.
The Microsoft Dynamics AX ERP system with the MECOMS will be the only ERP system used in this
study since Avanade only works with the Microsoft ERP solutions and Accenture has already linked
HPUM to other ERP systems such as SAP and Oracle. In fact the HPUM processes could be seen as the
SAP and Oracle processes from Accenture.
There is no access to end- or key users of the utilities industry since this could compromise the
competitive position of Avanade, since the RapidResults solution for utilities is not mature enough to be
discussed with (potential) customers in the utilities industry. Avanade just started 1.5 years ago with the
AX/MECOMS solution and the first customers are being implemented now. RapidResults is still under
development and does not yet have reference customers. Expert opinions from consultants with

19
experience in the utilities industry will be used as a source; they are asked to position themselves as “the
utility organization.” Within Avanade in the Netherlands 3 utilities experts are available. Other experts
with experience outside the utilities sector are also available. Outside the Netherlands there is also a
number of utilities experts within Avanade, their availability is however unclear.
It is possible that there are errors present in the MECOMS or HPUM processes; these can be modeling
errors, outdated processes or other types of errors. In the case an error is discovered this will be identified
as being an error, however not corrected. This is out of scope for the current project and will only be
relevant for the processes that turn out to be the best option.
1.5. Research questions
From the problem description and research background a set of research questions is extracted. They can
be divided into two parts. The first part relating to the process value of the out-of-the-box ERP solution
and the best practice reference architecture; the second part is related to the process modeling tool used in
the RapidResults method.
1. Do best practice processes improve the operations of a utilities organization in comparison to the
standard processes implemented in an ERP system and how can this be measured?
a. Which strategic, operational and tactical goals determine process performance for
utilities organizations?
b. What is the expert opinion on the goal performance of the out-of-the-box ERP solution?
c. What is the expert opinion on the goal performance of the best practice reference
architecture?
d. What is the expected performance of the ERP system compared to the best practices
processes?
2. What are the advantages of the availability of process models within the ERP system if the
processes are not physically enforced by the system?
a. Does the use of BPMN models within the ERP system facilitate better understandability,
of the processes and the ERP system by key and end users?
b. What are the anticipated effects on the usability, readability and completeness of the
BPMN modeling tool used for training key and end users?
1.6. Processes in scope
Utilities organizations have a large number of processes; HPUM has in total more than 500 processes
modeled and captures most of the utilities processes. The ERP system modules for the utilities industry is
designed to support meter data- and contract management, additional to the standard ERP modules.
Not all processes are equally important for utility organizations. In this research the scope of the
processes is limited to a set of frequent used and important processes that are both supported by the ERP
system and the reference architecture. The processes that are frequently used and important for most
utilities organizations are the standard processes that are needed to serve most B2C customers; this is
determined using interviews with utilities experts from Avanade. These processes are related to:
Lead and prospect management
Contract management
Product management (both commodity and non-commodity)

20
Billing
Credit management
Meter data management.
Complaints, error and request handling.
Other processes are considered to be out of scope.
1.7. Method
This section will give a high-level overview on the research method and motivation for the method used.
The approach for the different research questions specific is discussed in the corresponding results
chapters.
ERP implementations in general are long lasting projects with many uncertainties (Ehie & Madsen,
2005). RapidResults as a delivery method is still under development and has not been used in the field
yet. Implementing an ERP system with HPUM is not possible in the time available. More background
information regarding the implementation project of ERP systems and the choices that need to be made in
this process can be found in the literature thesis in appendix 1.
In order to be able to predict the performance of the process architectures (out-of-the-box MECOMS and
HPUM) a mixture of qualitative and quantitative measures can provide the best results. Quantitative
process analysis provides clear proof of the expected capabilities of processes, both in a macro- and
microanalysis (Han, Kang, & Song, 2009). It is however important to have qualitative control measures
allowing experts to overrule quantitative outcomes. For example if legislative requirements would make
an otherwise strong process no longer relevant. The qualitative information is also needed to determine
the (expected) process performance criteria, KPI’s and goals for utilities organizations since in many
cases these are not yet clearly documented. Measuring the performance of the processes in the field is not
possible since this would require at least two comparable utilities organizations in which one used only
the out-of-the-box ERP system with no customizations; and the other used the best practice architecture
with no changes applied to it. Since neither is available this is not possible. Moreover, implementing the
system with the new processes without thorough research in advance would have too much risk. This
requires a method to be able to predict the performance of the processes. Using the macro analysis as
described by Han et al. (2009) and the use of process goals as described by Kuziemsky et al. (2010) an
answer to research questions 1 a, b and c is given. In chapters 3, 4 and 5 the specific methods for these
questions are discussed.
The quantitative comparison of the processes requires a model; Tan et al. (2007) provide a methodology
to compare complete process architectures for different industries on both a macro and micro level. A part
of this methodology is the analysis of process target achievements using a process target achievement
matrix (PTAM) which is based on expert opinions. It is possible to use the expected goal performance
derived for the utilities in this model. Tan et al. (2007) combine this with other measures and simulations;
including manufacturing efficiency and effectivity measures.
Seçme et al. (2009) describe another approach in which they use the Fuzzy analytic hierarchy process
model to determine goal weight factors and the Technique for Order Performance by Similarity to Ideal
solutions (TOPSIS) method to measure the performance of financial institution based on financial and
non-financial goal performance. The non-financial goal performance uses a hierarchical goal model to

21
measure the performance of the institutions based on expert opinions. Benitez et al. (2007) use the same
method to measure service levels of processes in the hospitality industry.
A combination of the methods described by Tan et al. (2007) and Seçme et al. (2009) can be used to
provide a rigorous prediction of process performance based on expert opinions available from Avanade
utilities experts. Information needed for the proposed calculations is gathered using questionnaires send to
the experts to rate the goal importance and performance of the processes in scope. The questionairres can
be found in appendix 17 and 18. In the results chapters the exact calculation methods are described.
All process models used in the interviews are BPMN models. The out of the box ERP models are
extracted from user manuals and other documentation provided by the manufacturer and modelled in
BPMN. The best practice models are translated from EPC to BPMN in RapidValue using the method
described by (Tscheschner, 2010).
The HPUM processes are detailed on the lowest levels and have a number of modeling errors on this
level. For example erroneous splits and joins, impossible combinations of events or missing triggers. The
MECOMS processes are only available on higher and more abstract levels. The combination of these
facts has led to the decision to compare the processes not on the lowest level. In HPUM this will be on
level 5. The MECOMS processes extracted from the manuals are modelled with the same degree of detail
as the level 5 HPUM. Level 5 is the first level on which HPUM useses EPC’s.
Using interviews with Avanade utilities experts the processes are validated. For the MECOMS processes
it is determined if the processes are extracted from the documentation correctly. HPUM processes will be
validated to determine if they are correct and meet regulatory demands. This enables experts to overrule
the outcome of the questionnaires. For example a process could score high on the goal performance
measures, but if the process is not allowed or outdated the results should be overruled. This also
compensates for the highly theoretical view which is provided by the PTAM and TOPSIS approach and
makes the results more tangible. This will answer research question 1d.
For research questions 2a and 2b, in which test the effect of the RapidValue based processes on key and
end-users, an experiment is setup. For this an out of the box version of the ERP system for a ficitive
utilities company is used. The subjects are given a number of assignments they have to complete in the
ERP system. None of the subjects has experience with the utilities ERP system or industry. They are
given the RapidValue models and documentation as only source of information. The time they spend on
completing the assignements is measured allong with the number of questions or help they ask. The
control group receives the same assignement, however they have the standard documentation to their
disposal to complete the assignement with.
After completing the assingments the subjects are asked for their opinion on the documentation they had
at their disposal. A number of the subjects consists of young ERP consultants from other industries. Their
expert opinion is used to determine if the documentation is usable in different settings such as: training
end-users, organize workshops with key users and communicate with other ERP professionals.
1.8 Report structure
The structure of the remainder of this report is as follows. Chapter 2 will provide the goals identified used
to compare the utilities processes. Chapter 3 provides the validation and expert opinion on the out of the
box MECOMS processes. Chapter 4 provides the same information for the HPUM processes. In Chapter

22
5 the actual process comparison is made. Chapter 6 contains the results of the RapidValue experiment.
Chapter 7 contains the overall conclusions, including limitations and suggestions for future research.

23
2. Goals for utilities processes In order to estimate the performance of utilities processes it is important to first determine the goals of
utilities organizations. This enables the comparison of the HPUM and MECOMS processes on a macro
level. Different industries have different goals and mission statements; they determine what an
organization intends to do, why and how this should be done. This provides information on what is
valuable to an organization and defines “success” and “value” on a high level for the organization. This
section first describes how goals for utilities organizations are determined. Next the identified goals are
described and motivated. This will answer the first research question:
1a Which strategic, operational and tactical goals determine process performance for utilities
organizations?
Appendix 3 provides a more elaborate description of the goals for utilities processes. This chapter
provides a shorter overview of the appendix.
2.1. Method
To answer the question a mixture of information sources is used in order to gather a list of goals to be
used to determine the expected performance of the utilities processes. By using multiple sources the
information will be more reliable and provide a list of goals that is not specific to one utilities
organization.
Documentation such as annual reports from utilities organization provides sources to extract goals for
utilities organizations. Especially strategic and tactical goals can be extracted from these reports.
Scientific literature is a potential strong information source in many cases; however the utilities industry
is a fast changing industry in the European market as a result of deregulation and rapidly increased
competition and business models. Most scientific literature available on the utilities industry is still
describing the effects and theory of these deregulations and changing market perspectives. This provides
a good source of information for utilities landscapes which are still more regulated, for the scope of the
current research this is however less usable. Literature is available on the methods to measure and or
predict performance of business processes outside of the utilities industry (Tan, Shen, & Zhao, 2007)
(Seçme, Bayrakdaroglu, & Kahraman, 2009).
Market research reports are available on the utilities industry and provide qualitative motivators for the
utilities process goals on all goal levels (operational, tactical and strategic). This information is used to
initiate expert interviews to extract more goals available for utilities organizations and to determine how
goals can be conflicting.
The expert interviews make the goal models complete and validate the information found in other
sources. The interviews for this research question are held in Avanade offices and at the office of a large
utilities organization currently working together with Avanade. Prior to the interview the subjects receive
information via e-mail on the topic that is to be discussed. The interview is structured in order to
determine the goals for utilities organizations, starting on a higher (strategic) level and focusing on lower
levels as the conversation goes on.
2.2. Utilities goals
For utility organizations mission statements provide useful information on strategic and tactical goals.
Examples of such statements are:

24
These examples give a high-level view of the strategy of the companies and are used to further develop
goals for utilities organizations.
Measuring and predicting the process performance is done on different levels; strategic, tactical and
operational. The strategic level defines long-term vision and goals. They determine the hierarchical lower
tactical goals. These more concrete medium term goals are used to generate the operational goals.
Operational goals are used in order to manage the day-to-day operations. Cheng (2007) divides all goals
into two categories, functional (hard) goals and non-functional (soft/fuzzy) goals. The functional goals
describe a function the process will or must fulfill and can be measured using well-defined criteria in
order to determine if they are satisfied. Non-functional goals describe a quality that the process has to
possess. This is often more difficult to measure, in general non-functional goals are satisficed rather than
satisfied (Cheng, 2007). Defining goals according to the “SMARTER” principle is considered useful.
This means goals must be: Specific, Measurable, Attainable, Relevant, Time-bound, Evaluated and Re-
evaluated. This principle applies to both functional and non-functional goals. For the non-functional goals
RWE More Sustainable
Increase the share of our generation capacity accounted for by renewables to at least 20% by 2020.
Reduce our specific CO2 emissions by more than 20% by 2020 compared to 2005
Improve the Efficiency of our power plant fleet and promote conservation of energy by our customers.
More International
Secure strong Earnings in our core markets i.e. Germany, the U.K. and the Netherlands
Achieve organic growth in Central Eastern and South Eastern Europe.
More Robust
Realize stable earnings through our presence along the entire energy value chain.
Maintain a balanced portfolio of regulated and unregulated activities
Adhere to the guiding principles of our growth: increasing the company's value.
Source: (RWE, 2013)
Vattenfall Focus on a sustainable heat and electricity production by transforming the production to low emitting technologies.
Provide sustainable energy consumption by delivering smart energy solutions.
Achieve a sustainable economic performance by pursuing excellence in everything we do.
Source: (Vattenfall, 2013)
DELTA Mission and Vision
DELTA offers the benefits of sustainable and innovative multi-utilities to its customers. DELTA guarantees constant delivery
and is the obvious partner for energy, water, digital services and waste disposal on small and larger scale.
DELTA knows conventional energy sources are limited and invests in the development of more sustainable processes and
techniques. (...) In an ever more complex environment, DELTA will further integrate its products and services to meet the
needs of our customers.
Source: (DELTA, 2013)
Eneco Focus on and attention to the needs of our customers (short term and long term), through which we create sustainable value
for all stakeholders
Helping customers to reduce energy consumption by providing insight and energy efficiency solutions
Accessible, local and profitable production of energy together with customers
Providing affordable, reliable and clean energy, combined with excellent customer service
Further improvement of quality in all aspects of business operations as result of bundling of expertise and 100 years of
experience
Source: (Eneco, 2013)

25
this is more difficult, however it should be coped with. In the appendix 25 KPI’s are identified and linked
to goals for utilities processes.
It is possible to see the utilities industry as different from other industries since on the one hand it
provides a commodity which can be seen as a physical product which has to produced, bought,
transported, sold and stored (to certain extend). However on the other hand operates as a service provider
that has to deliver a service to consumers and business partners, comparable to telecom providers. The
business drivers and performance indicators for the utilities industry can be divided in these same
categories as well. The emphasis in this report lies on the utilities as a service. This is in line with the
changes taking place in the industry over the past decade which have made the industry a more service
oriented industry (Datamonitor, Dec. 2011). Unfortunately the industry itself is only recently starting to
see this analogy to other (service) industries and in most cases are still adapting to this service oriented
view, rather than a product oriented view involving only the delivery of energy. The goals in identified in
this chapter must reflect the service oriented view of the utilities industry, since the service provided is
what allows the utilities organizations to compete with each other.
The service component of the utilities industry relates to how the organization sells, serves and bills
utility products to customers. The introduction of new suppliers to the market as a result of liberalization
of the utilities industry has forced the traditional suppliers to shift from a production based organization to
a more service oriented model, not only selling the utility product but also additional services and
ensuring the customer facing processes are optimized (Datamonitor, Dec. 2011).
Two strategic goals for utility organizations are defined using an analysis of utilities reports, (DELTA,
2013) (RWE, 2013) (Vattenfall, 2013) (Eneco, 2013) (Datamonitor, Dec. 2011) (Datamonitor, Oct. 2011)
and interviews in appendix 4, 5 and 6.
1. Reducing the cost-to-serve.
2. Increasing customer satisfaction.
Corporate policies determine the time bound of the strategic goals. Financial records allow the measuring
and evaluating of the Cost-to-serve; the customer satisfaction can be measured using customer surveys.
Both goals however would also benefit from the use of relevant KPI’s able to measure the performance
on these goals in real time. Organizations only periodically measure their cost-to-serve and customer
satisfaction a few times per year and not in real time. This makes it more difficult to actively control the
cost-to-serve.
Tactical goals for the utilities industry (based on the same sources as the strategic goals) are:
3. Be able to introduce new utility and non-utility products and services easily.
4. Reduce customer churn.
5. Be able Meet regulatory demands fast
The ability to introduce new products and services is a functional goal if you would consider it to be a
Boolean ability which is either present or not. However the ease of use and dimensions of freedom related
to the ease of use makes it more a non-functional goal since this will be measured based on the opinion of
the users and the specific characteristics and dimensions of the products/services to be implemented.
Utility products are different contract types and tariff structures for the actual utility (electricity, gas, heat,
water); non-utility products and services are for example smart thermostats, energy efficient appliances
and energy saving advice.

26
Reducing customer churn is measured using the utilities companies own specific targets for the customer
churn. Meeting regulatory demands is Boolean, they are either met or not, the timing is determined by
regulators, the system must ensure these deadlines are attainable.
The operational goals can be broken down into a number of operational goals:
6. Have the ability to meet current regulatory demands
7. Have the ability to meet future regulatory demands
8. Reduce error impact
9. Reduce error probability
10. Have high b2b flexibility
11. Have high utility contract flexibility
12. Have high utility tariff flexibility
13. Have high non-utility flexibility
14. Minimize process lead-time.
Goals can influence each other, they can make, help, hurt or break each other, Figure 2 shows the goal
model with the dependencies of the different goals (full size print available in appendix 7). The goal type;
strategic, tactical or operational is indicated for each goal. The meaning of the colors: Dark green: make,
Light green: help, Red: hurt, Dark red: break and orange neutral. The name of the goal in the goal model
is a truncated version of the goal. The ID numbers are corresponding with the list provided above. In
Table 2 Goal relationsa matrix view of the goals relations is given. In the matrix aij indicates the relation
of goal i to goal j. In the survey of chapter 5 the assumptions are checked.

27
Figure 2 Goal model Dark green: make, Light green: help, red: hurt, dark red: break, orange neutral.

28
Table 2 Goal relations
1 2 3 4 5 6 7 8 9
1
2 Help
3 help/hurt Make Help Hurt
4 Make
5 help help/hurt
6 Make
7 Make
8 help Help
9 Make Help
10 Help
11 Help
12 Help
13 Help
14 Make Break
The following paragraphs give a short motivation on the strategic, tactical and operational goals. Since
the operational goals all relate directly to tactical goals the operational goals are motivated together with
the tactical goals to which they are related.
2.2.1.1. Strategic Reducing the Cost-to-serve
Cost to serve are an important performance measure as a result of the rising wholesale prices and cost
base for utilities organization business process or the utilities organization as a whole. The cost-to-serve
has a direct impact on the ability of retailers to remain competitive and is a key determinant in market
share movements. (Datamonitor, Oct. 2011)
There is no standard industry definition of cost-to-serve; the best description would be an approach to
supply chain analysis, using activity-based techniques to identify the costs of serving specific retail
energy customers with appropriate energy products and services. Different costs related to customers,
products and channels are allocated to the relevant activities, which associates the practice to the wider
known activity based management practice, which is common in the manufacturing industry.
(Datamonitor, Oct. 2011)
The cost-to-serve tends to be higher in deregulated markets in which people are able to switch suppliers.
In countries where the switching process is very easy the cost-to-serve turns out to be even higher as in
deregulated countries with inefficient switching processes. The fact that people tend to switch earlier if
the process is easy is the main reason for this fact. This results in higher costs for the organization to
acquire and retain customers. A common division of the cost-to-serve is splitting them into two brought
categories: the acquisition costs and the costs of retaining the customer.
An Australian electricity price forecast expect an increase of the cost to serve of 26% by 2020 compared
to 2008 (Simshauser & Nelson, 2013), making this a significantly important strategic point for utilities
suppliers to focus on.
The estimated total cost-to-serve for utilities organizations in Europe are € 58,- per account/year. In the
United Kingdom however the supplier is also responsible for the meter readings, which makes the costs

29
significantly higher, on average € 100,- per account/year (Datamonitor, Oct. 2011). Measuring the cost-
to-serve is difficult. In many cases they are not performed automatically and require information scattered
over multiple information systems. The organizations tend to measure the cost-to-serve sporadically once
or twice a year on an ad hoc basis, many utilities are actually unaware of their exact cost to serve at a
given moment and don’t actually use this information to determine their strategy.
It would however be beneficial to the utility organization to analyze the cost-to-serve more constant and
actively use this information in management decisions (Datamonitor, Oct. 2011). Cost to serve
information is able to identify inefficient processes and better control the overhead costs. Cost-to-serve
analysis helps utilities to improve the business processes and reduce the costs. It is necessary to know
what the costs are in order to be able to reduce them.
There are different methods to split different types of cost-to-serve. A common division is splitting the
costs in front-office and back-office costs. This however would ignore a large portion of the cost which
go in the acquisition of new customers (>13%) (Datamonitor, Oct. 2011) and the costs related to the
transferring of costumers, combined as the customer churn. A clear division of the cost-to-serve however
is difficult since some costs can fall into multiple categories or are highly correlated with other costs. For
example an error prone billing process in the back-office will result in an increased number of calls to the
call center, generating more front-office costs.
It is possible to split the processes influencing the cost-to-serve in different categories. An important
distinction is that between the costs related to the actual execution of the processes and the costs related to
customer churn. Both are a part of the cost-to-serve (Datamonitor, Oct. 2011). The cost to serve related
directly to processes is further split in front-office and back-office process costs.
Most costumers only hear from their utilities supplier once a year when they receive their bill. This makes
the quality of the bill and the additional information provided in it important. Some organizations, such as
for example Essent (part of RWE) in the Netherlands have invested in periodicals in order to keep in
touch with their customers. This increases front-office process costs but should reduce customer churn.
This makes it important for utilities organizations to separately monitor both the process costs and the
customer churn costs in order to be able to determine the net effect of a process that influences both.
Figure 2 gives an overview of the cost-to-serve for British utilities organizations. Customer acquisition
13% and switching costs also 13% together make customer churn a large portion of the total cost-to-serve
(Datamonitor, Oct. 2011). Since many consumers will only have contact with their energy supplier in case
of problems, for example errors in a bill, it is important to ensure the errors and problems are prevented,
but also resolved quickly and correct. Especially since this can influence the customer churn.
The number of contacts that is required with a customer and the time spend with the customer are
efficiency measures for the front-office processes. By measuring the average lead-time, process error
possibilities, error impact and first time right solution rate the effect of the processes can be measured.
For the back-office processes it is important the processes are performed correct. Throughput time is in
most cases less important. Since in most cases this only influences the cost-to-serve goal and to a smaller
extend the customer satisfaction. Most customers do not mind a bill arriving a day later, as long as the bill
is correct and this does not influence their payment term. It is more important these processes are
performed correct to prevent errors and higher front-office costs. However for the liquidity of the utilities
organization it is important to process bills in a timely manner.

30
A number of organizations has come to realize the importance of the bill in the communication with its
customers and uses the annual bill as an important instrument in customer retention. They ensure their bill
provides more information than just the calculated invoice lines but ensures customers feel connected to
the supplier.
In the billing processes the quality of the processes is important. Billing processes should minimize loss
as a result of late payments, bad debt and customer churn as a result of errors.
The error rate and ability to identify and solve errors primarily determine the value of back-office
processes. High quality back office processes save costs in the front-office processes by reducing the need
for customers to contact call centers. At the same time the processes must aim to reduce the costs in other
fields, by providing high quality service that lowers customer churn or balancing credit risks and
customer satisfaction. Lead-time is not unimportant for back office processes since minimizing the time
invested by users will minimize the associated costs. This requires monitoring of the error rates and lead
times of back office processes in order to be able to influence the costs-to-serve related to the back-office
processes.
Figure 3 Cost to serve
2.2.1.2. Strategic: increasing customer satisfaction
In important goal for all organizations is the customer satisfaction. Utilities organizations are no
exception to this. All reports from utilities organizations themselves indicate this being a key point in
their strategy (DELTA, 2013) (Eneco, 2013) (RWE, 2013) (Vattenfall, 2013). The highly competitive
deregulated utilities market has resulted in high customer churn; this requires utilities organizations to
look further than only competing on prices and margins (Datamonitor, Dec. 2011). In many cases keeping
a customer satisfied is the only way to prevent a customer from transferring to another utilities supplier,
making this one of the most important goals for utilities organizations.
2.2.1.3. Tactical: reducing Customer Churn costs
The costs related to the acquisition, retention, registering and deregistering of customers together are the
customer churn costs. These costs are difficult to monitor since it is unclear which cost exactly contribute
16%
15%
13%
13%
12%
8%
6%
5%
5% 4% 3%
Meter asset rental
IT and infrastructure
Acquisition
Contract centre
Meter reading
Payment
Bad debt
late payment
Switching costs
Billing
Overhead
31
to it. It turns out the churn costs are significantly higher in high competitive markets; this is the logical
result of the higher number of switches (Datamonitor, Oct. 2011). Suppliers aim to both acquire new
customers as efficient as possible and at the same time prevent customers from leaving again.
2.2.1.4. Tactical: Introducing new products and services
Be able to introduce new utility and non-utility products and services easily. The deregulated utilities
market has led to the introduction of new companies who plan to enter new markets and differentiate
from the dominant suppliers. For example by providing energy efficiency tips and matching their
products to the demographic, political and economic aspects of their customer segments.
The tactical goal: “Be able to introduce new utility and non-utility products and services easily” can be
measured by looking at a number of related operational goals, these are: the flexibility to introduce new
utility products and contracts, the possibility to introduce non-utility products and the possibility to
differentiate from other suppliers by providing these services and products.
2.2.1.5. Tactical: Ability to meet regulatory demands
Regulatory demands are changing fast in the utilities industry. In some countries the government has fully
regulated the utilities industry; in others it is (partially) deregulated. The deregulation has taken place in
the past decade and changed legislation set by national and international governmental organizations.
Environmental concerns, the open European market and changes such as the splitting of suppliers and
grid operators in some countries has resulted in the need to be able to follow changes in regulatory
demands.
The regulatory demands for the utilities industry change fast and require flexibility of the organizations to
follow them. If the organizations are not able to correctly implement these changes, such as the:
“Stroomopwaarts” guidelines in the Netherlands (Energie Data Services Nederland, 2012) this will result
in problems during the delivery of the utilities service, not being able to execute processes until changes
have taken place and potentially the loss of customers, the inability to contract new customers or process
bills and payments.
The ability to follow these demands is comparable to the ability to introduce new products and services to
customers. However the stakes and impact of the changes are often higher. In order to meet the
regulatory demands the processes need to be clear, robust and flexible. Clear as in easy to interpret and
prevent people from misinterpreting regulatory related processes, robust in the sense that mistakes are
prevented as much as possible and flexible to allow the organization to quickly adapt. The combination of
these regulatory related characteristics determines the value of a process in the utilities industry.
2.2.2. Conclusion
In order to measure the quality and performance of processes for the utilities industry as a service industry
and to answer the research question: 1a. Which strategic, operational and tactical goals determine
process performance for utilities organizations? In total 14 strategic, tactical and operational goals have
been determined. Different process and models can be compared based on their expected goal
performance on the provided goals for utilities organizations.
On the strategic goal level the architecture and processes must ensure the cost-to-serve is minimized and
the customer satisfaction is maximized. This translates to the tactical goals to: be able to provide new
products and services (utilities and non-utilities), be able to meet regulatory demands, reduce customer

32
churn. On an operational level this leads to reduce the average lead-time, reduce the number of errors
made, reduce the impact of errors and dimensions types of product/service flexibility.
By determining or predicting the ability of the processes to meet these functional and non-functional
goals it is possible to determine if certain processes should be more beneficial for utilities organizations in
their operations by selecting the best option.
33
3. MECOMS process evaluation This chapter provides a qualitative analysis of the MECOMS utilities processes. Using the goals
determined in the previous chapter the expert opinion on the processes is determined. This information is
later combined with the survey results and performance models to provide information on the standard
ERP process performance. This will be used to provide a qualitative answer to research question 1b: What
is the expert opinion on the goal performance of the out-of-the-box ERP solution? Chapter 5 will provide
the actual performance comparison between HPUM and MECOMS processes. This chapter determines
the validity of the processes and if they meet the minimal requirements set for different processes. It is
determined if processes do what they should and meet regulatory demands. This enables utilities experts
to overrule the outcome of the actual comparison in chapter 5 if for example a process is not executable or
not in line with other requirements.
The standard out of the box MECOMS process descriptions are described only roughly on a high and
abstract level by the ERP vendor. In this section it is important to identify the lower levels of the out of
the box processes that will be used to compare the processes with the HPUM processes later in this report.
A short description of each process is given in this chapter.
In the remainder of this chapter first the method used during the interviews will be discussed, next the
processes within the system are described along with a summary of the expert opinions on the processes.
Appendix 9 provides detailed versions of the findings. Appendices 5, 8 and 10 contain the interview
transcripts.
3.1. Method First process models for standard MECOMS processes are extracted for the processes in scope from the
manuals and training material available from the utilities suppliers. The vendor designed these manuals to
train both other consultants and end-users in using the system. In most cases the consulting company will
supplement or replace the manuals during the implementation of an ERP system. This documentation will
be custom made for the specific implementation of the utilities organization and will have processes
tailored to the specific organization.
Task recordings provide the most of the lower level documentation and flow descriptions. This are
automatically generated documents describing the actions taken by users of the ERP system to complete a
task step by step. Using the high-level descriptions and the low-level task recordings available BPMN
models of the processes under investigation are developed.
The first part of the interview validates the BPMN process models, next the subjects are asked their expert
opinion on how the described out of the box MECOMS processes are able to satisfy the goals determined
for the utilities organizations. The subjects are asked to look at the MECOMS processes from the
perspective of the utilities supplier organizations.
The interviews are structured by sending the process flows to the subjects prior to the interview. In the
interview the processes are discussed one by one. The questions asked are; is this process valid, does it do
what it is intended to do, how it performs on the goals determined and which KPI’s are relevant for this
process.

34
3.2. High level process description: Process lifecycles Within the MECOMS ERP system, “lifecycles” define the high-level processes, which are a combination
of low-level processes.
Table 3 provides the MECOMS lifecycles. Appendix 12 contains the process flows of the lifecycles. Each
flow consists of a number of processes.
Table 3 Process lifecycles
Lifecycle
Service Management
Meter to Consumption
Portfolio management
Activity to contact
Activity to Service
Contact to Activity
Customer Change
Prospect to Contract
Contract to Cash
Market Insight to Product
Product to Profit
The processes selected are key processes, which means they are executed frequently. The processes are
primary front office and back-office processes for utilities organizations. Documentation of the ERP
system (Ferranti, 2012) is the primary source of the key processes and experts are asked to contribute to
the list during the interviews by asking which processes they consider key processes. .
3.3. Process description and expert opinion In this section the process description of the processes in scope is provided along with a summary of the
expert opinions. Appendix 13 contains the process flows, the detailed expert opinion based on the
interviews can be found in appendix 9 and the interview transcripts.
3.3.1. Create a prospect
A prospect is a person or entity who is not yet a customer of the organization however might become a
customer. In the ERP system a prospect is a person or entity who is registered as a potential customer and
who receives a contract for the utilities service. The process aims at consumers who receive a
standardized utility product. The system however is rather flexible in the number, type and structure of
standard utilities products out of the box.
The process seems to balance the cost-to-serve a higher customer satisfaction and lower error rate. The
error probability and impact are relatively low. In the worst case, a prospect is lost; this loss is marginal in
the B2C market. For larger accounts the process is executed by an account manager with more personal
contact between the organization and the prospect, reducing the error probability. Users execute the

35
process by means of a standardized wizard in the ERP system. This reduces the error probability by
ensuring important information is supplied in mandatory fields, the user reviews information before
confirming the transaction. The experts consider the process correct and meeting the demands set for the
processes.
The goals that are closely related to this process are: reducing cost-to-serve, reducing lead-time, meeting
regulatory demand, reducing customer churn and the ability to introduce new products.
Appendix 13A contains a description of the process flow.
3.3.2. Create a contract
Contracts describe a relation between a customer and an arrangement in the ERP system. It contains
information on the product/service that is delivered to the customer and the terms applied.
Contracts are created using a wizard guiding the user through a standard workflow. This wizard however
is flexible and allows contract terms to be changed for different customers. The duration of each contract
can be set manually or taken over from the standard values provided in the contract template.
The system allows different template contracts to be generated (depending on the security role settings
users can generate new contract templates).
The contracts are an important factor in the tactical goal to be able to introduce new products fast and the
related operational goals. The expert’s opinion is that the system supports the flexible addition of non-
utility products better than other larger ERP systems.
The error sensitivity of the contract creation process is relatively low. As long as now actual transactions
are registered before an error is discovered. In the worst case the transactions affected will require a
rollback.
The goals that closely related to this process are: reducing the error impact and probability, be able to
introduce new products, increase customer satisfaction, reducing customer churn and have high utility
contract flexibility.
Appendix 13B contains a description of the process flow, the process is considered valid.
3.3.3. Create a connection
A connection in the ERP system is a data item that describes the point of delivery of the utility product. It
contains an address, EAN registration number, size, utility type and direction (consumption, production,
both). Every connection has one or more connection members. This is a data item that links a connection
to a utility product. Connections can be either metered or unmetered. For metered connection a meter
(device) has to be added to the connection as well.
The combination of a device, a connection with connection members and a contract (linked to a customer)
is a configuration in the system. For a utilities supplier who does not own the electricity meter the device
does not have to be included in the configuration.
When a new customer registers with the supplier, the configuration has to be made in the system. If the
connection is already present in the ERP system this connection and corresponding connection members
can be selected. In case the connection is not present the connection has to be added to the system first.
Using a central database the operator can look up the EAN number of the connection. The distribution
grid operator can provide information about the type of meter and connection (capacity, direction, number

36
of registers) to the supplier based on the EAN number. Governmental organizations regulate the use of
this (automated) messaging system between the EAN database, the distribution grid operator and the
supplier, for example in the “stroomopwaards” (Energie Data Services Nederland, 2012) method in the
Netherlands.
The goals closely related to this process are: reducing the cost to serve, reducing error probability and
impact, and have high utility tariff flexibility.
Appendix 13C contains a description of the process flow; the process is valid.
3.3.4. Create product
In the systems “product” always refers to a utility product that consists out of one or more items. For
example the items: “Green electricity peak/non-peak” or “Network costs south region < 10 kVA” with a
tariff structure linked to each product.
In the ERP system the “create a product” process adds new (utilities) products to the portfolio of the
supplier. This is considered one of the most important processes in the system. For utilities products the
process is flexible and allows the introduction of new products very easy.
The ease of use to create new products is especially useful for the B2B market in which individual rates
can be negotiated which can be related to for example the spot market prices. The pricing flexibility is
very large for both metered and unmetered connections. The determining of the tariffs can be done using
product models, price bands and margin settings automatically, or can be performed manually, offering
both high flexibility while reducing the cost to serve for fast changing tariffs.
The product creation process is relative complex for the average user; however a more experienced user
will find the process rather straightforward and complete. This is not a problem since in most cases only
portfolio managers and more senior users will be involved in this process. The error probability of the
process itself is relatively low.
The goals closely related to this process are: reduce the error probability and impact, increase customer
satisfaction, reducing customer churn, have high product, contract and tariff flexibility.
In Appendix 13 the process flow model is given, the process is valid.
3.3.5. Create a device
Devices in the ERP system are meters to measure the consumption of the utility product; devices can be
all types of meters.
The device creation process is a back-office process in the system that customers do not have to deal with.
It does not influence customer churn. Devices can be added, deleted and updated very easy based on
device blueprints, making error probability and sensitivity very low. The lead-time of the process is also
very low, especially since every device is created only once.
The system supports both manual-read meters as automatic/smart meters. Which provides flexibility and
shows the system is capable of meeting regulatory requirements related to the introduction of smart
metering and smart grids.
The goals that closely related to this process are: reduce lead-time, reduce error probability and impact,
reduce cost to serve and meet regulatory demands.

37
Appendix 13E gives the process flow model, the process is considered valid.
3.3.6. Move in a customer
After a customer has signed a contract with the utilities supplier, the system adds devices (meters) to the
configuration (a configuration is a combination of one or more connections, one or more contracts and
one or more devices). The last step is linking the customer to the configuration, “moving in” the customer
and starting the service.
The system supports the move in process using a customer relation wizard. This wizard links a customer
to the configuration. Depending on the settings of the system also other roles can be added to the
connection, such as the distribution grid operator, landlord, meter reading agency etc. providing relatively
large utility flexibility. In general the process performs better than other larger competing utilities ERP
systems according to the experts.
The error probability can be limited using mandatory fields and data validity checks for example by
matching postal codes with street names. The process execution is relatively easy. The design of the ERP
system allows rollbacks to be performed in case of an error. This ensures the error impact is low.
Goals closely related to the process are: reducing the error probability and impact, reduce customer churn
increasing the customer satisfaction and reducing lead times.
Appendix 13F gives the process flow model, the process is considered valid.
3.3.7. One-time items & free text invoices (non commodity billing)
The system allows one-time items / non-commodity or non-consumption based items to be billed to
customers using the free text invoice functionality in the system allows.
The free text invoices provide the utilities organizations with large flexibility to bill additional products
and services. “Everything can be billed, even Barbeques”. This allows the introduction of new products
such as smart thermostats to the portfolio of the organization. The performance on flexibility to introduce
new products or services, both utility and non-utility based is large in the system.
The freedom provided to create free text invoices based on one-time items has a slightly higher chance of
introducing (billing) errors. It is possible to reduce this risk by limiting the possibilities. The same
freedom however makes it very easy for utilities organization to use free text invoices / one-time items to
resolve other (billing) errors that might have occurred.
Goals closely related to the process are: reducing the error probability and impact, reduce customer churn,
the ability to introduce new non-utility products.
The process flow model is given in Appendix 13G, the process is considered valid.
3.3.8. Performing billing runs
For the billing process contains several large steps, the prices of products need to be determined, meter
data needs to be acquired, validated and if necessary corrected or estimated. Next, the system can perform
the actual billing.
Contracts are grouped in different billing runs upon creation. This allows the system to perform billing
runs for specific contract types. The system can perform validity checks for specific billing runs; this

38
reduces the error probability and impact. The spreading of the billing runs is also reducing the cost-to-
serve significantly since it facilitates load balancing for both the system as the operators.
The use of both consumption based and non-consumption based items in combination with the product
models allows the system to be very flexible for utilities products. The system supports multi-fuel
billings, complex tariff structures.
Important goals for this process are reducing the cost to serve, reducing error probability and impact, the
ability to introduce new utility products and contracts.
Appendix 13H provides the process flow model, the process is considered valid.
3.3.9. Payment plan creation & credit management
In case a customer is not able to meet the payment terms of his bills the utilities organization will execute
the credit management processes of the ERP system. For every customer the system keeps a credit score,
which starts at zero. Every credit management action taken will result into penalty points for the
customer.
The default (and preferred) method in the ERP system is the creation of a payment plan, in which a bill is
split into smaller parts, due at different moments. An important moment is the decision when setting up a
payment plan is no longer sufficient and the organization must decide to escalate the case to a collection
agency or to disconnect the customer. The system does not provide automatic support for this decision.
When payment problems arise the employee handling the account must manually investigate the clients
(payment) history and decide on the action taken. This has both advantages and disadvantages. Credit
management is a difficult task, which has much influence on user satisfaction and customer churn.
However the utilities organizations should at the same time limit their financial risk exposure. The active
human involvement in this process can improve the customer satisfaction, however also increases the
probability of errors.
The impact of errors is rather low. In the worst case the organization has to write off the, this however can
always occur. The credit point rating provides a safeguard to prevent the credit problems form expanding.
The error probability of the process itself is relatively high as a result of the user freedom. However in
practice credit management decisions will be made by more senior employees, lowering the error
probability.
It is important to monitor the credit management processes to ensure that the organization does not make
errors and treats its customers fair since the system forces (or prevents) no actions.
Important goals for this process are increasing customer satisfaction, reducing customer churn and
reducing the cost to serve (write-offs are part of the cost to serve).
Appendix 13I gives the process flow model, the process is considered valid.
3.3.10. Activities & services (Service call handling)
In numerous situations a customer can contact the utilities organization for questions, to change a product
or service or solve a problem. Customers contact the utilities organizations very frequent for a number of
questions/requests, where other requests are made sporadically. If the organization handles the large
portion frequently made requests as efficient as possible. The organization reduces the cost-to-serve as
much as possible.

39
In case the front-office employee who received the call the service call cannot resolve it, he will have to
generate an activity for an employee who does have the expertise or possibilities to resolve the call. The
standard activities supported by the system are: tasks, meetings and appointments.
Important goals for this process are increasing customer satisfaction, reducing customer churn and
reducing the cost to serve, mostly by reducing lead times and ensuring higher first call resolution rates.
Appendix 13J gives the process flow model, the process is valid.
3.3.11. Meter data acquisition
Meter data is required in order to calculate the consumption of utility products. The organization receives
meter data from either manual readings or automated (smart) readings. The manual reading process
receives meter data once a year, which is used to generate the utilities bill. Once every two or three years
a meter has to me read by a meter reader, in most countries with deregulated utilities this is an employee
of the distribution grid operator. This ensures the metering data has a higher reliability and allows a
manual inspection of the meter to prevent fraud.
Automatic and smart meters transmit metering data multiple times an hour to the distribution grid
operator. This data allows the organizations to generate accurate forecasts and balance grid loads better.
However for the final bill only one reading per billing period is used (one reading per tariff/register).
The production of manual meter readings cards is in most cases outsourced to other parties. The billing
department imports the generated metering data from records provided by the external party (or meter-
reading department). The system allows metering data from a number of sources. In most cases this is still
the yearly manual read performed by the customer, he can provide the index value to the organization by
returning the reading card, calling the contact center or using the web interface. Other sources are meter
readings performed by a meter-reading agent who can log the index values on a PDA or index values
received from the customer after contacting the customer with another method.
The system validates the date using a set of validation rules. In case of errors the system will escalate the
reading in most and will require manual validation or correction. The system has three states which can be
given to the index values provided; automatically accepted, automatically accepted with a warning/low
reliability and automatically rejected (with a warning).
An employee will in this case have the decision on which action to take depending on company policies
for the reading that raised a warning.
The system is very flexible in setting up validation rules for different types of customers and allows
correcting and updating metering data in case of errors or problems. This makes the Error impact low,
especially with the possibilities to solve even large errors using the free text invoice problems. The
system combines metering data from different sources easily and keeps track of the source of the data.
Assigning different reliability levels to the data and keeping it transparent. The ERP system can handle
metering data from a large variety of sources and can handle large amount of smart and manual readings,
providing large utility product flexibility.
Important goals for this process are increasing customer satisfaction, reducing customer churn, having the
ability to introduce new utility products and reducing the cost to serve.
Appendix 13K gives the process flow model; the process is considered valid.

40
3.4. Conclusion Based on the expert opinion the process flows for the standard MECOMS processes are validated. This
gives a qualitative answer to the question: What is the expert opinion on the goal performance of the out-
of-the-box ERP solution?
In general, experts consider MECOMS processes to be very flexible (appendices 5, 6, 8, and 9). This is
both due to the rather limited description of the process that allows for flexible interpretation, as the
design of the MECOMS system, which aims to keep the utilities product, and service parts flexible.
The system is meeting current regulatory demands. Processes in general are easy to execute and do not
require much effort, although the degree of freedom users have will also require users to be capable to
work with this freedom. Information is quickly accessible and usable. The designers have aimed to build
an ERP system that supports a modern utilities organization with much flexibility and product support.
The focus on flexible utilities products and short lead times is very clear throughout all processes and
functionality. For every process it is identified which goals are the most important, although in most cases
all goals are important in some degree for every process.
Chapter 5 will give the quantitative comparison between the out of the box MECOMS processes and the
HPUM processes.
41
4. HPUM process evaluation In the same way as in the previous chapter the HPUM processes are evaluated using interviews with
utilities and ERP experts. The experts will validate the correctness of the HPUM processes and determine
if they are meeting the (regulatory) demands for the processes. This information together with the survey
results will answer the question: What is the expert opinion on the goal performance of the best practice
reference architecture? Chapter 5 gives the actual comparison between the MECOMS and HPUM
processes. This chapter determines the validity of the processes and if they meet the minimal
requirements set for different processes. It is determined if processes do what they should and meet
regulatory demands. This enables utilities experts to overrule the outcome of the actual comparison in
chapter 5.
First, the method used to answer this question will be clarified, after which the expert opinion on the
selected processes is summarized. Appendix 14 contains a more detailed version of the experts’ opinion
on the HPUM processes.
4.1. Method The HPUM has in total 6 levels, as indicated in chapter 1. The process flows on level 5 and level 6 are
modeled using event driven process chains (EPC) by Accenture. In most cases these models are the result
of SAP and Oracle implementations done by Accenture in the past decades. Using the RapidValue
modeling tool and the method described by (Tscheschner, 2010) the EPC are translated to BPMN models.
The EPC’s did not include user roles. The BPMN models however do, using lanes to identify different
users. For this purpose 24 roles are identified for utilities suppliers.
In the interviews, the experts validate the BPMN processes. This ensures the processes do what they are
supposed to do and meet current (regulatory) demands.
The interviews are structured by sending the process flows to the subjects prior to the interview. In the
interview the processes are discussed one by one. The questions asked are; is this process valid, does it do
what it is intended to do, how it performs on the goals determined and which KPI’s are relevant for this
process.
4.2. Process description and expert opinion The expert makes an important notion about the HPUM process architecture in relation to MECOMS. In
fact the HPUM actually describes processes and is much more than a description of how the ERP system
should be used. ERP is in fact just a tool and the described MECOMS processes are explaining the tool.
Where HPUM consists of processes that are much broader than the ERP system, they are actual business
processes that cover all the activities involved. This could be seen as a different paradigm, looking at ERP
as process-oriented instead of transaction-oriented, appendix 15.
HPUM is a combination of different processes originating from projects at different utilities organizations
over the past decades. The process models on a high level are generic for all utilities organizations. On
lower levels the processes are specific for regulated or deregulated markets and have regional variations.
In many cases utilities organizations have their own processes developed over the years and are (like in
other organizations) reluctant to abandon their processes in favor of a new architecture (Wagner &
Newell, 2004). The opinion of the experts interviewed also reflects this notion (appendix 4, 6, 15). The
expert states that he considers the best practices processes under investigation as a consulting tool to

42
benchmark the current processes in place. Utilities organization could well have better processes or have
worse processes; the organization itself will have to decide which is better together with the consulting
organization. They could use the framework in this report to do this. In the latter case, organizations can
use the best practice architecture as an alternative process or source of inspiration to design a new
process.
The HPUM has a layered architecture with a tree like structure with generic high levels and detailed
lower levels. The two lowest levels of the architecture define the actual process flows are defined in the
two lowest levels of the architecture, which makes these layers the most interesting for analysis.
Unfortunately the lowest level is in most cases extracted directly from past consulting projects from the
Accenture. This makes the process in many cases specific towards either a single utilities organization or
a specific software tool to execute the processes, in most cases SAP or Oracle. These flows are not
relevant to score the processes on their goal achievement capabilities since it is unclear to which extend
they will be the same in other implementations. The flows do provide information on what the flows
capture and how complete they are. Table 4 provides an overview of the layers; it gives the level, a
description of the level and examples of processes or groups on this level. Level 5 and 6 are the event
driven process chains.
Table 4 Process Hierarchy
Level Description Examples
1 High level overview
2 Areas Supply management, strategy management
3 Sub area’s Investments, marketing
4 Process groups Payment handling, data optimization
5 Processes Reimburse payments
6 Sub processes Reverse direct debit transaction
During interviews the experts perform a detailed process analysis in order to capture their opinion on the
goal achievement capabilities of the processes. The following paragraphs provide the results of these
interviews. The names of the processes are those as used in level 4/5 of the process architecture.
4.2.1. Opportunities and Lead management
The opportunities and lead management process is used to identify, capture and process new business
opportunities for the utilities organization in both the B2B and the B2C market. The goal of the process is
to generate new utility customers. Appendix 16A provides the flow of the process.
The process is a highly structured process; a general effect of highly structured lead management
processes is that the process (execution) becomes more important than the final output of the process. In
this case that will result in less opportunities becoming customers but those who do become “results” will
be of higher quality in general.

43
This process useful for a specific group of customers (large volume B2B customers with specific needs)
however, the majority of the customers should not be bothered with this process since it is to complex and
will actually result in the loss of leads.
The goals that relate to this process are: reducing cost-to-serve, reducing lead-time, meeting regulatory
demand, reducing customer churn and the ability to introduce new products. The process is considered
valid.
4.2.2. Rate analysis and Maintenance
The rate analysis and maintenance process is used for both commodity and non-commodity rates. The
process has different sub-process depending on the type of rate that is processed. The initial steps of the
process determine the need of analysis and maintenance of a specific rate. After this is determined, the
actual analysis will take place and result in maintenance if necessary. The final phases determine to which
customers the changes apply. The expert considers this one of the most important processes for utilities
organizations.
A positive and interesting fact of this process is the distinction which is made between individual and
mass rates and the determining if a rate should apply for every customer (in a group). Organizations could
have specific reasons to give specific groups or individual customers different rates, the possibility to also
make these distinctions in this process are a strong point. The complexity of these rates determines the
need for analysis and this process seems to consider those, making the process very useful.
The process enables organizations to follow changes in regulatory demands fast and introduce new
products and services faster since the structured approach makes efficient rate analysis and maintenance
possible. The process is very complete, including tax exemption, interest and networking rates. The
approach with analysis and checkpoints at critical and strategic points reduces the error possibility of the
process.
Important processes are the ability to introduce new products fast, reducing error probabilities, impact and
lead-time. This will result in lower cost to serve and higher customer satisfaction, with lower customer
churn as a result.
Appendix 16 B gives the process flow model, the process is considered valid.
4.2.3. Move in process
The move in process moves a customer in to a premise and starts the utilities service. The process makes
a distinction between regulated and deregulated markets. The process supports different scenarios for
move-in only or move-ins which relate to the moving out of another customer. The process supports both
premise based and non-premise based move-in processes.
Unfortunately this process is not compliant with current legislative demands and will not meet future
demands either. (Energie Data Services Nederland, 2012).For this reason further analysis of this process
is dropped. Appendix 16C provides the process flow; the process is invalid.
44
4.2.4. Non-commodity billing
HPUM defines sub-processes for the pricing and billing of different type of non-commodity service.
Among these are: energy efficiency support, third party services, construction services and loan charges.
The flow description in appendix 16D shows the complete list of sub processes.
The process actually involves different processes in the architecture; it involves both Pricing and Billing.
Pricing of non-commodity should not be in the processes at all according to the experts. This should be
done by the rate analysis and maintenance process that takes the pricing outside of billing.
On the other hand the process can reduce the customer churn, especially for B2B customers, significantly
since this process can drastically shorten the go-to-market time of new non-commodity products and
services. The process is valid.
4.2.5. Request handling
The request handling process manages the call center operations of the utilities organization. It handles
the different requests a customer can have which are not captured by other processes such as moving
in/out, transfers etc. Among the captured requests are for example providing access to online portals,
account information, miscellaneous information requests, direct debit questions and fieldwork requests.
Appendix 16E gives the flow of the process.
The request handling process that handles the call center activities of the organization is able to improve
the customer satisfaction if sufficient types of requests are captured in the provided pre-defined scripts;
the current process supports nine scripts. The flexibility of this process and ability to introduce new
services and product is fully dependent on the flexibility of the employee who executes the process and
not so much on the process itself according to the experts.
An important point, while defining processes and scripts for requests handling is the customer decoupling
point. Until which point should the process be open (flexible) and the customer be able to make the
requests on how he wants to receive the product or service? At a certain point the organization should
make the decision: “this is how we do it”. The extent to which a customer can make requests (or
demands) for certain services differs a lot for different customers. In the case of larger B2B accounts, the
process should not use scripted requests, since an account manager will handle requests flexible. This
makes the provided process more suitable for B2C customers who have an early decoupling point in
which they only have a limited number of choices / flavors for the request types they make.
For B2C customers low flexible call scripts can result in high first time right solution rates for the
different requests which are scripted. For B2B customers however the non-standard approach should be
preferred.
Important goals for this process are increasing customer satisfaction, reducing customer churn and
reducing the cost to serve, mostly by reducing lead times and ensuring higher first call resolution rates.
The expert considers the process valid.
4.2.6. Commodity billing
The process in appendix 16F describes the billing of the utilities product that the customers of the
organization consume.

45
The commodity billing process is likely to have a positive effect on the cost-to-serve. The process checks
for different types of connections: metered, unmetered, smart meters and manual meters before linking
them to the meter data management module. This makes the process flexible and allows the introduction
of new products and services.
The process supports the buyback of energy produced by consumers, which is becoming a more and more
important phase. In combination with smart metering and regulatory demands regarding tax payments on
electricity generated by customers this addition makes the process capable of meeting the regulatory
demands.
Important goals for this process are reducing the cost to serve, reducing error probability and impact, the
ability to introduce new utility products and contracts.
The process is valid according to the expert.
4.2.7. Payment handling
After the invoicing process the organizations will receive payments and redemption requests. The
payment handling process deals with both these events. This process separates the different payment
methods and handles them separately. Appendix 16G contains the flow of the process, which is valid
according to the experts. Important goals are reducing the error probability and impact, lead-time and cost
to serve.
4.2.8. Payment follow-up
In case the payment handling process results in errors or requires additional actions the process escalates
to the payment follow-up process. The process provides scripts for a number of possible scenarios (four)
in order to resolve the issue. Appendix 16H contains the flow description.
The experts doubt if this process is effective and consider it not suitable to increase customer satisfaction
or reduce cost-to-serve. Exceptions in payments, especially those targeted by this process, need to be
handled individually. For these situations it is more important an employee has access to all the necessary
data quickly and is able to analyze the exception than a structured scripted solution. In most situations
expert considers the scripted solution to be insufficient.
If the current process needs to handle all possible exceptions, the process needs to be much bigger than it
is. A positive side is that there is at least a plan to target payment exceptions. Important goals are reducing
the cost to serve, customer churn, error impact and error probability. The expert considers the process
valid.
4.2.9. Credit management
The utilities organizations use the credit management process to manage any credit a customer can have
with the utilities organization. If a customer is unable to pay an invoice on time the credit management
process starts. Appendix 16I provides the flow description of the process.
The expert considers the credit management process is one of the most important processes for utilities
organizations. The main goal of the process is reducing the write-off costs of utilities organizations,
which can go up to 6% of the cost-to-serve (Datamonitor, Oct. 2011). The expert considers the process
valid.

46
Important goals for this process are increasing customer satisfaction, reducing customer churn and
reducing the cost to serve (write-offs are part of the cost to serve).
4.2.10. Credit management arrangements
The credit management arrangement process generates payment plans and other amicable settlement
programs. The process has two separate triggers; either a customer can request a payment plan or the
organization can decide a customer requires security deposits or a payment deferral plan. This should
limit the amount of write-offs due to bed debt to the organization, reducing the cost-to-serve. A part that
is missing in the process is the ability to combine invoices and add new invoices to an already opened
credit management file. Important goals for this process are increasing customer satisfaction, reducing
customer churn and reducing the cost to serve (write-offs are part of the cost to serve).
Appendix 16J gives the process flow description; the expert considers the process valid.
4.3. Conclusion The expert has validated the HPUM processes. It is determined if the processes meet the current
regulatory demands and if the flow descriptions are valid. A qualitative answer to the question: What is
the expert opinion on the goal performance of the best practice reference architecture? is given. This in
combination with the survey in chapter 5 will provide a comparison between the out of the box
MECOMS processes and HPUM.
The expert opinion to this point considers the HPUM models to be rigid and aimed to generate high
quality output of the processes. This is mostly identifiable by the error probability and impact in the
processes. The experts expect the flexibility to be lower in case of HPUM by the expert than in
comparison with other architectures. The processes are however expected to be more time consuming. If
an organization uses the correct processes from HPUM it should be able to reduce the cost-to-serve. This
however will require a critical review of the lowest levels of the HPUM architecture to ensure they are
meeting current regulatory demands and that individual processes are not conflicting.

47
5. Expected process performance comparisons. In order to be able to compare the predicted performance of the utilities processes utilities organizations
must take more characteristics than only goal realization into account. Cai et al. (2009) also indicate this
for other organizations.
This chapter compares the MECOMS standard processes and the HPUM processes based on their
expected goal realization. The functionality of the processes is determined in chapters 3 and 4. This
enables the comparison of the expected goal performance in order to answer the question: 1d. What is the
expected performance of the ERP system compared to the best practices processes?
This chapter makes the comparison a number of processes from the MECOMS and HPUM architecture. If
the results show the method used is correct and the results are valid, a next phase can broaden the scope
of the comparison.
This chapter again looks at goals for the utilities organizations in order to compare the HPUM and
MECOMS processes. However during actual operations the use of goals is not possible without using
KPI’s to be able to measure the goal performance and make operational decisions to improve the goal
performance. (Kuziemsky, Liu , & Peyton, 2010) Describe the importance of linking KPI’s to goals in
order to make the goals usable during operations. Cai et al. (2009) who state the importance of having
KPI’s also describe this. In order to link the processes and goals to KPI’s additional research is done. The
results are summarized in appendix 25. This gives information on how to make the conclusions of the
goal based process comparison given in this chapter useful in the daily operations.
First this chapter discusses the background on the performance comparison, after which the method used
to predict and compare the performance of both model architectures is described. The last part of the
chapter summarizes the results.
5.1. Background It is possible to look at the performance of processes for utilities suppliers from different perspectives. On
a high level the performance of the entire architecture can be investigated and on the lowest levels the
performance of specific activities can be determined. For every level different metrics and goals can be
set to determine the performance of the specific layer. In general the overall performance of the high-level
organization will be determined combining the performance of the lower levels (Tan, Shen, & Zhao,
2007).
Defining goals for strategic, tactical and operational levels covers a part of this hierarchy is already, as
described in the chapter 2 Goals for utilities processes. Tan et al. (2007) provide a model to combine the
performance of individual processes and dimensions and aggregate this to an overall performance of an
enterprise. In the case of Tan et al. (2007) the model compares process architectures in a manufacturing
setting. They compare a number of dimensions (cost functions) in order to facilitate the decision process
between different process architectures. They use activity based costing (ACM) and look at performance
on enterprise, single process and single measure levels. The authors distinguish seven different levels:
time, quality, service, cost, speed, efficiency, and importance in order to evaluate a process.
Until this point for utilities processes however only goal realization has been taken into account; Goal
realization is however only one dimension to look at performance of a process, other dimensions which
are commonly used to evaluate performance of processes are: cost, quality, time and flexibility (Neely,
2005) (Reijers & Liman Mansar, 2005). The dimension cost can also include also effort. Using the

48
“devil’s quadrangle” (Reijers & Liman Mansar, 2005) the relation between the four dimensions is given.
It is not possible to change one of the dimensions without influencing the others. If the four dimensions
where to be set out on a 2D plane the area spanned by the measures will remain the same when the
performance of a measure changes as shown in Figure 44.
Figure 4 Devil's Quadrangle
5.2. Method Different models are available to compare process performance on different metrics and dimensions.
Since the primary source of information in this research project consists of expert opinions, the use of
models that use expert opinions to evaluate process performance are preferred.
Tan, Shen and Zhao (2006) develop the first model used; they use different measures in their
methodology to aid the decision process and performance evaluation for enterprise processes. They
compare six types of process flows: Activity-, product-, resource-, cost-, cash- and profit flows to
compare processes in a production setting. These flows are evaluated using seven evaluation criteria:
time, quality, service, cost, speed, efficiency and importance. Other research shows that only four
orthogonal criteria: time, quality, cost/effort and flexibility are also capable of capturing all relevant
characteristics of process performance (Reijers & Liman Mansar, 2005). However in order to be
complete in equation 1 the single process evaluation for every process j over evaluation criteria n is given,
in which either the 4 or 7 criteria could be used.
∑ (1)
is the weight factor for the score, indicated by . The model then combines the single processes in
an integrated enterprise process evaluation using equation 2 with weight factors for specific processes.
∑ (2)
Tan et al. (2007) developed the methodology for a production environment; however some metrics are
also applicable to the utilities industry. For example the process target achievement, which they relate to
the quality of the process. Using expert opinions the attainability of a goal i by process j is given by Aij.
The model weights the attainability with the normalized importance of a given goal . This results in the
contribution the contribution of a process to the goals. As given in equation 3.
∑ (3)
Cost
Qualit
y
Time
Flexibility

49
This however indicates that all goals are of equal importance for the every process, however in the case of
the utilities goals as set in chapter “Goals for utilities processes” this is not the case. Specific goals have
different priorities for different processes. For this reason the function needs to be updated to equation 4.
∑ (4)
Using two surveys send to utilities experts the ability of a process to meet a goal and the relevance of the
specific goal are determined. In the previous chapters it was determined which goals are important for the
utilities organizations, the importance was however not quantified for specific processes yet. Experts in
the previous interviews where only asked for the expected realization of a goal and not the importance.
The weight factor or relevance is determined on a scale from 0 to 10 (0 = totally not relevant, 4-6 =
moderately relevant, 7-8= relevant, 9-10= very relevant) for all goals determined. Next the ability to meet
this goal is asked on a 0 to 10 scale as well, scale (0-2 = Breaks, 3-5= Hurts, 6-8 = Helps, 9-10 = Makes).
All goals are included in the questionnaire for every process.
The research uses two separate questionnaires for the different process architectures; with a period of 3
weeks between the sending out of the questionnaires. This ensures the questionnaire does not bias the
respondents when filling in the second. In the second questionnaire the respondents do not fill in the
relevance of a given goal for a specific process. The first questionnaire has already determined the weight
factors for the different goals. The complete questionnaires are provided in appendix 17 and 18.
For every process the respondents are also asked to fill in the “devils quadrangle” (Reijers & Liman
Mansar, 2005) for cost/effort, quality, time and flexibility. Research states that it is possible to capture all
process criteria with these four dimensions (Neely, 2005). In all cases 1 is the worst score and 10 the best
score possible, the total points on the four dimensions must add to 20 for every process. The model of Tan
et al. (2007) uses these scores together with to determine the score of a process and the complete
enterprise. The devils quadrangle scores are denoted as:
. This results in an updated version of equation 1,
given in equation 5 in which , , are the aggregated normalized weight factors for the given
dimensions. is the average importance/relevance given for all processes and all goals, also normalized
with , and . This determines how important/relevant goal realization is for the process
architecture according to the expert opinions. Since the original equation by Tan et al. (2007) also
included more criteria than the four orthogonal criteria from the Devils Quadrangle, the method stays
valid after the introduction of new criteria, in this case , the goal contribution. It is possible to substitute
this criterion by for example the service component from Tan et al. (2007). The result is equation 5 in
which the five criteria that are relevant for the utilities processes are used.
(5)
The weight factors , , are determined by averaging and normalizing the importance of all
goals which can be related to one of the dimensions, as given in equations 6 and 7. In these equations the
average importance of all goals i out of set sx, a subset of all the goals S for all K processes in scope is
determined in which { }
∑ (∑
)
(6)

50
(7)
This altered version of the method by Tan et al. (2007) provides a score for every process in MECOMS
and HPUM, in which the process with the highest score is superior over the other process based on goal
realization, time, quality, flexibility and cost/effort, weighted for the specific process and the architecture.
It is possible to calculate the performance of the entire process architecture using equation 2; however it is
also possible to select the strongest processes from both architectures (MECOMS and HPUM) and build a
new, best, architecture.
A second model which is used is proposed by Seçme et al. (2009), called the TOPSIS (Technique for
Order Performance by Similarity to Ideal Solution) method. This model compares the goal realization of a
given process with two ideal solutions, a positive ideals solution (PIS), which maximizes outcome while
minimizing the cost and a negative ideal solution (NIS) which has opposite logic. For every process the
distance to both ideal solutions is calculated and the relative closeness to the best solution compared with
the worst is determined.
Seçme et al. (2009) use this model to evaluate non-financial metrics/goals for the Turkish banking sector
such as: pricing, differentiation, marketing, delivery service and productivity. For every of these high
level, strategic, metrics a number of lower level, operational, metrics such as: deposit rates, service
quality, branch locations etc. (27 in total) are defined. Experts score the different performance indicators
in a survey for a number of financial institutions.
In the model of Seçme et al. (2009) the weight factors for a goal can be different for specific processes,
this fits to the utilities case stronger than the original model by Tan et al. (2007) in which a goal has the
same weight/relevance for every process. In the TOPSIS method the weight factors are first normalized
for every process using equation 8 for process j and goal i in which denotes the weight factor of
process i for goal j.
√∑
(8)
Next the attainability of the goals, called the decision matrix by Seçme et al. (2009) is multiplied with the
normalized importance as given in equation 9.
(9)
The distance from this matrix is then determined from the PIS and the NIS solution. In the MECOMS
and HPUM research the best theoretical outcome is a process scoring 10 points, make, on every goal
regardless of the importance/relevance of the goal. The worst theoretical outcome is receiving a 0 on all
goals regardless of the importance/relevance of the goal. The PIS and NIS matrix can be determined by
multiplying the normalized goal importance with 10 and 0 for the PIS and NIS respectively, equation 10
and 11.
(10)
(11)
Equation 12 determines the distance for a single process j from the PIS, equation 13 does this for the
distance to the NIS.

51
√∑
(12)
√∑
(13)
The closeness of a process to the PIS relative to the NIS is calculated using equation 14.
(14)
By looking at both the methods of Tan et al. (2007) and Seçme et al. (2009), it is possible to provide a
useful comparison between two process architectures based on a limited number of expert opinions. Both
models roughly do the same, however the calculations are different. The PIS an NIS matrix of Seçme et
al. (2009) allow the compare the processes in a more complex dimension if other values for the PIS and
NIS are used. It is also for example possible to put other measures in the model such as quantitative
measures such as KPI performance, rather than only looking at the expected goal performance on a 0 to
10 scale. In this research this however is out of scope and both Tan et al. (2007) and Seçme et al. (2009)
should provide the same result if the calculations are correct. The combination of models compares the
results for validity this way.
The comparison becomes more transparent than by just looking at the opinion of experts in the interviews
and is a way to provide a valid quantitative comparison within the scope and limits of the research. New
information (returned questionnaires) can be added to the comparison at every moment. Should the
company decide to pass the survey to more experts inside the organization or external experts the data can
be added relatively easy and improve the comparison even further. Selecting only relevant experts with
experience in implementing ERP systems in utilities organizations protects the value of the limited
number of results.
5.3. Survey results The surveys for the MECOMS and HPUM processes are sent to four utilities and ERP experts from
Avanade, this are the only utilities ERP experts within Avanade the Netherlands and Belgium with expert
knowledge of the utilities industry. One has returned both surveys, two of them have returned one of the
surveys and the fourth did not reply to the questionnaires. In total two complete questionnaires are
received for every process architecture. The answers to the questionnaires are included in appendix 19.
Missing values in the questionnaires are discussed with the respondents, for the different types of missing
data different strategies are determined with the respondents; goal importance/relevance did not have any
missing data. The goal realization did have some missing scores; the respondents indicated to have left
the field open for two separate reasons. In some cases they indicated not being familiar with the process
enough to provide a correct answer, in other cases they indicated the process not influencing the goal
making the answer irrelevant (according to them). In the first case the data is left out and the process
score determined by the average of the other respondents answers. In the second case the respondents
were advised that the relevance is determined by the first question “importance/relevance” and this should
not influence their answer on the degree of goal realization. After which the subjects provided an answer,
in some cases they chose the neutral score: 5 (processes does not help or hurt the goal).
A small “Easter egg” was included in the survey. It included the following sentence: A customer has
different ways of paying an invoice: cash, direct debit, bank transfer, bitcoins??? In fact the system does

52
not support bitcoins. This is only a reference to current events in the media used as a test to determine if
the respondents read the entire questionnaire. All respondents saw this detail and drew a smiling face next
to it. This indicated they all read the questionnaire thoroughly and makes their answers trustworthy. It is
unclear why all of them decided to draw a smile at the Easter egg.
After solving the missing data errors, the average score for all answers is determined. Next equivalent the
MECOMS and HPUM process are mapped to each other. In most cases this is a 1-to-1 relation however
in four cases it is a 1-to-n (3 times) or n-to-1 (ones) relation. In those cases the average score over the n
processes is determined in order to acquire a 1-to-1 pairing of 10 processes in MECOMS and HPUM. The
activities performed in the process are the basis of the mapping. The mapping is determined by what the
processes do for the utilities organization or customer and the interviews performed. Table 5 shows the
resulting mapping of the MECOMS and HPUM numbers relate to the number of the question in the
survey.
Table 5 Process mapping
Process name/description number MECOMS number(s) HPUM number(s)
Prospect management 1 1.1 1.2 1.3 1
Request handling 2 4 5.1 5.2 5.3 4
Rate analysis & setup 3 7 2
Credit management 4 8 8 9
Commodity Billing 5 9 5
Non Commodity Billing 6 10 3
Billing corrections 7 11 7
Payment handling 8 12 6
Contact logging 9 6 Missing process
Connection mutations 10 2 3.1 3.2 3.3 Outdated,
The survey results are included in appendix survey result.
First the method of Tan et al. (2007) compares the MECOMS and HPUM processes. The goal
achievement for every process is multiplied with the normalized importance (weight factor) and added for
all the goals as indicated in equation 4 to calculate the goal achievement score for every process.
Resulting in Table 6
Table 6 Goal Realization
Process 1 2 3 4 5 6 7 8 9 10
MECOMS Cj 5.88 5.35 5.53 5.52 6.10 5.53 5.72 4.61 4.00 5.71
HPUM Cj 6.53 6.12 6.70 6.16 6.23 6.66 6.03 6.03 -2 -
3
2 Process missing
3 Process outdated
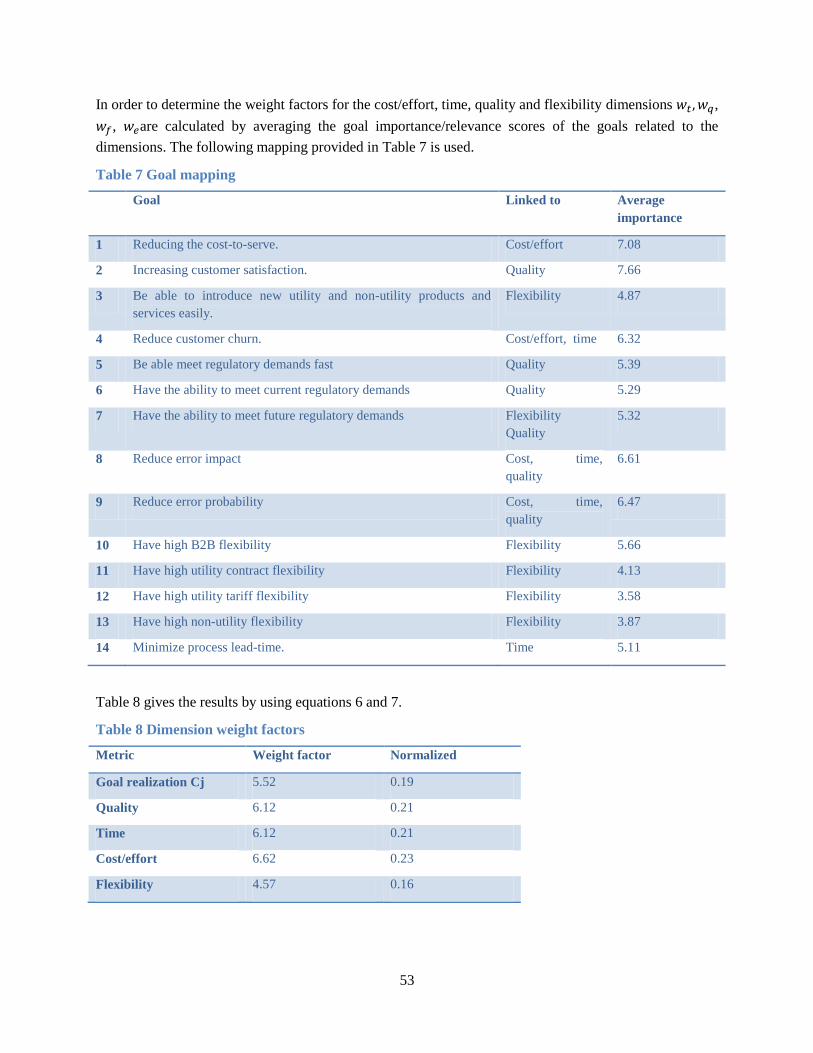
53
In order to determine the weight factors for the cost/effort, time, quality and flexibility dimensions ,
, are calculated by averaging the goal importance/relevance scores of the goals related to the
dimensions. The following mapping provided in Table 7 is used.
Table 7 Goal mapping
Goal Linked to Average
importance
1 Reducing the cost-to-serve. Cost/effort 7.08
2 Increasing customer satisfaction. Quality 7.66
3 Be able to introduce new utility and non-utility products and
services easily.
Flexibility 4.87
4 Reduce customer churn. Cost/effort, time 6.32
5 Be able meet regulatory demands fast Quality 5.39
6 Have the ability to meet current regulatory demands Quality 5.29
7 Have the ability to meet future regulatory demands Flexibility
Quality
5.32
8 Reduce error impact Cost, time,
quality
6.61
9 Reduce error probability Cost, time,
quality
6.47
10 Have high B2B flexibility Flexibility 5.66
11 Have high utility contract flexibility Flexibility 4.13
12 Have high utility tariff flexibility Flexibility 3.58
13 Have high non-utility flexibility Flexibility 3.87
14 Minimize process lead-time. Time 5.11
Table 8 gives the results by using equations 6 and 7.
Table 8 Dimension weight factors
Metric Weight factor Normalized
Goal realization Cj 5.52 0.19
Quality 6.12 0.21
Time 6.12 0.21
Cost/effort 6.62 0.23
Flexibility 4.57 0.16

54
Using the normalized weight factors in equation 5 the for all processes j is calculated
and given in Table 9 for MECOMS processes and Table 10 for HPUM processes, in this case the score
for processes 9 and 10 is 0 since the process is missing in HPUM or outdated.
Table 9 MECOMS Process score
Process 1 2 3 4 5 6 7 8 9 10 Norm weight
Cj 5.88 5.35 5.53 5.52 6.10 5.53 5.72 4.61 4.00 5.71 0.19
Quality 5.33 4.70 4.00 5.00 4.00 7.00 5.50 3.00 4.00 5.00 0.21
Time 5.17 4.60 4.00 5.00 5.50 5.00 5.00 3.00 5.00 4.75 0.21
Cost/effort 4.50 5.60 5.00 5.00 5.50 5.00 4.50 9.00 5.50 4.75 0.23
Flexibility 5.00 5.10 7.00 5.00 5.00 3.00 5.00 5.00 5.50 5.50 0.16
Process score 5.16 5.07 4.99 5.10 5.22 5.21 5.13 4.99 4.79 5.10
Table 10 HPUM process score
Process 1 2 3 4 5 6 7 8 9 10 Norm weight
Cj 6.53 6.12 6.70 6.16 6.23 6.66 6.03 6.03 0.00 0.00 0.19
Quality 2.00 6.00 4.00 5.00 5.50 4.50 3.00 4.50 0.00 0.00 0.21
Time 8.00 7.00 7.00 5.50 4.50 5.00 6.50 6.00 0.00 0.00 0.21
Cost/effort 4.50 4.00 4.50 5.50 8.00 4.00 7.00 5.50 0.00 0.00 0.23
Flexibility 5.50 3.00 4.50 4.00 5.50 6.50 3.50 4.00 0.00 0.00 0.16
Process score 5.26 5.30 5.34 5.28 6.00 5.22 5.31 5.26 0.00 0.00
If the process scores are combined to determine the enterprise score using equation 2 with = 0.1 for all
processes the enterprise value for the MECOMS and HPUM processes are given in Table 11.
Table 11 Enterprise score
Architecture
Ignoring process 9 and 10.
MECOMS
Enterprise
5.08 5.11
HPUM Enterprise 4.30 5.37
Best enterprise 5.29
If goal realization is left out of the comparison, since research has stated that it is possible to aggregate
almost all criteria under the dimensions cost, flexibility, time and quality (Cai, Liu, Xiao, & Liu, 2009)
the enterprise comparison is given in Table 12 which shows the average score for the four metrics for
both process architectures.

55
Table 12 Devil's quadrangle score
MECOMS HPUM Best
Time 4.75 4.19 MECOMS
Quality 4.70 6.63 HPUM
cost/effort 5.44 5.06 MECOMS
Flexibility 5.11 4.12 MECOMS
Total 20 20
Using the TOPSIS methodology of Seçme et al. (2009) it is determined if the results of the goal
realization has the same conclusion as the closeness to the PIS and NIS solution as described in the
second model. Table 12 provides the closeness for the processes.
Table 13 Process closeness
Process 1 2 3 4 5 6 7 8 9 10
MECOMS 0.58 0.55 0.55 0.56 0.61 0.54 0.58 0.46 0.53 0.58
HPUM 0.65 0.63 0.67 0.62 0.61 0.68 0.61 0.62 0.00 0.00
Both the closeness and the goal expected goal achievement score have corresponding results for
the processes evaluated as is expected. The survey results confirm the opinions given in the expert
interviews. They expected that the HPUM processes outperform the MECOMS processes on most of the
goals. Using the goal realizations scoring in the survey the validity of the goal hierarchy as provided in
Figure 2 and
Table 2 is checked. However a correlation calculation between the goal realization scores from the survey
did not support the assumed relations. Appendix 20 shows the correlation matrix of the goal attainability;
however no statistically significant conclusions can be drawn from this as a result of the small sample
size.
5.4. Conclusion Using surveys and two models to determine the value of business processes the out of the box MECOMS
processes and HPUM are compared based on expert opinions. This answers the first part of the question:
1d How can expected performance of the ERP system and best practices processes be compared and
measured during operations?
Unfortunately the number of respondents was low. However a number of conclusions can be draw
regarding the comparison of MECOMS and HPUM processes.
Using the goals determined for the utilities processes for every process the expected goal realization is
determined. This shows that in all processes in scope the HPUM processes outperform the MECOMS
processes. The only exceptions are processes that are not present or outdated in HPUM.
56
If the comparison only looks at quality, time, cost and flexibility, MECOMS outperforms the HPUM on
all dimensions, except on quality. This is in line with what is expected from the MECOMS
documentation that also indicates that MECOMS is directed at saving time and money while being
flexible (Ferranti, 2012). The HPUM documentation also indicates that the intent of HPUM is to
outperform other processes primarily on quality (Accenture, 2009).
The differences in functionality between the MECOMS and HPUM processes are identified using the
expert opinions in chapters 3 and 4. This would allow also for a functional comparison between the
processes, however a good comparison would then also require a method to measure the cost of the
functionality. This will then be a micro comparison as described by Han et al. (2009). In this research the
additional functionality to processes, for example more call scripts, influences the results indirectly.
Better or more functionality will enable a process to better score on one or more goals than other
processes; for example the goal achievement (related to) customer satisfaction will increase. The value,
the expected goal performance, which is higher for processes with more such functionality, shows this
effect.
The HPUM processes can be a valuable addition to the ERP solution if an organization aims to improve
the goal realization and quality of the processes used in the organization. The method described in this
chapter is suitable to compare all processes that a utilities organization is willing to implement or re-
design. By using weight factors tailored to the specific organization, it is also possible to make the
comparison for individual situations and organizations.
57
6. The use of RapidResults BPMN models. Another important of the RapidResults method is the use of the BPMN models in the included BPMN
modeling tool, not only by the consultants in the implementation phases but also by other (key-) users
within the utilities organizations.
The selected process models for the utilities organizations are modeled in BPMN flows using an
additional plug-in for the ERP system. This plugin allows a subset of BPMN attributes to be used in
modeling business processes, both those executed in the ERP system or executed in other systems or
manually. The activities of the process executed in the ERP system can be linked to the forms needed to
execute the activity. The models do not act as a workflow engine or force a user to execute a process in a
fixed order; they do however provide guidance to the users on how the processes are intended to be
executed.
In this chapter the questions answered are:
2. What are the advantages of the availability of process models within the ERP system if the
processes are not physically enforced by the system?
a. Does the use of BPMN models within the ERP system facilitate better understandability,
of the processes and the ERP system by key and end users?
b. What are the anticipated effects on the usability, readability and completeness of the
BPMN modeling tool used for training key and end users?
In the remainder of this chapter first describes the background of the questions and RapidResults
modeling, after which the method is described, followed by the actual results.
6.1. Background on BPMN models in RapidResults The modeling tool used during the implementation project of the ERP system intends to guide the
implementing companies; the models used facilitate the analysis and (re)design of the processes. Most
ERP systems are transaction oriented rather than process oriented the industries however start to use a
process-based view on their IT solutions more and more. A downside is that in many instances users will
not correctly stick to processes as they are described and abandon the processes over time (appendix 15).
A common problem with (best practice) processes is users are reluctant to change their way of working
and tend to stick to their own methods. This is shown in literature (Wagner & Newell, 2004) but also seen
by experts in the field (appendix 15). The users of the system in many cases fail to recognize the potential
benefits of the new processes. Since the ERP systems is seen as a technical tool to executed processes
(appendix 6), rather than an orchestrating mechanism to guide users through processes, this effect is
explainable.
The ERP system does allow the execution of certain processes using a workflow engine. This
functionality unfortunately is not used in many situations. For the utilities solution in the out-of-the box
implementation only the contract approval and sales process uses the workflow functionality.
In most current implementations the users will receive manuals and training sessions for the new ERP
system, the content of the manuals and sessions is based on information gathered on the business
processes during the development of the solution. Usually these manuals do not provide in detail

58
processes descriptions but have a rather basic step-by-step explanation of the execution of a certain
activities. Typical users however find these manuals and documentation difficult to work with. They
have been known to re-write documentation of the system themselves in order to make them
understandable.
The process models used during the implementation of the ERP system; either best practice based or
designed for the organization itself will remain available to the organization after the go-live of the
system. For the organizations, it is important to ensure the knowledge captured in the process models is
conserved and used within the organization. The implementation method must ensure they do not just end
up in a filing cabinet. The modeling tool also models activities executed outside the ERP system; this way
the system has a bigger scope than for example a workflow engine.
RapidValue, the modeling tool used in the ERP system can generate documentation required during the
implementation of the ERP system. After the go-live this documentation and the models stay available for
the end users. The use of these models and the RapidValue modeling tool however is not yet tested and
validated with end users.
6.2. Method A number of utilities processes from the out-of-the-box MECOMS solution has been modeled in
RapidValue using 3 hierarchy levels; process groups, processes and flow descriptions. The subjects
perform the following tasks in the MECOMS system.
Make a utilities product
Create a prospect
Move in a customer
These tasks are selected out of a list of standard MECOMS training material. Create a prospect and move
in a customer are processes commonly used by most utilities end-users. These processes are comparable
with other common used processes based on time and complexity. The make a product process is more
complex and has a higher error probability. This process will require more information and guidance from
the documentation to be completed. This mix of processes provides ample information to evaluate the
documentation used by the subjects within a reasonable timeframe (expected 1 hour per subject).
During the execution it is measured how many errors are made and how many questions are asked; along
with the time needed to perform the task. At the end of the experiment the subjects receive a short survey
and are interviewed. The survey intends to measure the usability, ease of use, completeness and
readability of the documentation and process models the subjects used in the experiment.
In Appendix 22 the assignments and design of the experiment is included.
The main subjects are Avanade Analysts, employees with up to 2 years’ experience. All subjects are
persons without utilities background and never used the MECOMS solution for utilities. They do have
experience with Dynamics AX (mostly the Healthcare solution). This will give them the ability to reflect
on the training in comparison with trainings they received themselves in the past years and have given to
other users. In addition, they are familiar with the layout of Dynamics AX. They are divided into two
groups, the main group receives the RapidValue training material, and the control group receives the
standard training material from Ferranti.

59
Two additional subjects are selected in order to provide different points of view; one is an Avanade
Analyst who does have some MECOMS experience (however not in the B2C supplier field), he knows
the Ferranti material and is asked to make a comparison. The other subject is an application development
intern with no ERP or utilities experience. He is seen as a typical end user who could work as a call center
agent for a utilities organization.
The experiment combined with the interviews after the experiment should provide enough information to
be able to answer the research question with enough certainty to convince other consultants and key-users
to use the RapidValue process models and tool to transfer knowledge to, and train users of the ERP
system.
6.3. Experiment results The subjects execute the processes correctly; Table 14 contains the results of the experiment. During the
experiment the subjects are allowed to ask questions. The number of questions however is counted. The
time spend to complete the process is also measured for the first two processes and rounded to minutes.
The sample size is too small to make statistical relevant conclusions on process lead-time or the number
of questions asked.
Group A: Dynamics AX analysts with no MECOMS experience (n=2)
Group B: Dynamics AX analysts with no MECOMC experience (n=1)
Group C: Group A + Dynamics AX analyst with MECOMS experience + intern with no experience.
(n=4)
Table 14 Experiment results
Group A Group B Group C
Training material RapidValue Standard RapidValue
Process 1 av. Time 42 minutes 47 minutes 40.67 minutes
Process 1 av. Questions 2.5 7 2,75
Process 2 av. Time 3 minutes 3 minutes 2.33 minutes
Process 2 av. Questions 0 0 0.25
Process 3 av. Questions 1 1 1.25
The researcher monitors the behavior of the subjects during the experiment. Appendix 23 contains the full
evaluation for the different subjects. After the experiment the subjects are asked for their expert opinion
on the documentation they used for the experiment and to grade the documentation on four dimensions:
Readability, Ease of Use, Completion and Understandability. This resulted in a number of conclusions
about the possibilities to use the RapidValue process by end-users of the system. Table 17 provides the
average grades for the different groups.
Table 15 Documentation feedback
Group A Group B Group C
Training material RapidValue Standard RapidValue

60
Readability 7 6.5 6.5
Ease of Use 6.5 5.5 6
Completeness 8.25 6.5 7.625
Understandability 7.5 5.25 7.5
In all measures the RapidValue documentation scores higher than the standard documentation. In the
evaluation (appendix 22) the subjects indicate the process flows are an important contribution to the
documentation. They give the users insight on what they are doing and how it relates to the activities of
others within the organization. The flow description provides a logical overview of where items are
located. Functionality that should be located near each other now is, and you do not have to navigate
through different complicated and illogical MECOMS hierarchies.
The subjects were asked if they would consider using this modeling tool and the flows modeled in them
to communicate and train others. The subjects do not consider the use in communication with other ERP
professionals useful. They are used to the standard documentation and are able to work with these
documents efficiently. They do consider the tool and models useful in order to communicate with key-
users and end-users. They help to make the ERP system process based rather than transaction based. If
users are trained to use the system while using the interactive process models they should even be able to
work more efficient by using the process models as a repository.
The experiment identified a number of usability issues and suggestions for improvements; in most cases
related to the layout of the modeling tool (font size, clickable items etc.) (Appendix 22).
6.4. Conclusion The relative small experiment with Avanade experts in the role of key- users has shown the expected
Readability, Ease of Use, Completion and Understandability of the modeling tool, the models and the
documentation generated from the models in the RapidResults method for example during training
sessions. This answered the questions
2a. Does the use of BPMN models within the ERP system facilitate better understandability, of the
processes and the ERP system?
The results of the experiment show the understandability of the models and documentation in the
RapidResults version to be higher than when using the standard documentation. Users were able to
perform the tasks in the system with less help needed and had a better idea of what they were doing in the
system. It helped the transformation from a transaction-oriented system to a process-oriented mindset
with the users. They are able to see how their work influences that of others and what the overall
processes do. Bradley (2008) identified this as a key success factor in the successful ERP implementation.
2b. What are the anticipated effects on the usability, readability and completeness of the BPMN
modeling tool used for training key and end users?
In general the subjects indicate this training material is (very) suitable to train all types of new users;
however expected should be that the main advantage is present in the training of the key users and the

61
users who are in the higher layers of the utilities organizations. The expected effect is a better and faster
ability to work with the system and use the implemented processes.

62
7. Conclusions and further research This research investigated the RapidResults implementation method for ERP systems. The method
contains a number of differences compared to other ERP implementation methods. This report focused on
the additional value added to the ERP solution by including other best practice processes than the
standard out of the box processes to the ERP system and how the used BPMN modeling tool is able to
transfer this knowledge to key- and end-users of the ERP system in the utilities industry.
Determined is what the advantage of this architecture would be for the utilities organizations after going
live, the most important thing to research than was what value the HPUM processes add to the
organization in comparison with the standard processes in MECOMS. The usability of the used BPMN
process models and modeling tool after going live is also researched. This was done by setting up a small
experiment to predict how key users and end users could be expected to use the models.
Based on the answers on the sub questions in chapters 3 to 7 it is possible to answer the main questions.
1. Do best practice processes improve the operations of a utilities organization in comparison to the
standard processes in an ERP system and how can this be measured?
2. What are the advantages of the availability of process models within the ERP system if the processes
are not physically enforced by the system?
A macro process analysis is performed to compare the processes on a high level, a micro comparison is
not suitable to compare the HPUM and MECOMS processes since the HPUM and MECOMS processes
are modeled for different audiences. The HPUM processes target a management/business audience and
include all actions and activities of utility processes, not only activities related to an ERP system. The
MECOMS processes on the other hand are pure ERP processes targeted at a more technical audience and
describe only activities executed in the ERP system. What happens outside the system is included in
HPUM but not in MECOMS. This makes it not possible to compare the processes 1 to 1 in for example
simulations.
For this reason the processes are compared primarily on their ability to meet goals for utilities
organizations specific. The goals are determined on three hierarchical levels; strategic, tactical and
operational. The most important goals are the strategic goals:
1. Reducing the cost-to-serve.
2. Increasing customer satisfaction.
After using expert opinions to validate the process architectures from the ERP system itself and HPUM a
survey is used to determine the expected goal performance of the processes. The processes in scope and
the architecture as a whole are compared. These results are combined with scores on the dimensions:
time, quality, flexibility and cost/effort. Although the experts where asked to place themselves in the
position of the utilities organization, their opinions are likely to be primed and biased to a certain extend
because of their background.
Overal the HPUM processes within the scope of this research outperform the MECOMS processes on
goal performance and on the quality dimension. The relative simplicity of the MECOMS processes
however outperforms the HPUM processes on time, cost/effort and flexibility. Combining the quality
from the HPUM processes with MECOMS should result in a system with processes of higher value for
utilities organizations. This will require customizations to the MECOMS system in a number of cases, in

63
order to support the HPUM processes, the coding effort required for every process will have to be
detemined.
It is not possible to draw conclusions yet on processes outside the scope, however the method can be
reused to perform the analysis for other processes as well. The small number of surveys did not provide
enough information to provide statistically significant results; it was not possible to validate the expected
relations between the performances of the specific goals.
The performance in a microanalysis would involve actual simulations and measurements of the KPI
performance by the different utilities organizations. Unfortunately the RapidResults method is not yet
mature enough to be simulated as a result of the difference in the scope of the HPUM and MECOMS
processes. Also the gaps between HPUM and the MECOMS technology should be clossed before the
processes can be used in simulations.
The second research question relates to how the selected process models which are used during the
implementation project of the ERP system can be used by the (utilities) organizations.
Since the ERP system uses workflow engines for only a limited number of processes it is important to
ensure the organizations follow the selected processes in order to be able to leverage on their quality.
Processes are modeled during the implementation with the RapidResults method in the BPMN tool
“RapidValue”. This tool is used to generate the documentation needed during the implementation, but
could also be used by key users and end users.
An experiment with both the RapidResults documentation and the standard documentation was executed.
Potential key users and end users where asked to perform a number of tasks in the system. Overall they
graded the; Readability, Ease of Use, Completion and Understandability of the RapidResults
documentation higher than in case of the standard documentation. They indicated the documentation
gives a better view of the processes and enables the potential users to understand how their work
influences the overall performance and processes. A key success factor in ERP implementation is that
users are aware of how their actions influence those of other users of the system. The process models as
used in the RapidResults method ensure that the users get this knowledge.
The expected result is that even though the system does not enforce the following of the processes, users
will have a better understanding of the processes and are more likely to follow them.
It can be concluded that the RapidResults method is an improvement over the standard ERP
implementations for the utilities industry. The best practice processes in the HPUM outperform the out of
the box MECOMS processes on goal achievement and quality. By implementing the processes in the
MECOMS solution a combination of high quality processes with flexible and efficient software is
developed. Reducing the cost to serve and increasing customer satisfaction for the utilities industry. The
BPMN modeling tool RapidValue used to capture the HPUM processes in the ERP system is able to
better transfer the process knowledge to key- and end- users than the conventional forms of
documentation.

64
7.1. Future research
The conclusions and results of this research can be used to perform new research projects in the future.
An interesting new angle can be the introduction of stakeholders in the goal comparison. In the current
research all goals used are goals for the utilities organization in general. It however is also possible that
different stakeholders within the organization have different goals and goal importance ratings.
Introducing this dimension could further enhance the research. It is also possible to use different goals for
different processes; this is likely to improve the accuracy of the prediction.
Another valuable addition is taking the coding effort required to customize the ERP system to fit with the
HPUM processes into account. A small HPUM advantage could for example turn out to be less
interesting if the coding effort to implement it is high. Other process architectures can be taken into
account next to the HPUM and standard MECOMS processes as well in order to generate a broader
comparison.
7.2. Recommendations for Avanade
For the corporate sponsor of the research Avanade a number of recommendations can be made for the
RapidResults method, specifically in the utilities setting. The HPUM processes can be a strong
contribution to the MECOMS solution however a number of things have to be taken into account.
First of all the HPUM processes need to be validated to ensure they are up to date and meeting current
regulatory demands. Second it is important to ensure the MECOMS characteristics of being fast, flexible
and with low costs are preserved as much as possible.
A number of gaps exist between the MECOMS system and the HPUM processes. Examples are;
modeling errors such as erroneous split and impossible combinations, different order of execution
between MECOMS and HPUM or outdated processes. These gaps still need to be closed before the
system can be used by utilities organizations.
The goals as determined for utilities processes can be used to validate the other processes within the
HPUM architecture and determine if they should be added to the solution. For this purpose the method
used in this research could be used, the survey is likely to give the most clear view on the expected
processes performance. The value of the results could even be improved further if the survey is send to
experts at different utilities suppliers in order to acquire expert opinions from the field.
The RapidValue tool itself still has a number of small usability issues (appendix 24), but can and should
be used in the implementation process. This will likely result in more effective training and help to keep
the best practice processes in use without enforcing them on the users by for example work flow engines.

65
Bibliography Accenture. (2009). High Performance Utility Model for Retail. Retrieved from
http://www.accenture.com/us-en/Pages/service-utilities-high-performance-utility-model-retail-
summary.aspx
Benıtez, J. M., Martın, J. C., & Roman, C. (2007). Using fuzzy number for measuring quality of service
in the hotel industry. Tourism Management, 544-555.
Bradley, J. (2008). Management based critical success factors in the implementation of Enterprise
Resource Planning systems. International Journal of Accounting Information Systems , 175-200.
Cai, J., Liu, X., Xiao, Z., & Liu, J. (2009). Improving supply chain performance management: A
systematic approach to analyzing iterative KPI accomplishment. Decision Support Systems 46 ,
512-521.
Cheng, B. (2007). Goal Modeling. Michigan, United States: Michigan State University.
Datamonitor. (Dec. 2011). Benchmarking Energy Retail Products and Services. London: Datamonitor.
Datamonitor. (Oct. 2011). Utility cost-to-serve Analysis: A growing priority. London: Datamonitor.
Retrieved from www.datamonitor.com
DELTA. (2013, April). DELTA missie en Visie. Retrieved from
http://www.delta.nl/over_DELTA/stakeholders/over_DELTA/missie_visie/
Ehie, I. C., & Madsen, M. (2005). Identifying critical issues in enterprise resource planning (ERP)
implementation. Computers in Industry, 545–557.
Eneco. (2013, August 2). Eneco Annual report 2012. Retrieved from Performance at a glance:
http://annualreport2012.eneco.com/progress/strategic-kpis#
Energie Data Services Nederland. (2012). Stroomopwaarts, MPM Leveranciersmodel. Baarn: Energie
Data Services Nederland.
Ferranti. (2012, 12 10). Retrieved from Ferranti Computer Systems: http://www.ferranti.be/
Gartner. (2011). Magic Quadrant for Utilities Customer Information Systems. Gartner, Inc.
Han, K., Kang, J., & Song, M. (2009). Two-stage process analysis using the process-based performance
measurement framework and business process simulation. Expert Systems with Applications 36,
7080–7086.
ITU-T. (2008). ITU-T: User Requirements Notation (URN) – Language definition. ITU-T
Recommendation Z.151 (11/08).
Jonkman, H. (2013, June 12). Interview/workshop on the goal achievement of HPUM processes. (Y.
Tollenaere, Interviewer)
KPI Library. (2013, April 22). KPIs in ‘Power & Electricity’. Retrieved from
https://kpilibrary.com/categories/energy
66
Kuziemsky, C., Liu , X., & Peyton, L. (2010). Leveraging Goal Models and Performance Indicators to
Assess Health Care Information Systems. 2010 Seventh International Conference on the Quality
of Information and Communications Technology (pp. 222-227). Porto: IEEE.
Neely, A. (2005). The evolution of performance measurement research, Developments in the last decade
and a research agenda for the next. International Journal of Operations & Production
Management 25 (12), 1264–1277.
Reijers, H. A., & Liman Mansar, L. (2005). Best practices in business process redesign: an overview and
qualitative evaluation of successful redesign heuristics. Omega, The international journal of
management science, 283-306.
RWE. (2013, April). RWE Strategy. Retrieved from RWE Strategy:
http://www.rwe.com/web/cms/en/639614/rwe/about-rwe/strategy/
Seçme, N. Y., Bayrakdaroglu, A., & Kahraman, C. (2009). Fuzzy performance evaluation in Turkish
Banking sector using analytic hierachy process and TOPSIS. Expert Systems with Applications
36, 11699-11709.
Simshauser, P., & Nelson, T. (2013). The Outlook for Residential Electricity Prices in Australia’s
National Electricity Market in 2020. The Electricity Journal, 66-83.
Soffer, P., Golany, B., & Dori, D. (2005). Aligning an ERP system with enterprise requirements: An
object-process based approach. Computers in Industry, 639-662.
Tan, W., Shen, W., & Zhao, J. (2007). A methodology for dynamic enterprise process performance
evaluation. Computers in Industry 58, 474–485.
The Microsoft Dynamics AX Team. (2012). Inside Microsoft Dynamics AX 2012. Redmond, Washington:
Microsoft Press.
Tscheschner, W. (2010). Transformation from EPC to BPMN. Potsdam, Germany: Hasso-Plattner-
Institure.
van der Aalst , W., Weske, M., & Wirtz, G. (2003). Advanced topics in workflow management: Issues,
Requirements and solutions. Journal of Integrated Design and Process Science, 7(3),, 49–77.
van der Linden, G. (2013). Best practice models in ERP systems. (Y. Tollenaere, Interviewer)
van Os, R. (2013, 5 13). (Y. Tollenaere, Interviewer)
Vattenfall. (2013, April). Vattenfall vision and strategy. Retrieved from
http://www.vattenfall.com/en/vision-and-strategy.htm
Wagenaar, P. (2013, April 15). Interview on Business drivers and Performance in the Utilities industry.
(Y. Tollenaere, Interviewer, & Y. Tollenaere, Translator)
Wagenaar, P. (2013, May 24). Interview/workshop on key mecoms process performance. (Y. Tollenaere,
Interviewer)
Wagner, E. L., & Newell, S. (2004). ‘Best’ for whom?: the tension between ‘best practice’ ERP packages
and diverse epistemic cultures in a university context. Journal of Strategic Information Systems ,
205-328.

67

68
List of Appendixes Appendix 1 literature study “Closing the gap between business processes and ERP systems.”
Appendix 2 Research proposal
Appendix 3 Additional chapter, Goals for Utilities organizations
Appendix 4 Interview transcript Philip Wagenaar, Avanade utilities expert, first interview
Appendix 5 Interview transcript Richard van Os, Avanade utilities expert, first interview
Appendix 6 Interview transcript Hans Jonkman, Avanade utilities expert.
Appendix 7 Goal Model
Appendix 8 Interview transcript Philip Wagenaar, Avanade utilities expert, second interview
Appendix 9 out of the box MECOMS detailed process evaluation
Appendix 10 Interview transcript Koen Huisman, Avanade ERP expert
Appendix 11 Interview transcript Gertjan van der Linden, Avanade ERP expert
Appendix 12 MECOMS process lifecycles.
Appendix 13 MECOMS processes BPMN models
Appendix 14 HPUM detailed process evaluation
Appendix 15 HPUM level 1 overview
Appendix 16 HPUM processes BPMN models
Appendix 17 MECOMS questionnaire
Appendix 18 HPUM questionnaire
Appendix 19 survey results
Appendix 20 goal realization correlation matrix
Appendix 21 KPI model
Appendix 22 Experiment setup
Appendix 23 Experiment setup
Appendix 24 Experiment results
Appendix 25 KPI use

Appendix 1 – Literature study
Eindhoven University of Technology – Department of Industrial Engineering & Innovation Sciences.
Closing the gap between business processes and ERP systems A literature review on ways of closing gaps between business processes and implemented processes supported by ERP systems, the importance of a correct fit and how this can be achieved.
Y.S.B. Tollenaere;student ID: 0596377 14-2-2013

Appendix 1
i
Contents 1. Introduction ..................................................................................................................................... ii
2. Approach ......................................................................................................................................... iii
3. Fit/Gap analysis ................................................................................................................................ iv
Importance of a good fit ...................................................................................................................... iv
Process follow software ........................................................................................................................v
Software follow process ....................................................................................................................... vi
Techniques for gap analysis .................................................................................................................. vi
4. Best practice and Business process redesign .................................................................................. viii
5. ERP customization ............................................................................................................................ xi
Types of customization ........................................................................................................................ xi
Reasons for customization .................................................................................................................. xii
Risks of customization ........................................................................................................................ xiii
Examples of customization ................................................................................................................. xiii
Maintenance and support .................................................................................................................. xiv
6. User acceptance ............................................................................................................................. xiv
Multiple legacy systems to a single ERP system ................................................................................... xv
Technology Acceptance Model............................................................................................................ xv
Usage according to the Triandis model .............................................................................................. xvii
Unified Theory of Acceptance and Use of Technology ........................................................................ xix
Influencing user satisfaction ................................................................................................................ xx
7. Conclusion ..................................................................................................................................... xxi
Bibliography......................................................................................................................................... xxiii
Appendix A: Search terms and journal list ............................................................................................ xxvi
Search terms used ........................................................................................................................... xxvi
Journal list ....................................................................................................................................... xxvi
Snowball graph ............................................................................................................................... xxvii
Appendix 1
ii
1. Introduction Last decades enterprises around the world have been implementing Enterprise Resource Planning
systems (ERP) in their organizations as an integrated software solution to the information needs of their
company (Bradley, 2008). The first ERP implementations where performed in larger organizations.
However in the past decade this has shifted to small and medium enterprises that also start meeting
their information system needs with ERP solutions (van Everdingen, van Hillegersberg, & Waarts, 2008).
Both ‘new’ needs which are not yet solved by information systems as needs already solved by legacy
information systems. The replacement of legacy systems is often a prime motivator for the
implementation (Botta-Genoulaz & Millet, 2005). Nevertheless Basoglu, Diam and Kerimoglu (2007) have
found, using Technology Acceptance Models, that the legacy systems are often a reason for users to
have a negative attitude toward ERP implementation. A reason for this is the perceived complexity of an
integrated ERP system in comparison to a (relatively) easy to understand legacy systems (as a result of
limited possibilities).Decision makers embrace ERP systems which become easier to maintain than all the
legacy systems and better allows the organization to combine functionality. The system allows for
centralizing storage and monitoring the organizational performance easier using performance
dashboards and other management support systems (Eckerson, 2005).
Other motivators to implement an ERP system are restructuring the organizational model, simplifying
and standardizing systems, increasing productivity, easy upgrading, improving interaction with
customers and suppliers, gaining strategic advantage and responding to market evolutions (Botta-
Genoulaz & Millet, 2005). The restructuring of organization models as indicated by Botta-Genoulaz &
Millet (2005) is an exceptional motivator in the adoption of ERP systems since this is often perceived as a
negative consequence of the implementation by the end users (Aloini, Dulmin, & Mininno, 2012). Fitting
the ERP system to the underlying processes is an important factor in the successful implementation of
the system (Morton & Hu, 2008). This makes it interesting to note the motivator by Botta-Genoulaz &
Millet (2005) could also be a risk in the implementation.
Often the implementation of an ERP system will require the change of some operational business
processes in the implementing organization in order to be able to use the ERP system. In most cases the
system will not yet completely support the business processes of the organization. This will require
careful mapping of the current processes and deciding if the processes will be adapted to fit the software
or the software will be customized to fit the processes (Morton & Hu, 2008).
Customization of ERP systems has been the subject of academic research ever since it became clear to
be a critical factor in ERP implementation projects (Morton & Hu, 2008). The customization of ERP
systems is one of the critical success factors during the implementation of an ERP system and is one of
the reasons these projects have a high failure rate and go over budget in many cases (Bradley, 2008).
In this research the possible pitfalls in ERP customization are analyzed and compared to the option of
adapting business processes to best practice processes used designing an ERP system. The analysis of a
fit is in many cases time consuming and complex. For the end users it is important to see the advantage
of an ERP implementation in order to determine if the implementation and adoption of (new) best

Appendix 1
iii
practice models will be worth the investment and result in the desired outcome or the software will have
to be adapted to fit the currently used processes.
The subject of this research can be summarized as: How to assess fit/gap between out of the box ERP
systems and business processes, how can the gap be closed, what influences do these do these choices
have on user acceptance and how can this be determined. Using academic literature the current state
will be described in this report and result in further research subjects.
In the second chapter of this report the approach of the literature study is described. Chapter 3 focusses
on the analysis of the gap between ERP systems and business processes. Chapter 4 is dedicated to give a
view on how business process redesign can be performed to have the process follow the software.
Chapter 5 analyses the possibilities and reasons of ERP customization. User acceptance and satisfaction
are described in chapter 6. The discussion is placed in chapter 7.
2. Approach This research has focused on scientific articles published in the last decade (>2002) in the initial search.
Some older articles are also included, however most of them where retrieved using the snowball
approach from other selected articles.
Using Science Direct, the TU/e VuBis catalog and Google® scholar, most articles are selected for an initial
review. Based on the abstracts and titles of the search results the initial 11 articles are selected.
Important citations of these articles are used as a starting point for a snowball search. The maximum
depth of this search was not limited, but in practice did not go further than two levels.
In specific cases, when an article indicated potential interesting further research topics these where used
to perform a reverse snowball search in which a selection was made in publications which cited this
article. The depth of this search was also not limited; however in practice the depth was limited to four.
The total number of articles and book chapters became 26.
A choice was made not to select articles form conference proceedings and only use journals with an
impact factor of at least 1, as much as possible. The complete list of used search terms, journals and
citation paths is provided in appendix A.

Appendix 1
iv
3. Fit/Gap analysis In order for an ERP system to be useful in an organization it should be aligned with the business
processes and goals in the organization. ERP systems are designed to serve a high variety of enterprises
and support a large number of processes and functionalities. The first stage of any ERP implementation is
selecting an ERP package. In order to do this an initial gap analysis is performed to determine which
system will require the least process redesign or customizations to be able to use in the organization
(Ngai, Law, & Wat, 2008). However functionality and supported processes should not be the only
argument for selecting a vendor. Ease of use, track record of the vendor, maintenance & support and the
availability of consultants to implement the system are also important. (Law, Chen, & Wu, 2012)
In this chapter the importance of the fit/gap analysis is discussed, as are the techniques currently used to
perform the analysis. In most cases this will be a manual exercise by key users and technical specialists
(Ngai, Law, & Wat, 2008). In the next chapters the ways of closing the gaps will be discussed along with
motivators and demotivators to choose between these options. This however relates to how the fit / gap
analysis is performed in the first place.
Importance of a good fit Goodness of fit is considered by far the most important factors in selecting an ERP system by most
organizations implementing an ERP system, followed by flexibility and costs on a large distance. ERP
vendors spend many resources in ensuring their packages are easily implementable and adaptable to
organizational processes. However in many cases the system will still require customization or business
process redesigns (van Everdingen, van Hillegersberg, & Waarts, 2008) (Law & Ngai, 2007). Empirical
evidence was found of a relationship between organizational fit of ERP and the success of its
implementation (Law & Ngai, 2007).
The implementation of ERP systems is often accompanied by a business process redesign in order to
match the business processes used to standard processes and functionality supported by ERP systems.
This reduces the number of customizations needed to be made to the ERP system. A major difference
with conventional business process redesign is that in this case there is no fundamental rethinking of the
business processes since the redesign will need to fit in the framework of the ERP system; preferably
without extending the system’s capabilities. This alignment process is the fit/gap analysis and exists in
every ERP implementation process. The initial gap analysis is used to select the ERP vendor, the detailed
gap analysis is performed during the implementation phase of the project and determines the
customizations or business process redesigns which need to be implemented (Soffer, Golany, & Dori,
2005). Roughly the implementation has three broad choices; customizing the system, redesigning
business processes or living with the problems of a misfit as show in Figure 1 (Brehm, Heinzl, & Markus,
2001). The gap analysis can be either directed at the process following the software or the software
following the processes. The choice is unrelated of the precise technique of gap analysis which is
performed. However the analysis could be performed in such a way that one of the solutions will turn
out to be the most beneficial. Motivators for this will be discussed in the next chapters.

Appendix 1
v
Capabilities of ERP system To-Be business processes
Process follow software
Or
Software follow process
ERP customization Business process redesign Live with the problemsAnd / or And / or
Figure 1 - Three broad choices in ERP implementation via (Brehm et al. 2001)
The implementation process of an ERP system is split into five stages by Ehie and Madsen (2005); Stage 1:
Project Preparation, Stage 2 Business Blueprint, Stage 3 Realization, Stage 4 Final preparation, Stage 5 go
live and support. In the third phase the analysis needs to be performed on a more detailed level than
when done selecting the system, in order to map all processes to the system and identify possible gaps
which need to be solved and determine how to do this.
Different vendors of ERP systems have different methods of measuring the fit of their product to the
business processes of the organization. Usually this is based on different models of the best practice
solutions used in the system (Soffer, Golany, & Dori, 2003). In practice, using an out of the box system
which is configured to the company needs without actually customizing the software is not always
straight forward. The sheer size and complexity of the package means that implementers may be
unaware of exactly what an ERP package can and cannot do, leading to configuration errors and
unnecessary modifications (Brehm, Heinzl, & Markus, 2001). This stresses the need for a thorough
knowledge of the system and the underlying processes. The use of external consultants for this process
becomes inevitable during the implementation project, already during the fit/gap analysis.
Process follow software Some developers of ERP systems such as Baan (former) & SAP consider business process reengineering
the best option in order to close the gap. This would ensure a higher quality ERP system and less risk in
the implementation process; risks such as going over budget, bugs in the system, maintenance problems
or time consuming customizations. (Soffer, Golany, & Dori, 2005). The following is stated by Basoglu,
Diam & Kerimoglu (2007) regarding the closing of the gap: Their aim should be selecting the most
compatible ERP system with the organizational processes, because ERP systems are standard and trying
to change their originality will not make sense. Unless the most suitable product is chosen, the game will
be lost at the beginning.
Baan and SAP use their methods DEM and ASAP to implement the best practice based ERP systems out
of the box by only applying rather limited vanilla flavored customizations. The selection is done using
predefined questionnaires with the implementing enterprise, identifying the gaps. The actual
requirements of the business processes used in the enterprise are not explicitly considered in this
process. They only exist as underlying human knowledge with the stakeholders involved but are rarely
made explicit. The gaps identified are to be closed by adapting to the available solutions. The underlying

Appendix 1
vi
paradigm is that the business should follow the software or organizations should just work around gaps
as depicted in figure 1. Changing the software is not considered a good option. This provides a reuse-
driven solution to the implementation in which the features of the ERP system are the starting point of
the implementation, business process redesign and customization of the system. This approach differs
from a requirements-driven solution taking the organizational requirements of the organization as a
starting point in selecting and implementing an ERP system (Soffer, Golany, & Dori, 2005).
Software follow process Only implementing business process redesign however is not the practice in many cases. Customizations
of the system is used to close the gap or solve other problems and can have multiple reasons (Light, 2005)
(Brehm, Heinzl, & Markus, 2001). Often these reasons are related to the disadvantages of process
reengineering; however there are more and good reasons to decide to customize the ERP software. In
practical cases the combination of redesigning business processes and customizing the software will
make it unnecessary to live with any problems as displayed in Figure 1 In chapter 5 more reasons for
customizing ERP systems are provided.
Using a requirement driven approach it is possible to determine how the ERP system can be
implemented the best using the organization as a starting point and limiting the number of
customizations or process redesigns as much as possible. It allows for a systematic approach of the gap
analysis by comparing organizational requirements with ERP functionality. This has the potential to use
the ERP system even beyond the defined best practice solutions, with or without customizing the
software.
Techniques for gap analysis As stated, there is no standard technique or best practice on how to perform gap analysis in ERP
implementation projects. Different vendors use their own techniques or methods which are directed at
their own practices. In most cases with an underlying desire to aim for one of the two options in closing
gaps as shown in figure 1. Generic techniques are developed by different researchers who have aimed to
develop an analysis technique or algorithm that does not aim specifically to either process redesign or
software customizations. These methods are often platform independent.
Soffer, Golany and Dori (2005) propose an algorithm to determine the fit between the organizational
requirements and the capabilities of the ERP system. This is done by matching two models, one of the
ERP systems functionality, the other of the requirements set by the organization. The ERP system will
only need to be modeled once, the company requirements need to be modeled for every
implementation. By calculating the distance between the models the fit is determined. Possibly other
paths through the ERP model are identified to achieve a certain goal set by the requirements with only
minimal changes to either the process or the system. Remodeling the requirements or the functionality
of the ERP system can immediately show the effect on the gap. This also solves part of the problem
identified by Brehm, Heinzl and Markus (2001) (introducing errors in the system during implementation
as a result of the complexity) since the impact of these changes in the system or process can
immediately be simulated.

Appendix 1
vii
Wu, Shin and Heng (2007) provide other tools which can be used for the gap analysis. These are
modeling tools looking at activity or scenario based enterprise requirements. This can be done using goal
based use cases, activity diagrams or drawings and data glossaries. Initially using goal based use cases,
the capabilities of the package can be compared with the company needs. The enterprise and the vendor
analyze the output for each rigid goal. If this rigid goal is not matched, a misfit exists, but if the rigid goal
is matched, soft goal matching will be performed and a goal matching report generated. Based on this,
both the enterprise and vendor know the location of the goal misfits and thus whether the firm’s
minimum requirements are achieved and how many desired soft goals are satisfied (Wu, Shin, & Heng,
2007). After this scenario based models can be used to determine the functional mismatch. Scenario
based models compare the required business process flow and the capabilities of the system using the
activity diagram, drawing, and data glossary for further requirement mapping and gap analysis. All
activities at the scenario level are identified and then all input and output information for each activity is
defined.
In the next stage, the data requirements of the organization are compared with the capabilities of the
system. The complete process is given in Figure 2.
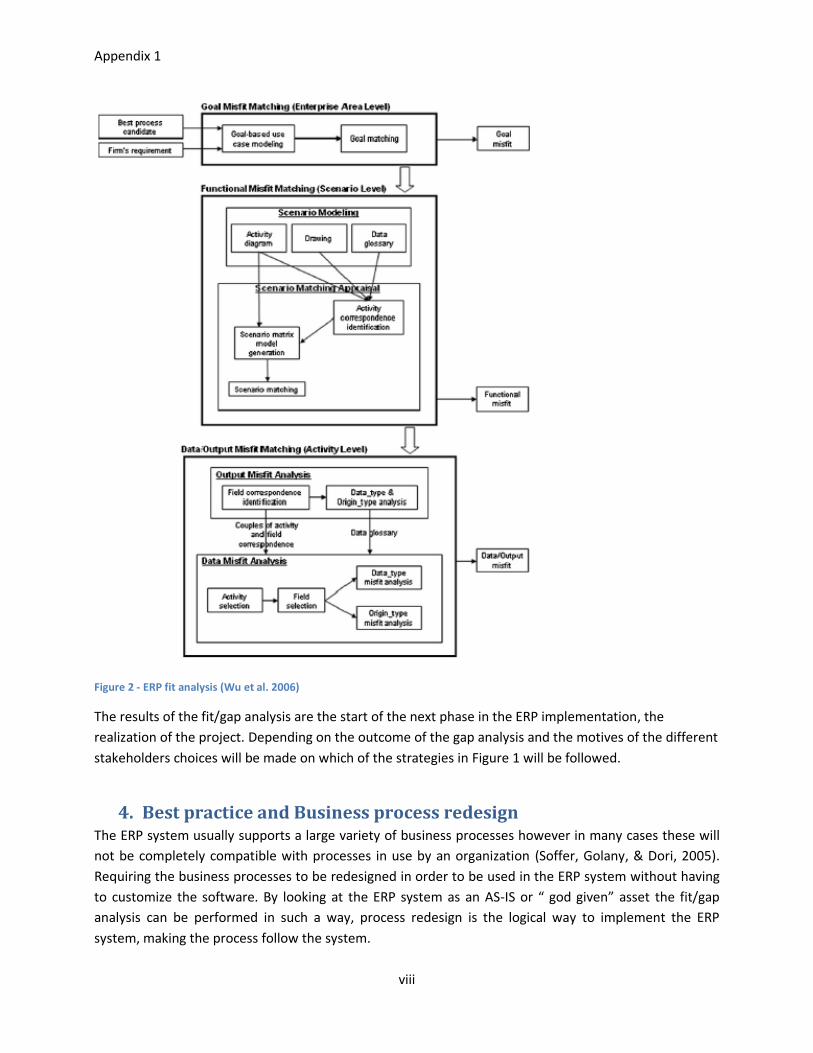
Appendix 1
viii
Figure 2 - ERP fit analysis (Wu et al. 2006)
The results of the fit/gap analysis are the start of the next phase in the ERP implementation, the
realization of the project. Depending on the outcome of the gap analysis and the motives of the different
stakeholders choices will be made on which of the strategies in Figure 1 will be followed.
4. Best practice and Business process redesign The ERP system usually supports a large variety of business processes however in many cases these will
not be completely compatible with processes in use by an organization (Soffer, Golany, & Dori, 2005).
Requiring the business processes to be redesigned in order to be used in the ERP system without having
to customize the software. By looking at the ERP system as an AS-IS or “ god given” asset the fit/gap
analysis can be performed in such a way, process redesign is the logical way to implement the ERP
system, making the process follow the system.

Appendix 1
ix
Enterprise information systems can be divided in different tiers. A common division is a database-,
function-, processes- and interface tier. The database tier contains all the data used by the ERP system
and is a central database. Different departments or functionality don’t have their own databases but
share a single database. All functions are included in the function tier which CRUD (create, read, update,
delete) the data in the database tier. The processes used in the organization are mapped in the process
tier and use the functions in the function tier.
Best practice processes Manufactures of ERP systems will often advice an organization to implement a standard ERP package
“vanilla flavored” (without customizations) in order to have a more efficient implementation. (Lee & Lee,
2000). In most cases these packages are designed in collaboration with industry partners in order to
develop a system to meet unique industry requirements which can be described as “best practice”
(Wagner & Newell, 2004) (Brehm, Heinzl, & Markus, 2001). These standards should be the most efficient
and effective processes for a specific industry and provide the best results. The processes are included in
the process tier of the ERP system, using functionality from the function tier. It is however possible to
use these functions in more ways by changing the processes in the process tier. Enabling users to use
processes other than the best practice process without changes to the database or function tier. Best
practice processes should have the best results for all different industries for which these models are
developed. In practice however it is unclear in which cases these best practices are to be considered to
be ideal, resulting in the need to use the functions in the system differently.
In many instances ERP systems have specific plug-in/bolt-on applications which contain these industry
specific processes and functions, rather than including all functionality for all industries in the main ERP
package. These bolt-on applications are usually developed by industry partners. By means of bolt-ons
ERP adopters can achieve greater feature-function fit with lower configuration effort, without losing the
advantages of ongoing vendor support. Though this ongoing development efforts of ERP vendors and
third parties, many, but not all, business processes are now supportable by ERP packages (Brehm, Heinzl,
& Markus, 2001).
The functions not yet supported by the system will in most cases require a redesign of the business
processes as they are used in the organization if the organization does not intend to customize the ERP
package or the plug-in package. The business processes of many organizations have evolved over time,
acquiring idiosyncrasies that may not be strictly necessary or efficient. Nevertheless, the organization
may be unwilling to abandon them. Thus, many ERP adopters must face a painful choice when adopting
a package that works differently than they do. First, they can adopt the business process built into the
software, making the necessary organizational changes such as departmental reorganization and shifts in
job duties. Second, they can just live with the lack of fit between the package and their procedures,
which entails problems and inefficiencies such as redundant manual processes and other workarounds
(Brehm, Heinzl, & Markus, 2001, p. 3). Although this seems as an illogical choice, it is a good example of
the importance of user acceptance as is also indicated by Basoglu, Daim and Kerimoglu (2007) and is
discussed further in chapter 6. A third option is trying to use the functionality in the function tier in such
a way that the business processes will be supported without having to redesign them or change the
function layer.

Appendix 1
x
Wagner and Newell (2004) describe a case in which an ERP vendor initiated the development of a best
practice based ERP system for universities. Together different departments of a major university the
system was developed. However in the end it became clear different stakeholders in the university had
conflicting requirements. The result was a best practice based ERP package which was not considered to
be best practice by all stakeholders in the organization which developed the package. This problem is
also denoted by Light (2005) and is further discussed in the next chapter. In this specific example of
Wagner and Newell (2004) the best practice based package was designed in collaboration with an
industry partner, however this partner was in the end not able to implement the vanilla flavor version of
the package. The university ended up implementing a customized version of the ERP system which was
based on best practice processes defined by the same organization.
Business process redesign The redesign of business processes is in general considered to be less risky than customizing the
software. This however will require correct change management to guide the users to the new
(redesigned) processes (Ngai, Law, & Wat, 2008). It is also possible for the implementation of ERP
systems to be the result of the desire to implement business process redesigns within a company. Reijers
and Liman Mansar (2005) state technology to be a solution to the physical constraints which might be
present and solvable by implementing new technology. It is however also stated that the combination of
costly new technology investments (such as ERP systems) can have influences on user acceptance of the
process redesign.
This shows that business process redesign does not necessarily have to be the result of an ERP
implementation, but it can actually be the other way around in which the process redesign is a reason to
implement an ERP system.
Reijers and Liman Mansar (2005) provide an overview of different best practice methods which can be
used as rules of thumb to (re-) design a business process. Either by applying a clean-sheet approach in
which a completely new design is developed or by using the processes already in place to redesign the
process in use. This is the most widely used approach at the moment and also a very logical approach
during the implementation of an ERP system since the re-designed process must be supported by the
system. It is however possible to perform a redesign before selecting an ERP system and ensuring the
selected package meets the new requirements set by the redesign, in which the software follows the
processes, while the processes are also being redesigned.
Reijers and Liman Mansar (2005) state that any redesign always poses two main challenges: a technical
challenge, which is due to the difficulty of developing a process design that is a radical improvement of
the current design and a socio-cultural challenge, resulting from the severe organizational effects on the
involved people, which may lead them to react against those changes. This is also confirmed by the
findings of other researchers (Aloini, Dulmin, & Mininno, 2012) (Bradley, 2008) (Chang, Cheung, Cheng,
& Yeung, 2008). The technical challenge in the redesign is mostly imposed by the ERP system selected.
However it is also possible to use the redesigned processes in the selection process and ensure a close fit
in that manner. The practice used in redesigning the business processes in order to facilitate the
implementation should be technology directed. This will in general result in increased time efficiency and
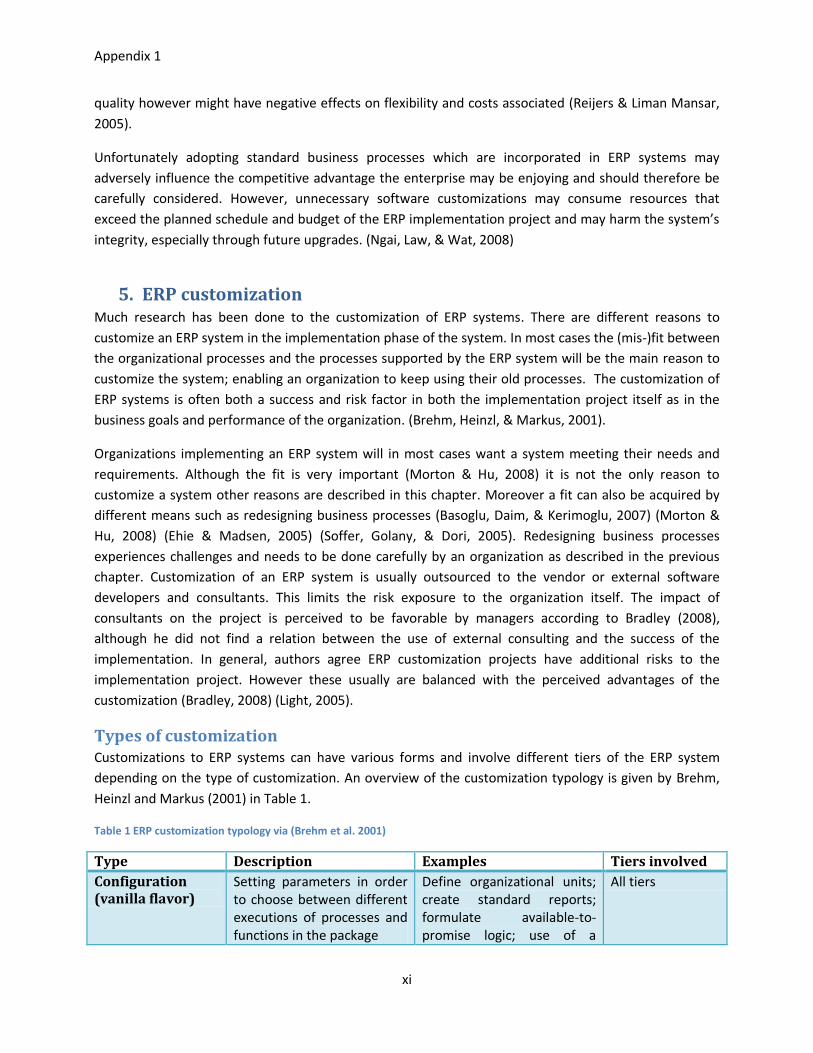
Appendix 1
xi
quality however might have negative effects on flexibility and costs associated (Reijers & Liman Mansar,
2005).
Unfortunately adopting standard business processes which are incorporated in ERP systems may
adversely influence the competitive advantage the enterprise may be enjoying and should therefore be
carefully considered. However, unnecessary software customizations may consume resources that
exceed the planned schedule and budget of the ERP implementation project and may harm the system’s
integrity, especially through future upgrades. (Ngai, Law, & Wat, 2008)
5. ERP customization Much research has been done to the customization of ERP systems. There are different reasons to
customize an ERP system in the implementation phase of the system. In most cases the (mis-)fit between
the organizational processes and the processes supported by the ERP system will be the main reason to
customize the system; enabling an organization to keep using their old processes. The customization of
ERP systems is often both a success and risk factor in both the implementation project itself as in the
business goals and performance of the organization. (Brehm, Heinzl, & Markus, 2001).
Organizations implementing an ERP system will in most cases want a system meeting their needs and
requirements. Although the fit is very important (Morton & Hu, 2008) it is not the only reason to
customize a system other reasons are described in this chapter. Moreover a fit can also be acquired by
different means such as redesigning business processes (Basoglu, Daim, & Kerimoglu, 2007) (Morton &
Hu, 2008) (Ehie & Madsen, 2005) (Soffer, Golany, & Dori, 2005). Redesigning business processes
experiences challenges and needs to be done carefully by an organization as described in the previous
chapter. Customization of an ERP system is usually outsourced to the vendor or external software
developers and consultants. This limits the risk exposure to the organization itself. The impact of
consultants on the project is perceived to be favorable by managers according to Bradley (2008),
although he did not find a relation between the use of external consulting and the success of the
implementation. In general, authors agree ERP customization projects have additional risks to the
implementation project. However these usually are balanced with the perceived advantages of the
customization (Bradley, 2008) (Light, 2005).
Types of customization Customizations to ERP systems can have various forms and involve different tiers of the ERP system
depending on the type of customization. An overview of the customization typology is given by Brehm,
Heinzl and Markus (2001) in Table 1.
Table 1 ERP customization typology via (Brehm et al. 2001)
Type Description Examples Tiers involved
Configuration (vanilla flavor)
Setting parameters in order to choose between different executions of processes and functions in the package
Define organizational units; create standard reports; formulate available-to-promise logic; use of a
All tiers

Appendix 1
xii
standard interface to legacy systems
Bolt-ons / plug-ins
Implementing third-party software designed to work with the ERP system and provide industry specific functionality
Providing ability to track inventory by product dimensions (e.g. 2x 500m cable is not the same as 1x 1000m)
All tiers
Screen masks Creating new screen masks for input and output
Integrating multiple screens into one
User interface tier
Extended reporting
Programming extended data output and reporting options
Design a new report with sales revenue for specific criteria.
Function tier and/or database tier.
Workflow programming
Creating non-standard workflows
Set up automated engineering change order approval process
Function tier and/or database tier.
User exits Programming of additional software in an open interface
Develop a statistical function to calculate particular metrics.
Function tier and/or database tier.
ERP programming Programming of additional applications, without changing the source code (using the computer language of the vendor)
Create a program that calculates the phases of the moon for use in production scheduling
All tiers
Interface programming
Programming of interfaces to legacy systems or 3rd party products
Interface with custom-build shop floor- system or with a CRM package
Function tier and/or database tier.
Package code modification
Changing the source-codes ranging from small change to change whole modules
Change error message in warning; modify production planning
All tiers
In this report, customizations are considered those changes to the ERP system going further than the
functionality designed by the vendor of the off the shelf package and which is not achieved by
incorporation other of the shelf systems or legacy systems also implemented and linked to the ERP
system. These are given by (Brehm, Heinzl, & Markus, 2001) as: Screen masks, Extended reporting,
workflow programming, User exits, ERP programming, Interface programming and Package code
modification. These customizations result in a system which is unique for the implementing organization.
The advantages and disadvantages of ERP customization are given in this chapter.
Reasons for customization According to Light (2005) there are multiple reasons to customize an ERP system to the needs of an
organization; Other than only a misfit between the business processes and the standardized models used
in the ERP system. Light (2005) looked at different cases in which the misfit was not the primary reason

Appendix 1
xiii
for the customizations and had additional advantages to different stakeholders, including the vendor of
the system.
The needs and agendas of different stakeholders can have much influence on the customization of the
system. Requirements by different users might be conflicting, vendors might see customization as fueling
innovation in their package, implementation teams might use customizations to ensure higher user
acceptance, “expert advice” might be false, misconceptions around the package could exist, or the
organization wanting to have a perfect information system are among the possible motivators. According
to Light (2005) a perfect system is not possible, as a result of the conflicting interests among
stakeholders and technical challenges to software customization. Off the shelf software packages are
often the product of long and more rigorous development projects. Customized products automatically
incorporate a higher risk of bugs and errors. Light (2005) gives examples of such reasons by analyzing
two case studies form organizations that customized their ERP system during the implementation.
The best practice based models of an ERP system self could also be a reason to customize an ERP system.
An organization should carefully consider the implementation of standardized business processes since
this might influence a competitive advantage the organization might have with its own processes (Soffer,
Golany, & Dori, 2005), either in a positive or negative way, which makes it something that should be
considered.
Risks of customization There are many reasons why a custom information system can never be perfect, although early research
has stated that using comprehensive modeling and implementation of these models and best practices a
perfect information system can be generated (Friedman & Cornford, 1989); (Fitzgerald B. , 1996). Other
(later) research prove this assumption false for several reasons such as different stakeholders
requirements and the personal agenda’s both users and designers might have (Fitzgerald, Russo, &
Stolterman, 2002).The custom design of an information system is never a rational and linear process as
was assumed by early models (Light, 2005). This will inevitably have consequences on the risks involved
in an ERP customization project as shown by Brehm, Heinzl and Markus (2001).
Examples of customization Two cases in which the organizations chose to customize their ERP systems where analyzed by Light
(2005) and clearly illustrate the reasons beyond misfit to customize the system, rather than choosing a
vanilla flavor implementation.
One case researched by Light (2005) gives an example of changes required to the functionality which
have led to new feature in the standard ERP package. The organization involved had specific needs to the
inventory handling supported by the ERP system. A large modification to the ERP system needed to keep
track of the prices of the end product which changed with the current price of raw material (copper) on
the market. The value of the copper fluctuated daily and the system needed to keep track of the price of
the inventory from the moment it was acquired until it left the plant. The price of an end product needs
to reflect the raw material price from the moment of purchasing and not the moment of sale. Resulting
in an inventory in which different batches of raw material have different prices. This feature was
Appendix 1
xiv
implemented in the ERP system and incorporated as a standard feature as it proved to be a valuable
feature for other organizations as well. This type of customization would be considered ERP
programming in the typology by Brehm, Heinzel and Markus (2001) in Table 1 and showed customization
to be a source of innovation.
A second case analyzed by Light (2005) also required multiple customizations of the ERP system not
directly related to the processes involved. In this case the organization used many key performance
indicators to monitor their processes. Setting very specific demands to the dashboards of the ERP system.
This did not actually involve the design of the processes themselves, but the information gathered from
them. Brehm, Heinzel and Markus (2001) in Table 1 would consider this extended reporting.
Maintenance and support Customization of ERP systems may have the advantage of allowing an organization to use their own
processes; it however has a disadvantage related to maintainability and support of the system (Law,
Chen, & Wu, 2012). In total the annual maintenance and support of a system can contribute to 25% of
the implementation costs. The extent of customization of the ERP system affects the costs and risks of
the implementation but also the ongoing maintenance and upgrading of the system (Davenport, 1998).
Rapid changes in the business environment will require frequent upgrades in order to meet these
changes. This poses a challenge to the consultants implementing the system (Law, Chen, & Wu, 2012).
The customizations will pose difficulties for software upgrades and migration to future releases of the
system. A “Vanilla flavor” implementation would limit these difficulties (Lee & Lee, 2000); However
according to Light (2005) this can also be an advantage for the external consultants since it ensures work
for them in the future. An additional challenge to this ongoing maintenance is the fact that most
developers of ERP systems, such as Oracle do not provide access to the source to clients directly. (Law,
Chen, & Wu, 2012).
The maintenance of an ERP system is not a task manageable by any client organization on its own (Law,
Chen, & Wu, 2012). On one hand the business environment of the client organization is changing rapidly,
on the other hand the system is upgraded and patched by the vendor based on best practice models.
This will necessarily result in a close relationship between the organization and the vendor also after the
implementation of the system has been completed.
6. User acceptance As described in the previous chapters, the choices made during the implementation of an ERP system to
either; redesign business processes and or customize the software will have influences on the user
acceptance. Considering the size of an average investment in ERP systems it is important to take the user
acceptance into account. This chapter underlines the importance of user acceptance and motivates why
it can cause problems in the organization. Models are provided which can be used to determine the
expected user acceptance and in the end methods of influencing user acceptance are discussed. This
allows stakeholders in the implementation process to motivate decisions on how to close the gaps
between the system and the business processes in the organization.
Appendix 1
xv
The implementation of an ERP system will pose large changes on an organization; these will require
adequate change management in order ensure the implementation to be successful. In order to manage
the changes in an organization, detailed knowledge of the organizational structure and the people
involved is necessary. Change management involves the effective balancing of forces in favor of a
change over forces of resistance (Ngai, Law, & Wat, 2008). Forces of resistance can originate from the
user acceptance of the ERP system. Training of users is considered an important activity in the
implementation of ERP systems and the subject of many research projects. The technical challenges
related to customization of the system or redesign of business processes in order to close the gap have
been described in the previous chapter. Which choice however is made related to the implementation;
process redesign, system customization or a mixture of both; it remains important to keep in mind the
human factor of the implementation (Basoglu, Daim, & Kerimoglu, 2007). As stated by many researchers,
ERP implementations have a high failure rate, which in many cases can be related to human factors in
the organization (Chang, Cheung, Cheng, & Yeung, 2008).
In the rest of this chapter, first a major difference between legacy systems and an ERP system as
perceived by users is described. Next three behavioral models used to predict user behavior in the
adoption of the new system are described. Finally ways of influencing the behavior of the users are
provided.
Multiple legacy systems to a single ERP system The concept of ERP which relies on a single database engine at the root of the system is appealing as
seen from a business perspective on one hand. On the other hand however this means people in an
organization who in the past had used their own systems will now be forced to use the same system as
other departments. Where the legacy systems in most cases are adapted to their business processes and
were in many cases designed for the specific department in which they operate, ERP systems are based
on best practices and industry standards (Chang, Cheung, Cheng, & Yeung, 2008). Aligning these
processes is considered one of the most important steps in the implementation of an ERP system (Botta-
Genoulaz & Millet, 2005).
A result of the implementation of centralized systems such as ERP systems is that information inserted in
the system by a department will be available for other departments or even organizations immediately.
This changes the processes and introduces also a form of dependency among different departments,
pressuring each other to use the ERP system as well. This requires processes to be designed cross
functional and stretching over different departments who in the past could have shared fewer processes
and resources. Such firm wide changes require top management involvement which has been found to
be an important factor in the implementation of ERP systems (Bradley, 2008).
Technology Acceptance Model A model commonly used to predict user acceptance of information systems is the Technology
Acceptance Model (TAM) by (Davis, 1989) as show in Figure 3. This model is used by Basoglu, Diam &
Kerimoglu (2007)to predict the success of an ERP implementation related to the user acceptance of the
system.

Appendix 1
xvi
Figure 3-Technology Acceptance Model (Davis, 1989)
Their research has shown not only use but also user satisfaction has an influence on the organizational
adaption of the ERP system (Basoglu, Daim, & Kerimoglu, 2007). They included the moderating effect of
project management in the research to underline the important function of the project management to
bridge gaps between the system, processes and users. The model used in the research is an adapted
form of the TAM and revision by Davis TAM2, in which moderating effects such as experience and
voluntariness are included. These models are overall able to explain 40% of the information system use
(Legris, Ingham, & Collerette, 2003)
Important factors of the success of ERP systems related to the users are having capable and innovative
users who are well-educated, experienced, responsible and knowledgeable will have a positive effect on
the adoption of the ERP (Basoglu, Daim, & Kerimoglu, 2007). This should be complemented with: training,
information sharing, effective communication and support activities. These are necessary to ensure
understanding of how their work relates to the work of others in the organization with who they share
an important resource, the ERP system. This will ensure they becomemore involved in the system.
The TAM was used to determine the effect of training on perceived usefulness of the system. User
capability and innovativeness, support activities given to user, gaps of user with organization and
technology are important determinants of perceived ease of use and perceived usefulness of the ERP
system. Since a person working with such users will be affected by their perceptions directly it is
important to take this into account. In some cases this can lead to the system being used, for example
because it is mandatory, however in an inefficient or ineffective way. In order to motivate people to use
the ERP system more efficient and effective, expected usefulness must be guaranteed. As perceived ease
of use and perceived usefulness can be seen as mediators of satisfaction and perceived ease of use as a
determinant of perceived usefulness (Basoglu, Daim, & Kerimoglu, 2007).
The following statements where confirmed about ERP adoption by users using the analysis based on the
TAM by Basoglu, Diam & Kerimoglu (2007);
High capability and flexibility of the technology and a small to no gap between technology and
organization have a positive impact on perceived usefulness of ERP system end users.
High capability and innovativeness of the organization and a small to no gap between
organization and technology have a positive impact on perceived usefulness of ERP system end
users.

Appendix 1
xvii
High capability and innovativeness of the user, support activities for user, a small to no gap
between user and technology and a small to no gap between user and organization have a
positive impact on perceived usefulness of ERP system end users.
High capability of project management has a positive impact on perceived usefulness of ERP
system end users.
High capability and flexibility of the technology and a small to no gap between technology and
organization have a positive impact on perceived ease of ERP system end users.
High capability and innovativeness of the user, support activities for user, a small to no gap
between user and technology and a small to no gap between user and organization have a
positive impact on perceived ease of use of ERP system end users.
High capability of project management has a positive impact on perceived ease of use of ERP
system end users.
Perceived ease of use of ERP system end users has a positive impact on perceived usefulness of
ERP system end users.
Perceived usefulness of ERP systems end users has a positive impact on satisfaction of ERP system
end users.
Perceived ease of use of ERP system end users has a positive impact on satisfaction of ERP system
end users.
Project management's effort for fitting technology with organization has a positive impact on
technology's effect on perceived usefulness of ERP system end users.
Project management's effort for fitting organization with technology has a positive impact on
organization's effect on perceived usefulness of ERP system end users.
Project management's effort for fitting user with technology and organization has a positive
impact on user's effect on perceived usefulness of ERP system end users.
Project management's effort for fitting technology with organization has a positive impact on
technology's effect on perceived ease of use of ERP system end users.
Project management's effort for fitting user with technology and organization has a positive
impact on user's effect on perceived ease of use of ERP system end users.
Usage according to the Triandis model Another model to determine the influence of user acceptance in ERP implementations is used by Chang,
Cheung, Cheng and Yeung (2008); they state user acceptance is mostly influenced by both social
pressure and the availability of necessary recourses. Cheung, Cheng and Yeung (2008) found that social
pressure plays an important role in the adaption of for example the internet by the general public. The
acceptance of ERP systems is likely also strongly influenced by the perceived expectation of a person’s
superiors and colleagues. In order for the system to be successfully implemented it is important to have
different elements ready at the same time: support in hardware, software, training and information
provision. The Triandis model (Triandis, 1979) is considered to be effective in predicting this behavior.
Facilitating conditions are very important in predicting behavior according to Triandis (1979). An
objective obstacle can prevent behavior from happening. The primary influencing factor is considered to
be the intention. Which is influenced by social factors, affect and perceived consequences. The Triandis

Appendix 1
xviii
model was altered by Chang, Cheung, Cheng and Yeung (2008) by removing intentions and looking at the
direct effect of social factors, affect and perceived consequences. The resulting model looks at different
factors influencing behavior in ERP implementations. These factors fall into three categories: individual,
technological and organizational characteristics, as shown in Figure 4. Individual characteristics consist of
perceived near-term consequences, perceived long-term consequences and affect. Technological
characteristics include complexity and compatibility while organizational characteristics include
facilitating conditions and social factors (Chang, Cheung, Cheng, & Yeung, 2008). The research was able
to explain 26% of the variance in usage of ERP systems by the independent variables. Only three showed
a significant regression factor: Social factors 0.346 (p<0.01), Compatibility 0.186 (p<0.01), Near-term
consequences 0.175 (p<0.05). This implies that respondents are susceptible to social pressure exerted by
their colleagues and superiors. If this social pressure is used in a correct manner it is possible to achieve
higher user acceptance. Underlining the importance of management involvement and strong change
management.
Figure 4- Adapted Triandis model (Chang et al., 2008)
Complexity of the system does not seem to discourage people from using the system. Where complexity
will result in a more difficult implementation of the system, this does not have to result in a difficult to
use system. This can be explained by the fact that most users only use a small (to their work relevant)
part of the modules and functionality of the system. The perceived usefulness seems to be of bigger
influence. However the social factors seem the most important. This may be due to the fact that ERP, as
an enterprise system, requires a lot of coordination and corporation among the members of the
organizations to make it work. (Chang, Cheung, Cheng, & Yeung, 2008)

Appendix 1
xix
Unified Theory of Acceptance and Use of Technology Another model was derived by Venkatesh, Morris, Davis and Davis (2003) by combining other behavior
predicting models, using performance expectancy, effort expectancy and social influences as predictors
for behavioral intention. This intention together with the facilitating conditions predicts the use behavior
of the stakeholders.
Performance expectancy is defined as the degree to which an individual believes that using the system
will help him or her to attain gains in job performance. This can be seen as the perceived usefulness in
the TAM model. The effort expectancy is defined as the degree of ease associated with the use of the
system. This can be related to the ease of use in the TAM. Social influence is defined as the degree to
which an individual perceives that important others believe he or she should use the new system.
Facilitating conditions are defined as the degree to which an individual believes that an organizational
and technical infrastructure exists to support use of the system (Venkatesh, Morris, Davis, & Davis, 2003).
Gender, age, experience and voluntarily of use are moderators of the measured effects. The complete
model is given in Figure 5. Performance expectancy turned out to be the most important factor and
remained significant in all cases researched by Venkatesh, Morris, Davis and Davis (2003). Regardless if
the use was mandatory or voluntary. The effort expectancy is only significant in the first phases of the
information system implementation and training phase. Later in the process the effect becomes non-
significant. In the social influences the moderating effect of voluntariness of use is very strong, making
the social influence non-significant if the use is not mandatory (Venkatesh, Morris, Davis, & Davis, 2003).
Figure 5-UTAUT (Venkatesh et al. 2003)
Validation of the model found performance expectancy to be the stronger for men and younger users.
The effort expectancy and social influences explain more variance for older users, women and users with
limited experience. The relationship between the facilitating conditions and actual use turned out to be
stronger for older employees. The behavioral intend in actual usage are not moderated however do have
a strong direct effect. The UTAUT model can explain up to 70% of the variations in intention of usage by

Appendix 1
xx
the stakeholders of corporate information systems like ERP systems (Venkatesh, Morris, Davis, & Davis,
2003).
Influencing user satisfaction The importance of user satisfaction and acceptance of ERP systems has been shown by multiple
researchers. There are different strategies during the ERP implementation which could influence the
success of the implementation and usage of the system. Now we know which factors influence users in
the ERP adoption process it becomes important to identify ways of influencing these factors. As shown
by multiple researches; social influence by others (superiors and colleagues) is an important factor
(Chang, Cheung, Cheng, & Yeung, 2008) (Legris, Ingham, & Collerette, 2003) (Ehie & Madsen, 2005) (Ngai,
Law, & Wat, 2008). This effect is the strongest in older users and women (Venkatesh, Morris, Davis, &
Davis, 2003).
In other cases Bradley (2008) found the social influences less significant in predicting ERP
implementation success. Adequate training of users was considered to be more important than reducing
user resistance by the top management. This difference could be explained by the subtle difference in
the type of social influence researched. Where Chang, Cheung, Cheng & Yeung (2008) looked at positive
influences social pressure can have on ERP usage, Bradley (2008) merely looked at using social influence
by management to remove user resistance. A note must be made that the research of Bradley (2008) is
based on a rather small number of case studies (eight cases), making the results less generalizable than
the research by Chang, Cheung, Cheng & Yeung (2008) who used a questionnaire distributed over 600
participants who had experience in using ERP systems. The research by Venkatesh, Morris, Davis & Davis
(2003) also is more generalizable but partly limits the social influences to specific groups.
Ehie and Madsen (2005) had already determined the top management involvement to explain 9.48% of
the variance in ERP implementation success. This underlines the importance of adequate change
management in order to see ERP implementation as more than just changing hardware and software in
an organization but adapting the complete way of doing business.
The importance of a project champion to motivate people in the implementation, process redesign and
labor intensive project is shown by multiple researchers (Bradley, 2008) (Ngai, Law, & Wat, 2008). The
role of this high-level executive sponsor is to increase moral during the implementation of the ERP
system.
Customizations to a certain extend should generate higher user acceptance since it requires less redesign
of the processes in the organization and ensure a more efficient fit to the current business processes.
(Basoglu, Daim, & Kerimoglu, 2007) (Light, 2005). It is generally accepted that the gap between the
system and the business processes has to be closed in order to acquire user acceptance. In the UTAUT
model this is part of the facilitating conditions, but also on the perceived effort of the system.
Top-management involvement and adequate change management are required in order to achieve
correct change management. Change management involves the effective balancing of forces in favor of a
change over forces of resistance (Ngai, Law, & Wat, 2008).

Appendix 1
xxi
7. Conclusion The implementation of ERP systems should be seen as an organizational endeavor, rather than a pure
technical one, regarding implementing a technological tool which is fitted to the organization’s needs by
business process redesign or software customization. The implementation projects of ERP systems are
expensive, long and have high failure rates. Nevertheless companies keep investing in the systems and
implement them in their organizations. The replacement of legacy systems, optimizing efficiency and
effectiveness of their processes are given as the main reasons for the implementation.
The implementation of an ERP system is all about closing gaps. Gaps between the organizational
processes and the system, but also between the intended users and the system. This report looked into
four distinct challenges which arise in ERP implementations, based on scientific literature; the fit/gap
analysis, best practice and business process redesign, ERP customization and user acceptance were
researched. These subjects form the foundation of an ERP implementation and have been the subject of
research for the past decade.
The fit/gap analysis is an important phase in the ERP implementation process; the goal is to determine to
which extend the ERP system fits to the business processes in the enterprise. The result of the analysis
will (in most cases) identify the need to redesign business processes or customize the software in order
to close the gap between the two. Different techniques are available to facilitate the fit/gap analysis,
which in most cases will be a process executed manually. However, standardized techniques, processes
and algorithms are available. Usually these methods are developed for a specific ERP system and not
interchangeable between systems; which might be useful during the initial fit/gap analysis used to
choose a system. Platform independent modeling algorithms and languages however are available for
this purpose. They translate the enterprise’s requirements and system functionality to a common
language and calculate the difference between the models. This requires the system to be modeled only
once.
After the fit is determined, the gaps will have to be closed (or worked around). Closing the gap can be
done by redesigning the business processes (process follow software) or customizing the software
(software follow process). Redesigning the business processes is in practice the most common solution,
posing the least risk and providing a more efficient implementation. Risks however are losing
competitive advantage and lower user acceptance. Company specific processes are replaced by industry
best practices. These however need not to be the best for all stakeholders in the organization. Business
process redesign requires adequate change management and should be carefully executed.
Customization of an ERP system is a broad term; it can mean anything from generating new
management reporting to changing the source code and database architecture of the system. As a
definition of customization in this report, changes requiring the adaption of the source code, adding new
functionality or interfacing to legacy systems, which is not done with out of the box solutions is meant by
customization. The customization of the software is usually a solution which is not preferred. However
there are good reasons to do so; The primary reason to customize ERP systems is to close the
organizational gap Other reasons could be holding on to a competitive advantage in the business

Appendix 1
xxii
processes, using customization as a source of innovation in the system, acquiring higher user acceptance
or hidden agendas of stakeholders.
Customizing an ERP system is a risky operation like the customization of any IS. The risk of software
errors and bugs is larger, the process has more uncertainties and stakeholder requirements can be
conflicting. In the worst case this could lead to new mismatches or also business process redesigns
which could have been avoided. Customization problems usually take more time and cost more money
than the vanilla-flavored implementation combined with process redesign. Consequences of the
customization of the software are the difficulties arising during maintenance and support of the system.
Patches and updates need not to be compatible with the customization. This will require more
customizations to the system and a long term relationship with the vendor in order to assure adequate
maintenance and support. This is mostly beneficial to the vendor who will ensure revenue on the system
by performing these maintenance and support tasks over a longer period. The organization who
implemented the ERP system on the other hand becomes dependable on the vendor.
During the entire ERP implementation project it is important to keep in mind the user acceptance of the
system. Together with the closing of the process gaps this is an important factor in ERP success. Users
will have to be motivated to move from multiple, often tailored, legacy systems to a single ERP system in
which all data is shared with other users. Different models are available to predict the user acceptance of
an information system. For ERP implementations they provide valuable information on how the
acceptance can be improved, resulting in more successful ERP implementations.
The theoretical models are tested on ERP implementations and show critical influences on the user
acceptance for specific user groups, such as women and older users. This allows implementers to use
tailored strategies to ensure higher user acceptance for those specific groups. Social influence is very
important and can be used positively by management and project champions to achieve a higher intent
to use and actual use of the system. Different theoretical models have slightly different angles to look at
user acceptance. They seem to share most of the view on how user acceptance can be predicted and
influenced by the project team and organizational management.
In the implementation of an ERP system it is important to ensure the fit/gap analysis is performed
efficiently and effective in order to make correct decisions on redesigning business processes and or
customizing the system. The analysis is used as a blueprint for the project phases following on the
analysis. It determines what needs to be done and how this should be done. In most cases the analysis is
performed for every specific implementation and not reusable. Vendors, the implementing enterprise
and users might have motives to favor business process redesign or software customizations which could
influence the choices they make or requirements they set during the fit/gap analysis.
Further research can be conducted in how this analysis is performed and if the methods used by the
vendors (deliberately) influence the decisions on customization or process redesign. These choices
influences the user acceptance and behavior of different stakeholders. Specific gap analysis could result
in a higher perceived usefulness of the system, lower perceived effort needed etc. This would enable to
fit/gap analysis to already have a high influence on the last stages of the implementation process. This
makes it worthwhile to further invest how the fit/gap analysis can aid making the decision to customize

Appendix 1
xxiii
or redesign processes and achieve a more efficient and effective implementation, while in the same time
already paving the way to high user acceptance and actual use of the system. It could be possible to use
the fit/gap analysis and models to even train and motivate the end-users in the ERP project. For vendors
this is an interesting topic since it achieves better results in the implementation of ERP systems for their
customers.
Potential topics and questions for further research could be:
Is the fit/gap analysis used by ERP vendors influencing the decisions made in favor of either
process redesign or software customization in favor of the vendor’s opinion on these options?
Can a fit/gap analysis be more efficient and or effective in the implementation phases following
on the analysis depending on the method used to perform the analysis?
How can fit/gap analysis influence user acceptance?
How can fit/gap analysis and results be used in different phases of the ERP project?
Bibliography Aloini, D., Dulmin, R., & Mininno, V. (2012). Modelling and assessing ERP project risks: A Petri Net
approach. European Journal of Operational Research, 484–495.
Basoglu, N., Daim, T., & Kerimoglu, C. (2007). Organizational adoption of enterprise resource planning
systems: A conceptual framework. Journal of High Technology Management Research , 73–97.
Botta-Genoulaz, V., & Millet, P. (2005). A classification for better use of ERP systems. Computers in
Industry, 573–587.
Bradley, J. (2008). Management based critical success factors in the implementation of Enterprise
Resource Planning systems. International Journal of Accounting Information Systems , 175-200.
Brehm, L., Heinzl, A., & Markus, M. L. (2001). Tailoring ERP systems: A spectrum of choices and their
Implications. Proceedings of the 34th Annual Hawaii International Conference on System Sciences,
2001. IEEE.
Chang, M., Cheung, W., Cheng, C., & Yeung, J. (2008). Understanding ERP system adoption from the
user’s perspective. Int. J. Production Economics, 928-942.
Davenport, T. H. (1998). Putting the enterprise into the enterprise systems. HARVARD BUSINESS REVIEW,
121-131.
Davis, F. D. (1989). Perceived usefulness, perceived ease of use and user acceptance of information
technolog. MIS Quarterly, 319–340.
Eckerson, W. W. (2005). What Are Performance Dashboards? In Performance Dashboards: Measuring,
Monitoring, and Managing Your Business. John Wiley & Sons.

Appendix 1
xxiv
Ehie, I. C., & Madsen, M. (2005). Identifying critical issues in enterprise resource planning (ERP)
implementation. Computers in Industry, 545–557.
Ferranti. (2012, 12 10). Retrieved from Ferranti Computer Systems: http://www.ferranti.be/
Fitzgerald, B. (1996). Formalized systems development methodologies: a critical perspective. Information
Systems Journal, 3-23.
Fitzgerald, Russo, & Stolterman. (2002). Information systems development: methods-in-action. London:
McGraw Hill Companies.
Friedman, A. L., & Cornford, D. S. (1989). Computer Systems Development: History Organization and
Implementation. New York, NY, USA: John Wiley & Sons, Inc. .
Law, C. C., & Ngai, E. W. (2007). ERP systems adoption: An exploratory study of the organizational factors
and impacts of ERP success. Information & Management, 418-432.
Law, C. C., Chen, C. C., & Wu, B. J. (2012). Managing the full ERP life-cycle: Considerations of
maintenance and support requirements and IT governance practice as integral elements of the
formula for successful ERP adoption. Computers in industry, 297-308.
Lee, Z., & Lee, J. (2000). An ERP implementation case study from a knowledge transfer perspective.
Journal of Information Technology, 281-288.
Legris, P., Ingham, J., & Collerette, P. (2003). Why do people use information technology? A critical
review of the technology acceptance model. Information & Management 40 , 191–204.
Light, B. (2005). Going beyond ‘misfit’ as a reason for ERP package customisation. Computers in Industry,
606–619.
Morton, N. A., & Hu, Q. (2008). Implications of the fit between organizational structure and ERP: A
structural contingency theory perspective. International Journal of Information Management,
391–402.
Ngai, E., Law, C., & Wat, F. (2008). Examining the critical success factors in the adoption of enterprise
recourse planning. Computers in Industry , 548–564.
Reijers, H. A., & Liman Mansar, L. (2005). Best practices in business process redesign: an overview and
qualitative evaluation of successful redesign heuristics. Omega, The international journal of
management science, 283-306.
Soffer, P., Golany, B., & Dori, D. (2003). ERP modeling: a comprehensive approach. Information Systems ,
673-690.
Soffer, P., Golany, B., & Dori, D. (2005). Aligning an ERP system with enterprise requirements: An object-
process based approach. Computers in Industry, 639-662.

Appendix 1
xxv
Triandis, H. C. (1979). Nebraska Symposium on Motivation, Vol 27. Values, attitudes, and interpersonal
behavior. (pp. 195–259.). Lincoln: University of Nebraska Press.
van Everdingen, Y., van Hillegersberg, J., & Waarts, E. (2008). ERP adoption by European midsize
companies. COMMUNICATIONS OF THE ACM, 27-31.
Venkatesh, V., Morris, M. G., Davis, G. B., & Davis, F. D. (2003). User Acceptance of Information
Technology: Toward a Unified View. MIS Quarterly, 425-478.
Wagner, E. L., & Newell, S. (2004). ‘Best’ for whom?: the tension between ‘best practice’ ERP packages
and diverse epistemic cultures in a university context. Journal of Strategic Information Systems ,
205-328.
Wu, J., Shin, S., & Heng, M. S. (2007). A methodology for ERP misfit analysis. Information & Management,
666–680.

Appendix 1
xxvi
Appendix A: Search terms and journal list Articles where selected mostly using science direct for the initial search. Cited articles which were
selected using the snowball and reversed snowball method where retrieved using Google Scholar. An
initial selection was made using the title, author and abstract of the articles. In case a search query
resulted in a high number of articles. The initial selection was based on only the title and author. A
secondary selection was done using the abstract of the article.
A number of articles were selected based upon the search but dropped later in the process if they did
not contribute significant new information which was not covered by other publications. These are not
included in the “selected” column.
Search terms used The search terms used are provided in Table 2.
Table 2 search terms
Search term results selected
Key Performance Indicators AND ERP 243* 2 ERP and "business process design" 64 2 ERP AND “Critical success factors” 54 2 ERP AND “maintenance and support” 127* 1 ERP AND “best practice” 111* 2 “standardized business processes" and ERP 18 2 "Business process redesign" AND "best practice" 214* 1 ERP AND "gap analysis" AND "best practice" 34 1 “performance dashboard” AND ERP 101*/** 1
*First selection on title and author, second selection on abstract.
** via Google scholar
Other publications where not found using scientific databases but retrieved from courses provided at the
department of Industrial Engineering & Innovation Sciences at Eindhoven University of Technology.
These are:
Venkatesh, Morris, Davis, & Davis (2003), suggested by dr. M. Comuzzi
Bradley (2008), suggested by dr. M. Comuzzi
Journal list For all journals, the impact factor was determined using the Thomson Reuters journal list or Elsevier
journal website. The used journals and impact factors in alphabetical order are:
Communications of the ACM 1.919 Computers in Industry 1.529 European Journal of Operational Research 1.815 Information & Management 2.214 Information Systems Journal 2.067 Int. J. Production Economics 1.760

Appendix 1
xxvii
International Journal of Accounting Information Systems - International Journal of Information Management 1.532 Journal of High Technology Management Research - Journal of Information Technology 2.321 Journal of Strategic Information Systems 1.457 The international journal of management science 3.338
Snowball graph A graphical representation of the used publications to illustrate which query resulted in which selected
publication and how the selected publications let to other paths.
The arrows show the path taken during the snowball search, both forward as backward. Note the
indicated path is the chosen path, however multiple connections/citations between publications could
exist. The graph is presented in Figure 6.

Appendix 1
xxviii
.
Key Performance
Indicators AND
ERP
Botta-
Genoulaz &
Millet, 2005
Light, 2005
Aloini,
Dulmin, &
Mininno,
2012
“standardized
business
processes" and
ERP
Morton &
Hu, 2008
ERP and
"business process
design"
Soffer,
Golany, &
Dori, 2005
Soffer,
Golany, &
Dori, 2003
Ehie &
Madsen,
2005
Basoglu,
Daim, &
Kerimoglu,
2007
Bradley,
2008
Brehm,
Heinzl, &
Markus,
2001
ERP AND
“maintenance and
support”
Law, Chen,
& Wu, 2012
ERP AND “Critical
succes factors”
Law & Ngai,
2007
Davenport,
1998
ERP AND “best
practice”
Wagner &
Newell,
2004
van
Everdingen,
et al. 2008
Chang, et
al. 2008
Lee & Lee,
2000
Legris,
Ingham, &
Collerette,
2003
Ngai, Law,
& Wat,
2008
"Business process
redesign" AND
"best practice"
Reijers &
Liman
Mansar,
2005
ERP AND "gap
analysis" AND
"best practice"
Wu, Shin, &
Heng, 2007
“performance
dashboard” AND
ERP
Eckerson,
2005
Fitzgerald,
1996
Fitzgerald,
2002
Friedman &
Cornford,
1989
Davis,
1989
Triandis,
1979
Figure 6-Publication graph

Appendix 20 – Goal correlation matrix
Goal1 Goal2 Goal3 Goal4 Goal5 Goal6 Goal7 Goal8 Goal9 Goal10
Goal11
Goal12
Goal13
Goal14
Goal1 1
0.400903
0.113959
-0.100
94 0.384
184 0.274
44 0.480
452 0.041
91
-0.451
19
-0.166
88
-0.166
24
-0.176
83
-0.070
88 0.062
41
Goal2
0.400903 1
0.19714
0.322473
-0.204
3
-0.326
51
-0.270
08
-0.451
13
-0.281
42
-0.179
82
-0.362
06
-0.058
77 0.305
2 0.498
552
Goal3
0.113959
0.19714 1
-0.008
07
-0.323
55
-0.410
02
-0.302
29
-0.179
94 0.262
807
-0.154
65
-0.047
92
-0.009
07 0.375
494 0.107
299
Goal4
-0.100
94 0.322
473
-0.008
07 1 0.143
552
-0.100
6
-0.246
59
-0.088
55
-0.037
57
-0.474
09
-0.586
48
-0.470
57 0.128
457 0.258
242
Goal5
0.384184
-0.204
3
-0.323
55 0.143
552 1 0.878
968 0.886
073 0.555
881 0.038
641 0.036
136 0.062
676
-0.006
57
-0.637
01 0.136
419
Goal6
0.27444
-0.326
51
-0.410
02
-0.100
6 0.878
968 1 0.896
822 0.531
233 0.113
555 0.114
981 0.339
782 0.269
927
-0.469
7 0.049
455
Goal7
0.480452
-0.270
08
-0.302
29
-0.246
59 0.886
073 0.896
822 1 0.578
681 0.068
09 0.134
181 0.277
433 0.194
959
-0.588
34 0.038
76
Goal8
0.04191
-0.451
13
-0.179
94
-0.088
55 0.555
881 0.531
233 0.578
681 1 0.528
531 0.255
199 0.391
081 0.295
389
-0.440
67 0.037
537
Goal9
-0.451
19
-0.281
42 0.262
807
-0.037
57 0.038
641 0.113
555 0.068
09 0.528
531 1 0.122
986 0.372
911 0.457
387
-0.086
76 0.471
936
Goal10
-0.166
88
-0.179
82
-0.154
65
-0.474
09 0.036
136 0.114
981 0.134
181 0.255
199 0.122
986 1 0.776
698 0.568
638
-0.233
71
-0.059
6
Goal11
-0.166
24
-0.362
06
-0.047
92
-0.586
48 0.062
676 0.339
782 0.277
433 0.391
081 0.372
911 0.776
698 1 0.780
935
-0.147
5
-0.041
89
Goal12
-0.176
83
-0.058
77
-0.009
07
-0.470
57
-0.006
57 0.269
927 0.194
959 0.295
389 0.457
387 0.568
638 0.780
935 1
-0.057
43 0.116
518
Goal13
-0.070
88 0.305
2 0.375
494 0.128
457
-0.637
01
-0.469
7
-0.588
34
-0.440
67
-0.086
76
-0.233
71
-0.147
5
-0.057
43 1
-0.110
52
Goal14
0.06241
0.498552
0.107299
0.258242
0.136419
0.049455
0.03876
0.037537
0.471936
-0.059
6
-0.041
89 0.116
518
-0.110
52 1