egyptian natural gas industry development- final - unece · cairo alexandria n. alamein ... natural...
TRANSCRIPT

Egyptian Natural Gas Industry Development
By Dr. Hamed Korkor
Chairman Assistant
Egyptian Natural Gas Holding Company EGAS
United Nations – Economic Commission for Europe
Working Party on Gas 17th annual Meeting
Geneva, Switzerland
January 23-24, 2007

Early Gas Discoveries: Early Gas Discoveries: 19671967
First Gas Production:First Gas Production: 19751975
Egyptian Natural Gas Industry History

Natural Gas Share of HydrocarbonsNatural Gas Share of HydrocarbonsEnergy Production (2005/2006)Energy Production (2005/2006)
Natural Gas
54%Oil
46 %
Total = 71 Million Tons

.
0 100 km
UMBARKAKHALDAKHALDA
QANTARA
ELQANTARAELQANTARAEL MANSOURA
MERLONMERLON
MANZALACENTURIONCENTURIONEL WASTANI
N BARDAWIL
IEOCIEOCRAS ELBARR
bpbp.
W. MEDITERRANEAN
bp BALTIM NEMED GASMED GAS DENISESETH
HA'PY
AKIK
TUNA
TEMSAHPETROTTEMSAHPETROTTEMSAHTAO
SET I- PLIO
28°00E 32°00E
32°00N
26°00E 34°00E30°00E
BALTIM N
GIZA
CAIRO
ALEXANDRIA
N. ALAMEINNALPETCONALPETCO
N.E. MED DEEPWATER
SHELLSHELL
TAREKKHALDAKHALDA
KHALDA OFFSETAPACHEAPACHE
KHALDA/ KHALDA WEST / SALLAMKHALDAKHALDA
OBAIYEDBAPETCOBAPETCO
MELIHAAGIBAAGIBA
MATRUHAPACHEAPACHE
KHALDAKHALDAKHALDA
SIDI KRIER
WEST MEDITERRANEANAPACHEAPACHE
EL HAMRA
RAS KANAYESAPACHEAPACHE
RAS EL HEKMAAPACHEAPACHE
W.MEDAPACHEAPACHE
N.ABU QIRA /QIR/A QIR WEGPCEGPC
RestrictedArea
N.ALEXbpbp
N.ALEXbp
ABU MADIEGPCEGPC
ABU MADI WNIDOCONIDOCOEL QARAANIDOCONIDOCO
BALTIM EMED GAS
EDDMIEOCIEOC
RESTRICTED
NWDEMIATTASHELLSHELL
CENTURION
MERLON / EL QANTARA
APACHE / KHALDA
Bp/ GUPCO
BG / RASHPETCO
EGPC
GEOGE
IEOC / PETROBEL / AGIBA
SHELL / BAPETCO
OPEN AREA
BALTIM SMED GASMED GAS
KHEPRI/SETHOS KHALDAKHALDA
MATRUHON/OFFSHORE
SHELLSHELL
WDDMBG
KAROUS
KALABSHA KHALDAKHALDA
ROSETTA BG
N.IDKUGEOGE
BALTIM E
P. FOUADPETROBELPETROBEL
MEDITERRANEAN MEDITERRANEAN SEASEA
AREAKAMOSE
IEOC
Up
Stre
am A
ctiv
ities
(Agr
eem
ents
)

Western Desert11%
Gulf of Suez8%
Delta3%
Mediterranean78%
Up
Stre
am A
ctiv
ities
(Res
erve
s)
4852
5862 65 67 68.2
0
10
20
30
40
50
60
70
80
99/00 00/01 01/02 02/03 03/04 04/05 June 2006
TCF
Natural Gas Proven Reserves Development

Natural Gas Industry Main Indicators(November 2006)
•• Gas ProductionGas Production 5.6 BCF/D5.6 BCF/D
•• Gas SalesGas Sales 5.1 BCF/D 5.1 BCF/D
•• LPG ProductionLPG Production 2.6 K Ton/D2.6 K Ton/D
•• Propane ProductionPropane Production 0.6 K Ton/D0.6 K Ton/D
•• CC22/C/C33 mix mix Production Production 1.4 K Ton/D1.4 K Ton/D
•• Condensates Production Condensates Production 105 KBBL/D105 KBBL/D

HapyLTS
Design Capacity : 340 MMscf/DSales Gas : 320 MMscf/D
Cond. : 1200 bbl / D
East BaltimGas to Abu Madi
Facilities
RosetteLTS
Design Capacity : 300 MMscf/DSales Gas : 275 MMscf/D
Cond. : 1200 bbl / D
Abu Madi & N. Abu MadiLTS
Design Capacity : 360 MMscf/DLPG
Design Capacity : 540 MMscf/DSales Gas : 540 MMscf/D
Cond. : 8500 bbl / DLPG : 400 Ton /D
AmyriaLPG
Design Capacity : 300 MMscf/DSales Gas : 275 MMscf/D
Cond. : 800 bbl / DLPG : 350 Ton /D
SalamLTS
Design Capacity : 200 MMscf/DSales Gas : 180 MMscf/D
Cond. : 9000 bbl / D
LTSObayied
LTSDesign Capacity : 420 MMscf/D
Sales Gas : 400 MMscf/D Cond. : 40000 bbl / D
Bed 2 , 3LTS
Design Capacity : 315 MMscf/DSales Gas : 300 MMscf/D
Cond. : 7000 bbl / D
Abu GhradikLTS
Design Capacity : 160 MMscf/DSales Gas : 140 MMscf/D
Cond. : 1800 bbl / D Abu SannanLTS
Design Capacity : 85 MMscf/DSales Gas : 75 MMscf/D
Cond. : 400 bbl / D
DahshourLPG
Design Capacity : 138 MMscf/DSales Gas : 125 MMscf/D
LPG : 300 Ton /D
Trans GulfLPG
Design Capacity : 130 MMscf/DSales Gas : 70 MMscf/D
Cond. : 3400 bbl / DLPG : 900 Ton /D
Ras ShoukierLPG
Design Capacity : 220 MMscf/DSales Gas : 170 MMscf/D
Cond. : 5000 bbl / DLPG : 1000 Ton /D
Zeit BayLPG
Design Capacity : 90 MMscf/DSales Gas : 20 MMscf/D
Cond. : 3400 bbl / DLPG : 500 Ton /D
Abu RudiesLPG
Design Capacity : 50 MMscf/DSales Gas : 40 MMscf/D
Cond. : 3400 bbl / DLPG : 400 Ton /D
Abu Madi
EL QARA
Alexandria
Abu Qir
Sedikreir
Ameriya
TarekEL - Obayied
SalamSouthOm Barka
Abu Sannan
Abu El Ghradik
Bed-2,3
AyounMoussaDahshour
Tebbin
CairoSuez
ZafranaKoraymat
Ras Bakr
Ras Shoukier
Asiout
ELMenia
NGL UnitDesign Capacity : 550 MMscf / DSales Gas : 470 MMscf / DEthane / Propane : 1400 Ton / DPropane : 600 Ton / D LPG : 850 Ton / DCond. : 700 bbl / D
Port Fouad / Darfeel /Temsah
LTSDesign Capacity : 600 MMscf/D
Sales Gas : 580 MMscf/D Cond. : 22000 bbl / D
LT SL P GLT S & L P GN G LL N G
Abu Qir
Design Capacity : 240 MMscf/DSales Gas : 220 MMscf/D
Cond. : 3500 bbl / DLPG : 200 Ton /D
LTSDesign Capacity : 300 MMscf/D
N. Abu Madi
Port Said
Port FouadLPG
Damietta
LNG (Idku)Feed :500 MMscf / DLNG : 9155 Ton / D
2 TrainsDesign Capacity : 100 MMscf/DSales Gas : 85 MMscf/D
Cond. : 5000 bbl / D
TarekLTS
MED. NGL (UGDC)Feed : 1100 MMscf/DPropane : 790 Ton / D
LPG : 930 BBL / DCond. : 2800 BB / D
LNG (Damietta)Feed : 750 MMscf / DLNG : 14232Ton / D
LNG (Damietta)Feed : 750 MMscf / DLNG : 14232Ton / D
Baltim
Damietta
Talkha
ShabshirTanta
OyounMoussa
Sadat City
Abu Zaabal
10 of the Ramadan
Dahshour Tebbin
SuezCity Gas
City Gas
Zafrana
City Gas
Koraymat
Nile Valley Co.
6 October
Alexandria
Sedi kreir
AmeriyaMahmudya
Egypt Gas
TarekEL - Obyed
SalamSouth
Om Barka
Matruh
Abu Sannan
Abu El Ghradik
Bed-2,3
Ras Bakr
Ras Shoukir
EL - ShababAbu Sultan
Asiout
Beni Suef
ELMenia
Cairo
Hapy
Ameriya Cement
Borg Elarab
Abu Hommos
Abu Madi
EL sheikhzowayed
Port Fouad
Port Said
East PortSaid P.S
P.SArish
CementSinai
& Ind. Area
ElQara
To Eastern pipeline
Taba
Arish
24 ”- 45 km36 ”-194 km24 ”-145 km
16 ”-165 km
16 ”-22 km
42 ”- 40 km
24 ”-50 km
32 ”-167 km
32 ”- 85 km
24 ”- 215 km
16 ”- 114 km
32 ”- 75 km
16 ”-192 km
18 ”-162 km
16 ”-256 km
24 ”- 25 km
22 ”- 87 km
16 ”-38.5 km
28 ”- 46 km
20 ”- 65 km
32 ”-170 km
30 ”- 28 km22 ”- 40 km
12 ”- 40 km
28”-118 km
28 ”- 86 km
24 ”- 45 km
32 ”-200 km24 ”-
22 km12 ”-14 km
22 ”- 40 km
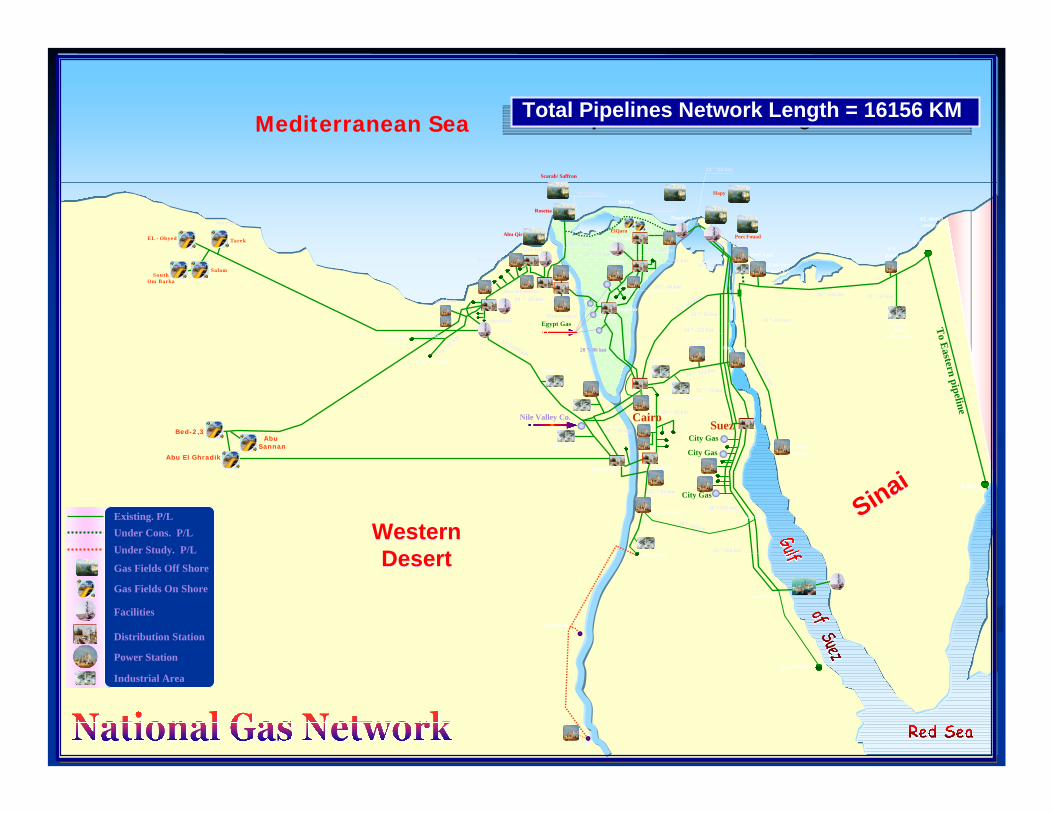
Existing. P/LUnder Cons. P/LUnder Study. P/L
Gas Fields Off Shore
Facilities
Distribution Station
Power Station
Industrial Area
Gas Fields On Shore
Mediterranean Sea
WesternDesert
WesternDesert
SinaiSinai
Abu Qir
Scarab/ Saffron
Rosetta
Abu Qir
Total Pipelines Network Length = 16156 KMTotal Pipelines Network Length = 16156 KM

National Gas Transmission Lines Development(High Pressure)
0
1000
2000
3000
4000
5000
6000
80/8
181
/82
82/8
383
/84
84/8
585
/86
86/8
787
/88
88/8
989
/90
90/9
191
/92
92/9
393
/94
94/9
595
/96
96/9
797
/98
98/9
999
/00
00/
01 0
1/02
02/
03 0
4/05
05/
06
570
KM
5700By December 2006:National Grid Length (High Pressure) = 5700 Km
Total Length = 16,156 Km
By December 2006:National Grid Length (High Pressure) = 5700 Km
Total Length = 16,156 Km
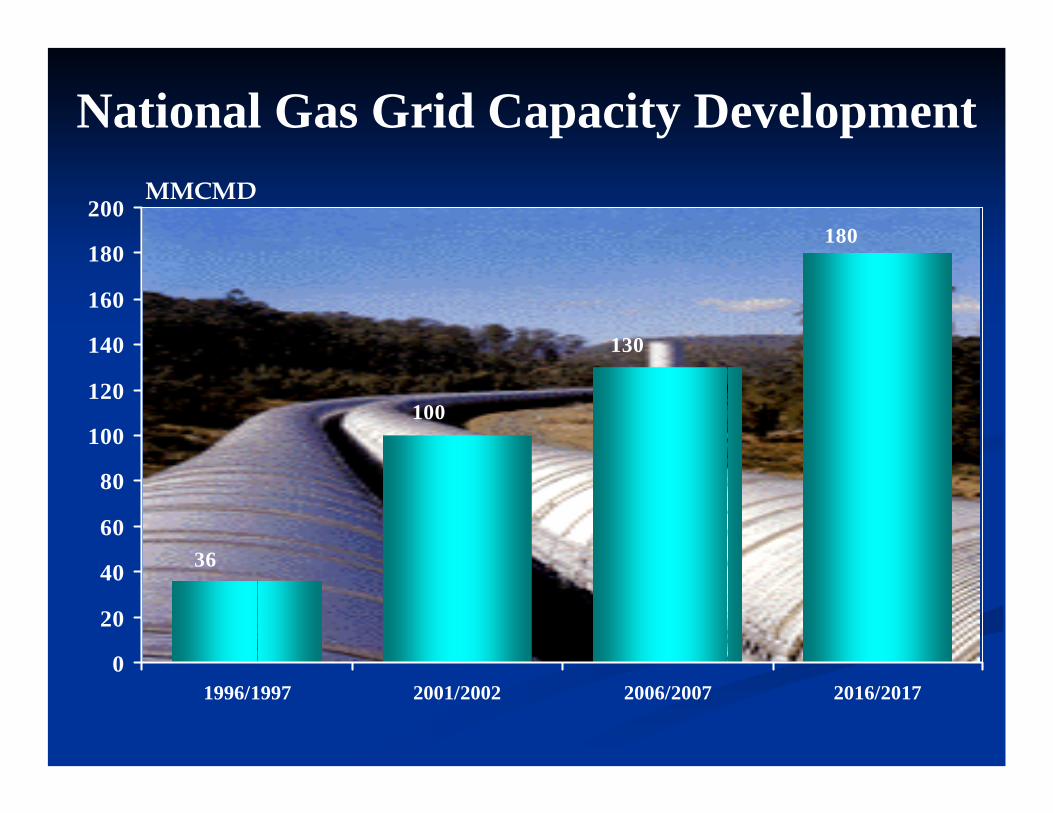
National Gas Grid Capacity Development
180
36
100
130
0
20
40
60
80
100
120
140
160
180
200
1996/1997 2001/2002 2006/2007 2016/2017
MMCMD

Natural Gas Demand DevelopmentNatural Gas Demand DevelopmentM
id S
tream
Act
iviti
es
0
10000
20000
30000
40000
50000
6000080
/81
81/8
282
/83
83/8
484
/85
85/8
686
/87
87/8
888
/89
89/9
090
/91
91/9
292
/93
93/9
494
/95
95/9
696
/97
97/9
898
/99
99/0
000
/01
01/
02 0
2/03
03/
04 0
4/05
05/
06
BSCM
2.4
52.4
18.1
3.70.7

Natural Gas Demand by Sector Share (2005/2006)
Dow
n S
tream
Act
iviti
es
Electricity39% Vehicles
1%
Fertilizers5%
Industry7%
Cement5%
Petroleum7% Residential
1%
Export35%

0
5000
10000
15000
20000
25000
30000
35000
40000
80/8
1
81/8
2
82/8
3
83/8
4
84/8
5
85/8
6
86/8
7
87/8
8
88/8
9
89/9
0
90/9
1
91/9
2
92/9
3
93/9
4
94/9
5
95/9
6
96/9
7
97/9
8
98/9
9
99/2
000
2000
/01
2001
/02
2002
/03
2003
/04
2004
/200
5
2005
/200
6
Ele c tric ity F e rt ilize r Indus try C e m e nt P e tro le um R e s . & C o m m . Ve hic le s
( 1980/81 – 2005/2006 )( 1980/81 – 2005/2006 )34.1
Average Annual GR = 11.2 %Average Annual GR = 11.2 %
Natural Gas Consumption DevelopmentNatural Gas Consumption DevelopmentNatural Gas Consumption Development
2.4
BCM
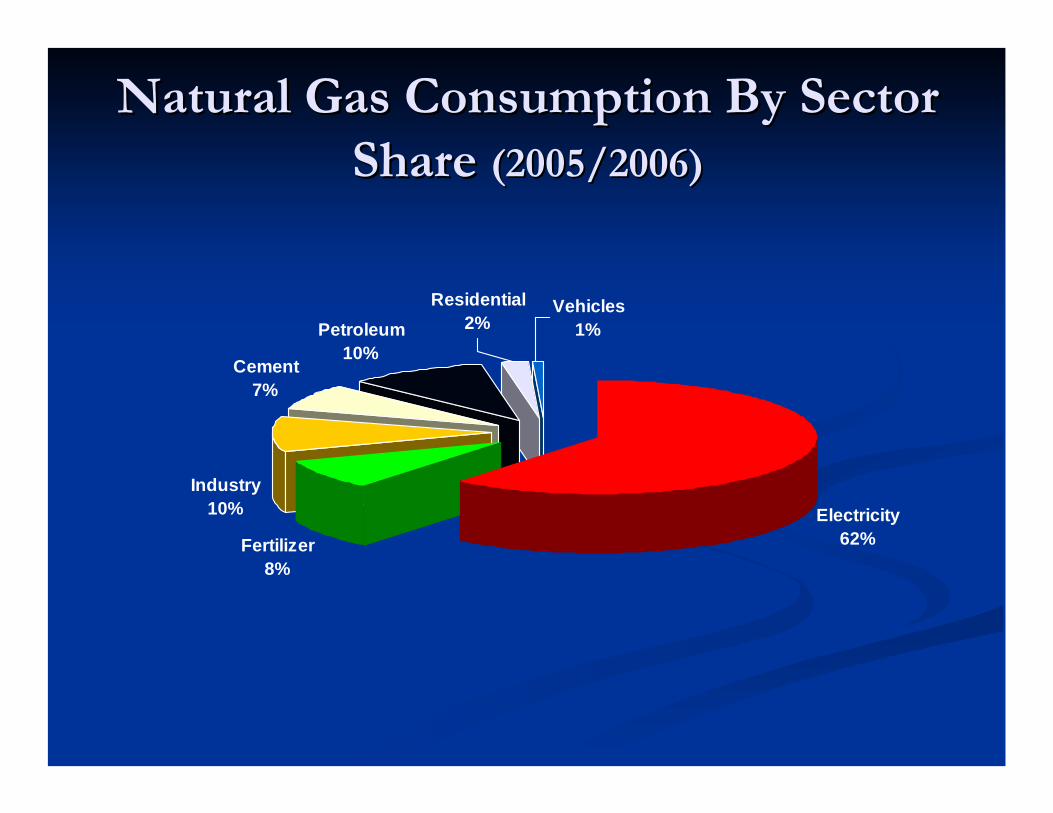
Natural Gas Consumption By SectorNatural Gas Consumption By SectorShare Share (2005/2006)(2005/2006)
Electricity62%Fertilizer
8%
Industry10%
Cement7%
Petroleum10%
Residential2%
Vehicles1%
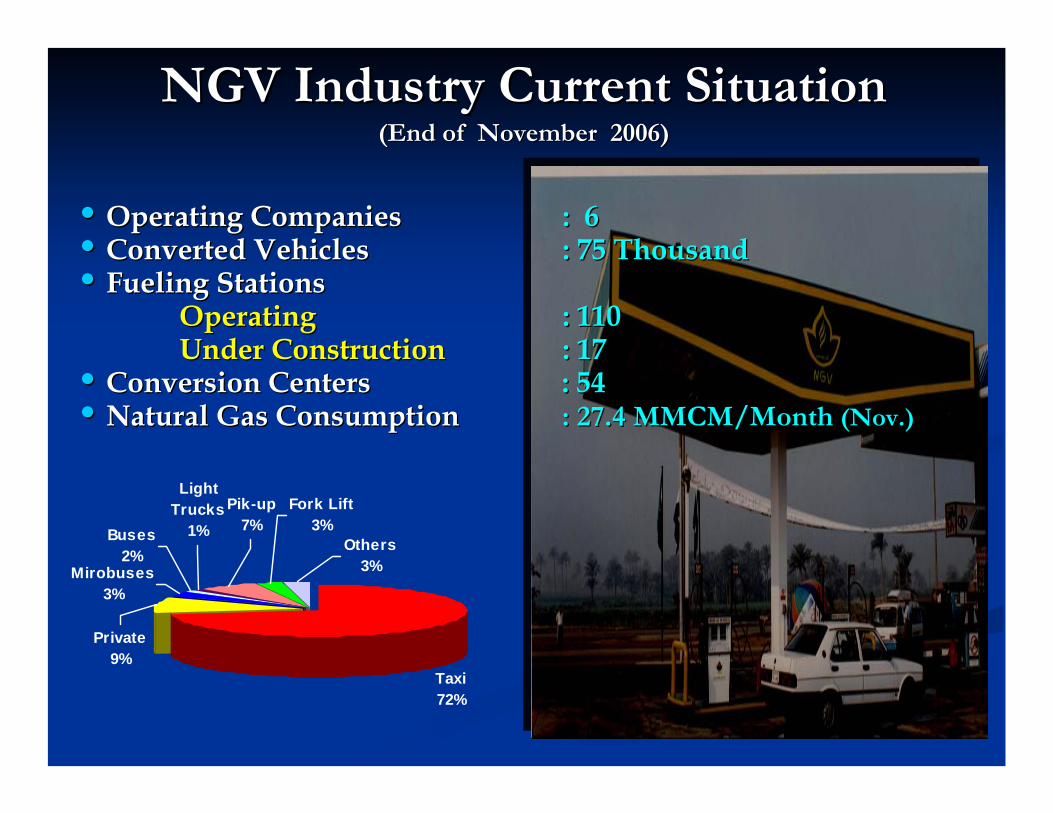
NGV Industry Current Situation NGV Industry Current Situation (End of November 2006)(End of November 2006)
•• Operating CompaniesOperating Companies : 6: 6•• Converted VehiclesConverted Vehicles : 75 Thousand: 75 Thousand•• Fueling StationsFueling Stations
Operating Operating : 110: 110Under ConstructionUnder Construction : 17: 17
•• Conversion CentersConversion Centers : 54: 54•• Natural Gas Consumption Natural Gas Consumption : 27.4 MMCM/Month : 27.4 MMCM/Month (Nov.)(Nov.)
Taxi72%
Others3%
Buses2%
Light Trucks
1%
Private9%
Pik-up7%
Mirobuses3%
Fork Lift3%

Natural Gas ExportNatural Gas Export

Gas Export Projects – Cont.Gas Export Projects – Cont.
To Jordan, Syria & then to Lebanon, Cyprus and Europe To Jordan, Syria & then to Lebanon, Cyprus and Europe
Agreement : Signed in Jan. 2001.Export : 1.1 - 3 Billion CM / Y.Investment : US $ 200.Operation : July 2003.11
““Phase I Phase I ““ To Jordan:To Jordan:(Al (Al ArishArish –– TabaTaba-- AqabahAqabah))
Through Pipelines:Through Pipelines:ArabGasArabGas Pipeline:Pipeline:Total Capacity= 10 BCMTotal Capacity= 10 BCM

““Phase II Phase II ”” AqabaAqaba––Rehab :Rehab :
36”/393 Km Pipeline System
Investments: US $ 270 - 300 million
36”/ 540 Km Pipeline System
Investments: US $ 400 - 500 million
““Phase III Phase III ”” Jordan/Syria/TurkeyJordan/Syria/Turkey
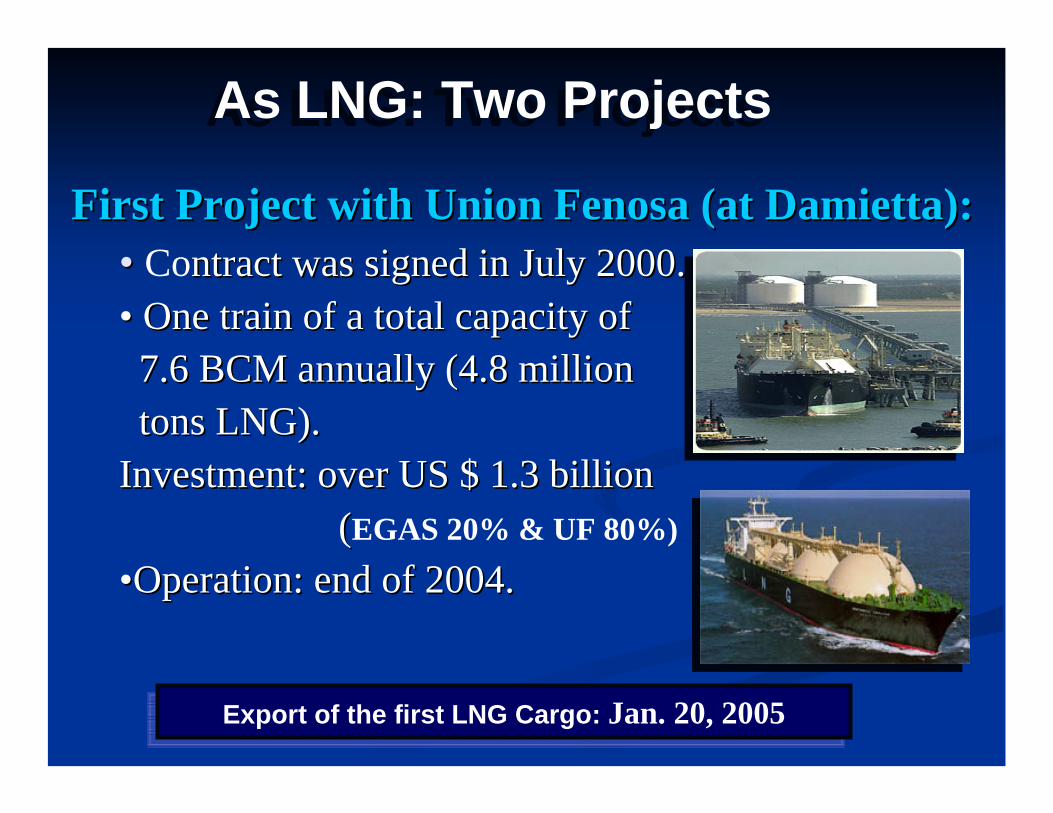
First Project with Union First Project with Union FenosaFenosa (at Damietta):(at Damietta):•• Contract was signed in July 2000.ntract was signed in July 2000.•• One train of a total capacity of One train of a total capacity of 7.6 BCM annually (4.8 million7.6 BCM annually (4.8 milliontons LNG).tons LNG).
Investment: over US $ 1.3 billion Investment: over US $ 1.3 billion ((EGAS 20% & UF 80%)
••Operation: end of 2004.Operation: end of 2004.
Export of the first LNG Cargo: Jan. 20, 2005Export of the first LNG Cargo: Jan. 20, 2005
As LNG: Two ProjectsAs LNG: Two Projects
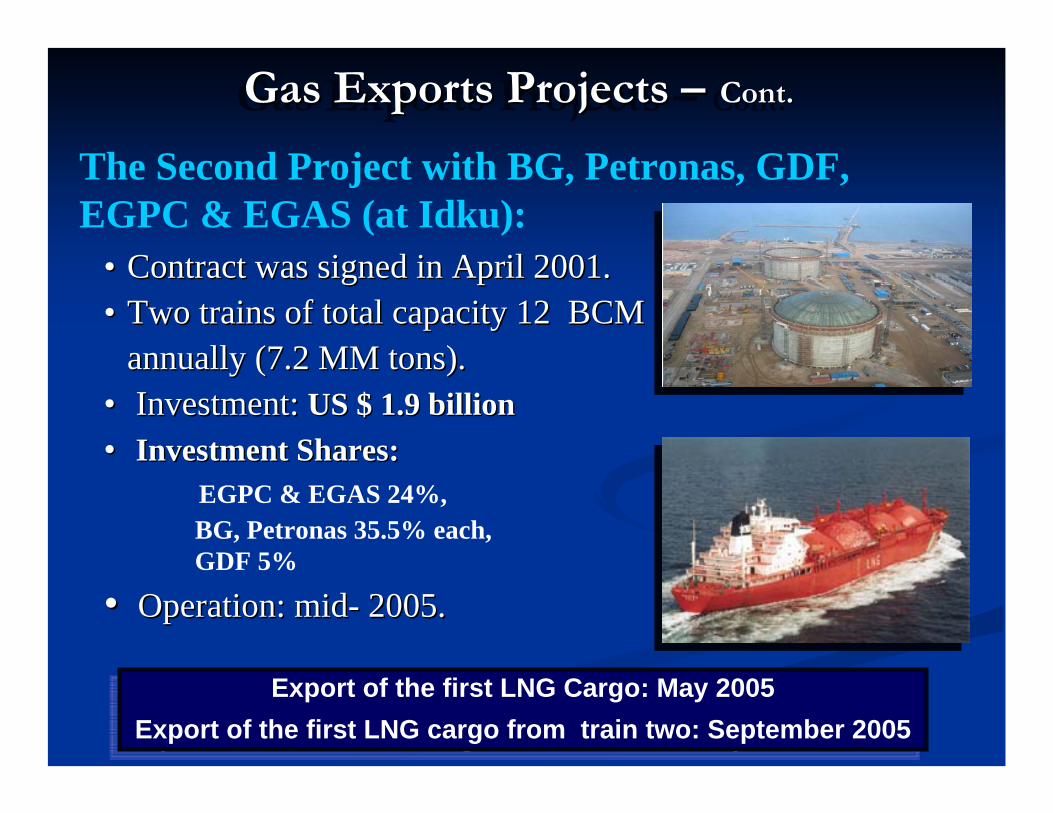
Gas Exports Projects – Cont.Gas Exports Projects Gas Exports Projects –– Cont.Cont.
The Second Project with BG, Petronas, GDF, EGPC & EGAS (at Idku):
•• Contract was signed in April 2001.Contract was signed in April 2001.•• Two trains of total capacity 12 BCM Two trains of total capacity 12 BCM
annually (7.2 MM tons).annually (7.2 MM tons).•• Investment: Investment: US $ 1.9 billionUS $ 1.9 billion•• Investment Shares:Investment Shares:
EGPC & EGAS 24%,BG, Petronas 35.5% each,GDF 5%
•• Operation: midOperation: mid-- 2005.2005.
Export of the first LNG Cargo: May 2005 Export of the first LNG cargo from train two: September 2005
Export of the first LNG Cargo: May 2005 Export of the first LNG cargo from train two: September 2005
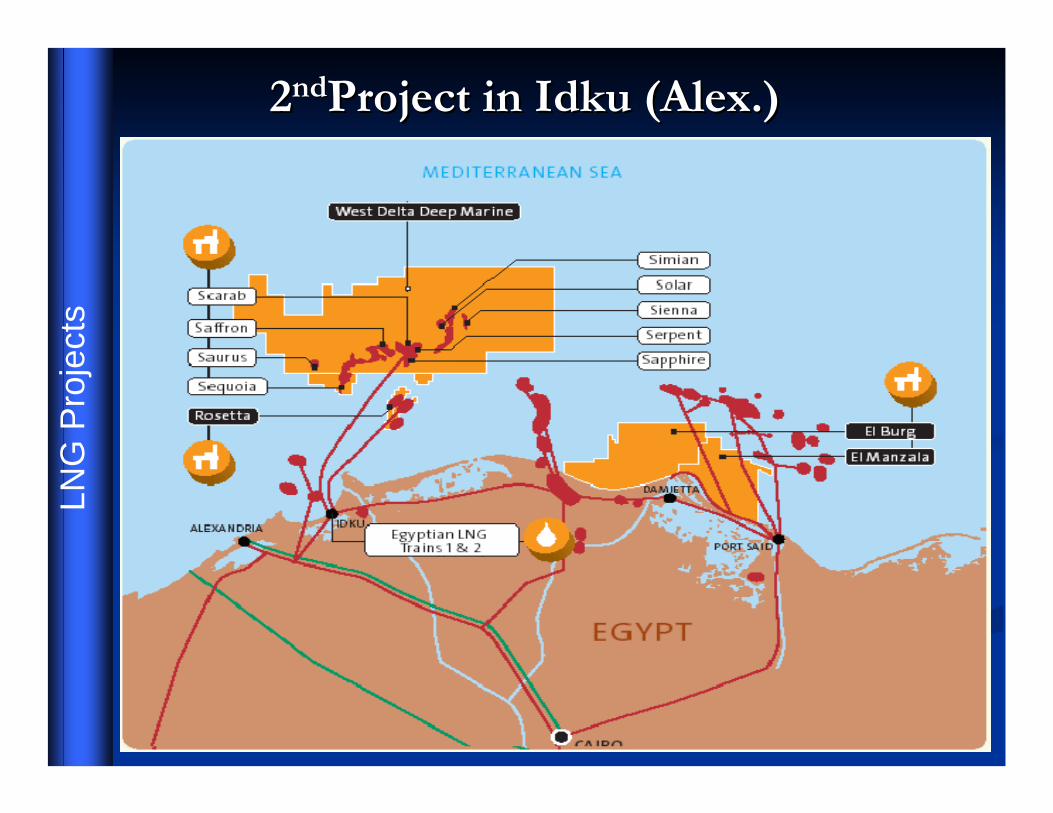
22ndndProject in Project in IdkuIdku (Alex.) (Alex.) LN
G P
roje
cts

Egyptian LNG Export
To USA
To Italy
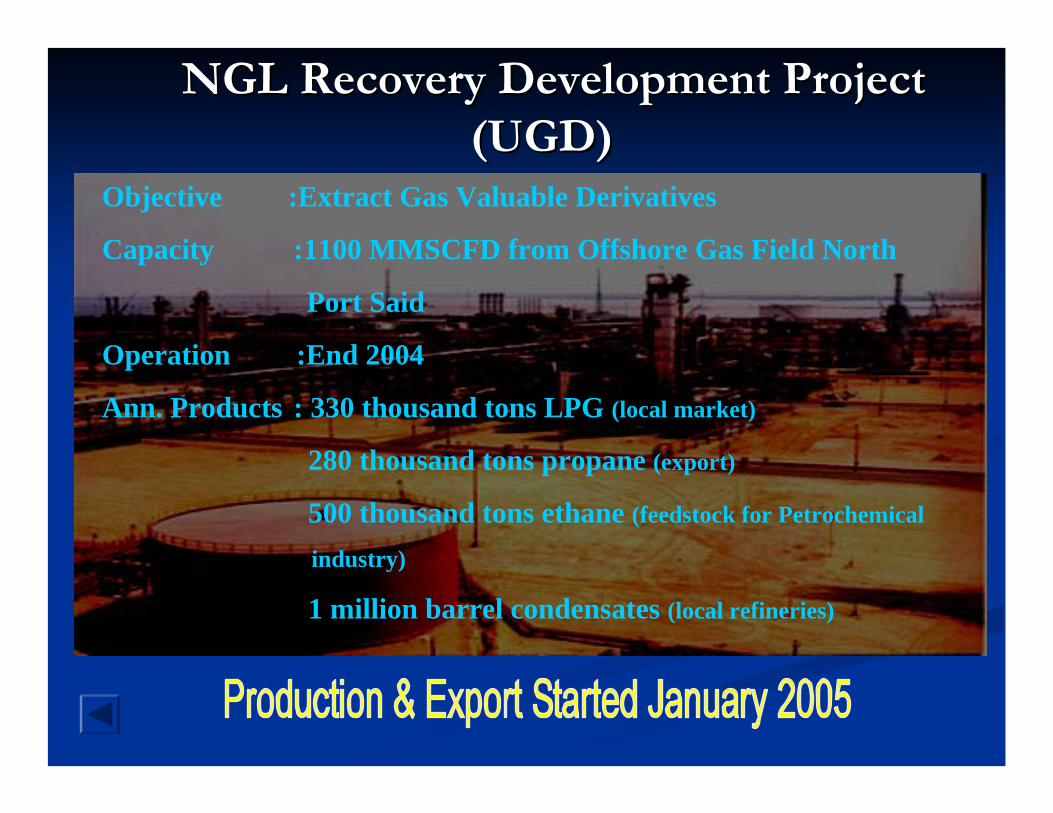
NGL Recovery Development Project NGL Recovery Development Project (UGD)(UGD)
Objective :Extract Gas Valuable Derivatives
Capacity :1100 MMSCFD from Offshore Gas Field North
Port Said
Operation :End 2004
Ann. Products : 330 thousand tons LPG (local market)
280 thousand tons propane (export)
500 thousand tons ethane (feedstock for Petrochemical
industry)
1 million barrel condensates (local refineries)

Thank YouThank You