egyptian journal of aquatic biology &...
TRANSCRIPT

www.ejabf.js.iknito.com
Egyptian Journal of Aquatic Biology & Fisheries Zoology Department, Faculty of Science, Ain Shams University, Cairo, Egypt. ISSN 1110 -6131 Vol. 21(1): 37 - 48 (2017) www.ejabf.js.iknito.com
Assessment of coastal changes along Baltim resort (Egypt) using remote
sensing and DSAS method
Walaa A. Ali1; Mona F. Kaiser1; Suzan Kholief 2 and Maysara El-Tahan3 1- Geology Department, Faculty of Science, Suez Canal University, Ismailia, Egypt.
2- National Institute of Oceanography and Fisheries (NIOF), Alexandria, Egypt. 3- Faculty of Engineering, Alexandria University, Egypt.
ARTICLE INFO
ABSTRACT
Article History: Received: Dec. 2016 Accepted: Jan. 2017 Available online: May 2017 _______________ Keywords: Baltim Landsat 8 Quality Assessment DSAS GIS Shoreline RS
Baltim resort has exposed to severe erosion due to critical natural factors, especially after the establishment of Aswan High Dam. The number of detached breakwater along Baltim resort is 14 detached breakwaters; nine of them were constructed in the period (1993-2002). The other 5 segments were constructed in the period after 2003 with the same dimensions; in addition, 9 short groins were constructed on the west of Kitchener drain). The present study was conducted to evaluate the recent shoreline sedimentation patterns and to determine whether the implemented detached breakwater systems along Baltim resort have affected that patterns or not. Quality assessment through quantitative method has been used to validate the used data, since the used images in this research are from 4 different satellite sensors; where the special and spectral resolutions are not equal. In this study, the behavior of Baltim resort's coastline was analyzed after the construction of the detached breakwaters #9 to #14, to determine whether the general erosion/ accretion pattern along the resort has been reshaped or not. Shoreline change detection was calculated using the Digital Shoreline Analysis System (DSAS). The rate of shoreline change was estimated from three statistical models of DSAS: Linear Regression Rate (LRR), End Point Rate (EPR) and Least Median of Square (LMS). Accretion in the form of tombolo between breakwaters #9 to 14 is found out to be very high with a maximum value reached ~ +32.4 m/yr, which recorded in front of breakwater #11, followed to the east by down-drift erosion that reached its maximum rate value to be ~ -34 m/y in front of the 9 groins west of Kitchener drain. At the east of Kitchener drain severe erosion happened to a distance of 5.7 km and after that distance, the shoreline is almost stable and this pattern matches with the calculated alongshore rate of shoreline changes of the present study.

Walaa A. Ali et al. 38
INTRODUCTION
Coastal areas are consider as one of the most complex, dynamic and sensitive geomorphic units which need to be under constant observation to track and monitor the continuous changes, occurring there (Alesheikh et al., 2007). The coastal zone of Nile Delta is currently undergoing extensive changing in (erosion and accretion) due to mutually natural and human impacts. These changes, erosion and accretion, caused a damage in the national economy of Egypt, where some costal roads are demolished and caused loss of building and agriculture lands (Stanley and Warne, 1993). 15% of the delta coastline is artificially protected by engineering structures, 30% is exposed with no protection, and 55% is naturally protected by coastal dunes and accreted beaches along embayment's and promontory saddles (Frihy et al., 2003). It is important to distinguish between beach erosion and shoreline erosion, where beaches change on a daily, monthly and seasonal basis mostly in response to changes in the incoming waves; while, beach erosion occurs in winter and beach accretion (build-up) in summer. However, Shoreline erosion occurs during extreme winter swells or during tropical storms and hurricanes when the waves reach the land behind the vegetation line and start eroding it (Pilkey and Dixon, 1996) such as the low lying plains land of Baltim's and dunes.
Remote Sensing (RS) and Geographic Information System (GIS) based application were used to determine the change detection of Baltim shoreline in the period from (2000-2015). The methods for change detection analyses vary across the countries and geographical characteristics (Di et al., 2004). Numerous change detection techniques using digital images have been reported in the literature as in (Singh, 1989; Lu et al., 2004). The most common methods applied for change detection include band ratio, band differencing, principal component analysis, vegetation index differencing, and post-classification change detection. Frihy et al. (1998) estimated the area change of Manzala lagoon by applying an unsupervised classification upon MSS and TM data acquired between 1978 and 1995.White and El-Asmar (1999) recommend automatic extraction of shoreline vector by computer, since it is more objective without the bias of a person.
Kaiser et al. (2004) found from Modelling and remote sensing results that eroded material from the down drift sites is deposited at the up drift sites and that previously eroded materials are now being redistributed along the Nile Delta coast. Remote sensing results of land thematic mappers acquired along the Nile Delta coast in the period from 1984-2000 indicate that the planform area decreased from sediment lost at a rate of -4.6 *104 m2/yr before engineering structures to -2.6 *103 m2/yr after engineering protection became effective. Dewidar and Frihy (2010) used the Landsat Multi-spectral Scanner (MSS) and (ETM+) digital data to monitor coastal changes along the North-eastern Nile Delta at Rosetta promontory. El-Asmar et al., (2012) used images from different satellites sensors MSS. TM, SRTM, from 1973 to 2003, and presented the major environmental hazards facing the coastal wetlands at (Manzala and Burullus) of the Nile Delta.
Ghoneim et al. (2014) applied remote sensing technique at Rosetta promontory by using moderate resolution Landsat imagery in mapping shorelines and estimating rates of coastal change through a comparative analysis with very high resolutions (VHR) multispectral imagery. Sánchez-García et al. (2015) analyzed the shoreline position extracted from Landsat TM and ETM+ imagery and applied a statistical analysis of results to characterize the medium and long term period changes occurring on beaches to assess the validity of extracted Landsat shorelines knowing whether the intrinsic error could alter the position of the computed mean annual shoreline or if it is balanced out between the successive averaged images. ERDAS Imagine 2013 and Envi 5 software were used at this study to implement image processing of satellite imageries from 2000-2015 and ArcGIS 10.2 Software Package was used in image digitizing for delineating the shoreline vector through heads-up digitization.
Assessment of coastal changes along Baltim resort using remote sensing and DSAS 39
MATERIAL AND METHODS Study area
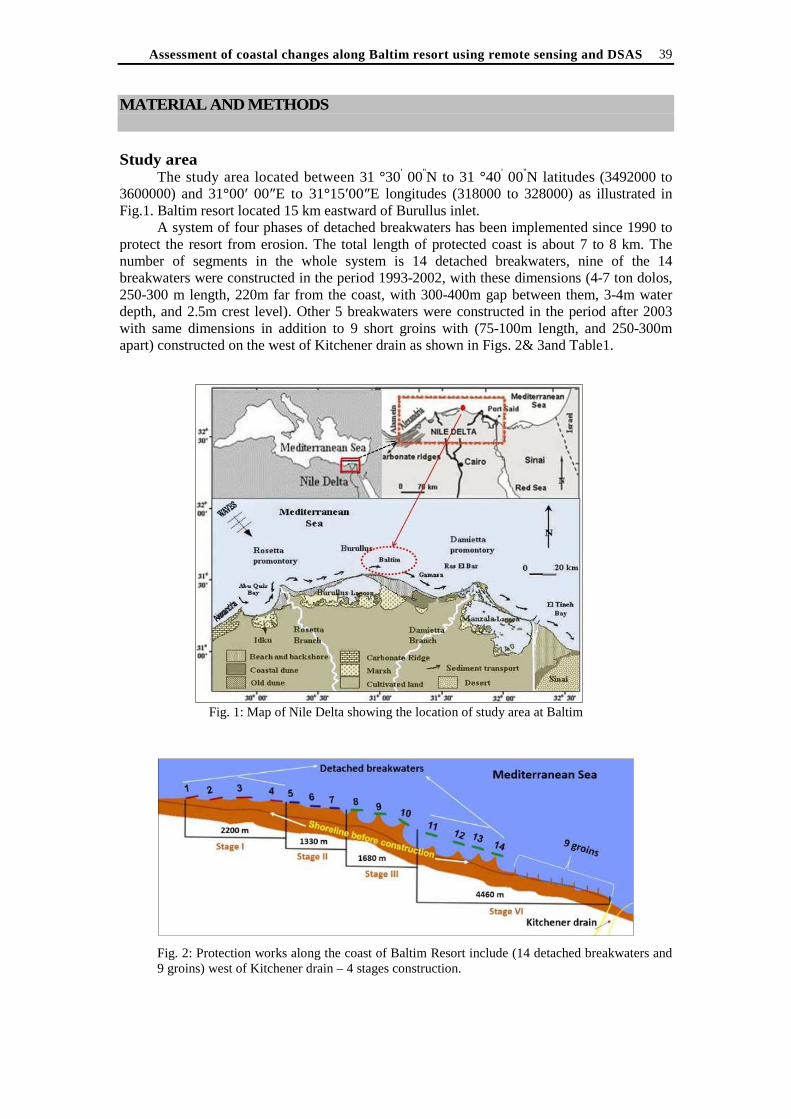
The study area located between 31 °30' 00''N to 31 °40' 00''N latitudes (3492000 to 3600000) and 31°00′ 00″E to 31°15′00″E longitudes (318000 to 328000) as illustrated in Fig.1. Baltim resort located 15 km eastward of Burullus inlet.
A system of four phases of detached breakwaters has been implemented since 1990 to protect the resort from erosion. The total length of protected coast is about 7 to 8 km. The number of segments in the whole system is 14 detached breakwaters, nine of the 14 breakwaters were constructed in the period 1993-2002, with these dimensions (4-7 ton dolos, 250-300 m length, 220m far from the coast, with 300-400m gap between them, 3-4m water depth, and 2.5m crest level). Other 5 breakwaters were constructed in the period after 2003 with same dimensions in addition to 9 short groins with (75-100m length, and 250-300m apart) constructed on the west of Kitchener drain as shown in Figs. 2& 3and Table1.
Fig. 1: Map of Nile Delta showing the location of study area at Baltim
Fig. 2: Protection works along the coast of Baltim Resort include (14 detached breakwaters and 9 groins) west of Kitchener drain – 4 stages construction.

Walaa A. Ali et al. 40
Table 1: Type of protection work along Baltim resort.
Remote sensing:-
The shoreline positions of Baltim resoart were extracted from satellite images obtained from within 15 years span. In present study a series of image data from different sensors (Egypt sat, Spot4, Landsat-8, and ETM+) are used. The dates from "2000-2003" LANDSAT ETM+ were downloaded from the USGS Global visualization Viewer (http://glovis.usgs.gov) with their multicolored bands with a resolution of 30m*30m for pixel size. The panchromatic of 15m resolution pixel size for each date has been downloaded as well. Dates 2006; 2010 brought from the National Authority for Remote Sensing and Space Sciences (NARSS) and they are as follows: Date 2006 spot4 image with 10 m resolution after merging the colored bands with the panchromatic band. Date 2010 Egypt Sat image with 7.8 m resolution pixel size. All images were acquired in summer and were cloud free (Table 2).
Table 2: Acquired dates, sensor type and spatial resolution of Land sat sensors data used in this study.
Pre-processing of the satellite images
ENVI 5 software was used to prepare the imagery (pre-processing). The pre-processing is an important step to prepare the satellite imagery for analysis. The purpose of this step is to normalize the imagery to allow inter-comparison between

Assessment of coastal changes along Baltim resort using remote sensing and DSAS 41
scenes. This can be achieved by the following steps: 1) remove the effects of atmospheric scattering, 2) Noise Removal – Principal Components Analysis (PCA) and 3) De-striping removal. Landsat Geometrical Correction and Band Combinations
All used image data were geometrically corrected based on the Universal Transverse Mercator (UTM) projection system- zone 36N. 32 Ground Control Points (GCPs) were selected based on well-known features in a Geographic Information System (GIS) to register the corrected images. Band combination of (RGB) 3:2:1 is used to display the best contrast between land-water boundaries to identify the shoreline in satellite image. Data Validation
Rates of shoreline changes estimated from two statistical approaches of DSAS [the End Point Rate (EPR) and Least Median Square (LMS)]. The data obtained from the processing of Landsat images were validated with data calculated from field survey using post-processing Kinematic (PPK) surveying for year 2014 (GPS data from Mansoura University, 2014)are validated with survey data at the same corresponding positions and time. Comparison of shoreline rates of beach change obtained from Landsat data with that previously estimated from beach profiles shows that the method used is reasonably accurate with a correlation coefficient value of 0.8.
The difference in distance between the shoreline extracted from ground survey and that estimated from the landsat-8 image is calculated by using DSAS, EPR and LMS models. The correlation coefficient between field data and the Landsat -8 image is found to be 0.79 and 0.64 by using EPR and LMS models respectively with difference distance varies between (2-15m) in case of EPR model (Figure.3).
Fig. 3: (A) Shoreline positions measured by Ground survey in Baltim 2014 using (GPS) and vector data extracted from Landsat-8 image for year 2014. (B): Correlation coefficient between field measurements and vector data of shoreline positions using EPR and LMS models.

Walaa A. Ali et al. 42
Digital Shoreline Analysis System (DSAS) The Digital Shoreline Analysis System (DSAS) Version 4.2 was used to
calculate the rate of shoreline changes at the concerned sites along the Nile Delta. It is an application which is added to the ArcView GIS software (Thieleret al., 2009). The rates of shoreline changes calculated by DSAS are reliable as the shoreline data (Anders and Byrnes, 1991; Moore 2000). The data required for the DSAS application are: 1) Vectors data for the shoreline positions extracted from satellite images, 2) a digital baseline; onshore or offshore. The application is carried out through the following steps: Step (1): Forming transects perpendicular on the baseline and cutting the digitized shorelines by fixed spacing and length. Step (2): Measuring the transect length between the baseline layer and the shorelines layers. The distance between the shoreline and the baseline layers is calculated by measuring the distance between the start of transect at the baseline and the intersection of transect with the digitized shoreline (Fig. 4). Step (3): Calculating the rate of changes in the shoreline with different statically methods according the changes in the shoreline through different dates.
Fig. 4: (A): Digitizing of shoreline change detection along Baltim resort for dates (2000-2015). (B):- Zoom in to show transect lines, transect length, transect spacing, baseline and extracted shorelines. RESULTS AND DISCUSSION
Each method used to calculate shoreline rates of change was based on measured
differences between shoreline positions through time. The reported rates are expressed as meters of change along transects per year. Rate calculations were performed by MATLAB executables bundled within the DSAS installation.
(B)

Assessment of coastal changes along Baltim resort using remote sensing and DSAS 43
DSAS Models Statistical 517 transects were used to calculate the rate of shoreline change along Baltim
resort for shore distance of ~26km started from the seawall of burullus inlet as presented in Figure (4). Each method used to calculate shoreline rates of change was based on measured differences between shoreline positions through time. The reported rates were expressed as meters of change along transects per year.
1. (EPR-Model):- The End Point Rate was calculated by dividing the distance of shoreline movement by the time lapsed between the oldest and the most recent shoreline.
2. (LLR-Model):- The Linear Regression Rate-of-change statistic was calculated by fitting a least-squares regression line to all shoreline points for a specific transect.
3. (LMS-Model):- The Least Median of Squares statistic was calculates by using the median value of the squared residuals instead of the mean in LRR model to determine the best-fitequation for the line to all shoreline points for a specific transect. This method is a more vigorous regression estimator that minimizes the influence of anomalous outlier on the overall regression equation. Values of LRR, EPR, LMS for the 4 sectors covers the area of study are presented in Fig. (5) for the time span 2000 to 2006 and 2006 to 2015. Positive and negative values refer to the accretion and erosion process respectively (Table 4).
4. 5. 6. 7. 8. 9. 10. 11. 12. 13. 14. 15. 16. 17. 18. 19. 20. 21. 22. 23. 24. 25. 26.
Fig. 5: (A) Burullus-Baltim sector showing superimposed shoreline positions from 2000 to 2015 and protection structures. (B) Variations in the rates of beach change calculated using DSAS program along the study coastline divided sectors, alternating between erosion and accretion.

Walaa A. Ali et al. 44
SAS rate of change models during and after the project implementation (2000-2006) are repesented in Figure (6). The EPR- Model and LRR-Model show the the most confidance of shoreline pont data with transects taking perpendecular on the shoreline, where, the R-squared has reached 0.55 and 0.55 respectively in the time span 2006-2015.
Fig. 6: DSAS rate of change models (A): During the project implementation (2000-2006), and (B): After the project implementation (2006-2015), where (a):EPR-Model, (b): LMS-Model; (c): LRR-Model, (d) Rate of shoreline change from the three models (EPR, LMS, LRR).
Area lost from shoreline
The fundamental problem associated with constructing the protection structures is, they cause beach erosion on their down-drift side. This process of erosion-accretion may be repeated and continued to cover the coastline as "an erosional chain reaction". Mostly, the shoreline retreat resulted from chain reaction can't be stopped, but it can slowdown ; moreover, sand beach loss can be compensated (Frihy, 2009).
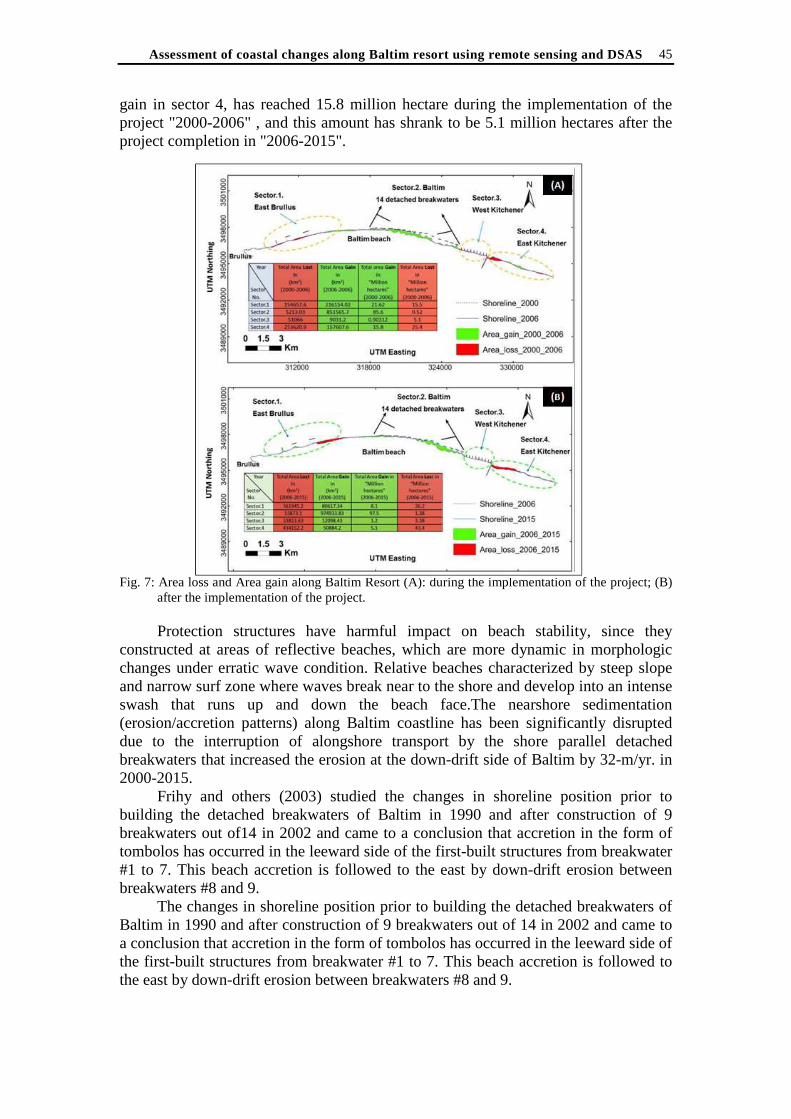
At the present study, the area lost or gained from the shoreline in the period from 2000 to 2015 are calculated and presented in Fig. (7). It was found that sector 4, East Kitchener drain, which is the most risk zone in Baltim locality, has lost about 25.4 million hectares during the implementation of the project "2000 and 2006" and the area continued in its sever erosion to lose ~ 43.5 million hectares. However, the area
Assessment of coastal changes along Baltim resort using remote sensing and DSAS 45
gain in sector 4, has reached 15.8 million hectare during the implementation of the project "2000-2006" , and this amount has shrank to be 5.1 million hectares after the project completion in "2006-2015".
Fig. 7: Area loss and Area gain along Baltim Resort (A): during the implementation of the project; (B) after the implementation of the project.
Protection structures have harmful impact on beach stability, since they
constructed at areas of reflective beaches, which are more dynamic in morphologic changes under erratic wave condition. Relative beaches characterized by steep slope and narrow surf zone where waves break near to the shore and develop into an intense swash that runs up and down the beach face.The nearshore sedimentation (erosion/accretion patterns) along Baltim coastline has been significantly disrupted due to the interruption of alongshore transport by the shore parallel detached breakwaters that increased the erosion at the down-drift side of Baltim by 32-m/yr. in 2000-2015.
Frihy and others (2003) studied the changes in shoreline position prior to building the detached breakwaters of Baltim in 1990 and after construction of 9 breakwaters out of14 in 2002 and came to a conclusion that accretion in the form of tombolos has occurred in the leeward side of the first-built structures from breakwater #1 to 7. This beach accretion is followed to the east by down-drift erosion between breakwaters #8 and 9.
The changes in shoreline position prior to building the detached breakwaters of Baltim in 1990 and after construction of 9 breakwaters out of 14 in 2002 and came to a conclusion that accretion in the form of tombolos has occurred in the leeward side of the first-built structures from breakwater #1 to 7. This beach accretion is followed to the east by down-drift erosion between breakwaters #8 and 9.

Walaa A. Ali et al. 46
At present research after 13 year and after the construction of breakwaters #10 to 14, the same process of forming tombolo at the leeward side followed by severe down-drift erosion still happening at breakwater #14. It noticed that the 14 breakwaters transferred sediments behind them, which is a good indication of high speed of current as simulated and caused erosion at the down-drift side. However, at breakwater #1 and 2 the shoreline advanced and accretion load behind the detached BWs have reached the beach to act as seawall. In case of the 9 groins, scouring happened between them because of slowing in current speed and the large space between them, which caused sedimentation after groin #9 accretion. At east of Kitchener drain, sever erosion happens to a distance extended to ~5.7 km and after that distance the shoreline almost stable. This pattern matches with the alongshore rate of shoreline changes calculated at this study by DSAS, where a maximum rate of erosion reached (~ -33 m/year),
The down-drift erosion east of the breakwater # 14 eventually resulted from the tombolo formed behind breakwaters # 10, 11, and 12. The formation of the tombolo acts as a complete littoral barrier that traps all the littoral drift and accordingly interrupts the eastward longshore sediment transport.
SUMMARY AND CONCLUSION
The present study was undertaken in order to determine whether the implemented
detached breakwater systems that built along Baltim beaches have affected their sedimentation patterns. Mostly, as anticipated, results of transects analysis documented accretion behind the breakwaters associated with erosion in their down-drift sides. The formation of this erosion is previously explained in literature due to the interruption of the longshore transport by the shore-parallel detached breakwaters.
The 15-year monitoring period at this study of Baltim coastline recommends that the breakwaters caused an additional and continuous erosion rate above the background erosion by approximately (-34.7m ) east of Kitchener drain. The problem of scouring erosion between the 9 groins west of Kitchener drain has been shifted to down-drift areas with higher rates. Shoreline accretion due to tombolo formation at Baltim detached breakwaters # 11 is (+33m/year) and followed by down drift erosion that reached (-12.4 m/year) east to Kitchener drain in front groin#9. It is detected at this study after the completion of constructing the 14 detached breakwater of Baltim, they are not satisfactory to let water to tide over the breakwaters and avoid forming tombolo.
ACKNOWLEDGMENTS The authors are very grateful to Mansoura University for providing post-
processing Kinematic (PPK) surveying for year 2014 to validate the satellite image data, and to the National Authority of Remote Sensing [NARS] staff for their ongoing support in processing the satellite images and valuable guidance during the preparation of this paper.
REFERENCES
Alesheikh, A. A.; Ghorbanali, A and Nouri, N. (2007). Coastline change detectionusing
remote sensing. International J. Environ. Science and Technology, 4(1): 61-66. Coleman, J. M.; Robert, H. H.; Murray. S. P. and Salama, M. (1981). Morphology and
dynamic sedimentology of the eastern Nile delta shelf. Mar Geol,(42):301–312.

Assessment of coastal changes along Baltim resort using remote sensing and DSAS 47
Dewidar, KH. M.and Frihy, O. (2010).Automated techniques for quantification ofbeach change rates using Landsat series along the North-eastern Nile Delta, Egypt, Journal of Oceanography and Marina Science, 12: 28-39.
EL-Asmar, H. M.; Hereher, M. E.and El-Kafrawy, S. B. (2012). Threats Facing Lagoons along the North Coast of the Nile Delta, Egypt, International Journal of Remote Sensing Applications, 2: 24-29.
Frihy, O. (1998). Nile Delta shoreline changes: aerial photographic study of a 28-year period, J Coast Res, (4):597–606.
Frihy, O.; Debes, A. E. and El Sayed, W. R. (2003). Processes reshaping the Nile delta promontories of Egypt: pre- and post-protection. Geomorphology, (53):263–27.
Ghoniem, E.; Mashaly, J.; Gamble., D.; Halls, J. and Abu-Bakr. M. (2014). Nile Delta exhibited a spatial reversal in the rates of shoreline retreat on the Rosetta promontory comparing pre- and post-beach protection, Geomorphology, 228:1-14.
Hereher, ME. (2009). Inventory of agricultural land area of Egypt using MODIS data, Egypt J Remote Sens Space Sci, 12:179-184.
Ibanez, C.; Prat, N. and Canicio, A. (1996). Changes in the hydrology and sediment transportproduced by large dams on the lower Ebro River and its estuary. Regul.Rivers Res. Manag, 12: 51-62.
Kaiser, M. F. (2004). Monitoring and modeling the impact of engineering structures on coastline change, Nile Delta, Egypt. Ph.D. Thesis, University of Reading, UK, 270p.
Dewidar, Kh. M. and Frihy, O.E. (2010). Automated techniques for quantification of beach change rates using Landsat series along the North-eastern Nile Delta, Egypt, Journal of Oceanography and marina Science, 12: 28-39.
Lu, D.; Mausel, P.; Brondizio, E. and Moran, E. (2004). Change detection techniques. Int J. Remote Sens, 25: 2365–2404.
Michalis, L.; Nektarios, C. and Yiannis, K. (2009).Shoreline Extraction Using Satellite Imagery.Beach Erosion Monitoring Journal, 8:1-9.
Pilkey, O.H.; Dixon, K. L. (1996). The Corps and the Shore.Island Press, Washington D.C. 272 pages.
Said, R. (1958). Remarks on geomorphology of the Delaic Coast between Rosetta and Port Said. Bult. Soc. Geog. Egypt, 31:115-125.
Sestini, G. (1992). Implications of climatic changes for the Nile Delta. In, Jeftic L, Milliman D, Sestini G (eds) Climatic change and the Mediterranean. Edward Arnold, London: 535–601.
Singh, A. (1989). Digital change detection techniques using remotely-sensed data. International Journal of Remote Sensing, 10: 989-1003.
Stanley, D.J. and Warne, A.G. (1993). Nile Delta: recent geological evolution and human impact. Science, 260:628-634.
Stefano,A. D.; Pietro, R. D.; Monaco, C. and Zanini, A. (2013). Anthropogenic influence on coastal evolution: a case history from the Catania Gulf shoreline, eastern Sicily, Italy. Ocean Coast. Manag, 80: 133–148.
Thieler, ER.;Himmelstoss, EA.; Zichichi, JL. and Ayhan, E. (2009). Digital Shoreline Analysis System (DSAS) version 4.2, An ArcGIS extension for calculating shoreline changes. U.S.Geological Survey Open-File Report: 2008-1278.
White, K and El-Asmar, H. (1999). Monitoring changing position of coastlines using Thematic Mapper imagery, an example from the Nile Delta. Geomorphology, 29: 93–105.

Walaa A. Ali et al. 48
ARABIC SUMMARY
����� ��� �� ���� ا�����ات ا���ط��� ��� ط�ل �)�� ( �����%�ت ا$ ��!�ر �" �! و ا��� �' ام ��ا���ط�ءا��*(� �')
٣��6ة ا����ن - ٢ �زان ���1 -١%� 0/اد *��� -١و-ء ��اد ���
١ - ABCDEDBFEا HIJ -مDLMEا NBLO - PQDIEة اASJ NMTAC - NBLBUAVWXا– YZT. ٢ - \TD]Eا ^_MVEا NQر^SaWbAc ^QAZVEر واAefEم اDLME– YZT.
٣ - NW^S_Eا NBLO - NQر^SaWXا NMTAC– YZT.
BhLc iBZT jطAl ضYMnQ اتDSW pST N]hSVEا A_E ضYMnq rnEا NCYeEا NBMBfhEا sTاDMLE NFBnt ^Q^uEا sOvnLE H wCاDVEا rLxAIEا yQYuEا zB{ \Eإ }Eأدى ذ �Bx، wBftAC رAآ� �T wBLU �qYq ATو rEAMEا ^IEء اAutإ ^Mc N�Aة و�^BMc
NFBnt �B�AhZVEا ��AfO رAB_tاء وا�CXا �Mc r� wTا^Mtت وا�B�Eوا ��AfaLE اتDSEات اYn� ءASأ� YefEت اAVF_E . }EpE NBxABIEت اAطAuSEا NBVSqو YeSEف اA]Q� N]hSVEه اp_E NQAVx تAUوYuT sVMc اط\ءDuEا NQAVeE NTAMEا N�B_Eا �TAJ Yا�Dqو NCAeEت اAQDEأو �Ix sxاYT \LU HBhLc jطAl NQAVx تAUوYuT sVMc N�B_Eا �TAJ �Bx HBhLc iBZVc
NBEAVEارد اDVEا NxAnVEا . rqت ا�AUوYuVEه اpء ھAutإ �T NWDVLVEا NBcAFQbا ��AnSEا �T نAOو: - ًATAVq iBZVEا N]hST r� sOvnEا iJDq.
HO٣٠٠YnT وYUض yWDnT x١٠^وث AfBWYqت اATYEل اDuLE NtDaVEاطj واAInOب أرا}\ Q^C^ة Dhcل •• N]hSVEAc راتAV�nWbا \LU ظA�eEوا NxABIEاء اYإ�. • hST zL� rEAeEا jطAuLE iUA¡T لDhc rEAeEا iBZVLE اد^nTة ا^Q^C jاطDl N]. • iBZVEا jاطDuc ريAVMVEر اAV�nWbا r� Ne{اDEا NSBt£VhEا. • HBhLc iBZT NSQ^T \Eإ HBhLc iBZT sQDenc ارYJ إ�^ار .
\q¤E �L�Dqو HBhLc N]hSVc \EAeEا ¥{DEا HBB]nc NWرا^Eا �TAJ: - I�q Hq AVOو ¥JDnT Dھ AVO �CاDeEا iL� تABcDWYEا HOاYq ط\ء أنAuEا y� sBLeq ل�� �T N]cAIEت اAWرا^Eه �\ اYB
down-drift اfnُQ NMh]nVE¥ دا�Yet N]hSVc AV وftAC \LU sO£q\ ھpه اDeEاYBI�q Hq �Bx ،�C ظAھYة اN]hST \� sO£nE ال . �fIctombolo اAh]tع وs�AW اs]SE اNBLxAIE اABcDWYEت �fIc اDeEا�C اNMh]nVE اeQ \nE^ث �A_�L ال
� �T ةYn�Eم - ):٢٠٠٢- ١٩٩٠(�\ اAU \� HBhLc iBZT اط\ءDl NQAVeE NMh]nVEاج اDTXا �CاDx ءASc sfJ١٩٩٠ ^Mcوy� \� YB«q اAuEط\ء NFBnt اAfBWYnEت �\ ، x^ث q[^م و �CAx٢٠٠٢ �\ Dx١٤اU �T NMh]nT �C^د ASc٩ء U^د وا�Mfq ٧#اE\ رHJ ١#اDanq \nEن �iL اDeEا�C اNMh]nVE واYq \nEاiL� �VO اDeEاsaltombolo �T �C ال
\� Yet N]hSVc down-drift �CاDeEم اAT٩#،٨#ا . � HJر �T ةYB�Xا NLxYVLE NMh]nVEا �CاDeEء اAutم اAVqا ^Mc#١٠ HJر \Eم أ ١٤#اATت اABcDWYEا HOاYq NBLVU تYVnW
HBhLc ط\ءAl ـEن اDaq NFBnttombolo \Eت اAfBWYnEل ا^MT sو� �Bx ،�CاDeEا iL�)م٣٥/AQDSW ( �T ةYn�Eا \�)٢٠١٥- ٢٠٠٠ ( ¥fqُوأ N]hSVc ال \� Yetdown-drift HJر ¥h]nVEاج اDTXا �CAx ^SU#ل ١٤^MT sو� �Bx،
\Eا A_B� YeSEم٢٠- (ا/AQDSW.( وb^MT ^�Ycت اHBhLc iBZVE . YeSE DeLE١٤ا�C ال down-drift رؤوس N]hST \� NQYec اYeSE �\ ال Hq٩ اAutء �
�T ةYn�Eا \� N]hSVEه اp٢٠١٥- �٢٠٠٠\ ھ HJأس رYEا ^Mc AT \Eا A_LBxYq Hq ؤوسYEا �Bc YeSEا N]hST ان �Bfq#٩ ).(YZT~ -13mف b^MT ³LfQ �Bx YSBunBOت اA_c YeSE اE\ اQ^FE^ة واN]hST ²fZnEdown-drift \LU shq \nE ال
� YSunBO فYZT: - \Eا ^nVq N�AIVE YSunBO فYZT قYl ^Q^l Yet ث^eQ5.7 sO£q N�AITو \LxAIEا yµEل اDط �T HO \Eا �Lض و�X�٢٨٠\ ا \Eا N]hSVEه اp_c Yet ل^MT \ZJ³ اLfQ �Bx ، م٣٣- (م/AQDSW (y� ²fZQ N�AIVEه اpھ ^Mcو
AT ^x \Eا �cA� ط\ءAuEا . � H¶Jج رD¶TXا �CاDx ^SU ط\ءAuEا y� م^]qت وAfBWYnEا HOاYq ارYVnWAc#١ H¶Jن ٢#ورA¶Mh]nVEان ا�CA¶eEان اp¶ھ s¶MC ،
. D�nµQا ATAVq �\ اATYEل وDLVMQا ATYc �f�T y�AeOل اAuEط\ء