ego-centered network analysis meredith rolfe, oxford university using sample surveys to study social...
TRANSCRIPT

Ego-centered Network Analysis
Meredith Rolfe, Oxford University
Using Sample Surveys to Study Social Networks
Connect to wirelessDownload filehttp://dl.dropbox.com/u/7685173/polnet2011.R

Whole Networks….S
ourc
e: C
hris
taki
s an
d F
owle
r, 2
008

….vs. EgoNets

Pros and Cons of Egonets
Whole Networks Often limited samples
(college/high school students, work groups)
Political attitudes are often tack-ons, if collected at all
Subjects enjoy Lots of well-developed
analysis methods Nice pictures Recall/Missing Data
Ego Networks General Sample Included in widely available
attitude and election studies (NES, GSS, South Bend, ILS, NCCS, BES, CCAP)
Respondent burden Recall/Reporting errors Sample attrition
EGO NETWORK MEASURES: 5 POLITICAL DISCUSSANTS
The Traditional Approach

Surveys with Political Networks data
Columbia School (Elmira) Detroit Area Studies South Bend 1985 (Huckfeldt and Sprague 1985) Indianapolis-St. Louis (1996 ILS) (Huckfeldt and Sprague
2000) ANES (years) Spencer Foundation 2000 (Mutz) General Social Survey (1985/1987) CNES 1992
Great Britain, Germany, Japan, Spain, and the United States Snowball sample of Spouses (D2) and Other Discussants (D3)
CCAP (US, UK, Germany)

Political Discussion Name Generator

Structure of the Data: Original (Wide)
Main Resp
Name 1 Name 2 … Name 5 D1.Male D2.Male …
1 John Dean … NA 1 1 …
2 Sue Pete … Aya 0 1 …
3 Kate Sara … Ewan 0 0 …

Example: CNES & CCAP
Read in Datacnes.d1<-read.dta("http://dl.dropbox.com/u/7685173/cnes.d1.dta")
cnes.d2<-read.dta("http://dl.dropbox.com/u/7685173/cnes.d2.dta")
cnes.d3<-read.dta("http://dl.dropbox.com/u/7685173/cnes.d3.dta")
ccap<-read.dta(http://dl.dropbox.com/u/7685173/ccap.dta)
Summary of Datasummary(cnes.d1)colnames(cnes.d1)summary(cnes.d2)summary(cnes.d3)summary(ccap.nets)

Structure of the Data: Transformed to Dyadic (Long)
Main Resp
R.Vote D.Num Name
D.Male D.Educ D.Vote …
1 Dem 1 John 1 Coll Rep …
1 Dem 2 Dean 1 HS Dem …
2 Rep 1 Sue 0 HS Rep …
2 Rep 2 Pete 1 Coll DK
2 Rep … …
2 Rep 5 Aya 0 Coll Rep
3 DK 1 Kate 0 HS Dem
3 DK 2 Sara 0 HS DK
3 DK …
3 DK 5 Ewan 1 HS Dem

Transform the Data to Long Format
Step 1 - “line up” the variables correctlyshape<-c(seq(2,10,by=2),seq(3,11,by=2))for(i in 12:23) shape<-c(shape,seq(i,i+48, by=12))temp<-NULLfor(i in seq(1,66,5)) temp<-c(temp,list(names(cnes.sm)[shape[i:(i+4)]]))
Step 2 – reshapecnes.long<-reshape(cnes.d1, varying=temp, idvar="caseid", timevar="discnum", v.names=c("d.given", "d.name", "d.relate", "d.cowork", "d.church", "d.nghbr", "d.friend", "d.close", "d.educ", "d.discpol", "d.disagree", "d.male", "d.expert", "d.vote"), direction="long", time=1:5)
Step 3 – Do any variable recoding (see polnet20011.R)

Personal Network Size
Discussant Name Given? (d1.given – d5.given)cnes.d1$netsize<-rowSums(cnes.d1[,grep(“d[1-5]_given”, colnames(cnes.d1))]==1, na.rm=TRUE)egen netsize = neqany(d1.given d2given d3given d4given d5given), values(1)
Analysisattach(cnes.d1)table(netsize)hist(netsize, breaks=6)##also see lattice versionsumm netsizetab netsize

Non-response
No one to talk totapply(married, netsize==0,mean.na)35% are married!
Nothing to talk abouttable(sp_talkpol, married)
Low political interestprop.table(table(polint, netsize==0),2)chisq.test(polint, netsize)
Forgetting Non-compliance

Online survey issues:Invalid responses
Telephone and Face to Face surveys, no invalid answers that could be verified
Online – there could be many invalid answers!attach(ccap)table(b2.pn1.cat)table(b2.pn1[b2.pn1.cat=="missing (sure)"])
Invalid answers can increase/decrease depending on non-response format and forced/semi-forced choice optionsprop.table(table(b2.pnum==b2.pnum.orig))

Pol
itica
l Dis
cuss
ants
Nam
ed

Network size:Political Discussion sub-network
Need to identify political discussants from important matters discussantstable(d.discpol)table(tapply(d.discpol%in%c("often", "sometimes", "rarely"), caseid, sum.na))
Assign back to “wide” format filecnes.d1$pnum[order(cnes.d1$caseid)]<-tapply(d.discpol%in%c("often", "sometimes”), caseid, sum.na)
Can set different thresholds for discussiontable(tapply(d.discpol%in%c("often", "sometimes”), caseid, sum.na)

Graphic: Network Size of Impt. Matters and Political Discussion Networks
par(mfrow=c(2,2))
hist(cnes.d1$netsize, breaks=6, main="Important Matters", xlab="Network Size")
hist(cnes.d1$pnum, breaks=6, main="Talk Politics Subnetwork", xlab="Network Size")
hist(tapply(d.discpol%in%c("often", "sometimes"), caseid, sum.na), breaks=6, main="Talk Politics Sometimes Subnetwork",xlab="Network Size")
hist(tapply(d.discpol%in%c("often"), caseid, sum.na), breaks=6, main="Talk Politics Often Subnetwork", xlab="Network Size")
###also see lattice alternative

EGO NETWORK DESCRIPTION:
NETWORK COMPOSITION
The Traditional Approach

Personal Network Composition
Who does R discuss politics with? Family, friends, coworkers?
Is political discussion primarily a male activity?
How politically interested are R’s discussants?
Does R disagree about politics with discussants?

Traditional Name Interpreters
How is [name 1] connected to you? spouse or partner other relative [specify] unrelated
Is [name 1] a coworker?Is [name 1] a member of same church?Is [name 1] a neighbor?

CCAP Online SurveyPolitical Discussion Name Interpreter

Structure of the Data: Original (Wide)
Main Resp
Name 1 Name 2 … Name 5 D1.Male D2.Male …
1 John Dean … NA 1 1 …
2 Sue Pete … Aya 0 1 …
3 Kate Sara … Ewan 0 0 …

Structure of the Data: Transformed to Dyadic (Long)
Main Resp
R.Vote D.Num Name
D.Male D.Educ D.Vote …
1 Dem 1 John 1 Coll Rep …
1 Dem 2 Dean 1 HS Dem …
2 Rep 1 Sue 0 HS Rep …
2 Rep 2 Pete 1 Coll DK
2 Rep … …
2 Rep 5 Aya 0 Coll Rep
3 DK 1 Kate 0 HS Dem
3 DK 2 Sara 0 HS DK
3 DK …
3 DK 5 Ewan 1 HS Dem

Non-response: a potential issue
Respondents who name NO discussants
Omit Rs from all composition measures
Divide by netsize=0 or NA will omit R
Respondents who don’t provide one or more composition variables
Omit discussants with invalid or missing information from R’s netsize (must adjust manually for each characteristic)
table(d.given[is.na(d.relate)])

Personal Network Composition:Who does R discuss politics with? Family, friends, etc?
Number of discussants that are family memberstable(tapply(d.relate%in%c(”spouse", ”family”), caseid, sum.na))
Proportion of discussants that are family membersx<-tapply(d.relate%in%c("spouse", "family"), caseid, sum.na)/tapply(d.given==1 & (d.relate%in%c("dk","rf"))==FALSE, caseid,sum.na)
summary(x)
mean.na(x==0)
mean.na(x==1)

Personal Network Composition:Who does R discuss politics with? (continued)
Proportion of discussants that are coworkersx<-tapply(d.cowork=="yes", caseid, sum.na)/tapply(d.given==1 & (d.relate%in%c("dk","rf"))==FALSE & (d.cowork%in%c("dk","rf"))==FALSE, caseid,sum.na)
summary(x)
mean.na(x==0)
mean.na(x>.5)

Personal Network Composition:Is political discussion primarily a male activity?
Proportion of discussants that are maleprop.table(table(d.male)[1:2])
Proportion of POLITICAL discussants that are maleprop.table(table(d.male[d.discpol%in%c("often", "sometimes", "rarely")])[1:2])
prop.table(table(d.male[d.discpol%in%c("often", "sometimes”)])[1:2])
x<-tapply(d.male=="male" & d.discpol%in%c("often", "sometimes"), caseid, sum.na)/tapply(d.given==1 & (d.male%in%c("dk","rf"))==FALSE & d.discpol%in%c("often", "sometimes"), caseid, sum.na)

Personal Network Composition:Is political discussion primarily a male activity? (cont.)
summary(x)
prop.table(table(x==0))
prop.table(table(x>.5))
prop.table(table(x==1))
Frequency of political discussion with male discussantsprint(prop.table(table(d.discpol, d.male)[,1:2]), digits=2)chisq.test(table(d.discpol, d.male)[,1:2])t.test((4-unclass(d.discpol))~d.male, data=cnes.long[d.male%in%levels(d.male)[1:2],])

Personal Network Composition:How politically informed are R’s discussants? (cont.)
Distribution of expertise among all or political discussantsprint(prop.table(table(d.expert)[1:3]), digits=2)print(prop.table(table(d.discpol, d.expert)[,1:3],1), digits=2)
Do R’s prefer informed discussants?chisq.test(table(d.discpol, d.expert)[,1:3])
How many R’s have highly informed discussants?x<-tapply(d.expert=="Great deal", caseid, sum.na)/tapply(d.given==1 & (d.expert%in%c("dk", "rf"))==FALSE,caseid, sum.na)table(x==0)table(x>.5)

Pol
itica
l Net
wor
k C
ompo
sitio
n

Network composition:Do R and discussants disagree about politics?
Self-reportedDisagreement
When you discuss politics with [name], do you disagree
table(d.disagree)
print(prop.table(table(d.disagree, d.vote!=vote)[1:4,],1), digits=2)
Self-reported Vote Choice Differences
Which candidate do you think [name] supported in the presidential election this year?
table(d.vote, vote)prop.table(table(d.vote== vote))[2]
print(prop.table(table(d.disagree, d.vote!=vote)[1:4,],2), digits=2)

Misperception of Political Preferences of Discussants: Snowball Sample
Huckfeldt & Sprague (1987)Non voter
Reagan (Disc)
Mondale (Disc)
Nonvoter
.222 (9)
.790 (19)
.818 (11)
Reagan .400 (20)
.912 (170)
.662 (65)
Mondale .333 (15)
.547 (53)
.992 (90)
Merge data files tp replicatedetach(cnes.long)
temp<- merge(cnes.d3,cnes.d2, by=c(colnames(cnes.d3)), all=TRUE)
cnes.match<-merge(cnes.long, temp,by=c("caseid","discnum"), all=FALSE)
cnes.match$correct<-cnes.match$d.vote== cnes.match$act.both.vote
attach(cnes.match)
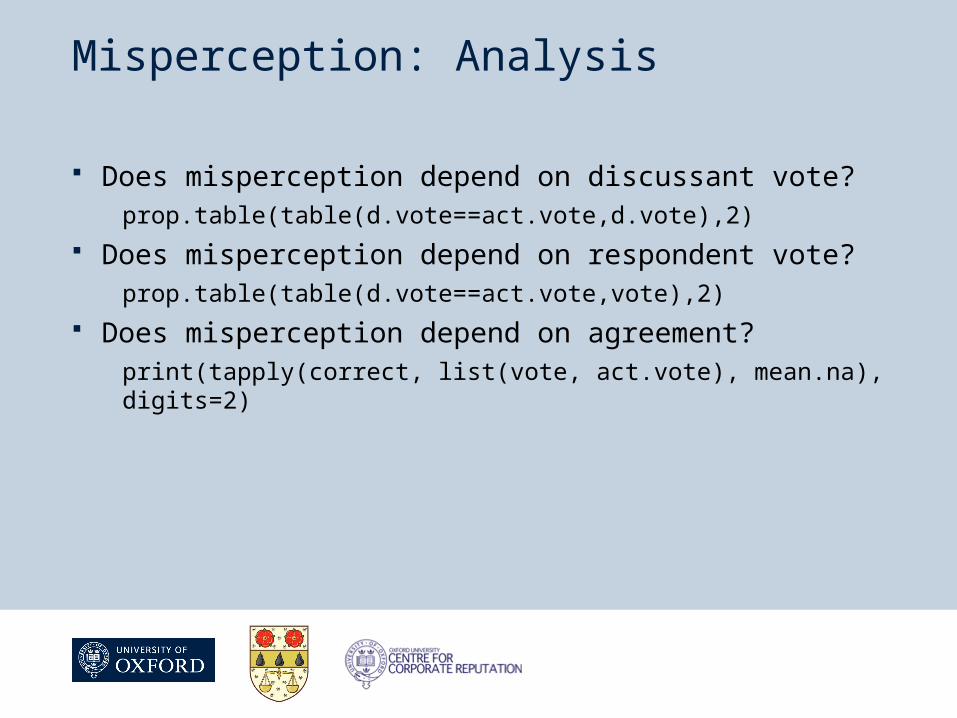
Misperception: Analysis
Does misperception depend on discussant vote?prop.table(table(d.vote==act.vote,d.vote),2)
Does misperception depend on respondent vote?prop.table(table(d.vote==act.vote,vote),2)
Does misperception depend on agreement?print(tapply(correct, list(vote, act.vote), mean.na), digits=2)

EGO NETWORK ANALYSIS: PARTICIPATION AND INFLUENCE
The Traditional Approach

Personal Network Analysis:Traditional Approaches One time wave (with snowball)
Instrument for discussant vote choice (H&S, 1991) Two or more survey waves (change)
Kenny (1994) Nested/hierarchical models
van Duijn, Busschbach and Snijders 1999 Lubbers et al 2010 de Miguel Luken and Tranmer 2010
Respondent driven sampling (snowball) Gile and Handcock (2010), Goel and Salganik (2010)
Use in UCInet/whole network software if enough ties

Changes in Personal Networks(from Feld, Suitor and
Existence of Ties Nature of ties
Dyadic Tie Which ties that come and go
Examples: Selection
How characteristics of ties change
Example: Persuasion
Personal Network
Expansion and contraction of network
Example: Stop discussing politics
Change in overall characteristics of network
Example: increase in average political disagreement

Political Participation
McClurg 2003 South bend, dyadic transformed DV: index of political participation Specification: negative binomial regression model3
Controls for socioeconomic status, politically-relevant attitudes, generalized civic engagement, and political mobilization
See Also: McClurg 2006 (“wide” data) See Also: La Due Lake and Huckfeldt, 1998

Dyadic P
articiapation:S
pouses, Fam
ily, and F
riends

“Wide” Participation model

Influence
Kenny (1994) “Microenvironment of Attitude Change” Journal of Politics
OLS on transformed dyadic data DV is directional change in pid from pre-election to post-election (-6
to 6) Includes national and local level context variables Discussion network in 3rd wave

Influence model

EGO NETWORK MEASURES: NETWORK MECHANISMS
The Traditional Approach

Network Mechanisms & Measures
Weak ties Neighbors or
Coworkers Strong ties
Contact frequency transitive ties reciprocated ties
(snowball) Centrality
Self-report
Social capital Organisational
memberships Network size
Network diversity Do you know a… % who disagree % with diff
demographics

Network Styles: Activities
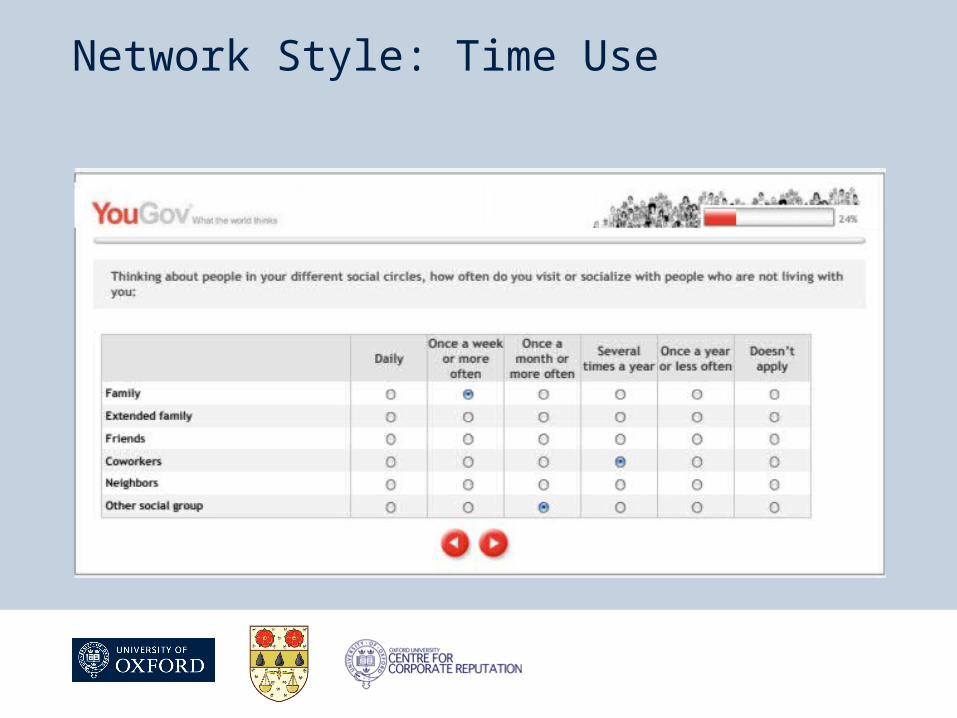
Network Style: Time Use

DRAWBACKS AND SIGNIFICANT ISSUES
The Traditional Approach

Threats to analysis and inference
Mistaken perceptions of discussant political views (minimal)
Sample issues with snowball Selection vs. influence (difficult to disentangle) Loosely defined traditional mechanisms Very narrow conception of how networks might impact
political behavior No network structure Little thought to social cleavages & social groups (old
school)

Solutions?
Longitudinal studies with shorter measures Formal modeling (mathematical and simulation)
identifies new network mechanisms New questions to tap into the mechanisms & cleavages Other test implications if we think interaction matters
(usually with formal models) Network structure measures