egm-fdes.2.6 - geospatial developments relevant to ... developments relevant to environment...
TRANSCRIPT
Geospatial developments relevant to environmentstatistics
Jean‐Louis WeberSpecial Adviser Economic Environnemental Accounting
European Environment Agencyjean‐[email protected]
Expert Group Meeting on the Revision of the Framework 29 April 2011
for the Development of Environment Statistics (FDES)
New York, 4‐6 May 2011
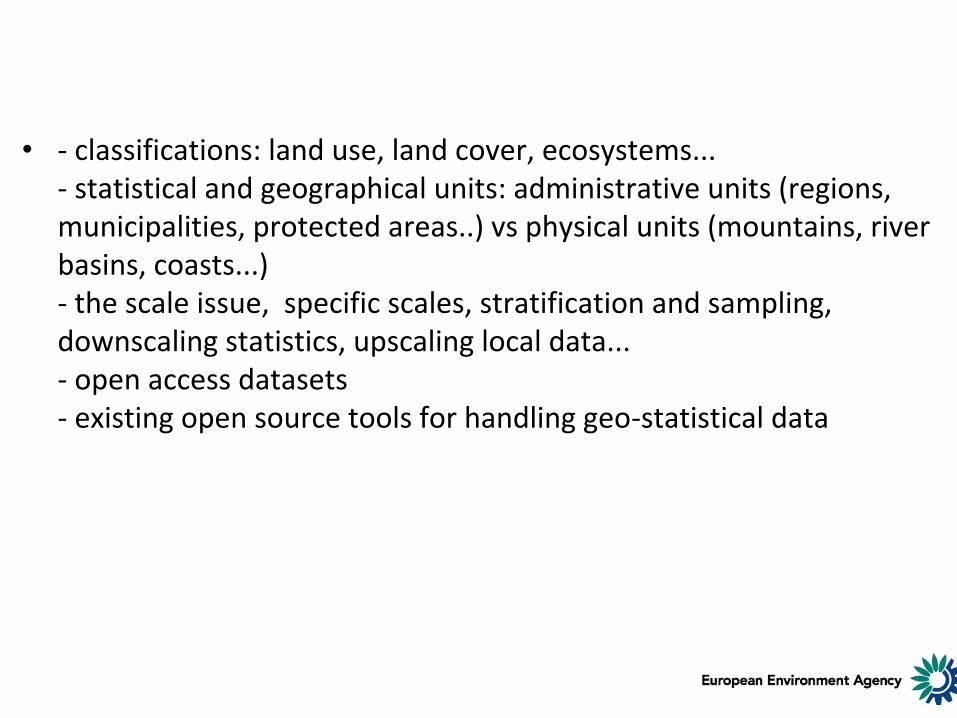
• ‐ classifications: land use, land cover, ecosystems...‐ statistical and geographical units: administrative units (regions, municipalities, protected areas..) vs physical units (mountains, river basins, coasts...)‐ the scale issue, specific scales, stratification and sampling, downscaling statistics, upscaling local data...‐ open access datasets‐ existing open source tools for handling geo‐statistical data
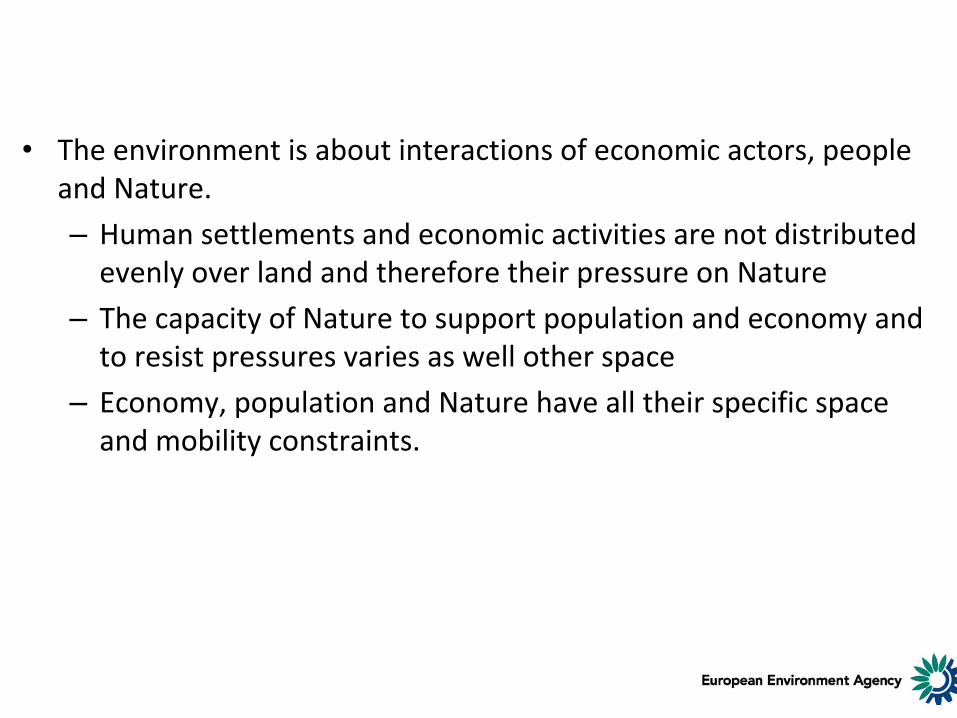
• The environment is about interactions of economic actors, peopleand Nature.
– Human settlements and economic activities are not distributed evenly over land and therefore their pressure on Nature
– The capacity of Nature to support population and economy and to resist pressures varies as well other space
– Economy, population and Nature have all their specific space and mobility constraints.
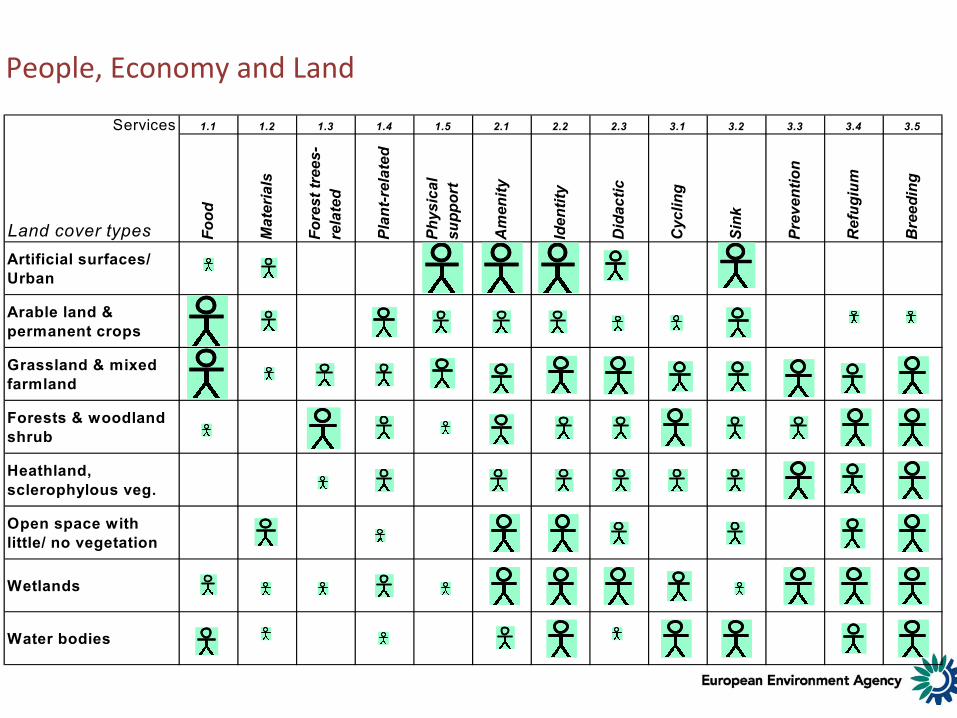
People, Economy and Land
Services 1.1 1.2 1.3 1.4 1.5 2.1 2.2 2.3 3.1 3.2 3.3 3.4 3.5
Land cover types Food
Mat
eria
ls
Fore
st tr
ees-
rela
ted
Plan
t-rel
ated
Phys
ical
su
ppor
t
Am
enity
Iden
tity
Did
actic
Cyc
ling
Sink
Prev
entio
n
Ref
ugiu
m
Bre
edin
g
Artificial surfaces/ Urban
Arable land & permanent crops
Grassland & mixed farmland
Forests & woodland shrub
Heathland, sclerophylous veg.
Open space with little/ no vegetation
Wetlands
Water bodies
Geography and statistics
• In the past (until the late 1970’s):
– Micro‐data (individual questionnaires, administrative reports or observations) were generalised according to the purpose of their collection
– …then, stored in statistical offices’ cellars for legal obligations
– …and very rarely reused
• Development of databases deep change in the collect and processing and dissemination of statistics
IT in the Brazilian 2010 Census
New Technologies in Population and Housing Censuses: Country experiences
UNSC, New York, 21 February 2011
Eduardo Pereira Nunes – President of [email protected]

2010 Census MappingBuilding of an integrated Territorial Database to support 2010 Census, from the planning to the collection and dissemination steps:
Associate the “National Address File for Statistical Purposes –CNEFE” file to the blocks and block-face urban enumeration areas;Geometrical adjustment of urban and rural limits for each Municipality
• SISMAP – Brazilian System for Census Mapping
• IT tool developed for municipal mapping in a single continuous spatial database;
• Input data from several sources of vector and imagery data, like GIS, GPS, satellite imagery, digital and aerial photography
Delineation of 314,018 Enumeration Areas (EA)
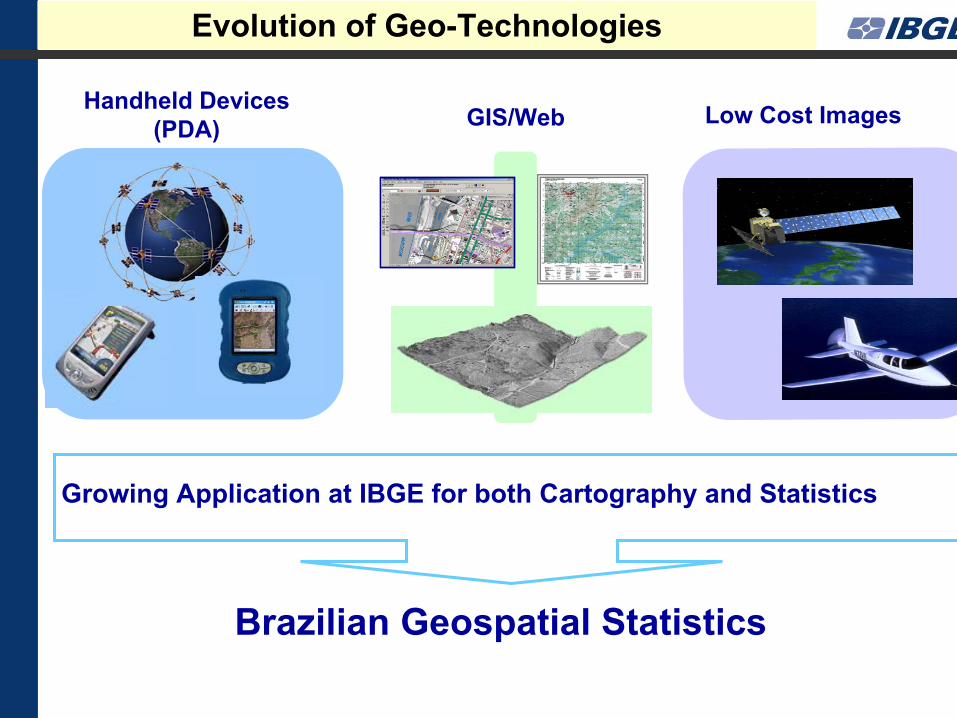
Low Cost ImagesHandheld Devices(PDA) GIS/Web
Brazilian Geospatial Statistics
Growing Application at IBGE for both Cartography and Statistics
Evolution of Geo-Technologies
Geography and statistics
• In the past, geography and statistics were fairly separated disciplines – and still today, how many geography and statistics institutes in the world? Brazil, Mexico…
– Geographical dimension of statistics = breakdown of statistical tables by pre‐existing zonings (typically: administrative regions)
– Statistical dimension of geography = maps of statistics by pre‐existing zonings (typically: administrative regions)
– Geo‐statistical analysis limited by the most detailed level of information (typically: municipalities)
Geography and statistics
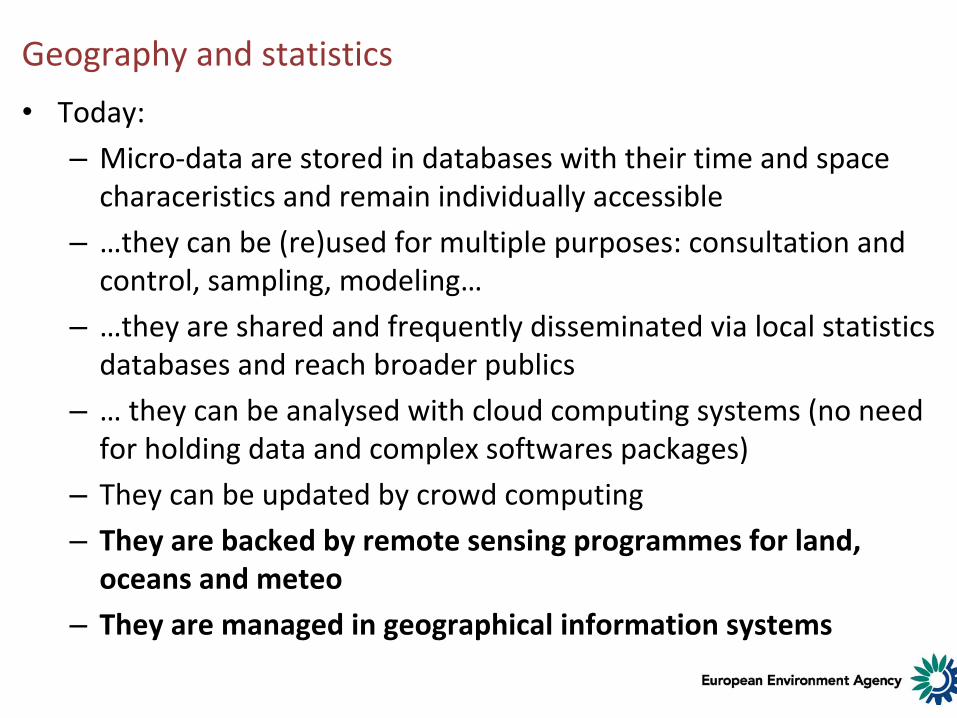
• Today:
– Micro‐data are stored in databases with their time and space characeristics and remain individually accessible
– …they can be (re)used for multiple purposes: consultation and control, sampling, modeling…
– …they are shared and frequently disseminated via local statisticsdatabases and reach broader publics
– … they can be analysed with cloud computing systems (no need for holding data and complex softwares packages)
– They can be updated by crowd computing
– They are backed by remote sensing programmes for land, oceans and meteo
– They are managed in geographical information systems
Geo data are abundant and more and more often free
• Just a few examples…
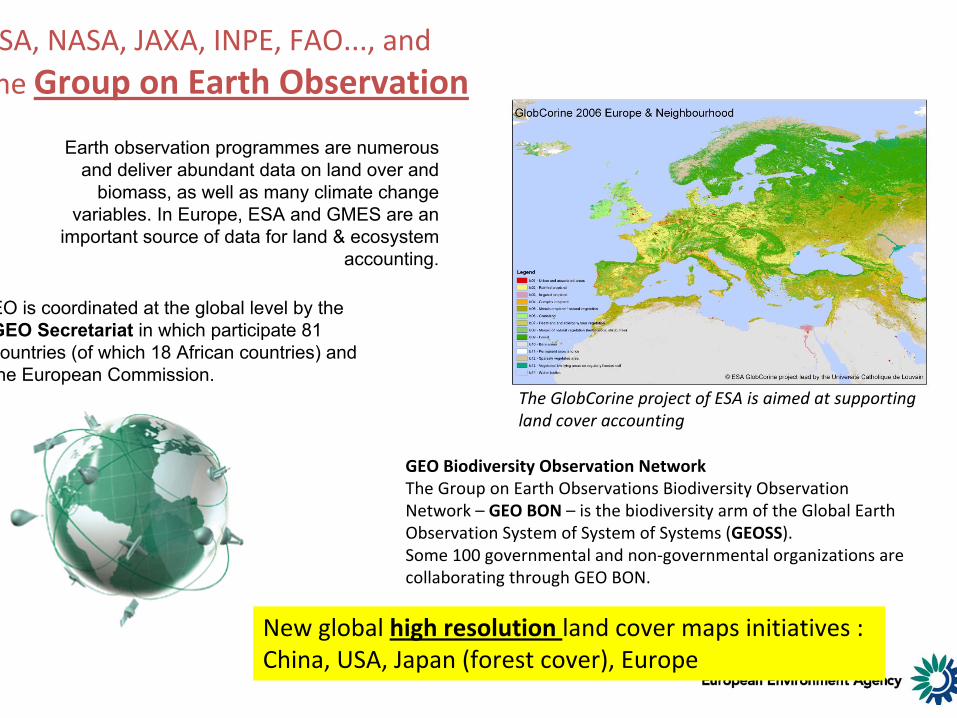
ESA, NASA, JAXA, INPE, FAO..., and the Group on Earth Observation
Earth observation programmes are numerous and deliver abundant data on land over and
biomass, as well as many climate change variables. In Europe, ESA and GMES are an
important source of data for land & ecosystem accounting.
The GlobCorine project of ESA is aimed at supporting land cover accounting
GEO Biodiversity Observation NetworkThe Group on Earth Observations Biodiversity Observation Network – GEO BON – is the biodiversity arm of the Global Earth Observation System of System of Systems (GEOSS).Some 100 governmental and non‐governmental organizations are collaborating through GEO BON.
EO is coordinated at the global level by the GEO Secretariat in which participate 81 countries (of which 18 African countries) and the European Commission.
New global high resolution land cover maps initiatives : China, USA, Japan (forest cover), Europe
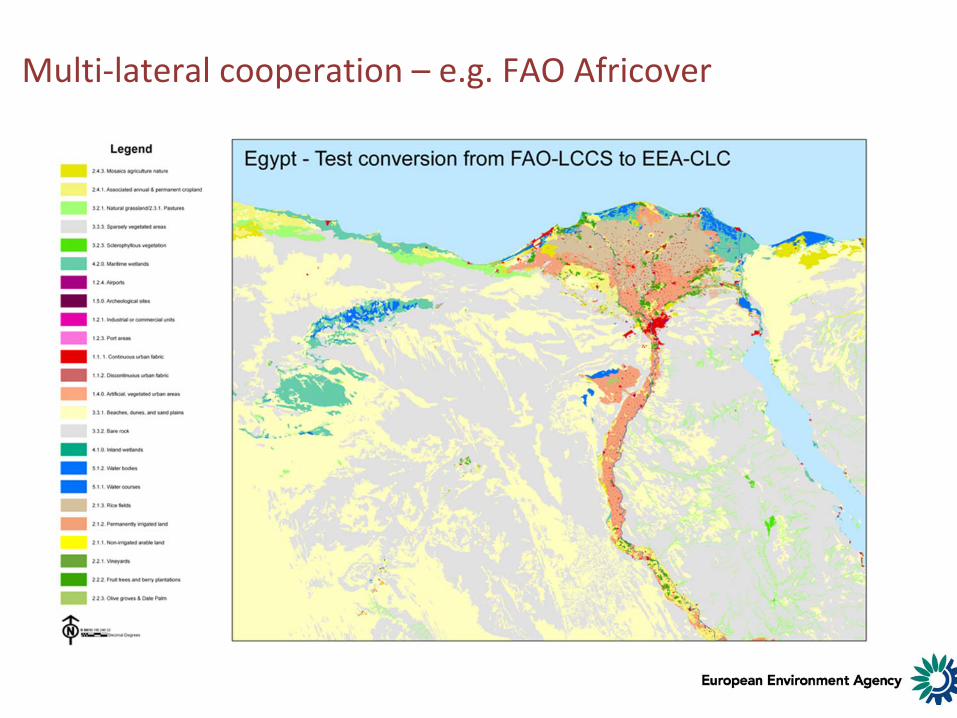
Multi‐lateral cooperation – e.g. FAO Africover
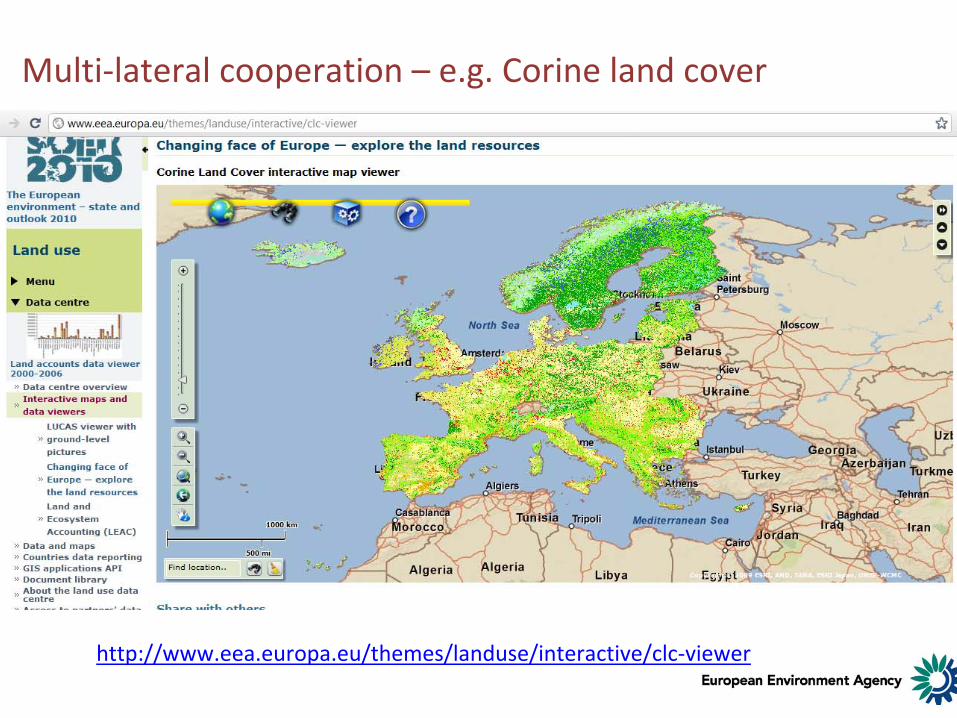
Multi‐lateral cooperation – e.g. Corine land cover
http://www.eea.europa.eu/themes/landuse/interactive/clc‐viewer
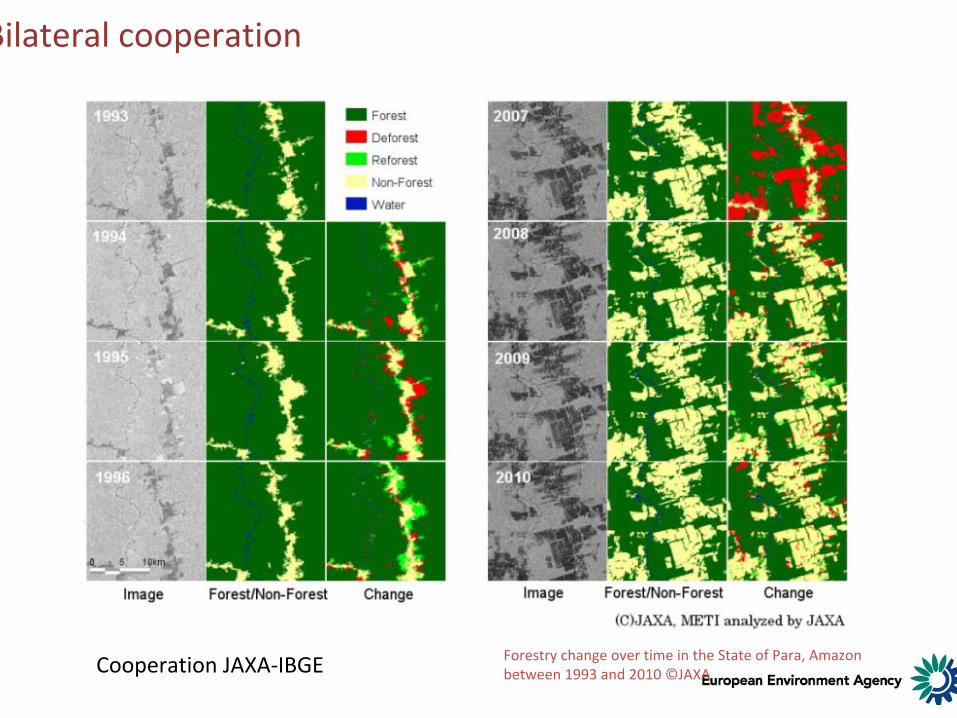
Bilateral cooperation
Forestry change over time in the State of Para, Amazon between 1993 and 2010 ©JAXACooperation JAXA‐IBGE
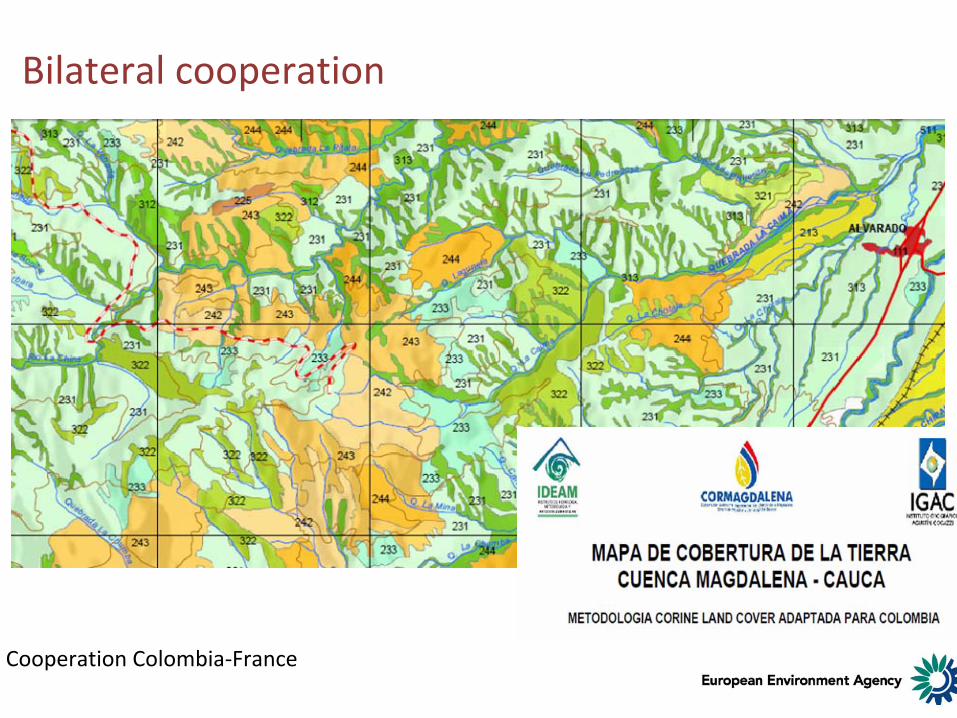
Bilateral cooperation
Cooperation Colombia‐France
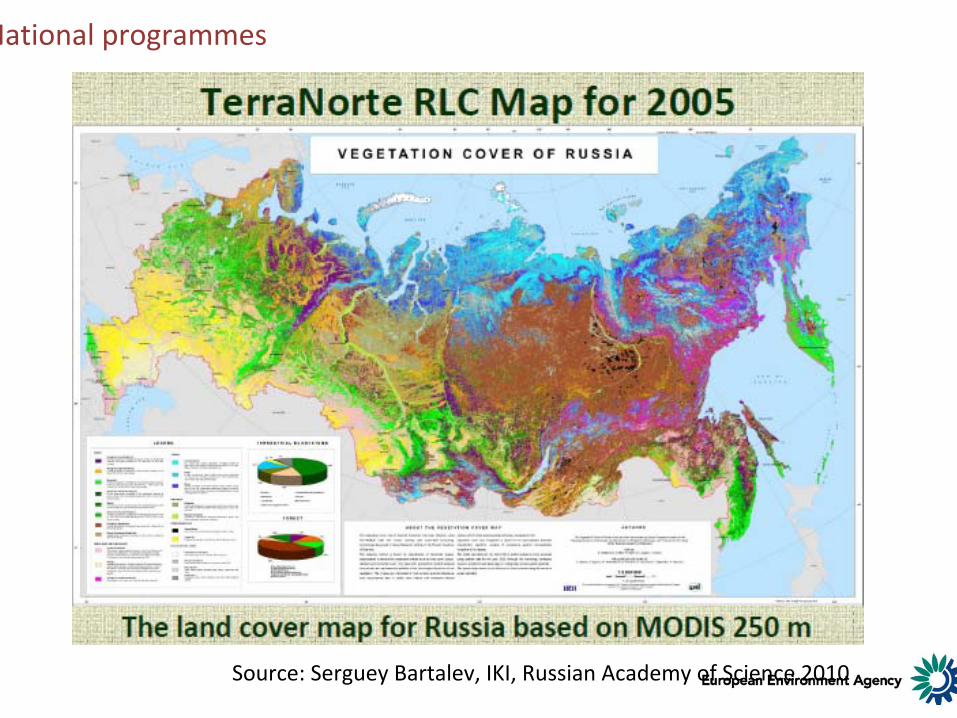
National programmes
Source: Serguey Bartalev, IKI, Russian Academy of Science 2010
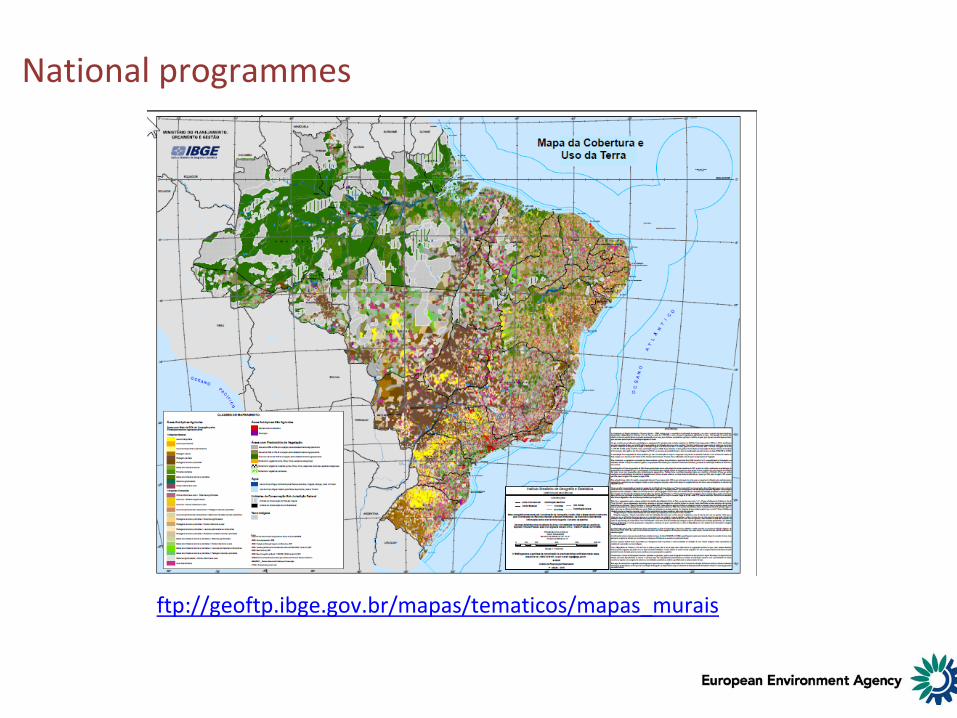
National programmes
ftp://geoftp.ibge.gov.br/mapas/tematicos/mapas_murais
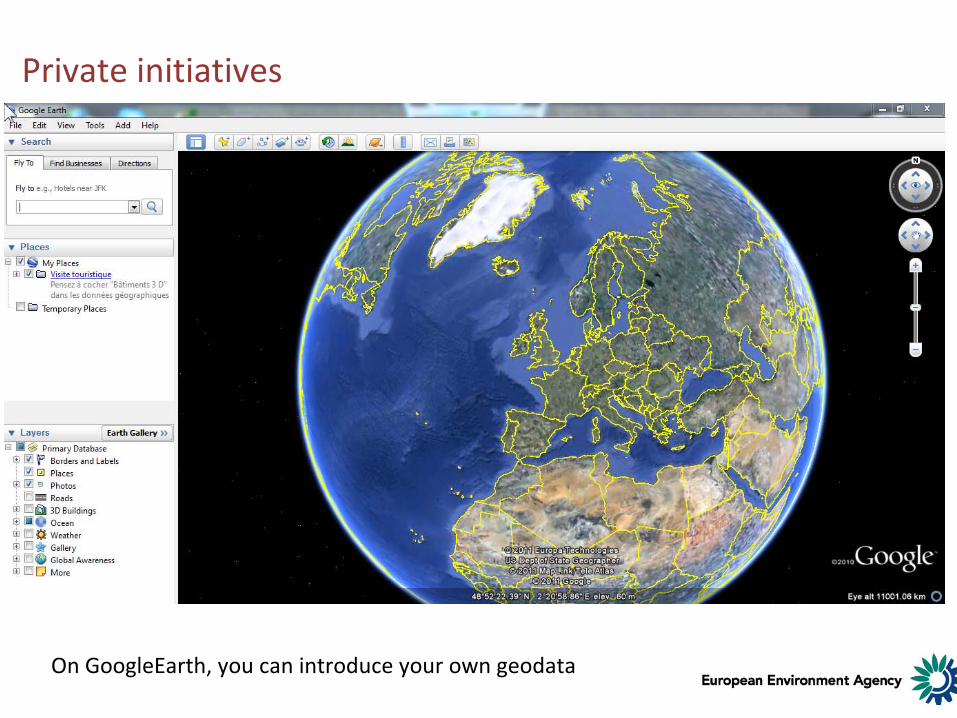
Private initiatives
On GoogleEarth, you can introduce your own geodata
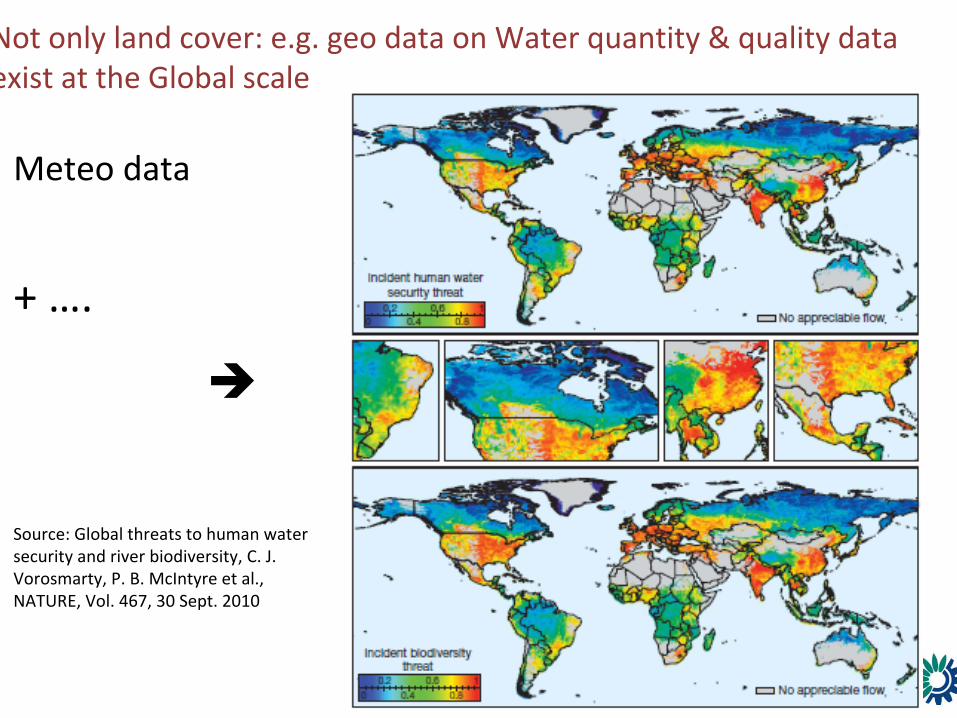
Not only land cover: e.g. geo data on Water quantity & quality data exist at the Global scale
Source: Global threats to human water security and river biodiversity, C. J. Vorosmarty, P. B. McIntyre et al., NATURE, Vol. 467, 30 Sept. 2010
Meteo data
+ ….
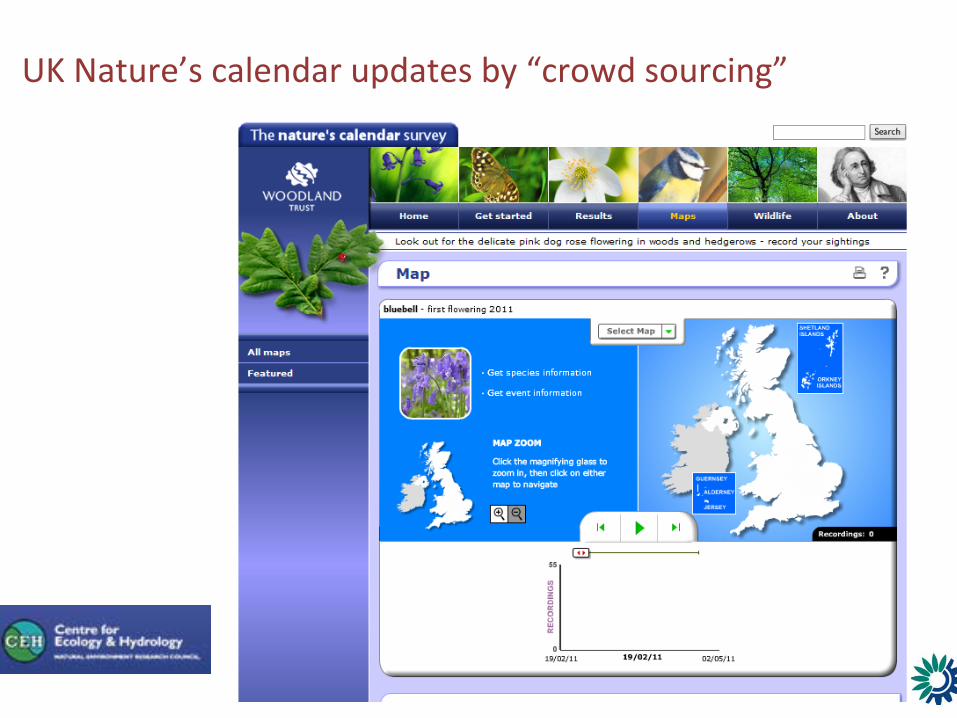
UK Nature’s calendar updates by “crowd sourcing”
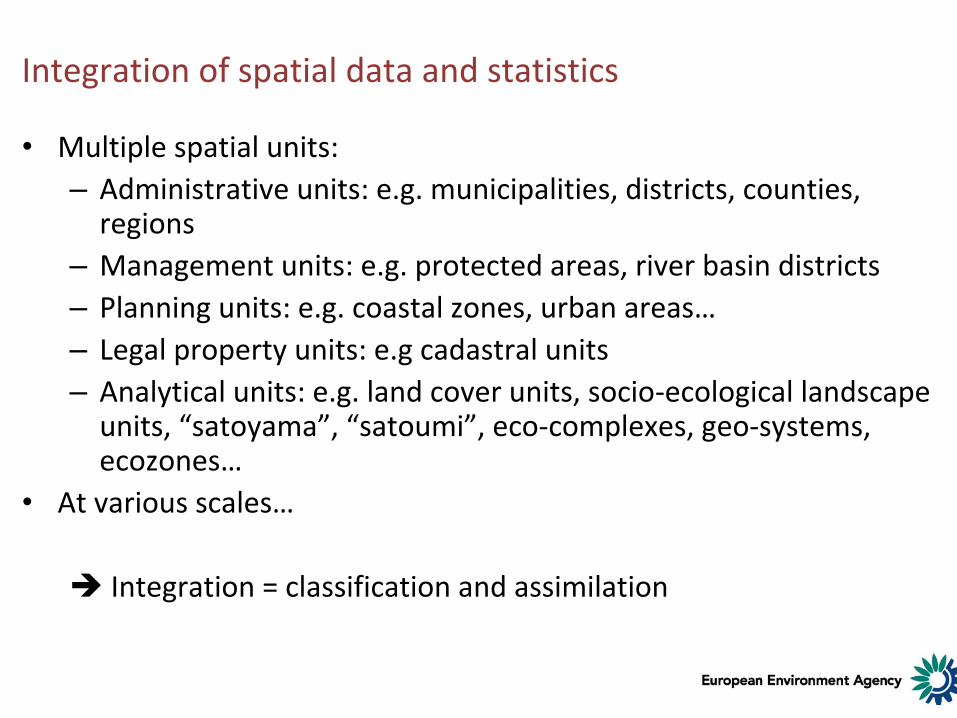
Integration of spatial data and statistics
• Multiple spatial units:– Administrative units: e.g. municipalities, districts, counties,
regions– Management units: e.g. protected areas, river basin districts– Planning units: e.g. coastal zones, urban areas…– Legal property units: e.g cadastral units– Analytical units: e.g. land cover units, socio‐ecological landscape
units, “satoyama”, “satoumi”, eco‐complexes, geo‐systems, ecozones…
• At various scales…
Integration = classification and assimilation
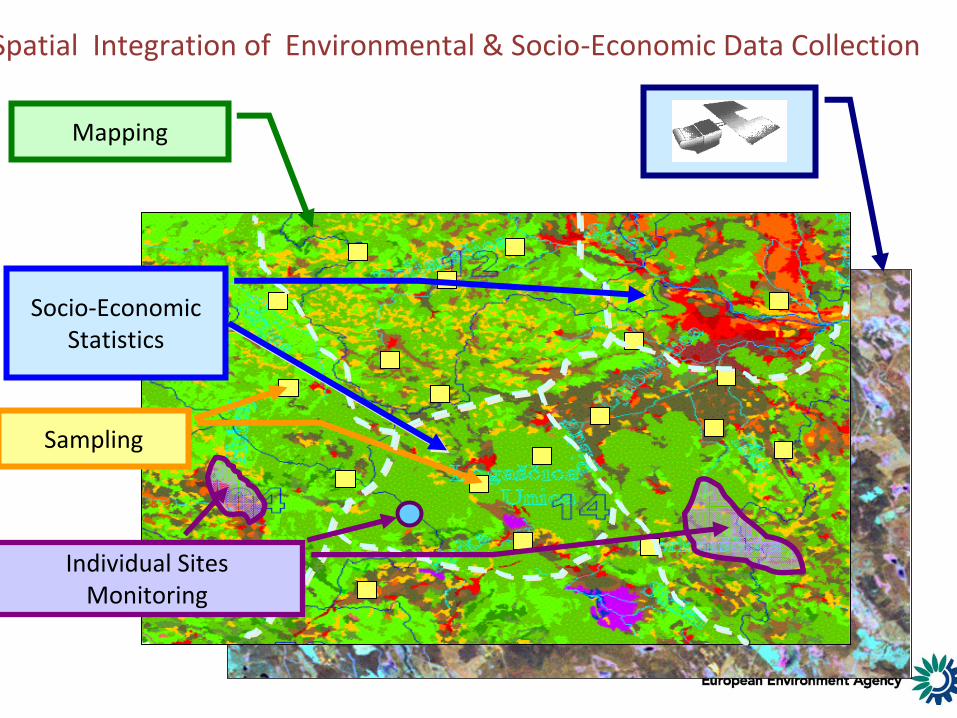
Spatial Integration of Environmental & Socio‐Economic Data Collection
Mapping
Sampling
Socio‐EconomicStatistics
Individual Sites Monitoring
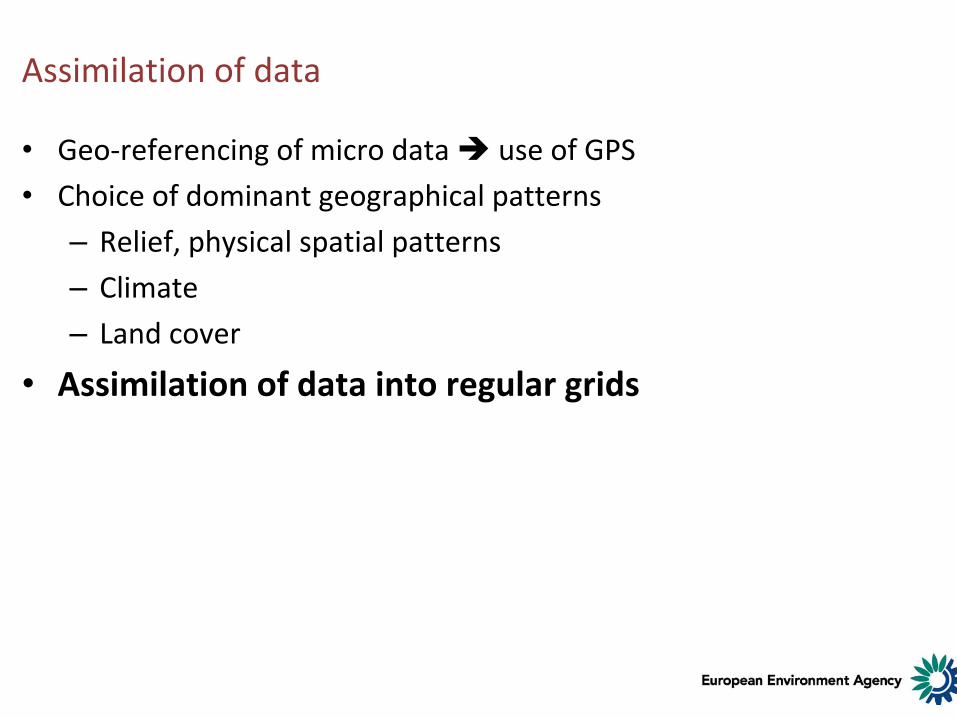
Assimilation of data
• Geo‐referencing of micro data use of GPS
• Choice of dominant geographical patterns
– Relief, physical spatial patterns
– Climate
– Land cover
• Assimilation of data into regular grids
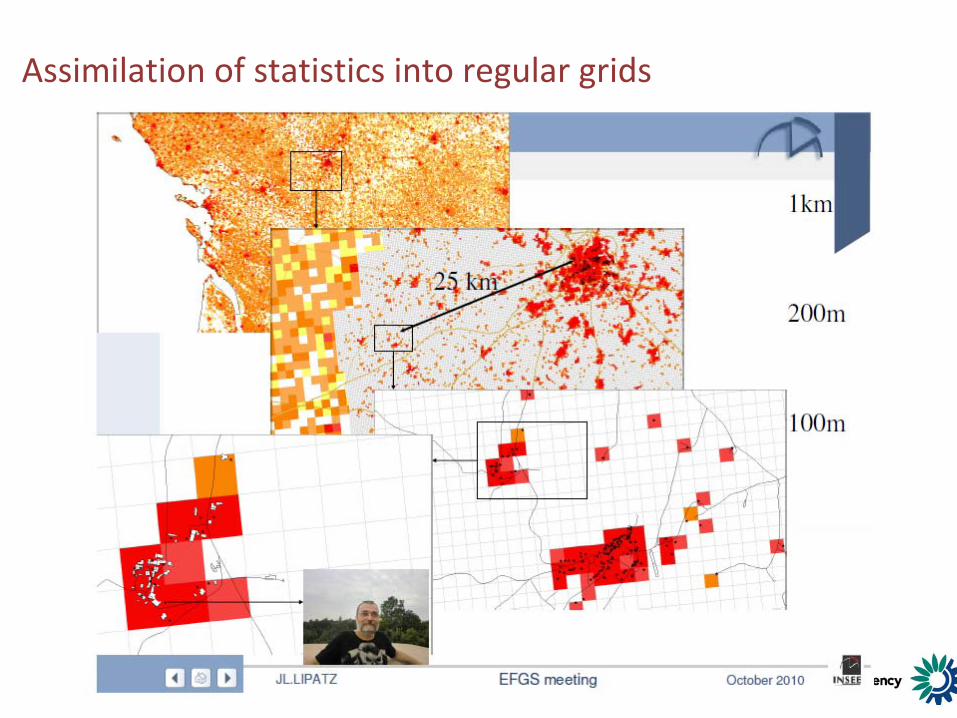
Assimilation of statistics into regular grids
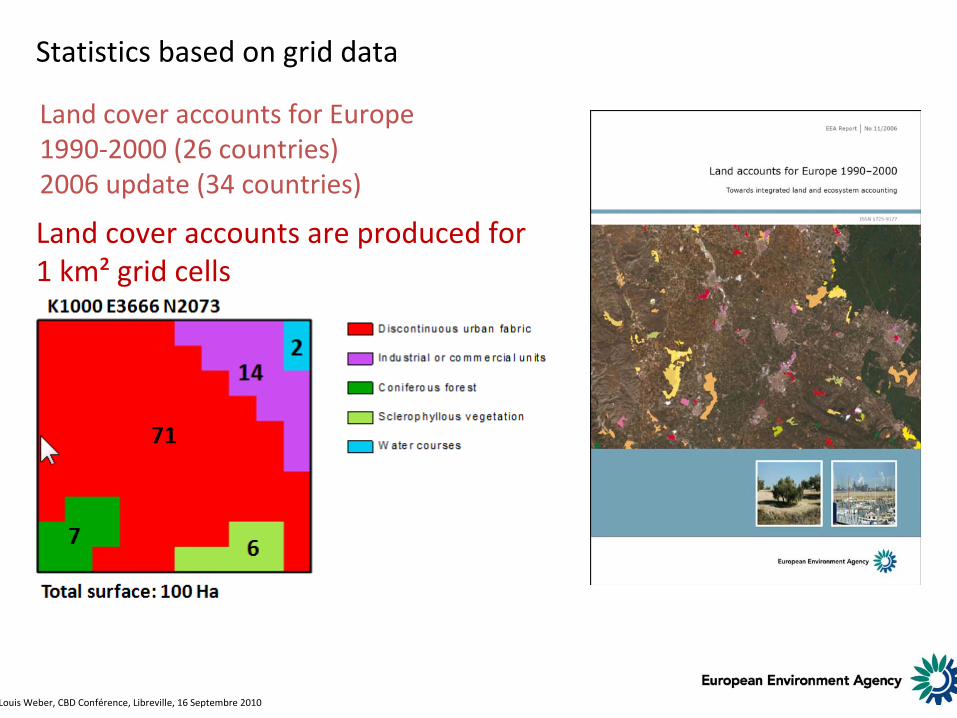
Land cover accounts for Europe1990‐2000 (26 countries)2006 update (34 countries)
Satellite image (Image 2000)CORINE Land CoverEuropean Reference Grid 1x1 KmLand cover accounts are produced for 1 km² grid cells
Jean‐Louis Weber, CBD Conférence, Libreville, 16 Septembre 2010
Statistics based on grid data
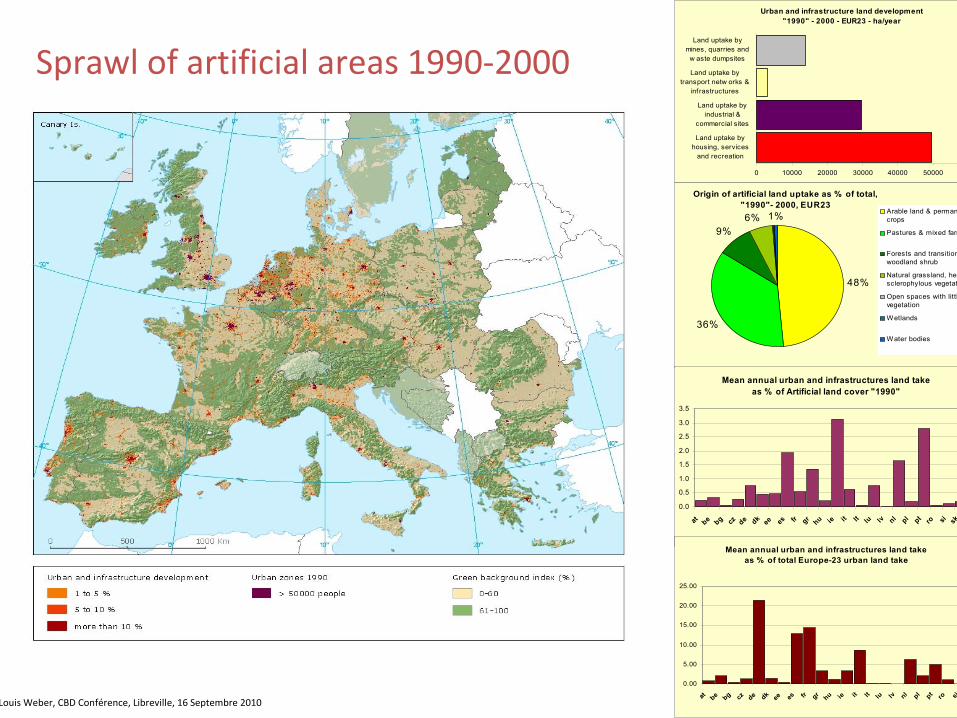
Sprawl of artificial areas 1990‐2000
Urban and infrastructure land development "1990" - 2000 - EUR23 - ha/year
0 10000 20000 30000 40000 50000 60000
Land uptake byhousing, services
and recreation
Land uptake byindustrial &
commercial sites
Land uptake bytransport netw orks &
inf rastructures
Land uptake bymines, quarries and
w aste dumpsites
Origin of artificial land uptake as % of total, "1990"- 2000, EUR23 6%
9%
36%
48%
1% Arable land & permanentcrops
Pastures & mixed farmland
Forests and transitionalwoodland shrub
Natural grassland, heathland,sclerophylous vegetation
Open spaces with little or novegetation
Wetlands
Water bodies
Mean annual urban and infrastructures land take as % of Artificial land cover "1990"
0.0
0.5
1.0
1.5
2.0
2.5
3.0
3.5
at be bg cz de dk ee es fr gr hu ie it lt lu lv nl pl pt ro si sk ukEUR23
Mean annual urban and infrastructures land take as % of total Europe-23 urban land take
0.00
5.00
10.00
15.00
20.00
25.00
at be bg cz de dk ee es fr gr hu ie it lt lu lv nl pl pt ro si sk uk
Jean‐Louis Weber, CBD Conférence, Libreville, 16 Septembre 2010
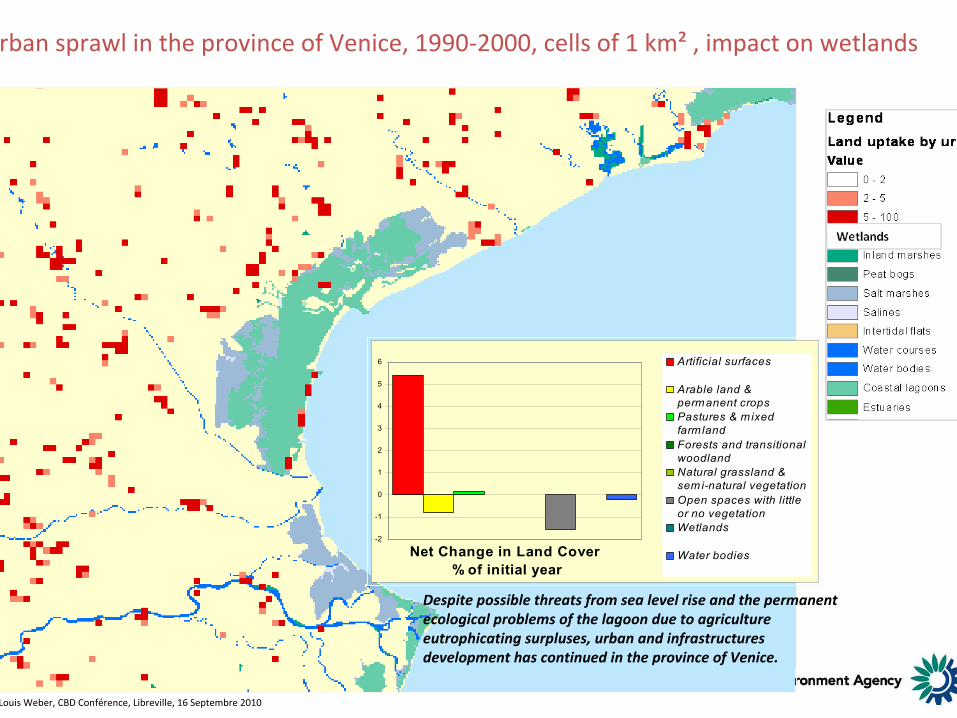
Urban sprawl in the province of Venice, 1990‐2000, cells of 1 km² , impact on wetlands
Net Change in Land Cover % of initial year
-2
-1
0
1
2
3
4
5
6 Artificial surfaces
Arable land &permanent cropsPastures & mixedfarmlandForests and transitionalwoodlandNatural grassland &semi-natural vegetationOpen spaces with littleor no vegetationWetlands
Water bodies
Despite possible threats from sea level rise and the permanent ecological problems of the lagoon due to agriculture eutrophicating surpluses, urban and infrastructures development has continued in the province of Venice.
Jean‐Louis Weber, CBD Conférence, Libreville, 16 Septembre 2010
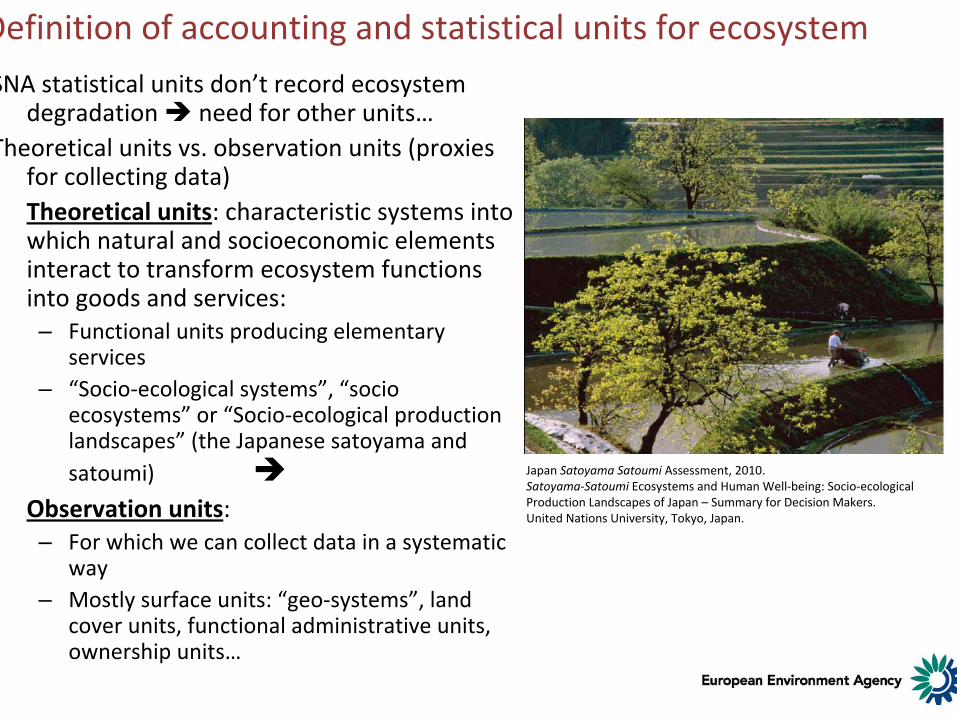
Definition of accounting and statistical units for ecosystem SNA statistical units don’t record ecosystem
degradation need for other units…Theoretical units vs. observation units (proxies
for collecting data)• Theoretical units: characteristic systems into
which natural and socioeconomic elements interact to transform ecosystem functions into goods and services: – Functional units producing elementary
services– “Socio‐ecological systems”, “socio
ecosystems” or “Socio‐ecological production landscapes” (the Japanese satoyama and satoumi)
• Observation units: – For which we can collect data in a systematic
way– Mostly surface units: “geo‐systems”, land
cover units, functional administrative units, ownership units…
Japan Satoyama Satoumi Assessment, 2010.Satoyama‐Satoumi Ecosystems and Human Well‐being: Socio‐ecological Production Landscapes of Japan – Summary for Decision Makers.United Nations University, Tokyo, Japan.
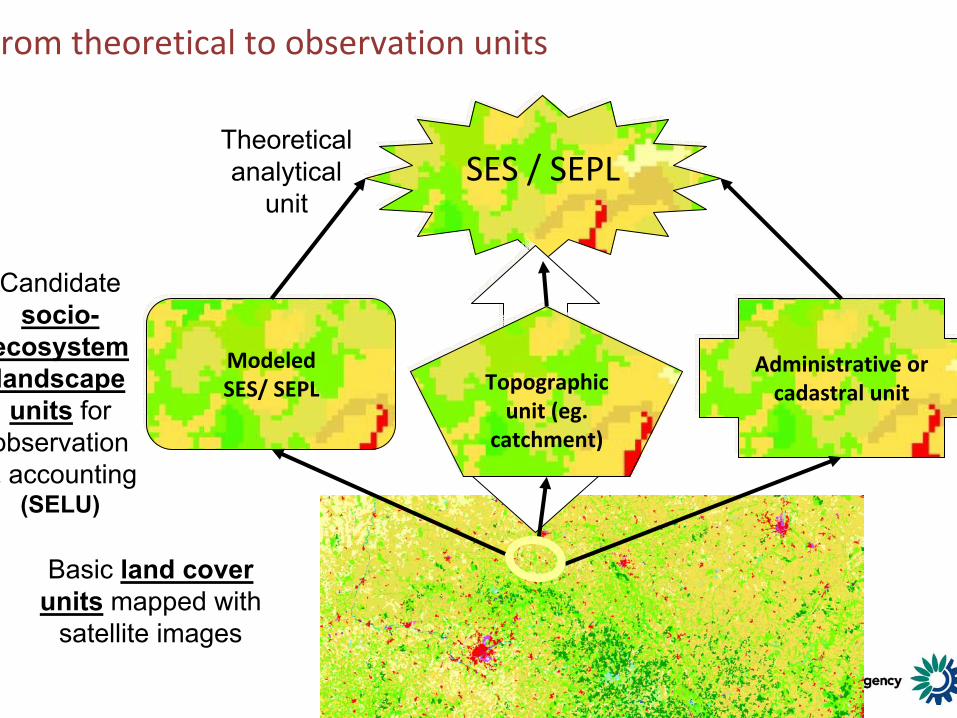
From theoretical to observation units
SES / SEPLTheoretical analytical
unit
Candidate socio-
ecosystem landscape units for
observation & accounting
(SELU)
ModeledSES/ SEPL
Administrative or cadastral unit
Basic land cover units mapped with
satellite images
?Topographic unit (eg.
catchment)
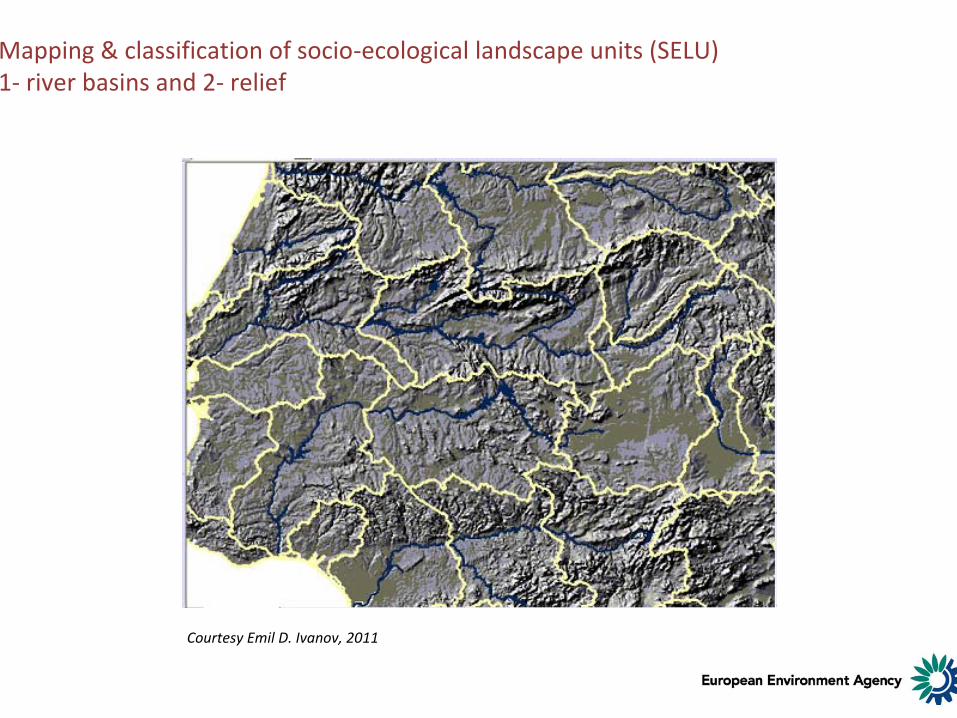
Mapping & classification of socio‐ecological landscape units (SELU)1‐ river basins and 2‐ relief
Courtesy Emil D. Ivanov, 2011
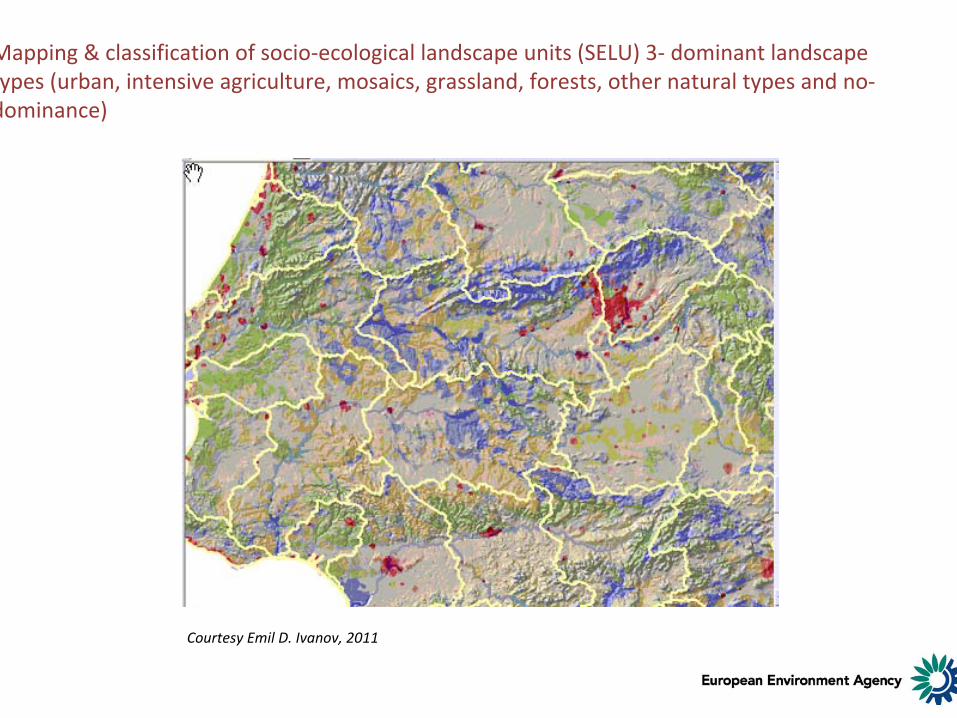
Mapping & classification of socio‐ecological landscape units (SELU) 3‐ dominant landscape types (urban, intensive agriculture, mosaics, grassland, forests, other natural types and no‐dominance)
Courtesy Emil D. Ivanov, 2011
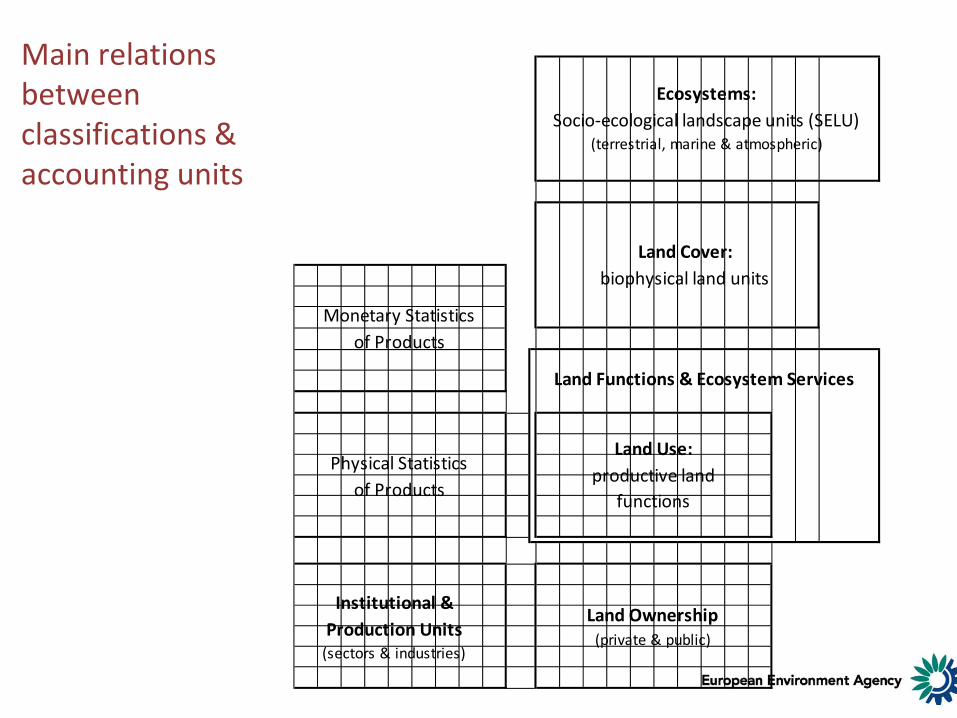
Main relations between classifications & accounting units
Monetary Statistics of Products
Physical Statistics of Products
Land Use: productive land
functions
Land Cover: biophysical land units
Ecosystems:Socio‐ecological landscape units (SELU)
(terrestrial, marine & atmospheric)
Land Functions & Ecosystem Services
Institutional & Production Units
(sectors & industries)
Land Ownership(private & public)
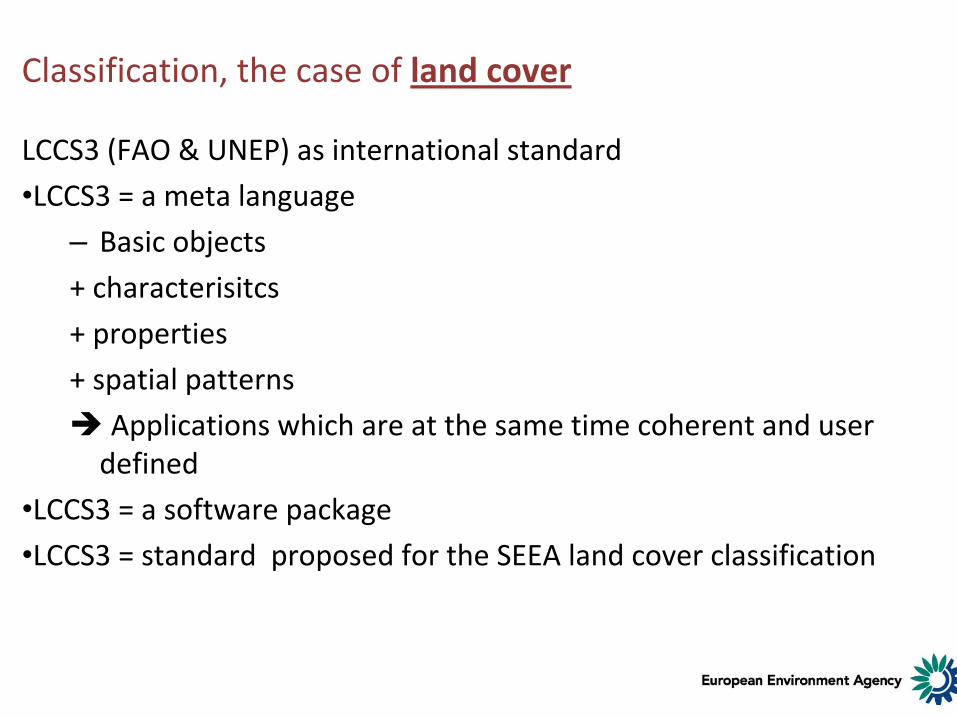
Classification, the case of land cover
LCCS3 (FAO & UNEP) as international standard
•LCCS3 = a meta language
– Basic objects
+ characterisitcs
+ properties
+ spatial patterns
Applications which are at the same time coherent and user defined
•LCCS3 = a software package
•LCCS3 = standard proposed for the SEEA land cover classification
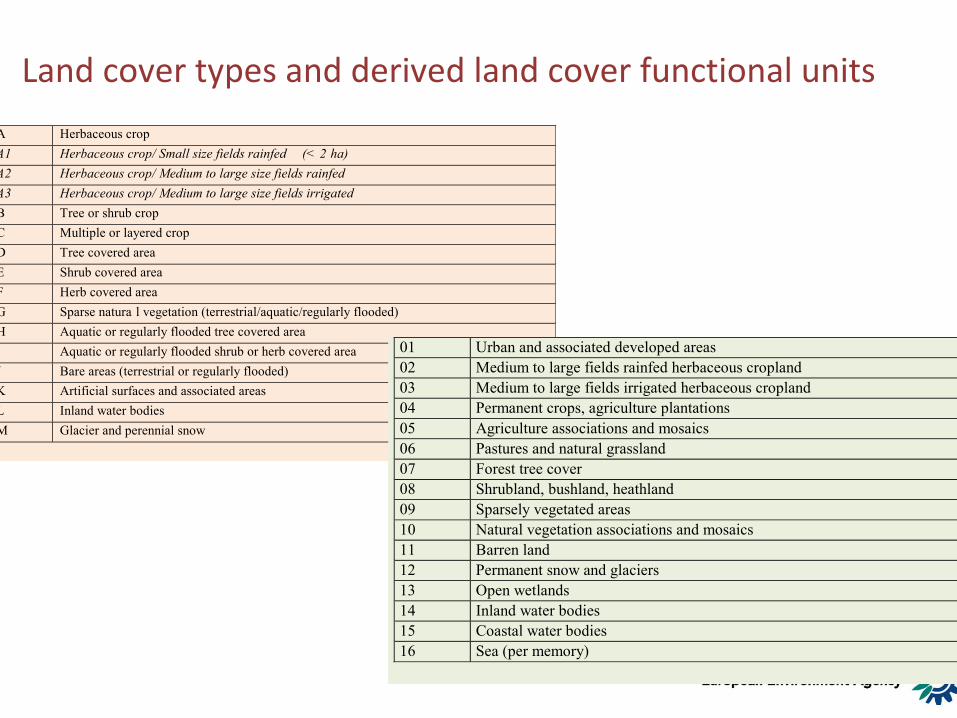
Land cover types and derived land cover functional units
A Herbaceous crop A1 Herbaceous crop/ Small size fields rainfed (< 2 ha) A2 Herbaceous crop/ Medium to large size fields rainfed A3 Herbaceous crop/ Medium to large size fields irrigated B Tree or shrub crop C Multiple or layered crop D Tree covered area E Shrub covered area F Herb covered area G Sparse natura l vegetation (terrestrial/aquatic/regularly flooded) H Aquatic or regularly flooded tree covered area I Aquatic or regularly flooded shrub or herb covered area J Bare areas (terrestrial or regularly flooded) K Artificial surfaces and associated areas L Inland water bodies M Glacier and perennial snow
01 Urban and associated developed areas 02 Medium to large fields rainfed herbaceous cropland 03 Medium to large fields irrigated herbaceous cropland 04 Permanent crops, agriculture plantations 05 Agriculture associations and mosaics 06 Pastures and natural grassland 07 Forest tree cover 08 Shrubland, bushland, heathland 09 Sparsely vegetated areas 10 Natural vegetation associations and mosaics 11 Barren land 12 Permanent snow and glaciers 13 Open wetlands 14 Inland water bodies 15 Coastal water bodies 16 Sea (per memory)
Open source tools to manage geo data and produce statistics
• Google Earth, MS Eye on Earth
• GRASS
• Quantum GIS
• SRING (INPE)
• HyperAtlas and OLAP Cube (EEA)