eg0600080 3 conference on nuclear & particle physics
TRANSCRIPT

3rd Conference on Nuclear & Particle Physics(NUPPAC 01) 20 - 24 Oct., 2001 Cairo, Egypt
Powder Neutron Diffractometers
M. Adib
Reactor Physics Dept, NRC, AEA, Cairo, Egypt.
EG0600080
Basic properties and applications of powder neutron Diffractometers are described for
optimum use of the continuous neutron beams. These instruments are equipped with position
sensitive detectors, neutron guide tubes, and both high intensity and high resolution modes of
operation are possible .The principles of both direct and Fourier reverse time-of-fiight neutron
Diffractometers are also given.
1. Introduction
1.1 Why powder neutron diffraction?
New materials are generally at first only available in polycrystalline, quasi-crystalline or
amorphous form. Here powder neutron diffraction yields complementary to powder X-ray
diffraction on atomic scale important first informations on average static properties such as crystal
structure and on magnetic ordering phenomena. Due to the special features of thermal neutron
waves (cf. table I)
Table I: Basic Neutron Properties And Resulting Applications.Neutron propertieswavelength comparable tointeratomic distances
ricctric neutrality
nuclear particle/wave
low energy
1 limited1 neutron sourceintensitymagnetic moment
Consequencesinterference effects on anatomic scale
generally weak absorption,mainly information onvolume properties
nuclear scattering isotropic,constant amplitude notdepending on scatteringangle, irregular dependenceon the atomic number,isotope dependentalmost no radiation damage
weak scattering intensities
magnetic neutron scattering,depending on scatteringangle
Applicationsinvestigation of crystal, quasicrystalline, amorphous and liquidstructuresphase analysis, average over largesample volumes, ease ofperforming investigations as afunction of external parameterssuch as temperature, pressure etc.precise determination of averagethermal motions such as isotropic,anisotropic and anharmonictemperature factors
non-destructive investigations ofinternal strains (residual stresses)or in biological experimentscompensation by sample size andby multidetectorsinvestigation of magnetic orderingphenomena in condensed matteron an atomic scale
- 8 -

this technique represents a versatile, interdisciplinary research tool in many fields of applications
such as crystallography, solid state physics, chemistry, materials science, geology and biology,
which range from basic science to technical applications. In particular the generally weak
absorption of neutrons facilitates essentially experiments as a function of external parameters
such as high or very low temperatures.
Therefore, two complementary high resolution powder neutron diffractometers will be described
2 .1 Optimum Powder Neutron Diffractometers For Continuous Neutron Sources Of
Medium Intensity .
Compared to the generally very high intensity of X-ray synchrotron radiation the present
neutron sources are rather limited in flux. Obvious ways to make efficient use of a continuous
neutron source for powder neutron diffraction are to maximise the number of detectors and to use
large vertical divergences. Presently the best such instrument is D2B[1]
The difiractometer D2B is characterized by the very high take-off angle (135°) for the monochromator. which
has a relatively large mosaic spread of 20' to compensate for the corresponding intensity (Dl/1) loss. It is 300
mm high, focusing vertically onto about 50 mm; this large incident vertical divergence is matched by 200 mm
high detectors and collimators. A complete diffraction pattern is obtained after about 100 steps of 0.025° in 20.
since the 64 detectors are spaced at 2.5° intervals. Such scans take typically 30 minutes; they are repeated to
improve statistics.
Apart from the work on superconductors.D2B is particularly well suited for the Rietveld refinement of
relatively large structures, such as zeolites with absorbed molecules. It has also proved successful for the
solution of some of the new 'quasi-crystalline' materials.
D2B was also designed for work on magnetism and high resolution of very large d-spacings using
wavelengths of Between 2.4 A and 6 A Unfortunately we do not yet have the large pyrolytic graphite
filter needed with such long wavelengths, and although 2.4 A has been used for zeolites and magnetism, there
is about 4 % 7J2 and 7J3 contamination despite the Ge[hhl] monochromator. The Schematic layout of D2B is
given in Fig. 1 and its main parameter are listed in Table 2.
- 9 -

D2Bhigh-resolution two-axis diffractometer
-
multidetector
monochromator
J$<
collimator
20
collimator beam
sample
Hll
Fig.l Schematic layout otD2B
-10-

Table.2 high-resolution two-axis diffractometer D2B
reactor hall, thermal beam Hll
monochromator28 Ge[l 15] crystals of 1x5x1 cm3
take-off-angle 135°Germanium
[hkl]557337551335331113
wavelengthsA/A1.0511.2771.464
1.594(optimumX,)2.3983.152
flux at sample =106 high resolutionA= 1.594 A =107 high intensity
samplebeam size at sample 2x5 cm2
angular range 5° < 20 < 165°6° < co < 360°
detectors643He counting tubes
background without 0.1 Hzsample
sample environmentcryostat 1.5... 300 K
cryofumace 1.5... 600 Kfurnace 200 ...1000K
cryomagnetdilution cryostat 50 ...4000mK
pressure cell 2GPa and 4GPa
-11-
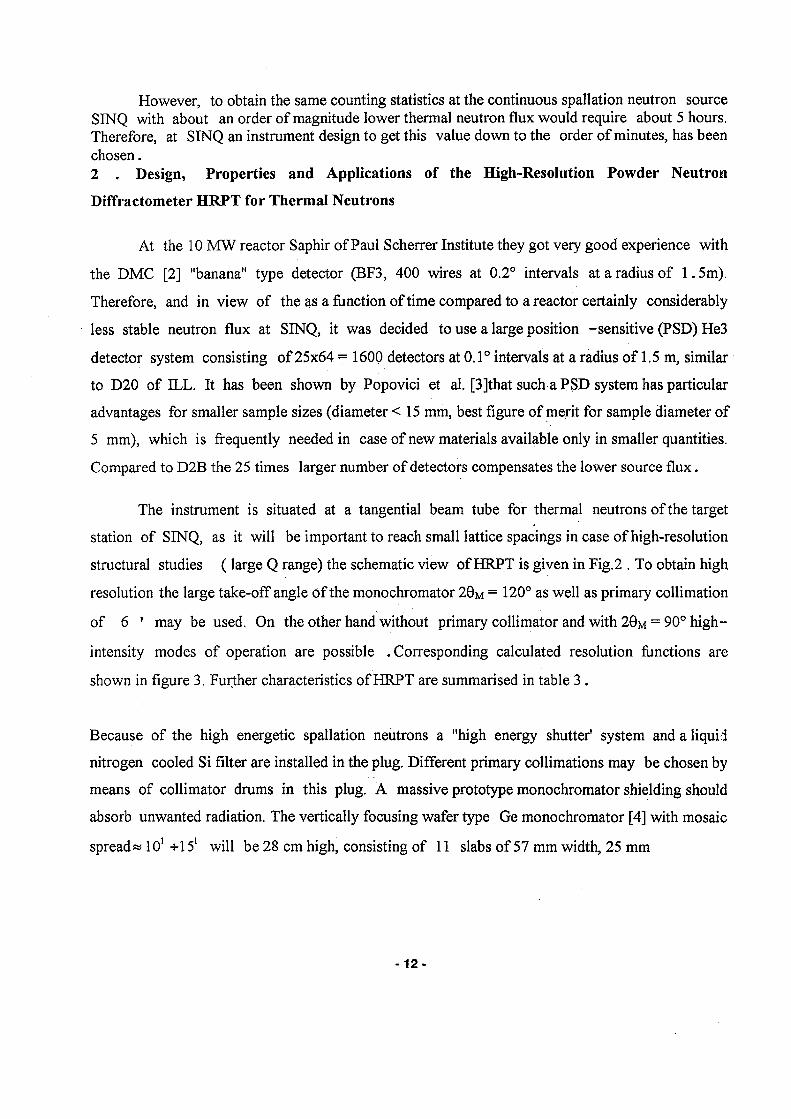
However, to obtain the same counting statistics at the continuous spallation neutron sourceSINQ with about an order of magnitude lower thermal neutron flux would require about 5 hours.Therefore, at SINQ an instrument design to get this value down to the order of minutes, has beenchosen.2 . Design, Properties and Applications of the High-Resolution Powder Neutron
DifTractometer HRPT for Thermal Neutrons
At the 10 MW reactor Saphir of Paul Scherrer Institute they got very good experience with
the DMC [2] "banana" type detector (BF3, 400 wires at 0.2° intervals at a radius of 1. 5m).
Therefore, and in view of the as a function of time compared to a reactor certainly considerably
less stable neutron flux at SINQ, it was decided to use a large position -sensitive (PSD) He3
detector system consisting of 25x64 = 1600 detectors at 0.1° intervals at a radius of 1.5 m, similar
to D20 of ELL. It has been shown by Popovici et al. [3]that such a PSD system has particular
advantages for smaller sample sizes (diameter < 15 mm, best figure of merit for sample diameter of
5 mm), which is frequently needed in case of new materials available only in smaller quantities.
Compared to D2B the 25 times larger number of detectors compensates the lower source flux.
The instrument is situated at a tangential beam tube for thermal neutrons of the target
station of SINQ, as it will be important to reach small lattice spacings in case of high-resolution
structural studies (large Q range) the schematic view of HRPT is given in Fig. 2 . To obtain high
resolution the large take-off angle of the monochromator 29M = 120° as well as primary collimation
of 6 ' may be used. On the other hand without primary collimator and with 29M = 90° high-
intensity modes of operation are possible . Corresponding calculated resolution functions are
shown in figure 3. Further characteristics of HRPT are summarised in table 3 .
Because of the high energetic spallation neutrons a "high energy shutter' system and a liquid
nitrogen cooled Si filter are installed in the plug. Different primary collimations may be chosen by
means of collimator drums in this plug. A massive prototype monochromator shielding should
absorb unwanted radiation. The vertically focusing wafer type Ge monochromator [4] with mosaic
spread* 101 -KL51 will be 28 cm high, consisting of 11 slabs of 57 mm width, 25 mm
- 1 2 -

highenergyshutter
beam. .~ reductionsIji) commuter (a t)
Si filler
monochromctorshielding
vert. foe.Ge(hJtk)'mono-chroma*tor
Fig. 2 Schematic view of the high-resolution powder diffractometer HRPT for thermal neutrons.
0.010
0.008
0.006
0.004
0.002
0.000
HRPT, calc. resolution, 20U = 120°, 1.886 A
^L.:4 V-V.•••\-Va( -L\..l\ ...
«\40\tS'(10 mm).\S40\40',9'(5 mmJ.IS1
PWIS'tS1
0 20 40 60 80 100 120 140 16029 n
Fig. 3 Calculated resolution functions of HRPT for 2 0 M = 120°.
-13-

Table 3: Characteristics of HRPT at SINQ.
SINQ target haJl, thermal neutron beamPrimary beam width: 55,44 or 29 mm (+beam closed), height 150 mm Primary collimation:Al alloy-Gd-O Soller collimators with ai =6', 12' (high resolution), ( high intensity) respectivelyLiquid N2 cooled Si filter of 20 cm length Monochromator:Ge (hick), wafer type, vertically focusingGe 100 wavelength I [A0]
(hkl) COM 2 9 M = 9 0 ° 2 e M = 1 2 0 °111 54.74 4.620 5.658311 25.24 2.413* 2.955400 0.00 2.000 2.450 *511 15.79 1.540 1.886533 40.32 1.220 1.494711 11.42 1.120 1.372733 31.22 0.978 1.197755 45.29 0.804 0.985
*PG(C) filter
a2concerning horizontal width variable slit system
26«5o-rl65°, o2e:+0.001°radial (1°) mylar-Gd-0 collimatorPSD detector:He3(3bars)+CF4(lbar)
25x64 = 1600 (150 mm high Au plated W wires of O«25u,), angular spacing 0.1 °Sample temperature: 7 mK -5- 2100 Kzero matrix pressure cell
height, 10 mm thickness and primary orientation (511). {Similar to D2B the horizontal slit system
(0:2) between monochromator and sample allows further optimisation of resolution and
background. Compared to D20[l] a unique feature of HRPT should be the large radial mylar-Gd-0
collimator suppressing Bragg peaks from the sample environment.
Applications of HRPT will be high-resolution determination and refinement of chemical
and magnetic structures including detection of structural defects such as stacking faults and internal
strains. In particular measurements as a function of external parameters such as temperature will be
possible on e. g. high-temperature superconducting materials(HTSC) and related systems,
nickelates with metal-insulator transitions, other ceramics, ionic and proton conductors, zeolites,
sodalites, metal deuterides and other hydrogen -bond systems, supramolecular and other magnetic
-14-

compounds, intercalates, fullerenes and quasi crystals etc.. A particular feature should be real-time
investigations of structural and magnetic phase transitions as well as the study of slow chemical
reactions. Moreover phase analysis of novel materials, e.g. of composite systems and in situ
investigations of hydrogen storage systems will become possible.
3.F0URIER RTOF DIFFRACTOMETERS
Structural investigations of matter can be performed effectively by thermal neutron
scattering using a time-of-flight (TOF) diffractometer which for the first time was realized by
B.Buras et al. at the steady state reactor in Warsaw in 1966 and at the IBR pulsed reactor in
Dubna in . 1964A conventional TOF diffractometer at a pulsed neutron source with a narrow
neutron pulse can provide high resolution at a reasonable neutron flux on the sample. In the case of
a steady state neutron source or a pulsed neutron source with a large (> 100 jus) neutron pulse
duration conventional TOF diffractometry is not an effective way of using the available neutron
flux. In this case a Fourier chopper can be applied to provide a more economical use of available
neutron fluxes without loss in resolution.
General ideas of neutron Fourier diffractometry were considered by J.P.Colwel. P.H.Miller
and W.L.Whittemore in 1968. This technique involves neutron beam modulation by rotating a disk
with a pattern of alternating neutron absorbing and neutron transparent slits which ensures little
loss in neutron intensity. In this case, spectrum refinement requires exact knowledge of the phase of
the chopper at the time the neutron wave passes through it. Solution of this problem in the form of
the reverse TOF method (RTOF method) was proposed by P. Hiismaki in 1972.
The basic idea of the RTOF method is to check, for each detected neutron, whether certain
postulated neutron histories have a high or low probability of occurrence on the basis of a
knowledge of the actual state of the source or of the time-dependent selectors installed on the
flight path. Because the detection ofa neutron takes place at the very end of its flight , checking
must extend from the instants of the immediate past all the way to the longest TOF expected.
Therefore, the history of the state of the source and of the neutron selectors must be made available
as contiuously updated arrays for real time classifications between the high or low probability
histories. Such arrays are conventioanlty obtained from discrete electronic correlators which are
essentially the time-shift registers provided with parallel outputs for every time channel.
-15-

The RTOF method was demonstrated at the low power steady state reactor of VTT in
Espoo , Finland in 1975. In 1984, the first Fourier RTOF diffractometer, mini SFINKS, was
constructed at the 16 MW reactor of PNPI in Gatchina, Russia, in collaboration with a group from
Finland. The experience of the Gatchina group was utilized at the 5 MW reactor of GKSS in
Geesthacht, Germany, where a specialized Fourier Strain Spectrometer (FSS) was constructed in
1988. A basic step forward was the construction of the HRFD high resolution Fourier
diffractometer at the IBR-2 high flux pulsed reactor in Dubna, Russia. It was the first
implementation of such a diffractometer at a pulsed source with a relatively long pulse. The IBR-2
reactor is the most intense pulsed source in the world with a peak flux of 1016n/cm2/s and pulse
width of 320 \x. s for thermal neutrons.
The experience of the Gatnclnina group was also utilized , at the 2MW ET-RR-1 reactor theCairo Fourier diffractometer facility (CFDF)
To illustrate the gist of the Fourier RTOF method, let us consider the spatial resolution of the TOFdiffractometer
= [{At/t)2+{A0/tg0)2}'\
where At is the neutron pulse width, and t ~ L.d.sin0,9 is the scattering angle. We have severalpossibilities for improving the resolution: R ->0 at At ->0 or L-> oo and A0 ->0 or 9 -»7t/2.
A usual TOF diffractometer can give high resolution for a fixed narrow pulse at a large distancefrom the source, as in the case of HRPD at ISIS:0->7c/2,At«12|is, L = 100 m,R =5.10"4.
The Fourier RTOF diffractometer produces a narrow pulse from an initially long pulse:
At « Cl'lm, the inverse maximum frequency of neutron beam modulation, and can give high
resolution at a minimal distance, as in the case of HRFD at IBR-2:
At ->0, At(reduced) «7|as, L=20m, R=5.10"4.
Report on the "Principles of the RTOF method and Fourier technique" is given by
P.Hiismaki (VTT, Finland)[5], report on the operating Fourier RTOF diffractometers including
"M.SFINKS diffractometer at the Gatchina reactor" by V.Trounov(PNPI, Russia)[6], "The Fourier
RTOF neutron diffractometer FSS at the 5 MW research reactor FRG-1" by H.-G.Priesmeyer[7]
(Kiel University, Germany), "Performance of the high resolution Fourier diffractometer at the
IBR-2 pulsed reactor; latest results" by A.M. Balagurov (FLNP JTNR, Russia)[8] and a report on
"Calibration of the RTOF mini SFINKS diffractometer for precision structure investigations" by
D. Chemyshov (PNPI, Russia)[9].The main parameters of CFDF is reported by
-16-

R.M.A.Moayouf[10] Table.4 summarizes the parameters of the reported diffractometers in
comparison with theconventional TOF diffractometer HRPD at ISIS.
Table.4 Parameters of high resolution TOF Diffractometers
Parameter
XesOR.104
HRPD RAL UK
0.9-83.106
20.25
m-SFINKSPNPI Russia0.9-.61.107
4.50.09.20
FSS GKSSGermany0.9-121.107
50.120
HRFD JINRRussia
1.107
20.165
is the interval of wavelength, 9 (n/cm2/s) the neutron flux at the sample position, S(cm2)the
maximal "useful" cross-section of the sample, Q, (sr) the solid angle of the detector assembly, and
R = Ad/d - the resolution of the diffractometer.
Considering the experience of operating Fourier RTOF diffractometers and the results obtained by
their users, we can conclude that today, we have a powerful and effective method for structural
investigations with steady state and, especially, with large pulsed sources. This provides an
additional argument in favour of the greater importance of higher flux rather than narrower pulse
width for effective use of neutron sources.
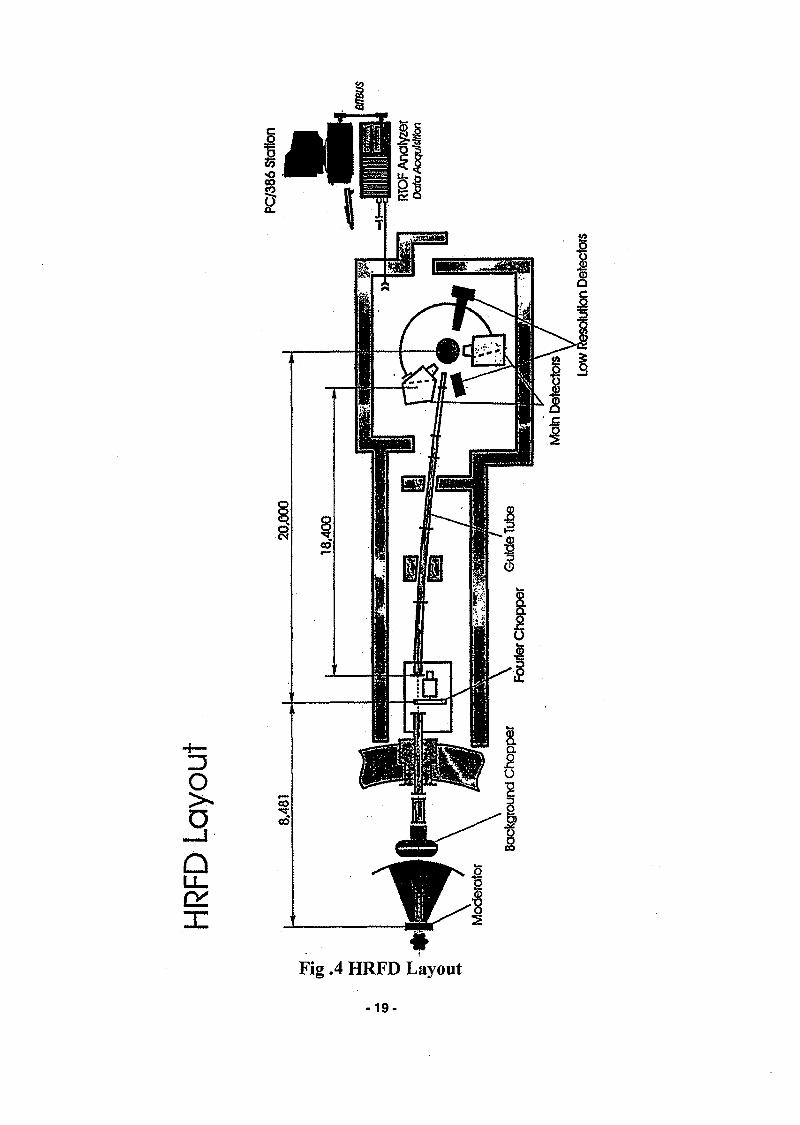
3.1 . THE EXPERIMENTAL SET-UP of HRFD
The HRFD diffractometer is installed on one of the beam-lines of the IBR-2pulsed reactor (Fig.4).
Immediately behind the reactor shielding a background chopper is placed as a filter for fast
neutrons and y-rays. The distance between the moderator and the Fourier chopper is about 9 m. The
neutron beam before the Fourier chopper is formed by a straight mirror neutron guide, and after
it, by a Focusing, horizontal and vertical, curved neutron guide 19 m in length. This guide tube
acts both as the forming element for the neutron beam and an additional filter of fast neutrons and
y-rays. Having passed through the choppers and the neutron guide, the neutron flux at the sample
position is close to 107n/cm2/s. Currently, only two of the four detectors planned for operation are
working, at the scattering angles of+152° and +90°. The RTOF electronics of the HRFD is based
on a dual-delay-line correlator [11] of special design. At present, two 8192-channel analyzers
operate simultaneously with the Fourier chopper pickup signals, in opposite phases. For a back-
scattering detector these -analyzers cover the 3.2 Ad-spacing interval, usually from 0.6 A to 3.8
A, if the channel width is equal to 4 JIS.
-17-
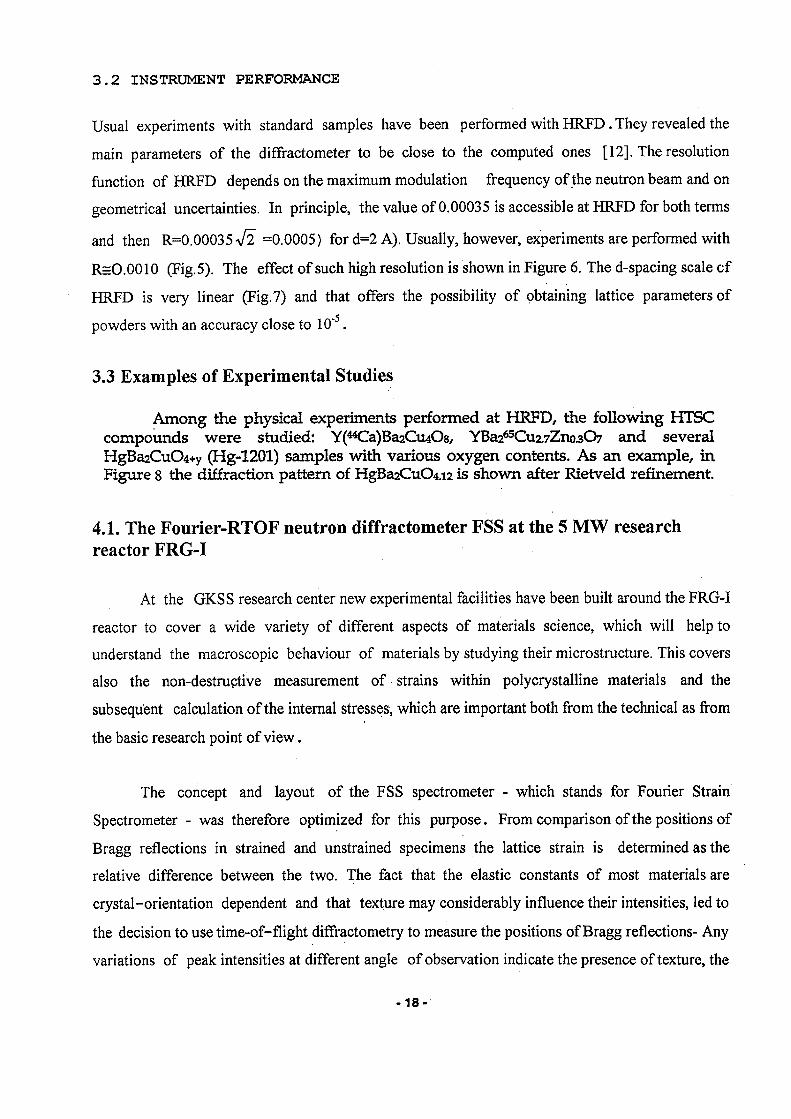
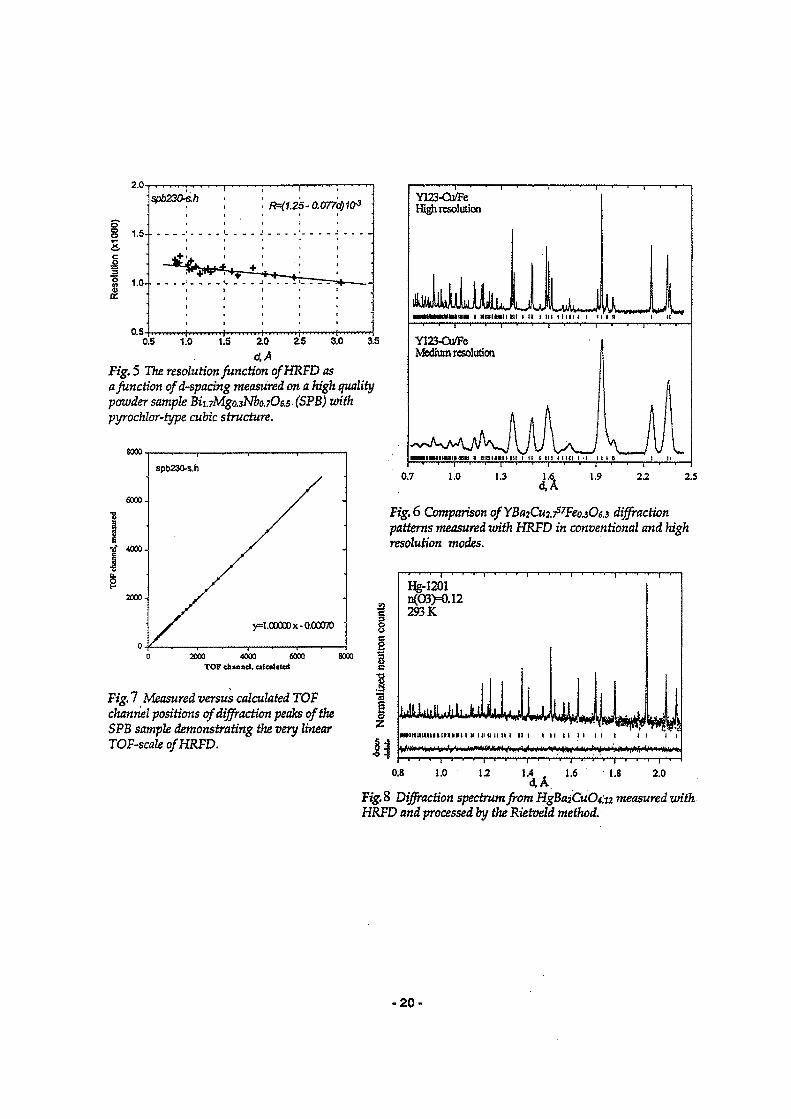
3.2 INSTRUMENT PERFORMANCE
Usual experiments with standard samples have been performed with HRFD. They revealed the
main parameters of the diffractometer to be close to the computed ones [12]. The resolution
function of HRFD depends on the maximum modulation frequency of the neutron beam and on
geometrical uncertainties. In principle, the value of 0.00035 is accessible at HRFD for both terms
and then R=0.00035 4l =0.0005) for d=2 A). Usually, however, experiments are performed with
RsO.0010 (Fig.5). The effect of such high resolution is shown in Figure 6. The d-spacing scale cf
HRFD is very linear (Fig.7) and that offers the possibility of obtaining lattice parameters of
powders with an accuracy close to 10' .
3.3 Examples of Experimental Studies
Among the physical experiments performed at HRFD, the following HTSCcompounds were studied: Y(44Ca)Ba2Cu4O8, YBa265Cuz7Zno^07 and severalHgBaaCuQi+y (Hg-1201) samples with various oxygen contents. As an example, inFigure 8 tine diffraction pattern of HgBa2CuO4.i2 is shown after Rietveld refinement.
4.1. The Fourier-RTOF neutron diffractometer FSS at the 5 MW researchreactor FRG-I
At the GKSS research center new experimental facilities have been built around the FRG-I
reactor to cover a wide variety of different aspects of materials science, which will help to
understand the macroscopic behaviour of materials by studying their microstructure. This covers
also the non-destructive measurement of strains within polycrystalline materials and the
subsequent calculation of the internal stresses, which are important both from the technical as from
the basic research point of view.
The concept and layout of the FSS spectrometer - which stands for Fourier Strain
Spectrometer - was therefore optimized for this purpose. From comparison of the positions of
Bragg reflections in strained and unstrained specimens the lattice strain is determined as the
relative difference between the two. The fact that the elastic constants of most materials are
crystal-orientation dependent and that texture may considerably influence their intensities, led to
the decision to use time-of-flight diffractometry to measure the positions of Bragg reflections- Any
variations of peak intensities at different angle of observation indicate the presence of texture, the
-18-
o>
Fig .4 HRFD Layout
-19-
I
2.0
1.5-•
1.0- •
0.5
spb230*
I I
'-+2T-~
I
FH1Z 5-0.077
_
I[0 5 1.0 1.S 2.0 ZS 3.0 3.5
d.AFig. 5 The resolution function ofHRFD asa function ofd-spating measured on a high qualitypowder sample BiuMgojNbo.70e.5 (SPB)loithpyrochlor-type cubic structure.
6000-
4000.
2000-
0 .
spb230-5.h
/
/ .
y=l.C0000x-O.00070
Y123-Cu/Fe
«1M I HBtllHIl 111 1 II t III t HI I I I tw I-18 I It
JLY123-Cu/FeMedium resolution
i m a m i t B n i n i i n i i m n i t i t B i n
0.7 1.0 1.3 1.6 1.9 22 2.5
Fig.6 Comparison ofYBazCui^FeosOe^ diffractionpatterns measured with HRFD in conventional and highresolution modes.
2000 4000 6000TOF china«lt
8000
Fig. 7 Measured versus calculated TOFchannel positions of diffraction peaks of theSPB sample demonstrating the very linearTOF-scale ofHRFD.
•a
Hg-1201n(O3MU2293K
•amtuiiiiiiuiiiii t u in u II II i HI i n n II II i I I I I
0.8 1.0 \2 1.4 . 1.6 1.8 2.0
Fig. 8 Diffraction spectrum from KgBaiCuOt.t2 measured withHKFD and processed by the Rietoeld method.
- 2 0 -
knowledge of which is important in order to calculate stress factors, using the orientation
distribution function. Stress factors replace elastic constants when stresses are calculated from
strains for textured samples.
Since the duty cycle of a high-resolution chopper is too low to allow to perform time-of-
flight spectroscopy at a steady state reactor source economically, only a correlation spectrometer
can be used. In this case the two competing properties ,,neutron intensity" and resolution" are
decoupled: the resolution in a time-of-flight Fourier spectrometer is determined by the three
components: angular resolution (divergent neutron beams), flight path resolution (sample sizes and
aperture outlines) and time resolution (e.g. the maximum frequency of beam modulation and time
channel width in this case).
If this latter component is further decreased by using a higher modulation frequency, this
will not affect the intensity of the neutron beam. There is another advantage of a Fourier
spectrometer which becomes important, when the widths of Bragg reflections have to be
measured. Peakbroadenings in general can be caused by size effects or microstrain effects. If they
need to be analysed, the shape of the resolution function must be accurately known. Using the
calculations of V.Kudryashev, we can choose adequate rotor rotational frequency programs to
make the resolution function Gaussian, or the first or second derivative of it, so that any deviation
from these shapes leads to information about the physical phenomenon which caused the
broadening.
4.2 Technical details of the FSS design
The main features of the spectrometer have been described in [7]. The instrument is operating in a
stable and reliable manner over the periods of time necessary at a low power neutron source to
arrive at the statistics requested .According to the materials investigated, standard rotor speed
programs, delay times and channel widths have emerged from the growing experimental
experience, so that a standardized data evaluation can be performed on a PC. The sample positioner
control system is connected to the control of the experiment, so that scan measurements (like
through-thickness scans or measurements across the foil geometrical extension of a sample) can be
performed automatically.
-21-

Figure 9 is a schematic of the RTOF diffractometer at this time, while there is hope to be able to
install an second detector opposite to the existing one, in order to do simultaneous measurements
in the directions of two mutually orthogonal scattering vectors. This will reduce the measuring
times for tensor determinations by more than a factor of two.
The detector bank is equipped with 16 ^i-glass sintillator/photomultiplier units(5 "
diameter), aligned according to the optimization calculations described in [12] Figure 10 shows,
how the defectors were lined up with a certain tilt from the ideal time-focussing curve to achieve a
larger area coverage of deectors. So a typical run in our case for a 4x4x25mm3 scattering volume
can be done in about 3 hours for steel.
The nominal spectrometer resolution is determined three component: the angular and the
fight path uncertainties-combined as the geometric component and the time component.
-22

reactor
neutron guide NL-4/ 20310
I_177.
sample
motorpick-up
Fourier4chopper\
ft*
PersonalComputer
detector
Fig. 9 Schematic outline of the FSS setup (dimensions given in mm)
detector
Fourier-chopper
neutron beam
•
sample position
\ J
bo<90°>
Ao
Y
O
Fig 2 Q The detector positions are optimized for maximum neutron capture probability at minimum deviationfrom the time-focussing curve
- 2 3 -

REFERENCES1) K.Ibel, Guide to Neution Research Facilities at the ELL, Grenolele, France A
psil (1994)2) J. Schefer , P.fischer , H. Heer, A - 1 Sacson, M.koch, and R.thut, Nil Instr.
&meth A 288(1990)4773) M. Popovici, W.B. Yelon ,R.Berliner, A.D.stoics I.Ioniter and R. law, Nucl.
Instr & Meth A 338 (1994)994) J. schefer M. Medusde, S. Fischer, R. thut, M. koil P. Fischer.,U.staub ,
M.horisherge, G. bottger, and A Do n ni, Nucl. Instr & Meth. A 372 (1996)5) P.Hi ismaki, proceedings of the meetinge ICANS-X111 & Ess-PM4, PSI ocl
-11-14, (1995) P.228.6) V.A Trounov Proceedings of the Meetings ICANS-XIII & ESS - PM4PSI
OCT. 11-14(1995)P. 2477) J. Schroder, V.A . Kudryashev ,H.G. Priesmeyer, J. Larsen,, A- titta, J.
neution research 2,129(1994)8) V.L.Aksenov, A.M Balagurov, V.A Trounov and P.Hi ismaki, proceeding of
the meetings ICANS-XIII & ESS - PM4, PSI, OCT. 11-14(1995)P.2359) D.Y. chernyshov proceeding PSI, OCT. 11-14(1995)P.26110) R.M.A- maayouf, the basic RTOF Fourier diffractometer at the ET-KR-1
and its multi- purpose extension, VTT Reuition notes (1099), Espoo (1995).11) P.Hiismaki, H poyry &A. Tiitter, J. Appl. Cryst, 21(1988)34912) A.M. Batenko et at. JTNR communi (ations, pi0-94-87, du bna (1994)13) V.A KudryasKev, et. Al nucl. instr & meth bl01(1994)355
- 2 4 -