effort and schedule estimation copyright, 2006 © l. ouyang liubo ouyang [email protected]...
TRANSCRIPT

Effort and Schedule EstimationEffort and Schedule Estimation
Copyright, 2006 © L. Ouyang
Liubo OuyangLiubo Ouyang
[email protected]@126.com
http://ss.hnu.cn/oylb/psp/http://ss.hnu.cn/oylb/psp/
Personal Software Process Personal Software Process
Lecture 7Lecture 7

L.Ouyang, PSP, Lecture 7
IntroductionIntroduction
Time & defect recordingTime & defect recording
Coding strd+Size measuremnt+PIPCoding strd+Size measuremnt+PIP
Size estimating + Test reportSize estimating + Test report
Task & schedule planningTask & schedule planning
Code & design reviewsCode & design reviews Design templates Design templates
Cyclic dev.Cyclic dev.
BaselineBaseline
PlanningPlanning
QualityQuality
CyclicCyclic
L.Ouyang, PSP, Lecture 7
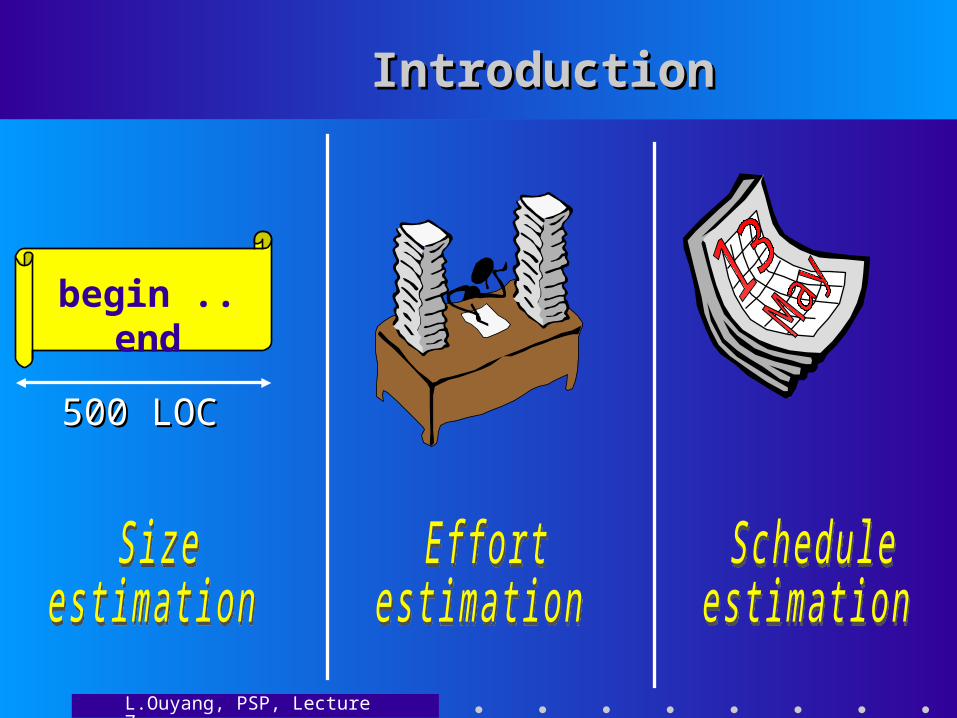
IntroductionIntroduction
begin .. end
500 LOC500 LOC
L.Ouyang, PSP, Lecture 7
Plan of the lecturePlan of the lecture
• IntroductionIntroduction
• From the previous lectureFrom the previous lecture• Effort estimationEffort estimation• Multiple estimatesMultiple estimates• Schedule estimatingSchedule estimating• Progress trackingProgress tracking
L.Ouyang, PSP, Lecture 7
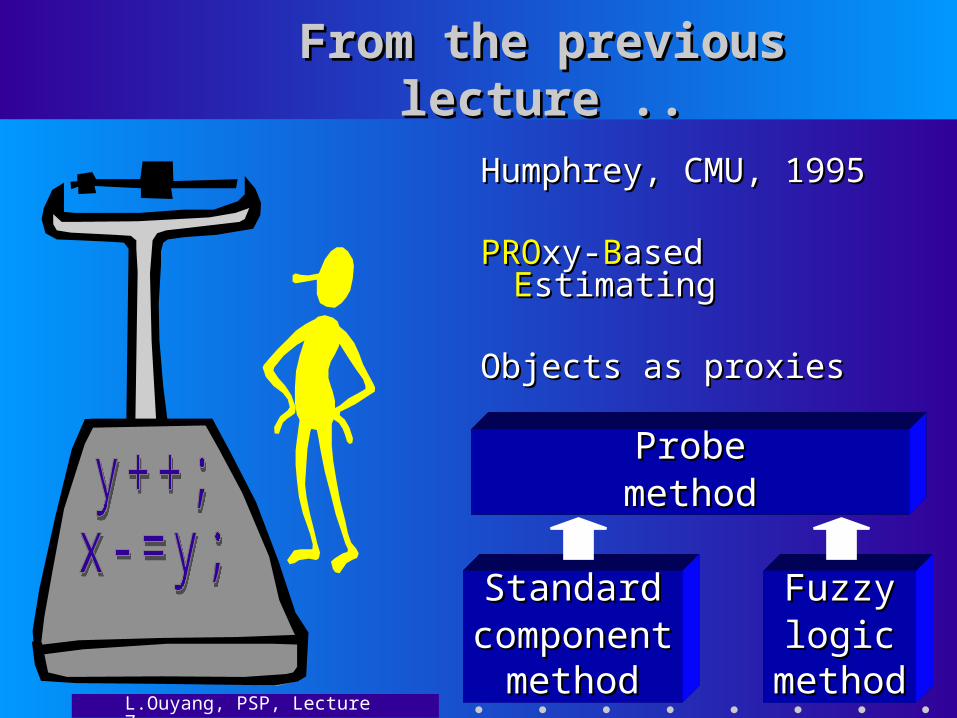
From the previous lecture ..From the previous lecture ..
Humphrey, CMU, 1995Humphrey, CMU, 1995
PROPROxy-xy-BBased ased EEstimatingstimating
Objects as proxies Objects as proxies
StandardStandardcomponentcomponent
methodmethod
FuzzyFuzzylogiclogic
methodmethod
ProbeProbemethodmethod

L.Ouyang, PSP, Lecture 7
From the previous lecture ..From the previous lecture ..
4. Knowing:4. Knowing:• programming languageprogramming language• object typeobject type• size rangessize ranges• the number of methodsthe number of methods
estimate, using historical estimate, using historical data, size of each object.data, size of each object.

L.Ouyang, PSP, Lecture 7
From the previous lecture ..From the previous lecture ..
6. Apply linear 6. Apply linear regression to get regression to get estimated program estimated program size Y:size Y:
Y = Y = 11 X + X + 00
5 means 105 means 10

L.Ouyang, PSP, Lecture 7
From the previous lecture ..From the previous lecture ..
7. Using the 7. Using the t distributiont distribution and and standard standard deviationdeviation compute the compute the prediction intervalprediction interval for for a given percentage. a given percentage.
For 100% theFor 100% the
interval isinterval is
[0; + [0; + ]]
L.Ouyang, PSP, Lecture 7
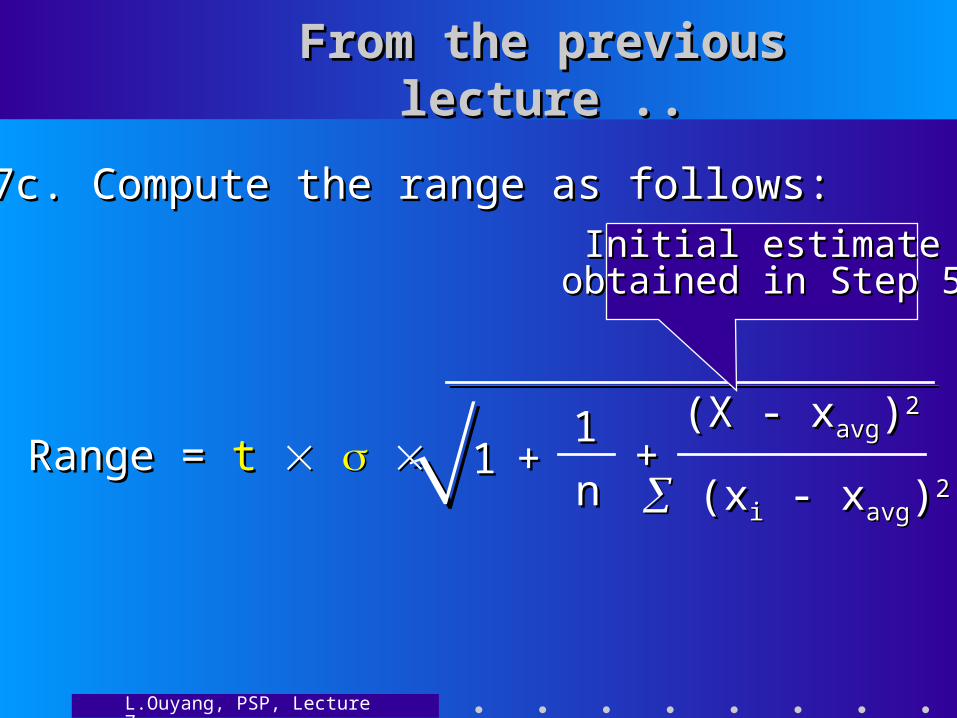
From the previous lecture ..From the previous lecture ..
(X - x(X - xavgavg))22
(x(xii - x - xavgavg))22++
11
nn++11 Range = Range = tt
7c. Compute the range as follows:7c. Compute the range as follows:
Initial estimateInitial estimateobtained in Step 5obtained in Step 5
L.Ouyang, PSP, Lecture 7
Plan of the lecturePlan of the lecture
• IntroductionIntroduction• From the previous lectureFrom the previous lecture
• Effort estimationEffort estimation• Multiple estimatesMultiple estimates• Schedule estimatingSchedule estimating• Progress trackingProgress tracking
L.Ouyang, PSP, Lecture 7
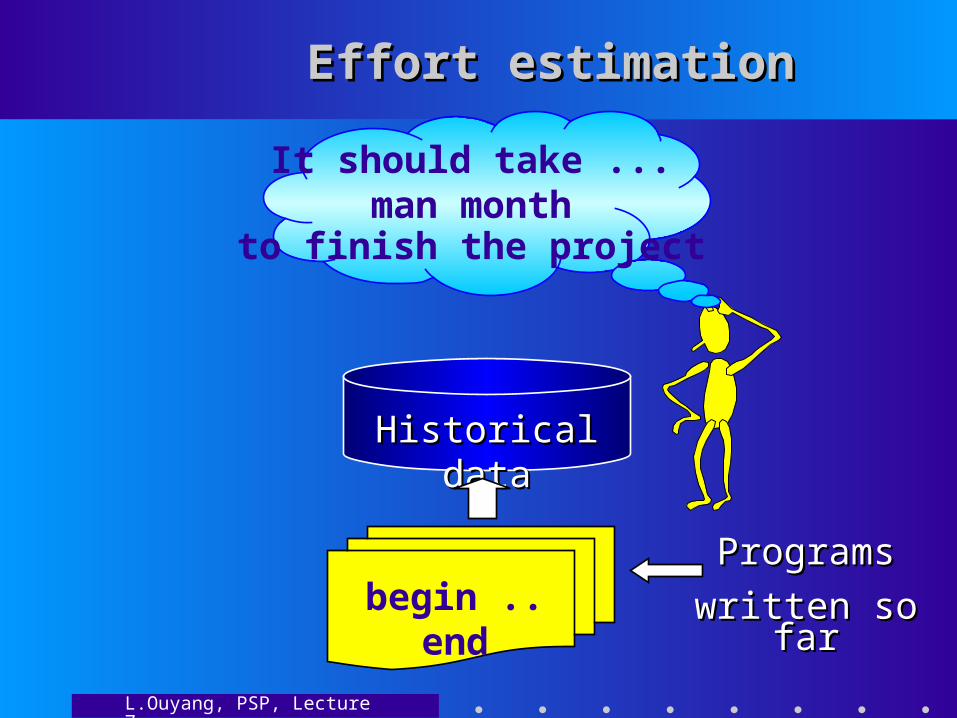
Effort estimationEffort estimation
begin .. endProgramsPrograms
written so farwritten so far
Historical dataHistorical data
It should take ...man month
to finish the project

L.Ouyang, PSP, Lecture 7
Effort estimationEffort estimation
begin .. end
EstimatedEstimatedsizesize
ActualActualtimetime
Historical dataHistorical data

L.Ouyang, PSP, Lecture 7
Effort estimationEffort estimation
begin .. end
EstimatedEstimatedsizesize
ActualActualtimetime
Historical dataHistorical data
rr22 0.5 0.5rr22 0.5 0.5

L.Ouyang, PSP, Lecture 7
Effort estimationEffort estimation
Estimated sizeEstimated sizeActual timeActual time
1. 1. 00, , 11
2. Effort = 2. Effort = 11 * Estimated_size + * Estimated_size + 00
+ ...+ ...11
nn++11 3. Range = 3. Range = tt
rr22 0.5 0.5rr22 0.5 0.5
4. Effort4. Effortminmin = Effort - Range = Effort - Range

L.Ouyang, PSP, Lecture 7
Effort estimationEffort estimation
begin .. end
EstimatedEstimatedsizesize
ActualActualtimetime
Historical dataHistorical data
Lack of data or lack of correlation betweenLack of data or lack of correlation betweenestimated sizeestimated size and and actual timeactual time
L.Ouyang, PSP, Lecture 7
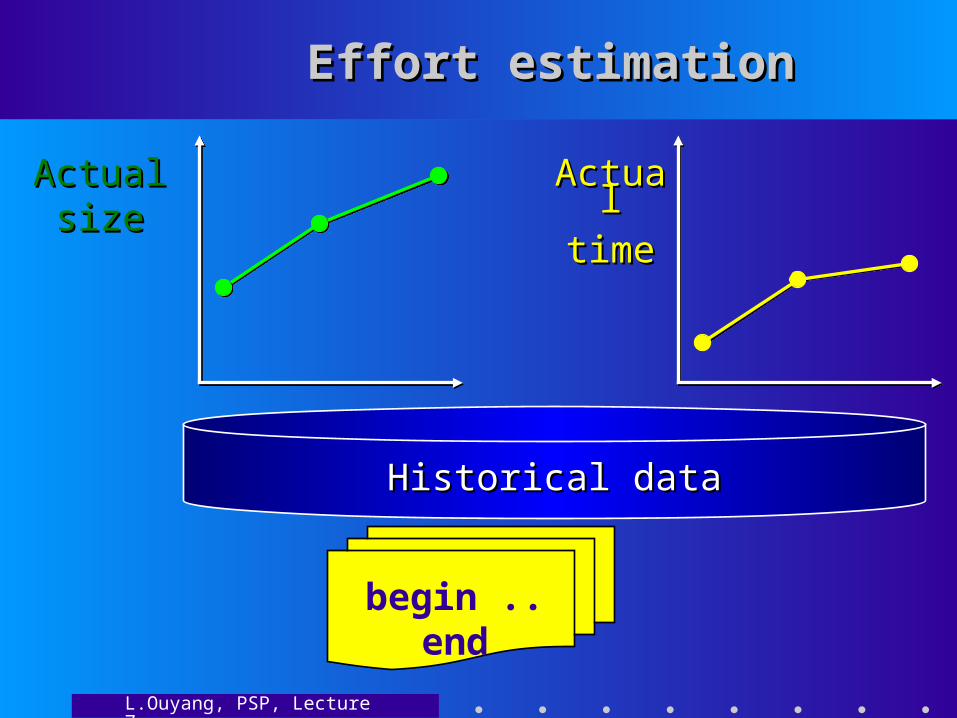
Effort estimationEffort estimation
begin .. end
ActualActualsizesize
ActualActualtimetime
Historical dataHistorical data

L.Ouyang, PSP, Lecture 7
Effort estimationEffort estimation
begin .. end
ActualActualsizesize
ActualActualtimetime
Historical dataHistorical data
rr22 0.5 0.5

L.Ouyang, PSP, Lecture 7
Effort estimationEffort estimation
Actual sizeActual sizeActual timeActual time
1. 1. 00, , 11
2. Effort = 2. Effort = 11 * Estimated_size + * Estimated_size + 00
+ ...+ ...11
nn++11 3. Range = 3. Range = tt
rr22 0.5 0.5

L.Ouyang, PSP, Lecture 7
Effort estimationEffort estimation
begin .. end
ActualActualsizesize
ActualActualtimetime
Historical dataHistorical data
Lack of correlation betweenLack of correlation betweensoftware sizesoftware size and and actual timeactual time

L.Ouyang, PSP, Lecture 7
Effort estimationEffort estimation
Actual sizeActual sizeActual timeActual time
1.1.
2. Effort = Estimated_size / P2. Effort = Estimated_size / Pavav
timetime11 + .. + time + .. + time22
sizesize11 + .. + size + .. + size22 PPavav==
3. P3. Pminmin= min { size= min { sizeii / time / timeii } }
PPmaxmax= max { size= max { sizeii / time / timeii } }
4. Effort4. Effortmin min = Estimated_size/P= Estimated_size/Pmaxmax
EffortEffortmaxmax= Estimated_size/P= Estimated_size/Pminmin

L.Ouyang, PSP, Lecture 7
Effort estimationEffort estimation
No data about timeNo data about timeYou have to make a guessYou have to make a guess
Actual size & actual time with rActual size & actual time with r22 < 0.5 < 0.5Productivity-based estimationProductivity-based estimation
Actual size & actual time with rActual size & actual time with r22 0.5 0.5Effort estimate + range (inaccurate)Effort estimate + range (inaccurate)
Estimated size & actual time with rEstimated size & actual time with r22 0.5 0.5Effort estimate + prediction intervalEffort estimate + prediction interval

L.Ouyang, PSP, Lecture 7
Plan of the lecturePlan of the lecture
• IntroductionIntroduction• From the previous lectureFrom the previous lecture• Effort estimationEffort estimation
• Multiple estimatesMultiple estimates• Schedule estimatingSchedule estimating• Progress trackingProgress tracking

L.Ouyang, PSP, Lecture 7
Multiple estimatesMultiple estimates
Task Estimatedhours
Lowerpredictioninterval L
Upperpredictioninterval U
Program 63.8 49.2 98.3Report 28.3 21.2 34.6Database 41.9 19.4 62.3Total 134.0 89.8 195.2
Task Estimatedhours
Lowerpredictioninterval L
Upperpredictioninterval U
Program 63.8 49.2 98.3Report 28.3 21.2 34.6Database 41.9 19.4 62.3Total 134.0 89.8 195.2
Is the prediction interval [89.8 , 195.2] correct?Is the prediction interval [89.8 , 195.2] correct?

L.Ouyang, PSP, Lecture 7
Multiple estimatesMultiple estimates
Task Lowerpredictioninterval L
Upperpredictioninterval U
Standarddeviation(U - L)/2
VarianceStd_dev2
Program 49.2 98.3 24.55 602.70Report 21.2 34.6 6.70 44.89Database 19.4 62.3 21.45 460.10Total 89.8 195.2 1107.69
Task Lowerpredictioninterval L
Upperpredictioninterval U
Standarddeviation(U - L)/2
VarianceStd_dev2
Program 49.2 98.3 24.55 602.70Report 21.2 34.6 6.70 44.89Database 19.4 62.3 21.45 460.10Total 89.8 195.2 1107.69
1107.69 1107.69 32.3 32.3
32.3
Range(70%) = 32.3Range(70%) = 32.3

L.Ouyang, PSP, Lecture 7
Multiple estimatesMultiple estimates
Given: time estimates TGiven: time estimates T11, T, T22, .., T, .., Tnn
their standard deviations their standard deviations 11, , 22, .., , .., nn..
TTtotaltotal= T= T11 + T + T22 + .. + T + .. + Tnn
totaltotal = = 1122 + + 22
22 + .. + + .. + nn22
TTminmin(70%) = T(70%) = Ttotaltotal - - totaltotal
TTmaxmax(70%) = T(70%) = Ttotaltotal + + totaltotal
TTminmin(70%) = T(70%) = Ttotaltotal - - totaltotal
TTmaxmax(70%) = T(70%) = Ttotaltotal + + totaltotal
TTminmin(95%) = T(95%) = Ttotaltotal - 2* - 2*totaltotal
TTmaxmax(95%) = T(95%) = Ttotaltotal + 2* + 2*totaltotal
TTminmin(95%) = T(95%) = Ttotaltotal - 2* - 2*totaltotal
TTmaxmax(95%) = T(95%) = Ttotaltotal + 2* + 2*totaltotal
In general:

L.Ouyang, PSP, Lecture 7
PROBE-generated predictionsPROBE-generated predictions
Task:Task:
Write a class C1: 144 LOCWrite a class C1: 144 LOC
Write a class C2: 193 LOCWrite a class C2: 193 LOC
Write a class C3: 318 LOCWrite a class C3: 318 LOC
SStotaltotal = 655 LOC = 655 LOC
Task:Task:
Write a class C1: 144 LOCWrite a class C1: 144 LOC
Write a class C2: 193 LOCWrite a class C2: 193 LOC
Write a class C3: 318 LOCWrite a class C3: 318 LOC
SStotaltotal = 655 LOC = 655 LOC
Size Time123 14.286 9.6
321 46.1214 31.4186 13.898 11.3
118 9.4221 19.2
11= 0.1482= 0.1482
00= -5.95= -5.95
= 5.69= 5.6922= = (T (Tii - - 00 - S - Si i 11))2 2 / (n-2)/ (n-2)
TTtotaltotal= = 00 + S + Stotaltotal * * 11 = 91.13 = 91.13
(S(Stotaltotal - s - savgavg))22
(s(sii - s - savgavg))22++11nn++11 Range = Range = tt
Range(70%)= 16.3Range(70%)= 16.3
L.Ouyang, PSP, Lecture 7
Plan of the lecturePlan of the lecture
• IntroductionIntroduction• From the previous lectureFrom the previous lecture• Effort estimationEffort estimation• Multiple estimatesMultiple estimates
• Schedule estimatingSchedule estimating• Progress trackingProgress tracking
L.Ouyang, PSP, Lecture 7
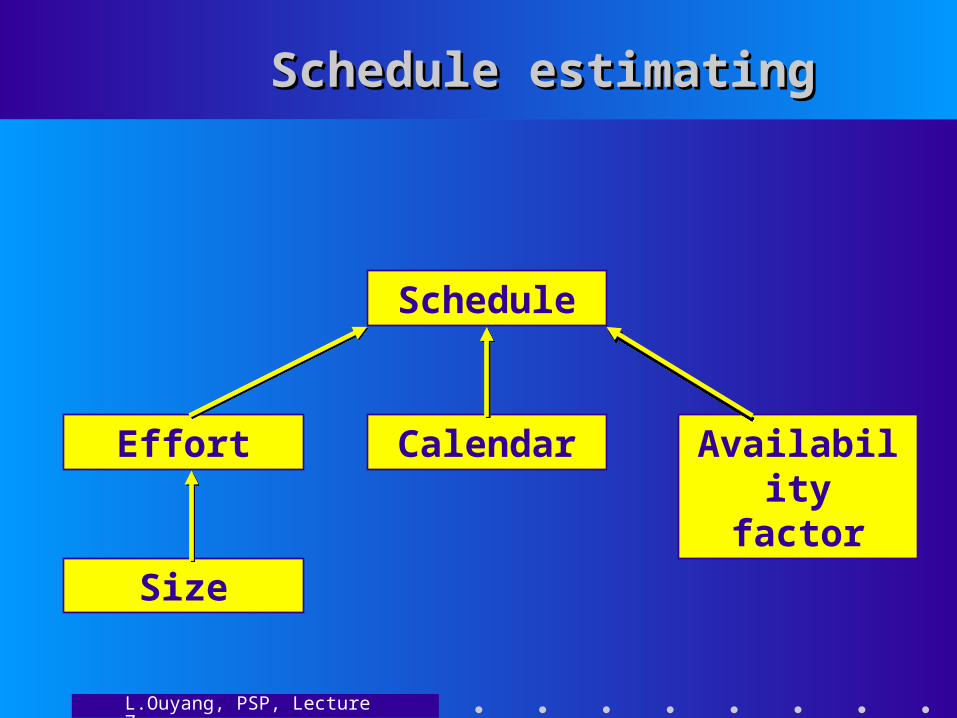
Schedule estimatingSchedule estimating
Size
Effort Calendar
Schedule
Availability factor
L.Ouyang, PSP, Lecture 7
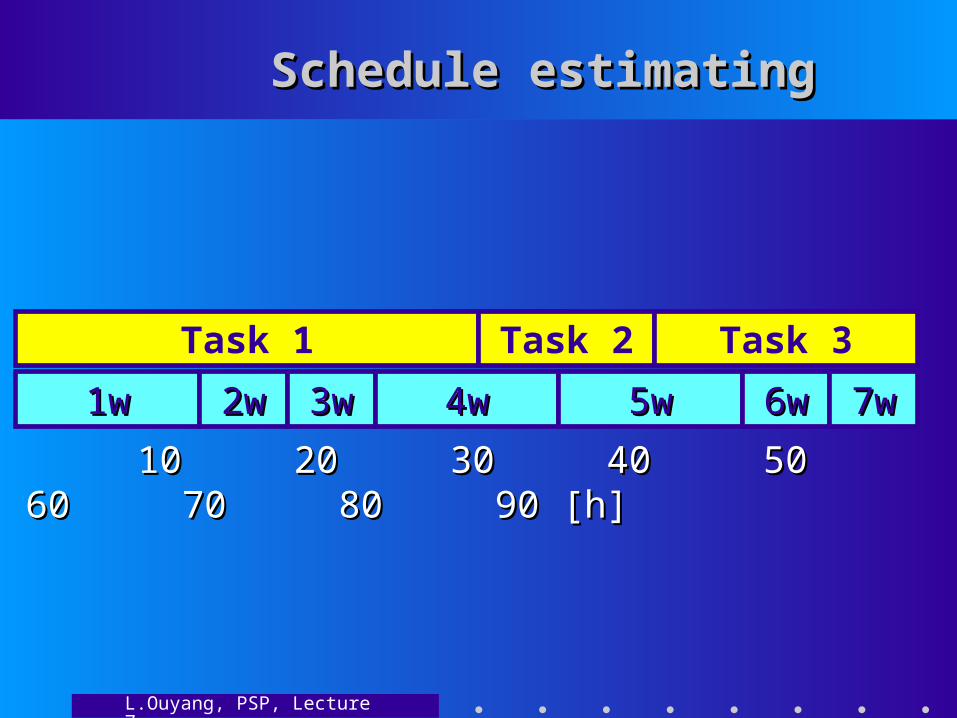
Schedule estimatingSchedule estimating
10 20 30 40 50 60 70 80 90 [h]10 20 30 40 50 60 70 80 90 [h]
1w1w 2w2w 3w3w 4w4w 5w5w 6w6w 7w7w
Task 1 Task 2 Task 3

L.Ouyang, PSP, Lecture 7
Schedule estimatingSchedule estimating
Plan ActualWeek Direct
hoursCumulativehours
Directhours
Cumulativehours
1.06 20 208.06 25 45
15.06 15 60
Project: ColorMap Data: 23.05.1999Project: ColorMap Data: 23.05.1999

L.Ouyang, PSP, Lecture 7
Schedule estimatingSchedule estimating
Plan ActualTask Hours Cumulative
hoursWeek Data
Detailed design 20 20 1.06Coding IO 25 45 8.06Coding graph 15 60 15.06
Project: ColorMap Data: Project: ColorMap Data: 23.05.199923.05.1999
L.Ouyang, PSP, Lecture 7
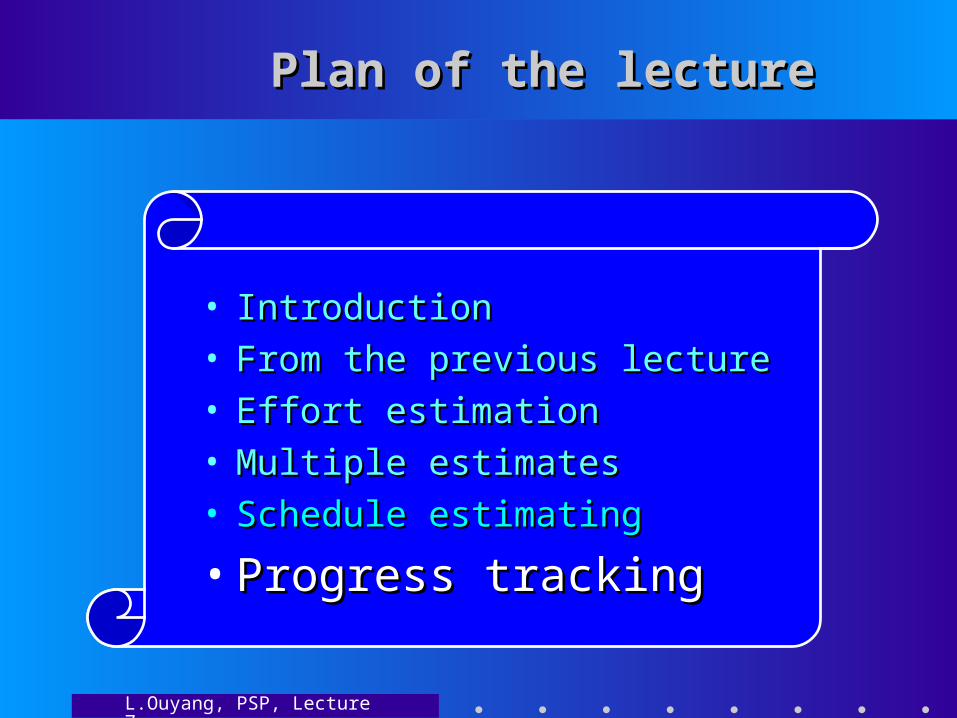
Plan of the lecturePlan of the lecture
• IntroductionIntroduction• From the previous lectureFrom the previous lecture• Effort estimationEffort estimation• Multiple estimatesMultiple estimates• Schedule estimatingSchedule estimating
• Progress trackingProgress tracking

L.Ouyang, PSP, Lecture 7
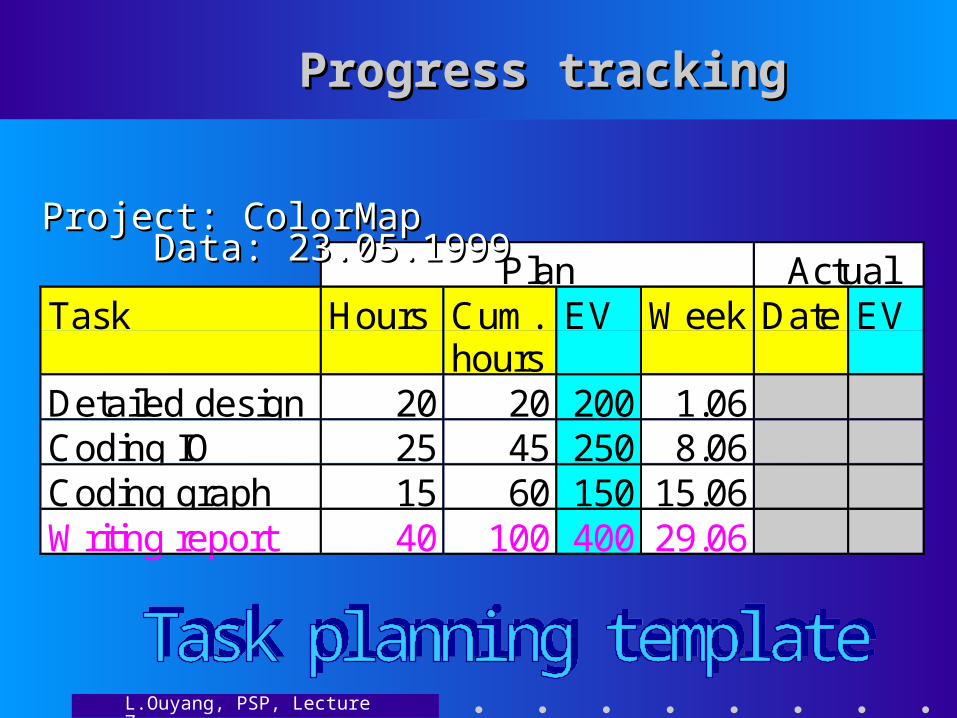
Progress trackingProgress tracking
ProblemProblem: how to track a progress : how to track a progress when a sequence of tasks is when a sequence of tasks is rearranged? rearranged?
Earned ValueEarned Value Method: Method:
• Each task is assigned a number of Each task is assigned a number of credit points.credit points.
• To earn the points assigned to a To earn the points assigned to a task, the task, the task must be completedtask must be completed..
• The points reflect ‘The points reflect ‘timetime complexitycomplexity’ ’ and are and are normalisednormalised to 1000 points. to 1000 points.
T1T1 T2T2
T1T1T2T2

L.Ouyang, PSP, Lecture 7
Progress trackingProgress tracking
0
200
400
600
800
1000
1200
1 2 3 4
Weeks
Cu
mu
lati
ve E
V
Actual
Planned
0
200
400
600
800
1000
1200
1 2 3 4
Weeks
Cu
mu
lati
ve E
V
Actual
Planned
Earned Value MethodEarned Value Method

L.Ouyang, PSP, Lecture 7
Progress trackingProgress tracking
Plan ActualWeek Direct
hoursCum.hours
Cum.EV
Directhours
Cum.hours
Cum.EV
1.06 20 20 2508.06 25 45 670
15.06 15 60 1000
Project: ColorMap Data: 23.05.1999Project: ColorMap Data: 23.05.1999
L.Ouyang, PSP, Lecture 7
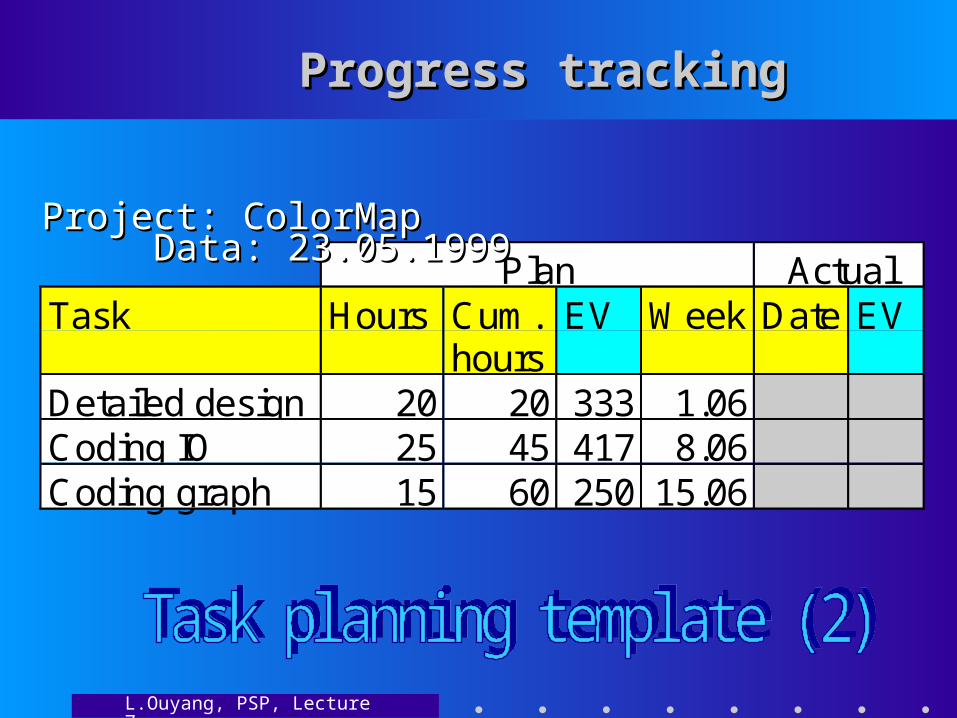
Progress trackingProgress tracking
Plan ActualTask Hours Cum.
hoursEV Week Date EV
Detailed design 20 20 333 1.06Coding IO 25 45 417 8.06Coding graph 15 60 250 15.06
Project: ColorMap Data: Project: ColorMap Data: 23.05.199923.05.1999

L.Ouyang, PSP, Lecture 7
I’ve forgotten aboutI’ve forgotten about
task Ttask Tjj !!! !!!
Progress trackingProgress tracking
Adjusted EV:Adjusted EV:
New_EVNew_EVii= x1000= x1000timetimeii timetimejj + + time timekk
L.Ouyang, PSP, Lecture 7
Progress trackingProgress tracking
Plan ActualTask Hours Cum.
hoursEV Week Date EV
Detailed design 20 20 200 1.06Coding IO 25 45 250 8.06Coding graph 15 60 150 15.06Writing report 40 100 400 29.06
Project: ColorMap Data: Project: ColorMap Data: 23.05.199923.05.1999

L.Ouyang, PSP, Lecture 7
SummarySummary
Effort estimation is based on Effort estimation is based on size estimation.size estimation.
Three cases:Three cases:• Best caseBest case• Middle caseMiddle case• Worst caseWorst case
Multiple estimatesMultiple estimates
Schedule estimatingSchedule estimating
Earned Value MethodEarned Value Method
L.Ouyang, PSP, Lecture 7
Further readingsFurther readings
W. Humphrey, A Discipline for W. Humphrey, A Discipline for Software Engineering, Addison-Software Engineering, Addison-Wesley, Reading, 1995, Chapter 5.Wesley, Reading, 1995, Chapter 5.

L.Ouyang, PSP, Lecture 7
Quality assessmentQuality assessment
1. What is your general 1. What is your general impression ? (1 - 6)impression ? (1 - 6)
2. Was it too slow or too fast ?2. Was it too slow or too fast ?
3. Did you learn something 3. Did you learn something important to you ?important to you ?
4. What to improve and how ?4. What to improve and how ?