efficient market hypothesis valuation of bonds
TRANSCRIPT

Efficient Market Hypothesis
Valuation of Bonds

EFFICIENT MARKET HYPOTHESIS (EMH)
Applies theory of rational expectations to pricing of securities.
“Security prices accurately reflect available information, and respond rapidly to new information as soon as it becomes available” Richard Brealey & Stewart Myers, Principles of Corporate Finance, 1996
2

3 FORMS OF EMH
According to Harry Roberts (1967):
1. Weak form efficiency: prices incorporate information about past prices
2. Semi-strong form: incorporate all publicly available information
3. Strong form: all information, including inside information

THE EMH GRAPHICALLY
In this diagram, the circles represent the amount of information that each form of the EMH includes.
Note that the weak form covers the least amount of information, and the strong form covers all information.
Also note that each successive form includes the previous ones.
Strong Form
Semi-Strong
Weak Form
All information, public and private
All public information
All historical prices and returns

THE WEAK FORM The weak form of the EMH says that past prices,
volume, and other market statistics provide NO information that can be used to predict future prices.
If stock price changes are random, then past prices cannot be used to forecast future prices.
Price changes should be random because it is information that drives these changes, and information arrives randomly.
Prices should change very quickly and to the correct level when new information arrives.
This form of the EMH, if correct, REJECTS technical analysis.
Most research supports the notion that the markets are weak form efficient.

THE SEMI-STRONG FORM The semi-strong form says that prices fully
reflect all publicly available information and expectations about the future.
This suggests that prices adjust very rapidly to new information, and that old information cannot be used to earn superior returns.
The semi-strong form, if correct, REPUDIATES fundamental analysis.
Most studies find that the markets are reasonably efficient in this sense, but the evidence is somewhat mixed.

THE STRONG FORM
The strong form says that prices FULLY reflect all information, whether publicly available or not.
Even the knowledge of material, non-public information cannot be used to earn superior results.
Most studies have found that the markets are not efficient in this sense.

BOND MARKET SNEAK PREVIEW & ITS VALUATIONS
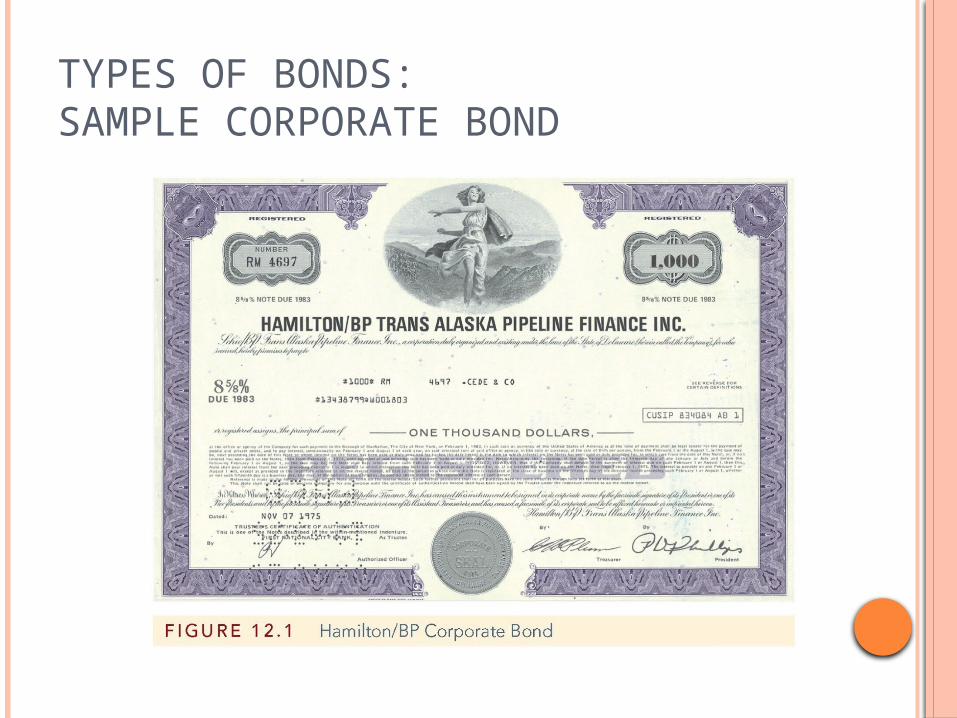
TYPES OF BONDS: SAMPLE CORPORATE BOND


VALUATION OF BONDS

Copyright © 2016 Pearson Education, Inc.
2-13
Review of Time ValueFuture Value
The future value (Pn) of any sum of money invested today is:
Pn = P0(1+r)n
n = number of periods
Pn = future value n periods from now (in dollars)
P0 = original principal (in dollars)
r = interest rate per period (in decimal form)
(1+r)n represents the future value of $1 invested today for n periods at a compounding rate of r

Copyright © 2016 Pearson Education, Inc.
2-14
Review of Time Value (continued)
Future ValueWhen interest is paid more than one time per year, both
the interest rate and the number of periods used to compute the future value must be adjusted as follows:
r = annual interest rate ÷ number of times interest paid per year
n = number of times interest paid per year times number of years
The higher future value when interest is paid semiannually, as opposed to annually, reflects the greater opportunity for reinvesting the interest paid.

Copyright © 2016 Pearson Education, Inc.
2-15
Review of Time Value (continued)
Future Value of an Ordinary AnnuityWhen the same amount of money is invested periodically, it is
referred to as an annuity. When the first investment occurs one period from now, it is referred
to as an ordinary annuity.The equation for the future value of an ordinary annuity (Pn) is:
A = the amount of the annuity (in dollars).r = annual interest rate ÷ number of times interest paid per yearn = number of times interest paid per year times number of years
1 1
n
nr
P Ar

Copyright © 2016 Pearson Education, Inc.
2-16
Review of Time Value (continued)Example of Future Value of an Ordinary
Annuity Using Annual Interest:
If A = $2,000,000, r = 0.08, and n = 15, then Pn = ?
Pn = $2,000,000 [27.152125] = $54,304,250
151 0.08 1$2,000,000
0.08
nP
1 1
n
nr
P Ar
Copyright © 2016 Pearson Education, Inc.
2-17
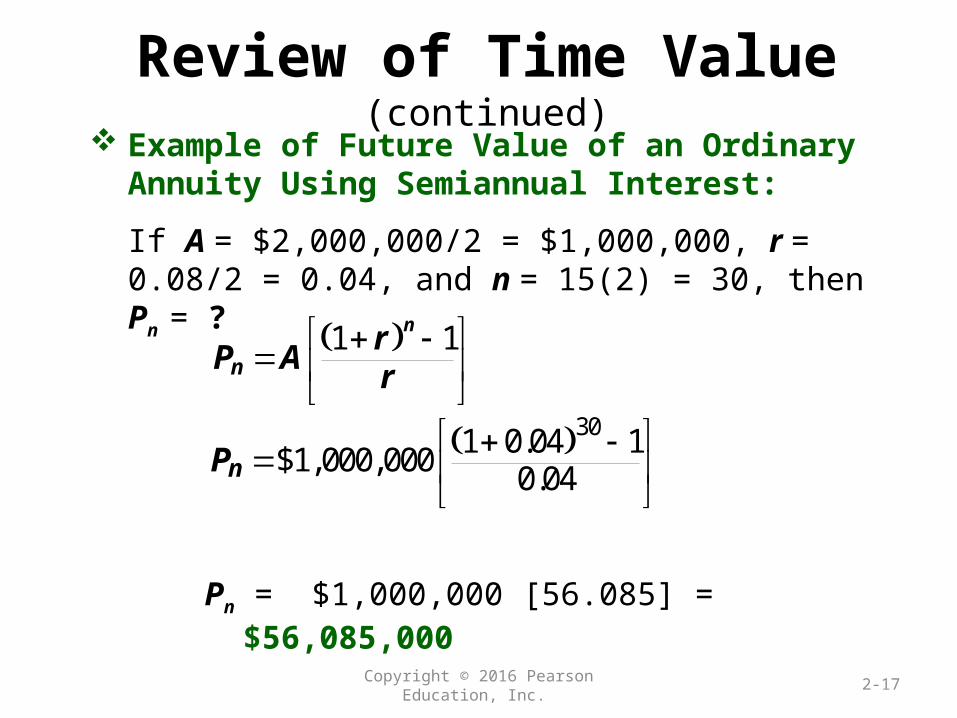
Review of Time Value (continued) Example of Future Value of an Ordinary Annuity
Using Semiannual Interest:
If A = $2,000,000/2 = $1,000,000, r = 0.08/2 = 0.04, and n = 15(2) = 30, then Pn = ?
Pn = $1,000,000 [56.085] = $56,085,000
1 1
n
nr
P Ar
301 0.04 1$1,000,000
0.04
nP
Copyright © 2016 Pearson Education, Inc.
2-18
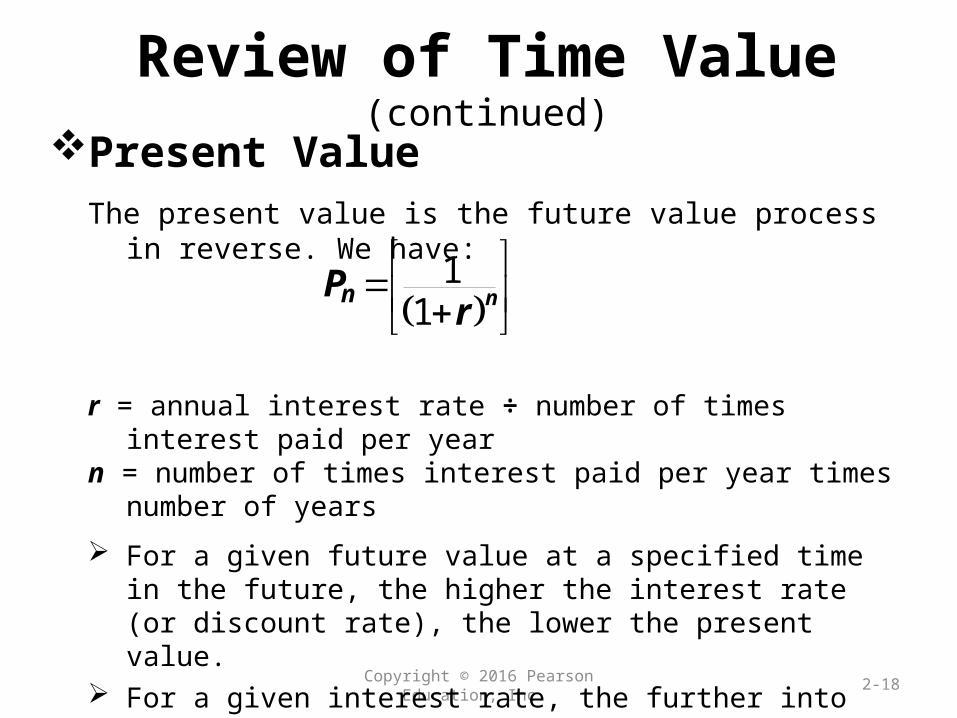
Review of Time Value (continued)
Present ValueThe present value is the future value process in reverse. We have:
r = annual interest rate ÷ number of times interest paid per yearn = number of times interest paid per year times number of years
For a given future value at a specified time in the future, the higher the interest rate (or discount rate), the lower the present value.
For a given interest rate, the further into the future that the future value will be received, then the lower its present value.
1
1
nnPr
Copyright © 2016 Pearson Education, Inc.
2-19
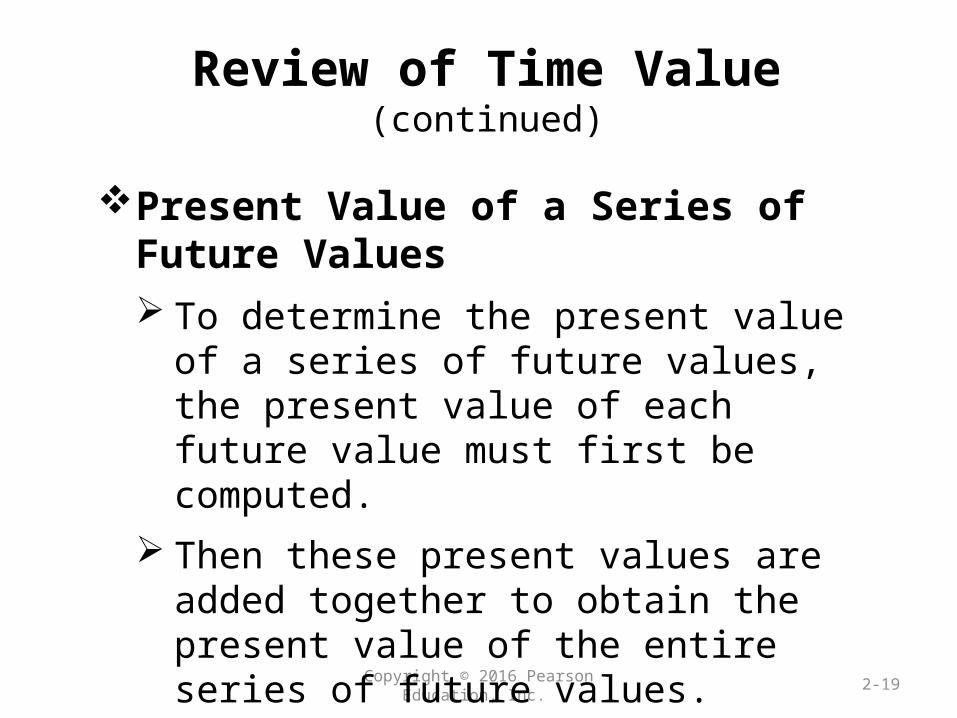
Review of Time Value(continued)
Present Value of a Series of Future Values To determine the present value of a series of
future values, the present value of each future value must first be computed.
Then these present values are added together to obtain the present value of the entire series of future values.

Copyright © 2016 Pearson Education, Inc.
2-20
Review of Time Value (continued)
Present Value of an Ordinary AnnuityWhen the same amount of money is received (or paid) each period,
it is referred to as an annuity. When the first payment is received one period from now, the
annuity is called an ordinary annuity.When the first payment is immediate, the annuity is called an
annuity due.The present value of an ordinary annuity (PV) is:
A = the amount of the annuity (in dollars)r = annual interest rate ÷ number of times interest paid per yearn = number of times interest paid per year times number of years
1 1/ 1
nrPV A
r

Copyright © 2016 Pearson Education, Inc.
2-21
Review of Time Value (continued) Example of Present Value of an Ordinary
Annuity (PV) Using Annual Interest:
If A = $100, r = 0.09, and n = 8, then PV = ?
PV = $100 [5.534811] = $553.48
1 1/ 1
nrPV A
r
81 1/ 1 0.09$100
0.09
PV

Copyright © 2016 Pearson Education, Inc.
2-22
Review of Time Value (continued)
Present Value When Payments Occur More Than Once Per Year
If the future value to be received occurs more than once per year, then the present value formula is modified so that
1) the annual interest rate is divided by the frequency per year
2) the number of periods when the future value will be received is adjusted by multiplying the number of years by the frequency per year

Copyright © 2016 Pearson Education, Inc.
2-23
Pricing a Bond Determining the price of any financial instrument
requires an estimate of 1) the expected cash flows2) the appropriate required yield3) the required yield reflects the yield for financial
instruments with comparable risk, or alternative investments
The cash flows for a bond that the issuer cannot retire prior to its stated maturity date consist of 1) periodic coupon interest payments to the maturity date2) the par (or maturity) value at maturity

Copyright © 2016 Pearson Education, Inc.
2-24
Pricing a Bond (continued)
In general, the price of a bond (P) can be computed using the following formula:
P = price (in dollars)n = number of periods (number of years times 2)t = time period when the payment is to be receivedC = semiannual coupon payment (in dollars)r = periodic interest rate (required annual yield divided by 2)M = maturity value
1 1 1
n
t =
t tnt
C M+
r rP

Copyright © 2016 Pearson Education, Inc.
2-25
Pricing a Bond (continued)Computing the Value of a Bond: An Example Consider a 20-year 10% coupon bond with a par value of
$1,000 and a required yield of 11%. Given C = 0.1($1,000) / 2 = $50, n = 2(20) = 40 and r = 0.11 /
2 = 0.055, the present value of the coupon payments (P) is:
P = $50 [16.046131] = $802.31
401 1/ 1 0.055$50
0.055
P
1 1/ 1
nrP C
r

Copyright © 2016 Pearson Education, Inc.
2-26
Pricing a Bond (continued)
Computing the Value of a Bond: An Example The present value of the par or maturity value of $1,000 is:
Continuing the computation from the previous slide:
The price of the bond (P) =
present value coupon payments + present value maturity value =
$802.31 + $117.46 = $919.77.
40$1,000 $ .
1 1 0.055
117 46n
Mr

Copyright © 2016 Pearson Education, Inc.
2-27
Pricing a Bond (continued)
For zero-coupon bonds, the investor realizes interest as the difference between the maturity value and the purchase price. The equation is:
P = price (in dollars)M = maturity valuer = periodic interest rate (required annual yield divided by 2)n = number of periods (number of years times 2)
1
n
tM
rP
Copyright © 2016 Pearson Education, Inc.
2-28
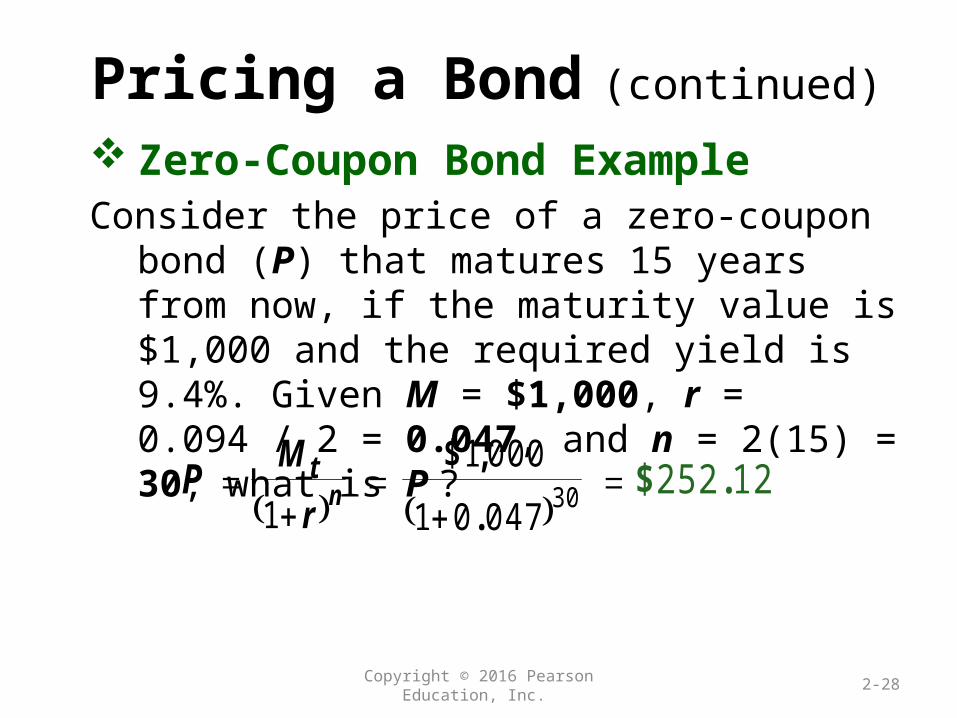
Pricing a Bond (continued)
Zero-Coupon Bond ExampleConsider the price of a zero-coupon bond (P) that
matures 15 years from now, if the maturity value is $1,000 and the required yield is 9.4%. Given M = $1,000, r = 0.094 / 2 = 0.047, and n = 2(15) = 30, what is P ?
30
1 0 0 0
1 1 0 0 4 72 5 2 1 2n
tM
rP
$ ,
.
$ .

Copyright © 2016 Pearson Education, Inc.
2-29
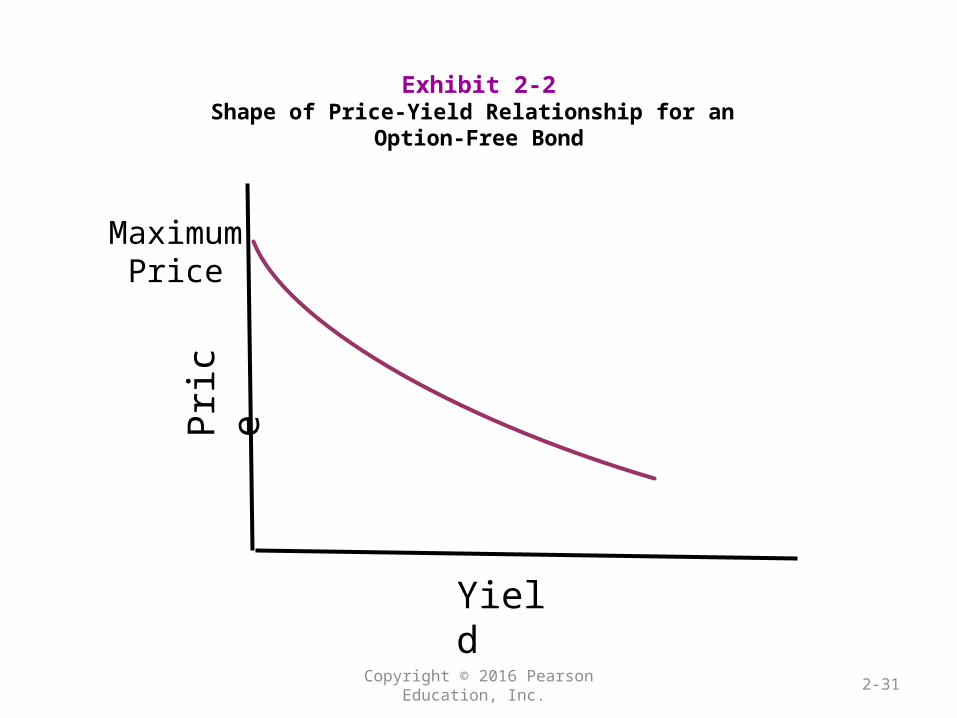
Pricing a Bond (continued)
Price-Yield Relationship A fundamental property of a bond is that its price
changes in the opposite direction from the change in the required yield. The reason is that the price of the bond is the
present value of the cash flows. If we graph the price-yield relationship for any
option-free bond, we will find that it has the “bowed” shape shown in Exhibit 2-2.
Copyright © 2016 Pearson Education, Inc.
2-30
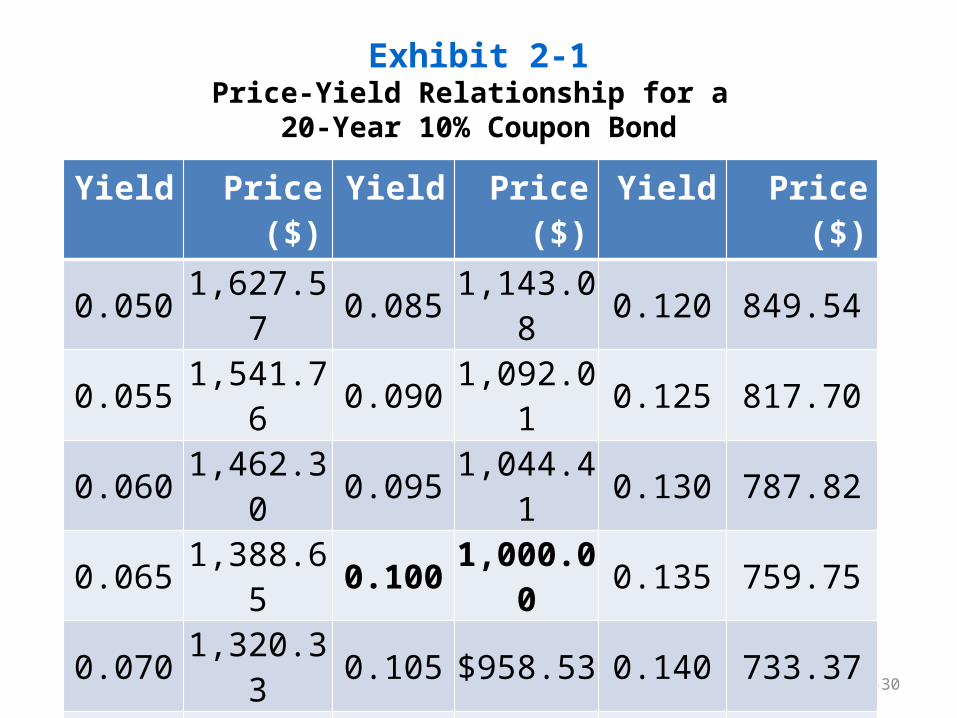
Exhibit 2-1Price-Yield Relationship for a
20-Year 10% Coupon Bond
Yield Price ($) Yield Price ($) Yield Price ($)
0.050 1,627.57 0.085 1,143.08 0.120 849.54
0.055 1,541.76 0.090 1,092.01 0.125 817.70
0.060 1,462.30 0.095 1,044.41 0.130 787.82
0.065 1,388.65 0.100 1,000.00 0.135 759.75
0.070 1,320.33 0.105 $958.53 0.140 733.37
0.075 1,256.89 0.110 $919.77 0.145 708.53
0.080 1,197.93 0.115 883.50 0.150 685.14
Copyright © 2016 Pearson Education, Inc.
2-31
Exhibit 2-2Shape of Price-Yield Relationship for an
Option-Free Bond
Pri
ceMaximum
Price
Yield

Copyright © 2016 Pearson Education, Inc.
2-32
Pricing a Bond (continued)
Relationship Between Coupon Rate, Required Yield, and Price When yields in the marketplace rise above the coupon rate at a
given point in time, the price of the bond falls so that an investor buying the bond can realizes capital appreciation.
The appreciation represents a form of interest to a new investor to compensate for a coupon rate that is lower than the required yield.
When a bond sells below its par value, it is said to be selling at a discount.
A bond whose price is above its par value is said to be selling at a premium.

Copyright © 2016 Pearson Education, Inc.
2-33
Pricing a Bond (continued)
Relationship Between Bond Price and Time if Interest Rates Are Unchanged For a bond selling at par value, the coupon rate equals the required
yield. As the bond moves closer to maturity, the bond continues to sell at par . Its price will remain constant as the bond moves toward the maturity
date. The price of a bond will not remain constant for a bond selling at a
premium or a discount. Exhibit 2-3 shows the time path of a 20-year 10% coupon bond selling
at a discount and the same bond selling at a premium as it approaches maturity. (See truncated version of Exhibit 2-3 in Overhead 2-25.) The discount bond increases in price as it approaches maturity,
assuming that the required yield does not change. For a premium bond, the opposite occurs. For both bonds, the price will equal par value at the maturity date.

Copyright © 2016 Pearson Education, Inc.
2-34
Exhibit 2-3Time Path for the Price of a 20-Year 10% Bond Selling at a
Discount and Premium as It Approaches Maturity
YearPrice of Discount Bond
Selling to Yield 12%Price of Premium Bond
Selling to Yield 7.8%
20.0 $ 849.54 $1,221.00
16.0 859.16 1,199.14
12.0 874.50 1,169.45
10.0 885.30 1,150.83
8.0 898.94 1,129.13
4.0 937.90 1,074.37 0.0 1,000.00 1,000.00

Copyright © 2016 Pearson Education, Inc.
2-35
Pricing a Bond (continued)Reasons for the Change in the Price of a Bond
The price of a bond can change for three reasons:1) there is a change in the required yield owing to changes
in the credit quality of the issuer2) there is a change in the price of the bond selling at a
premium or a discount, without any change in the required yield, simply because the bond is moving toward maturity
3) there is a change in the required yield owing to a change in the yield on comparable bonds (i.e., a change in the yield required by the market)

Copyright © 2016 Pearson Education, Inc.
2-36
ComplicationsThe framework for pricing a bond assumes
the following:
1) the next coupon payment is exactly six months away
2) the cash flows are known
3) the appropriate required yield can be determined
4) one rate is used to discount all cash flows

Copyright © 2016 Pearson Education, Inc.
2-37
Complications (continued)
(1) The next coupon payment is exactly six months away
When an investor purchases a bond whose next coupon payment is due in less than six months, the accepted method for computing the price of the bond is as follows:
where v = (days between settlement and next coupon) divided by (days in six-month period)
11 1
1 1 1 1
n
t =
v t v t
C M+
r r r rP

Copyright © 2016 Pearson Education, Inc.
2-38
Complications (continued)
Cash Flows May Not Be Known For most bonds, the cash flows are not known with certainty. This is because an issuer may call a bond before the maturity date.
Determining the Appropriate Required Yield All required yields are benchmarked off yields offered by Treasury
securities. From there, we must still decompose the required yield for a bond
into its component parts. One Discount Rate Applicable to All Cash Flows
A bond can be viewed as a package of zero-coupon bonds, in which case a unique discount rate should be used to determine the present value of each cash flow.
Copyright © 2016 Pearson Education, Inc.
2-39
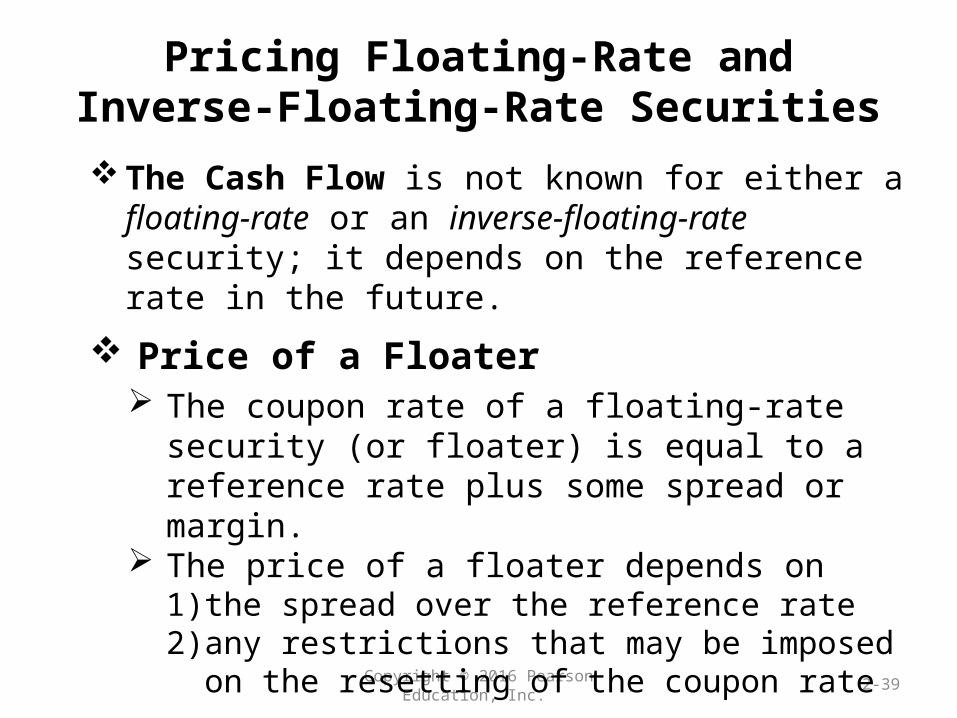
Pricing Floating-Rate andInverse-Floating-Rate Securities
The Cash Flow is not known for either a floating-rate or an inverse-floating-rate security; it depends on the reference rate in the future.
Price of a Floater The coupon rate of a floating-rate security (or floater)
is equal to a reference rate plus some spread or margin. The price of a floater depends on
1) the spread over the reference rate2) any restrictions that may be imposed on the resetting
of the coupon rate

Copyright © 2016 Pearson Education, Inc.
2-40
Pricing Floating-Rate andInverse-Floating-Rate Securities (continued)
Price of an Inverse-Floater In general, an inverse floater is created from a fixed-rate security.
The security from which the inverse floater is created is called the collateral.
From the collateral two bonds are created: a floater and an inverse floater.
The price of a floater depends on (i) the spread over the reference rate and (ii) any restrictions that may be imposed on the resetting of the coupon rate.
For example, a floater may have a maximum coupon rate called a cap or a minimum coupon rate called a floor.
The price of an inverse floater equals the collateral’s price minus the floater’s price.

Copyright © 2016 Pearson Education, Inc.
2-41
Exhibit 2-4Creation of an Inverse Floater
Floating-rate Bond
(“Floater”)Inverse-floating-rate bond
(“Inverse floater”)
Collateral (Fixed-rate bond)

Copyright © 2016 Pearson Education, Inc.
2-42
Price Quotes and Accrued Interest
Price Quotes A bond selling at par is quoted as 100,
meaning 100% of its par value. A bond selling at a discount will be
selling for less than 100. A bond selling at a premium will be
selling for more than 100.

Copyright © 2016 Pearson Education, Inc.
2-43
Price Quotes and Accrued Interest(continued)
When quoting bond prices, traders quote the price as a percentage of par value. Exhibit 2-5 illustrate how a price quote is converted into a
dollar price. (See truncated version of Exhibit 2-5 in Overhead 2-35.)
When an investor purchases a bond between coupon payments, the investor must compensate the seller of the bond for the coupon interest earned from the time of the last coupon payment to the settlement date of the bond. This amount is called accrued interest. For corporate and municipal bonds, accrued interest is based
on a 360-day year, with each month having 30 days.

Copyright © 2016 Pearson Education, Inc.
2-44
Exhibit 2-5 Price Quotes Converted into a Dollar Price
(1)Price Quote
(2)Converted to a
Decimal [= 1)/100]
(3)Par
Value
(4)Dollar Price [= (2) × (3)]
80 1/8 0.8012500 10,000 8,012.50
76 5/32 0.7615625 1,000,000 761,562.50
86 11/64 0.8617188 100,000 86,171.88
100 1.0000000 50,000 50,000.00
109 1.0900000 1,000 1,090.00
103 3/4 1.0375000 100,000 103,750.00
105 3/8 1.0537500 25,000 26,343.75
Copyright © 2016 Pearson Education, Inc.
2-45
Price Quotes and Accrued Interest(continued)
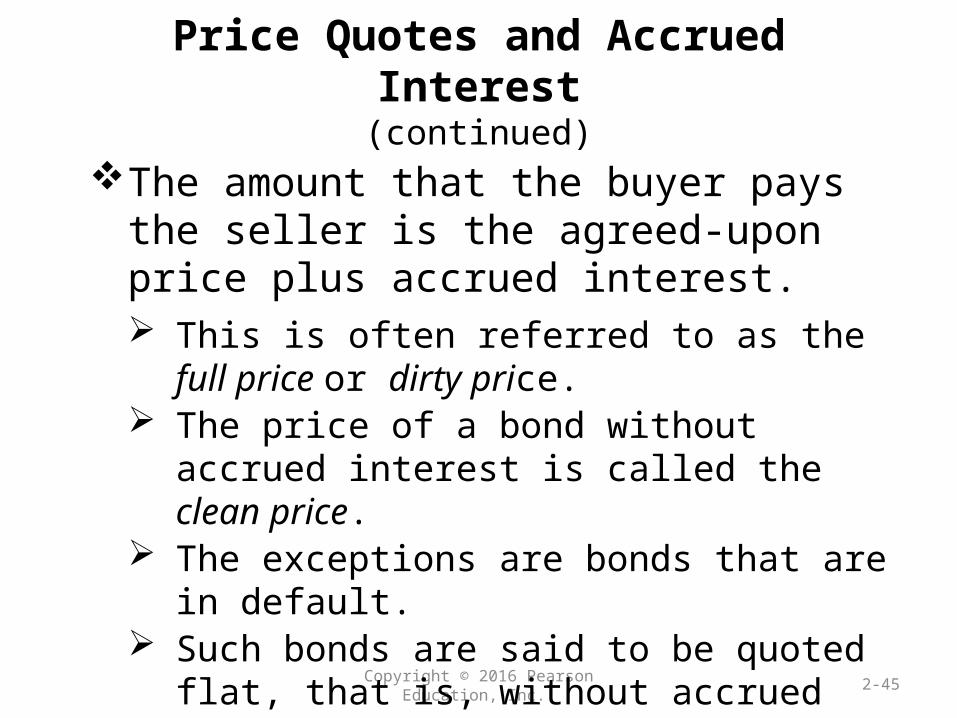
The amount that the buyer pays the seller is the agreed-upon price plus accrued interest. This is often referred to as the full price or dirty
price. The price of a bond without accrued interest is
called the clean price. The exceptions are bonds that are in default. Such bonds are said to be quoted flat, that is,
without accrued interest.

Copyright © 2016 Pearson Education, Inc.
Key Points● The price of a bond is the present value of the bond’s expected
cash flows, the discount rate being equal to the yield offered on comparable bonds. For an option-free bond, the cash flows are the coupon payments and the par value or maturity value. The higher (lower) the required yield, the lower (higher) the price of a bond.
● For a zero-coupon bond, there are no coupon payments. The price of a zero-coupon bond is equal to the present value of the maturity value, where the number of periods used to compute the present value is double the number of years and the discount rate is a semiannual yield.
● A bond’s price changes in the opposite direction from the change in the required yield. The reason is that as the required yield increases (decreases), the present value of the cash flow decreases (increases).
2-46

Copyright © 2016 Pearson Education, Inc.
Key Points (continued)
● A bond will be priced below, at par, or above par depending the bond’s coupon rate and the required yield required by investors. When the coupon rate is equal to the required yield, the bond will sell at its par value. When the coupon rate is less (greater) than the required yield, the bond will sell for less (more) than its par value.
● Over time, the price of a premium or discount bond will change even if the required yield does not change. Assuming that the credit quality of the issuer is unchanged, the price change on any bond can be decomposed into a portion attributable to a change in the required yield and a portion attributable to the time path of the bond.
2-47
Copyright © 2016 Pearson Education, Inc.
Key Points (continued)
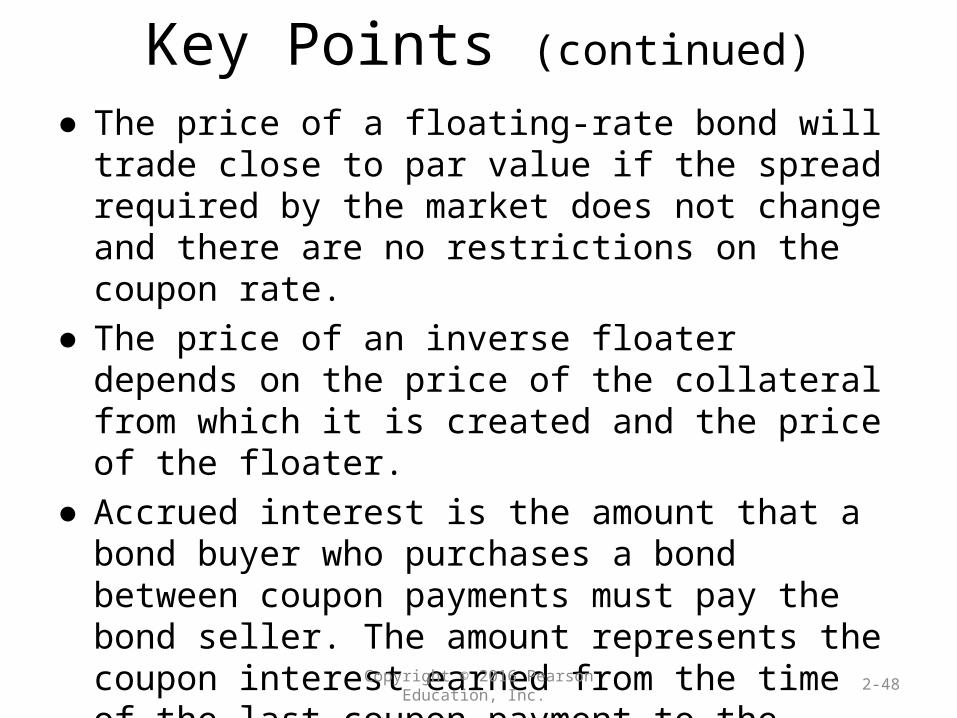
● The price of a floating-rate bond will trade close to par value if the spread required by the market does not change and there are no restrictions on the coupon rate.
● The price of an inverse floater depends on the price of the collateral from which it is created and the price of the floater.
● Accrued interest is the amount that a bond buyer who purchases a bond between coupon payments must pay the bond seller. The amount represents the coupon interest earned from the time of the last coupon payment to the settlement date of the bond.
2-48
Copyright © 2016 Pearson Education, Inc.
3-49
Computing the Yield or Internal Rate of Return on any Investment
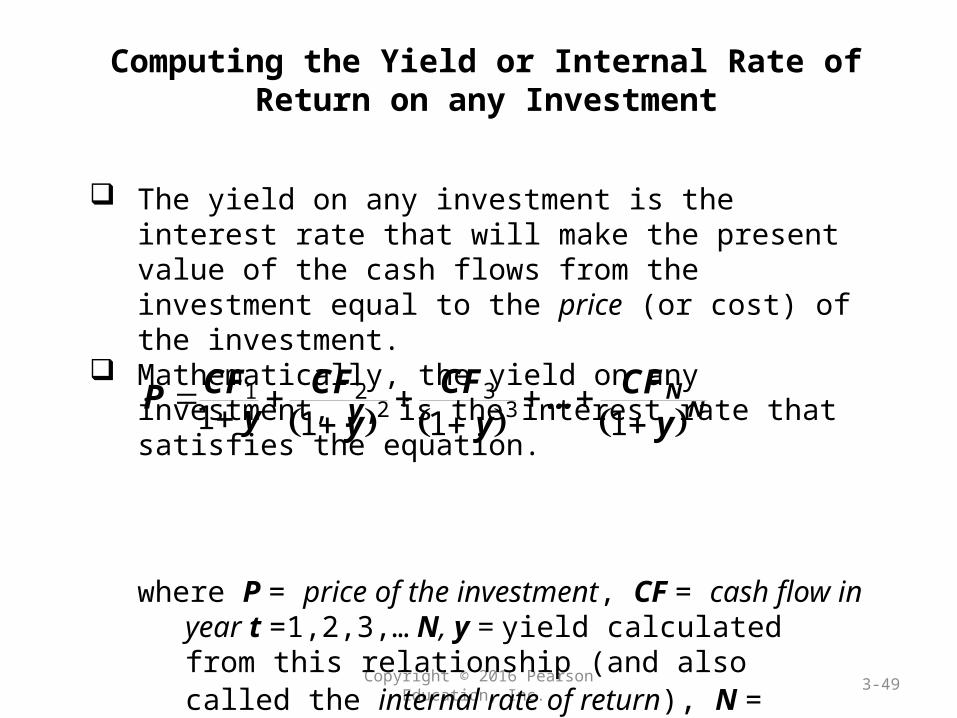
The yield on any investment is the interest rate that will make the present value of the cash flows from the investment equal to the price (or cost) of the investment.
Mathematically, the yield on any investment, y, is the interest rate that satisfies the equation.
where P = price of the investment, CF = cash flow in year t
=1,2,3,… N, y = yield calculated from this relationship (and also called the internal rate of return), N = number of years.
31 2
2 31 11 1N
NCFCF CF CFP ...
y yy y

Copyright © 2016 Pearson Education, Inc.
3-50
Computing the Yield or Internal Rate of Return on any Investment (continued)
Absent a financial calculator or computer software, solving for the yield (y) requires a trial-and-error (iterative) procedure.
The objective is to find the yield that will make the present value of the cash flows equal to the price.
Keep in mind that the yield computed is the yield for the period. That is, if the cash flows are semiannual, the yield is a
semiannual yield. If the cash flows are monthly, the yield is a monthly yield.
To compute the simple annual interest rate, the yield for the period is multiplied by the number of periods in the year.

Copyright © 2016 Pearson Education, Inc.
3-51
Computing the Yield or Internal Rate of Return on any Investment (continued)
Special Case: Investment with Only One Future Cash Flow When the case where there is only one future cash flow,
it is not necessary to go through the time-consuming trial-and-error procedure to determine the yield.
We can use the below equation:
where y is the yield, CFn is the cash flow that occurs in n periods, and P is today’s value and n is the number of periods.
1
1nnCFy
P

Copyright © 2016 Pearson Education, Inc.
3-52
Conventional Yield Measures Bond yield measures commonly quoted by dealers and
used by portfolio managers are:
1) Current Yield2) Yield To Maturity3) Yield To Call
Copyright © 2016 Pearson Education, Inc.
3-53
Conventional Yield Measures (continued)
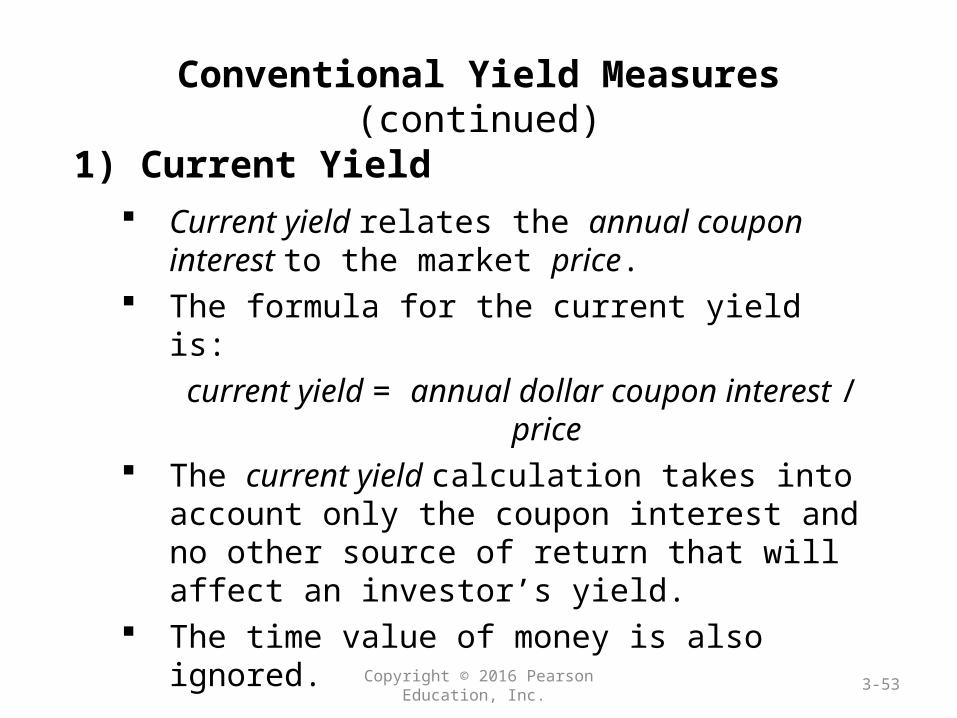
1) Current Yield Current yield relates the annual coupon interest to the
market price. The formula for the current yield is:
current yield = annual dollar coupon interest / price The current yield calculation takes into account only
the coupon interest and no other source of return that will affect an investor’s yield.
The time value of money is also ignored.

Copyright © 2016 Pearson Education, Inc.
3-54
Conventional Yield Measures (continued)
2) Yield To Maturity The yield to maturity is the interest rate that will make the
present value of the cash flows equal to the price (or initial investment).
For a semiannual pay bond, the yield to maturity is found by first computing the periodic interest rate, y, which satisfies the relationship:
where P = price of the bond, C = semiannual coupon interest (in dollars), M = maturity value (in dollars), and n = number of periods (number of years multiplied by 2).
2 31 1 1 1 1 n n
C C C C MP + + + . . .+ + y y y y y

Copyright © 2016 Pearson Education, Inc.
3-55
Conventional Yield Measures (Continued)
2) Yield To Maturity (continued) For a semiannual pay bond, doubling the periodic interest rate or
discount rate (y) gives the yield to maturity. The yield to maturity computed on the basis of this market
convention is called the bond-equivalent yield:
where M = maturity value (in dollars), P = price of the bond, and n = number of periods (number of years multiplied by 2).
The yield-to-maturity calculation takes into account the current coupon income, any capital gain or loss realized by holding the bond to maturity, and the timing of the cash flows.
1 / = 1
nMyP

Copyright © 2016 Pearson Education, Inc.
3-56
Conventional Yield Measures (Continued)
3) Yield To Call The call price is the price at which the bond may be called . There is a call schedule that specifies a call price for each call date. The yield to call assumes that the issuer will call the bond at some
assumed call date and the call price is specified in the call schedule. The computation for the yield to call begins with this expression:
where M * = call price (in dollars) and n* = number of periods until the assumed call date (number of years times 2)
For a semiannual pay bond, doubling the periodic interest rate (y) gives the yield to call on a bond-equivalent basis.
1 2 31 1 1 1 1* ** = n n
C C C C MP + + + . . .+ + y y y y y
Copyright © 2016 Pearson Education, Inc.
3-57
Conventional Yield Measures (Continued)
8) Yield (Internal Rate of Return) for a Portfolio
The yield for a portfolio of bonds is not simply the average or weighted average of the yield to maturity of the individual bond issues in the portfolio.
It is computed by determining the cash flows for the portfolio and determining the interest rate that will make the present value of the cash flows equal to the market value of the portfolio.

Copyright © 2016 Pearson Education, Inc.
3-58
Potential Sources of a Bond’s Dollar Return
An investor who purchases a bond can expect to receive a dollar return from one or more of these sources:1) the periodic coupon interest payments made by the issuer2) any capital gain (or capital loss—negative dollar return)
when the bond matures, is called, or is sold3) interest income generated from reinvestment of the
periodic cash flows
The current yield considers only the coupon interest payments.
The yield to maturity, yield to call, and cash flow yield all take into account the three components.

Copyright © 2016 Pearson Education, Inc.
3-59
Potential Sources of a Bond’s Dollar Return(continued)
Determining the Interest-On-Interest Dollar Return The interest-on-interest component can represent a
substantial portion of a bond’s potential return. The coupon interest plus interest on interest can be found by using the following equation:
whereC is the coupon interestr is the semiannual reinvestment raten is the number of periods
1 1n
rC
r
coupon interest + interest on interest

Copyright © 2016 Pearson Education, Inc.
3-60
Potential Sources of a Bond’s Dollar Return(continued)
Determining the Interest-On-Interest Dollar ReturnThe total dollar amount of coupon interest is found by
multiplying the semiannual coupon interest by the number of periods:
total coupon interest = nC
where C is the coupon interest, r is the semiannual reinvestment rate, and n is the number of periods.
The interest-on-interest component is then the difference between the coupon interest plus interest on interest and the total dollar coupon interest, as expressed by the formula
1 1n
rC nC
r
interest on interest

Copyright © 2016 Pearson Education, Inc.
3-61
Potential Sources of a Bond’s Dollar Return(continued)
Determining the Interest-On-Interest Dollar Return Example. Assume that the coupon interest (C) is $50, the
semiannual reinvestment rate (r) is 4.5%, and the number of periods (n) is 40. What is the interest-on-interest?
Using our equation for interest on interest and inserting in our given values we get:
401 0.045 1
50 40 50 50 107.03032 –1,4000.045
$7,351.52
1 1n
rC nC
r
interest on interest

Copyright © 2016 Pearson Education, Inc.
3-62
Potential Sources of a Bond’s Dollar Return(continued)
Yield To Maturity and Reinvestment Risk The investor realizes the yield to maturity only if the
bond is held to maturity and the coupon payments can be reinvested at the computed yield to maturity.
Reinvestment risk is the risk that future reinvestment rates will be less than the yield to maturity at the time the bond is purchased.
There are two characteristics of a bond that determine the importance of the interest-on- interest component and therefore the degree of reinvestment risk: maturity and coupon.

Copyright © 2016 Pearson Education, Inc.
3-63
Potential Sources of a Bond’s Dollar Return(continued)
Yield To Maturity and Reinvestment Risk For a given yield to maturity and a given coupon
rate, the longer the maturity, the more dependent the bond’s total dollar return is on the interest-on-interest component in order to realize the yield to maturity at the time of purchase.
For a given maturity and a given yield to maturity, higher coupon rates will make the bond’s total dollar return more dependent on the reinvestment of the coupon payments in order to produce the yield to maturity anticipated at the time of purchase.

Copyright © 2016 Pearson Education, Inc.
3-64
Potential Sources of a Bond’s Dollar Return(continued)
Cash Flow Yield and Reinvestment Risk For amortizing securities, reinvestment risk is even greater
than for nonamortizing securities. The reason is that the investor must now reinvest the periodic
principal repayments in addition to the periodic coupon interest payments.
Typically, for nonamortizing securities the borrower can accelerate the periodic principal repayment, in particular, a borrower will tend to prepay when interest rates decline.
If a borrower prepays when interest rates decline, the investor faces greater reinvestment risk because he or she must reinvest the prepaid principal at a lower interest rate.
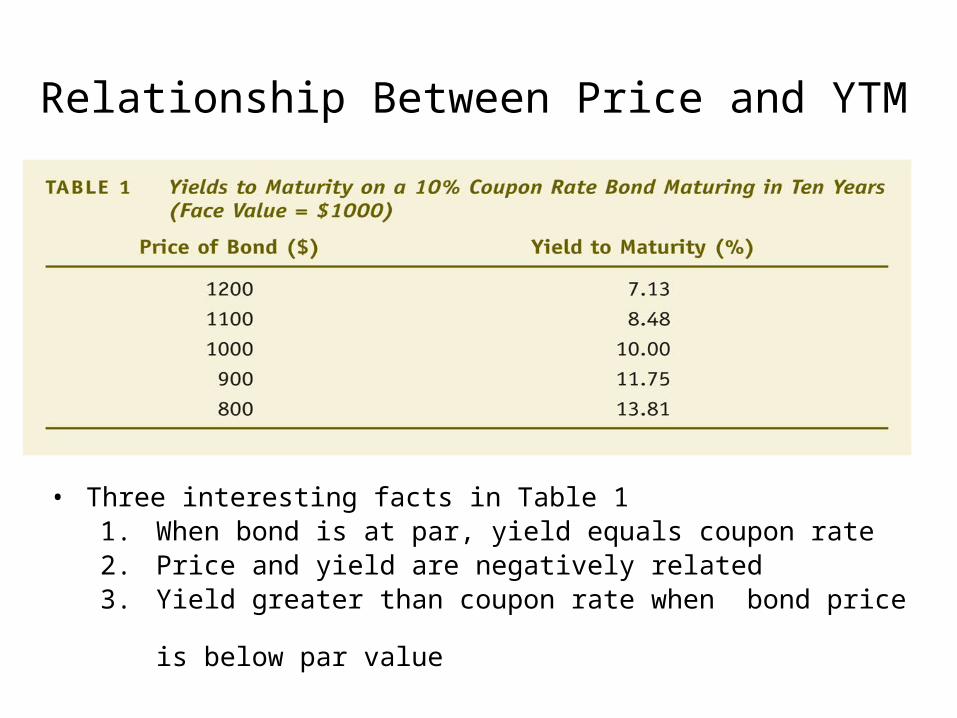
Relationship Between Price and YTM
• Three interesting facts in Table 11. When bond is at par, yield equals coupon rate2. Price and yield are negatively related3. Yield greater than coupon rate when bond price
is below par value

BONDS, THE ECONOMY & DETERMINATION OF INTEREST RATES

SUPPLY AND DEMAND ANALYSIS OF BOND MARKET

SHIFTS IN DEMAND CURVE
Figure 4.3 Shifts in the Demand Curve for Bonds

FACTORS SHIFTING DEMAND CURVE
1. Wealth• Economy , wealth , Bd , Bd shifts out to right
2. Expected Return• i in future, Re for long-term bonds , Bd shifts
out to right (recall: -ve rel between p and i)• πe , real return , Bd shifts out to right
3. Risk• Risk of bonds , Bd , Bd shifts out to right• Risk of other assets , Bd , Bd shifts out to right
4. Liquidity• Liquidity of bonds , Bd , Bd shifts out to right• Liquidity of other assets , Bd ,Bd shifts out to
right 69
SUMMARY OF SHIFTS IN DEMAND FOR BONDS
1. Wealth: in a business cycle expansion with growing wealth, demand for bonds rises, conversely, in a recession, when income and wealth are falling, demand for bonds falls
2. Expected returns: lower expected interest rates in future increase demand for long-term bonds, in contrast, higher expected interest rates in future decrease the demand for long-term bonds
3. Risk: an increase in riskiness of bonds causes demand for bonds to fall, conversely, an increase in riskiness of alternative assets (like stocks) causes demand for bonds to rise
3. Liquidity: increased liquidity of bond market results in an increased demand for bonds, conversely, increased liquidity of alternative asset markets (like stock market) lowers demand for bonds
70

SHIFTS IN SUPPLY CURVE
1. Profitability of Investment Opportunities
Business cycle expansion, investment opportunities , Bs , Bs shifts out to right
2. Expected Inflationπe (real cost of borrowing ), Bs , Bs shifts out to right
3. Government Activities
Deficits , Bs , Bs shifts out to right
Figure 4.4 Shift in the Supply Curve for Bonds

SUMMARY OF SHIFTS IN SUPPLY OF BONDS
1. Expected Profitability of Investment Opportunities: in a business cycle expansion, supply of bonds increases, conversely, in a recession, when there are far fewer expected profitable investment opportunities, supply of bonds falls
2. Expected Inflation: an increase in expected inflation causes supply of bonds to increase
3. Government Activities: higher government deficits increase supply of bonds, conversely, government surpluses decrease supply of bonds
72
