efficient chemical synthesis of human complement protein c3a · calc: 2838.3 da (average isotope...
TRANSCRIPT
S1
Supporting Information
Efficient chemical synthesis of human complement protein C3a
Artin Ghassemian‡, †, Ching-I Anderson Wang‡, Mei-Kwan Yau, Robert C. Reid,
Richard J. Lewis, David P. Fairlie, Paul F. Alewood, and Thomas Durek
Division of Chemistry and Structural Biology, Institute for Molecular Bioscience,
The University of Queensland, St Lucia, Brisbane, Queensland, Australia 4072
Corresponding author: Thomas Durek, Division of Chemistry and Structural
Biology, Institute for Molecular Bioscience, The University of Queensland, St
Lucia, Brisbane, Queensland, Australia 4072
Email: [email protected]
Telephone: +61-7-3346-2985 Fax: +61-7-3346-2090
‡ these authors contributed equally † present address: McMaster University, Hamilton, ON, Canada, L8S 4L8
Electronic Supplementary Material (ESI) for Chemical CommunicationsThis journal is © The Royal Society of Chemistry 2013
S2
METHODS & MATERIALS Peptide synthesis Reduced C3a was manually synthesized step-wise on a 0.5 mmol scale in three
segments consisting of C3a(1-22)-α-thioester, C3a(23-48)-α-thioester and
C3a(49-77). C3a(1-22)-α-thioester and C3a(23-48)-α-thioester were synthesized
on trityl-associated mercaptopropionic acid leucine and trityl-associated
mercaptopropionic acid arginine resins respectively to yield activated C-terminal
α-thioesters upon HF cleavage.1 S-trityl was removed with two 1 minute washes
of 2.5% (v/v) triisopropylsilane and 2.5% (v/v) water in TFA. C3a(49-77) was
synthesized on a Boc-Arg-Pam resin. Peptide coupling was carried out according
to in situ neutralization protocols.2 Coupling efficiencies were measured using the
quantitative ninhydrin test.3 Couplings with yields of lower than 99.5% were
double coupled. Boc-protected amino acids were used with the following side
chain protecting groups: D(Chxl); E(Chxl); H(DNP); K(Clz); N(Xan); Q(Xan);
R(Tos); S(Bzl); T(Bzl); Y(BrZ). All cysteine residues were protected with MeBzl
except for C23, which was incorporated into the peptide as 1,3-thiazolidine-4-
carboxylic acid (Thz).4,5 Thz was used in place of cysteine due to unwanted
reactivity during ligation and easy conversion to cysteine using methoxyamine.5
After chain assembly, DNP groups of C3a(49-77) were removed by stirring the
resin twice with 10 mL of 20% 2-mercaptoethanol:10% DIEA in DMF for 30
minutes each time, draining the resin and flow washing with DMF in between.
Resins were flow washed with DCM for 1 min and dried under vacuum prior to
HF cleavage. Simultaneous side chain removal and cleavage of peptides from
the dried resins were carried out with 9 mL of HF and1 mL p-cresol as scavenger
for 1 hour at 0°C. Cleaved peptides were precipitated and washed twice with cold
diethyl ether. The peptides were then dissolved in 50% acetonitrile, 0.1% TFA
(v/v) in water and lyophilized. C3a(1-22) was dissolved in 10% acetonitrile/0.1%
TFA in water and purified by preparative reverse-phase (RP) HPLC, while
C3a(23-48) and C3a(49-77) were dissolved in 6M guanidine(Gdn)•HCl and
purified. HPLC fractions were characterized by analytical HPLC-UV and
Electronic Supplementary Material (ESI) for Chemical CommunicationsThis journal is © The Royal Society of Chemistry 2013

S3
electrospray ionization MS (ESI-MS). Fractions containing the desired peptide
and similar purity were pooled, lyophilized and stored at -20ºC.
Figure 1: RP–HPLC analysis of crude C3a peptides after HF cleavage. A:
C3a(1-22)-α-thioester B: C3a(23-48)-α-thioester and C: C3a(49-77). HPLC
elution was achieved using a linear gradient of 0-45% of solvent B in solvent A
over 45 mins at 40°C with a flow rate of 1.0 mL/min (A – 0.05% TFA in water, B –
90% acetonitrile/0.043% TFA in water). Column: Agilent Zorbax 300SB, C18 (4.6
x 250 mm, 5 µm).
Electronic Supplementary Material (ESI) for Chemical CommunicationsThis journal is © The Royal Society of Chemistry 2013
S4
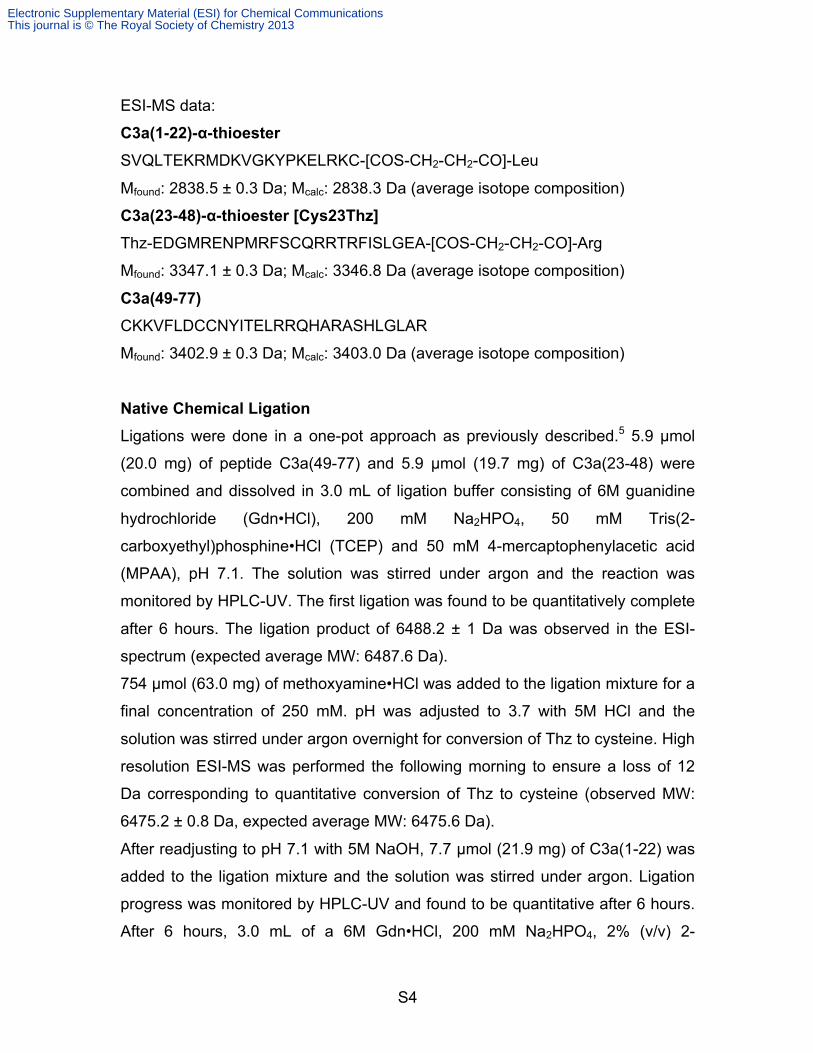
ESI-MS data:
C3a(1-22)-α-thioester SVQLTEKRMDKVGKYPKELRKC-[COS-CH2-CH2-CO]-Leu
Mfound: 2838.5 ± 0.3 Da; Mcalc: 2838.3 Da (average isotope composition)
C3a(23-48)-α-thioester [Cys23Thz] Thz-EDGMRENPMRFSCQRRTRFISLGEA-[COS-CH2-CH2-CO]-Arg
Mfound: 3347.1 ± 0.3 Da; Mcalc: 3346.8 Da (average isotope composition)
C3a(49-77) CKKVFLDCCNYITELRRQHARASHLGLAR
Mfound: 3402.9 ± 0.3 Da; Mcalc: 3403.0 Da (average isotope composition)
Native Chemical Ligation Ligations were done in a one-pot approach as previously described.5 5.9 µmol
(20.0 mg) of peptide C3a(49-77) and 5.9 µmol (19.7 mg) of C3a(23-48) were
combined and dissolved in 3.0 mL of ligation buffer consisting of 6M guanidine
hydrochloride (Gdn•HCl), 200 mM Na2HPO4, 50 mM Tris(2-
carboxyethyl)phosphine•HCl (TCEP) and 50 mM 4-mercaptophenylacetic acid
(MPAA), pH 7.1. The solution was stirred under argon and the reaction was
monitored by HPLC-UV. The first ligation was found to be quantitatively complete
after 6 hours. The ligation product of 6488.2 ± 1 Da was observed in the ESI-
spectrum (expected average MW: 6487.6 Da).
754 µmol (63.0 mg) of methoxyamine•HCl was added to the ligation mixture for a
final concentration of 250 mM. pH was adjusted to 3.7 with 5M HCl and the
solution was stirred under argon overnight for conversion of Thz to cysteine. High
resolution ESI-MS was performed the following morning to ensure a loss of 12
Da corresponding to quantitative conversion of Thz to cysteine (observed MW:
6475.2 ± 0.8 Da, expected average MW: 6475.6 Da).
After readjusting to pH 7.1 with 5M NaOH, 7.7 µmol (21.9 mg) of C3a(1-22) was
added to the ligation mixture and the solution was stirred under argon. Ligation
progress was monitored by HPLC-UV and found to be quantitative after 6 hours.
After 6 hours, 3.0 mL of a 6M Gdn•HCl, 200 mM Na2HPO4, 2% (v/v) 2-
Electronic Supplementary Material (ESI) for Chemical CommunicationsThis journal is © The Royal Society of Chemistry 2013
� S5
mercaptoethanol solution, pH 8.1 was then added to the ligation mixture and the
solution was stirred under argon for 20 minutes. Fresh TCEP was then added to
a concentration of 20 mM and stirred for a further 20 minutes under argon. 60 µL
of TFA was added to the mixture for a 1% (v/v) TFA solution. The solution was
then syringe filtered and analyzed by ESI-MS for reduced C3a (observed MW:
9095.4±1.8 Da, expected average MW: 9094.8 Da,). Reduced C3a was purified
by RP-HPLC on a Agilent Zorbax 300SB, C3 column (9.4 x 250 mm, 5 µm).
Fractions containing the desired product were lyophilized and stored at -20ºC.
Yield: 41% (2.4 µmol/22.2 mg).
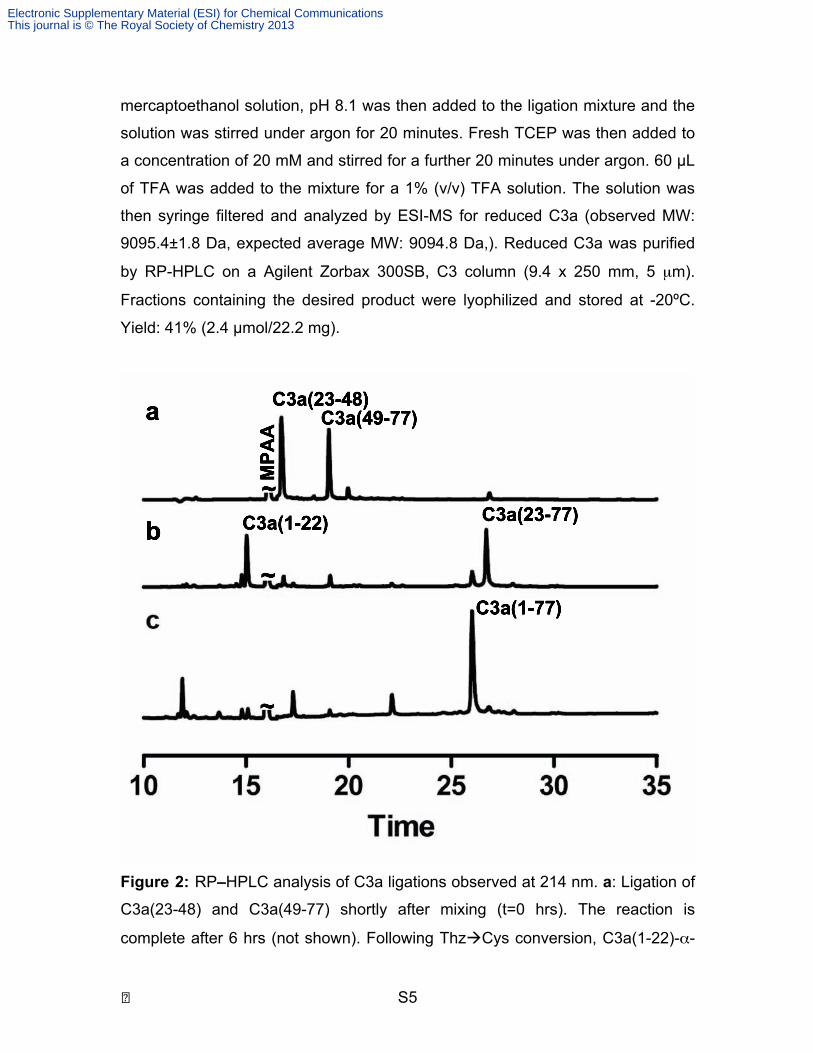
Figure 2: RP–HPLC analysis of C3a ligations observed at 214 nm. a: Ligation of
C3a(23-48) and C3a(49-77) shortly after mixing (t=0 hrs). The reaction is
complete after 6 hrs (not shown). Following ThzCys conversion, C3a(1-22)-α-
Electronic Supplementary Material (ESI) for Chemical CommunicationsThis journal is © The Royal Society of Chemistry 2013
S6
thioester was added and the pH readjusted to pH 7.1 b: Ligation shortly after
addition of C3a(1-22). c: The ligation of C3a(1-22) and C3a(23-77) reaches
completion after 6 hours. HPLC elution was achieved using a linear gradient of
10-55% of solvent B in solvent A over 32 mins at 40°C with a flow rate of 1.0
mL/min (A – 0.05% TFA in water, B – 90% acetonitrile/0.043% TFA in water).
Column: Agilent Zorbax 300SB, C18 (4.6 x 250 mm, 5 µm).
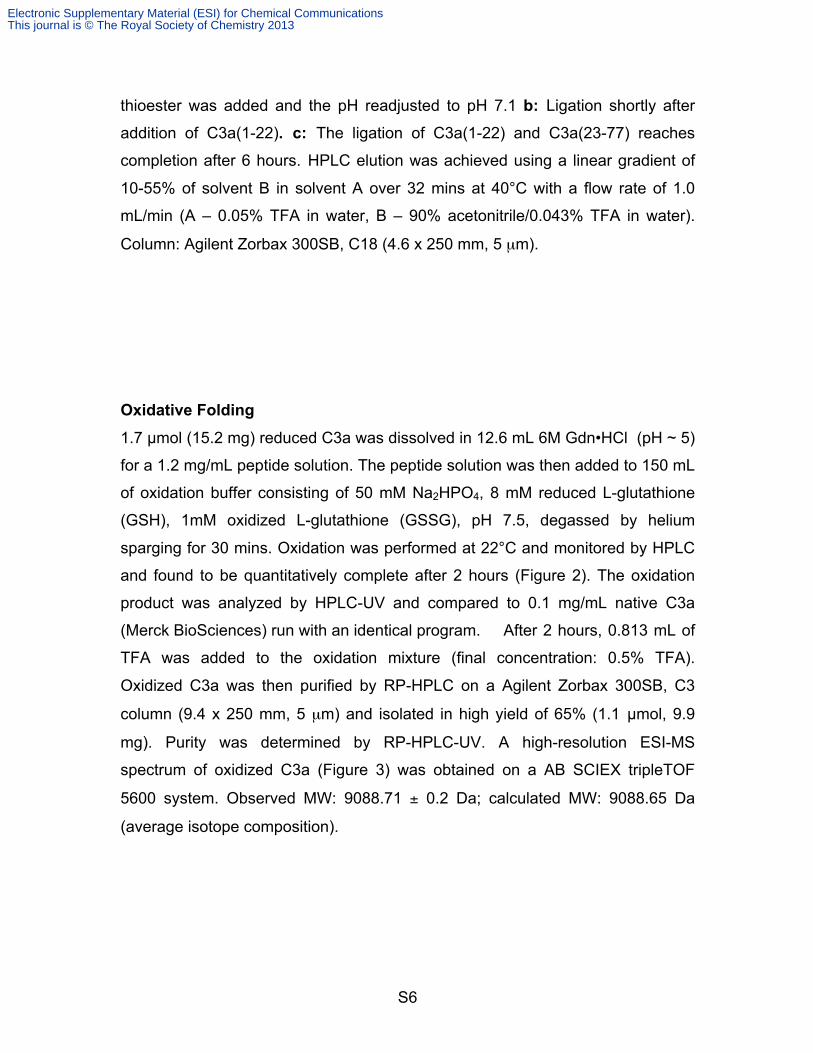
Oxidative Folding 1.7 µmol (15.2 mg) reduced C3a was dissolved in 12.6 mL 6M Gdn•HCl (pH ~ 5)
for a 1.2 mg/mL peptide solution. The peptide solution was then added to 150 mL
of oxidation buffer consisting of 50 mM Na2HPO4, 8 mM reduced L-glutathione
(GSH), 1mM oxidized L-glutathione (GSSG), pH 7.5, degassed by helium
sparging for 30 mins. Oxidation was performed at 22°C and monitored by HPLC
and found to be quantitatively complete after 2 hours (Figure 2). The oxidation
product was analyzed by HPLC-UV and compared to 0.1 mg/mL native C3a
(Merck BioSciences) run with an identical program. After 2 hours, 0.813 mL of
TFA was added to the oxidation mixture (final concentration: 0.5% TFA).
Oxidized C3a was then purified by RP-HPLC on a Agilent Zorbax 300SB, C3
column (9.4 x 250 mm, 5 µm) and isolated in high yield of 65% (1.1 µmol, 9.9
mg). Purity was determined by RP-HPLC-UV. A high-resolution ESI-MS
spectrum of oxidized C3a (Figure 3) was obtained on a AB SCIEX tripleTOF
5600 system. Observed MW: 9088.71 ± 0.2 Da; calculated MW: 9088.65 Da
(average isotope composition).
Electronic Supplementary Material (ESI) for Chemical CommunicationsThis journal is © The Royal Society of Chemistry 2013
S7
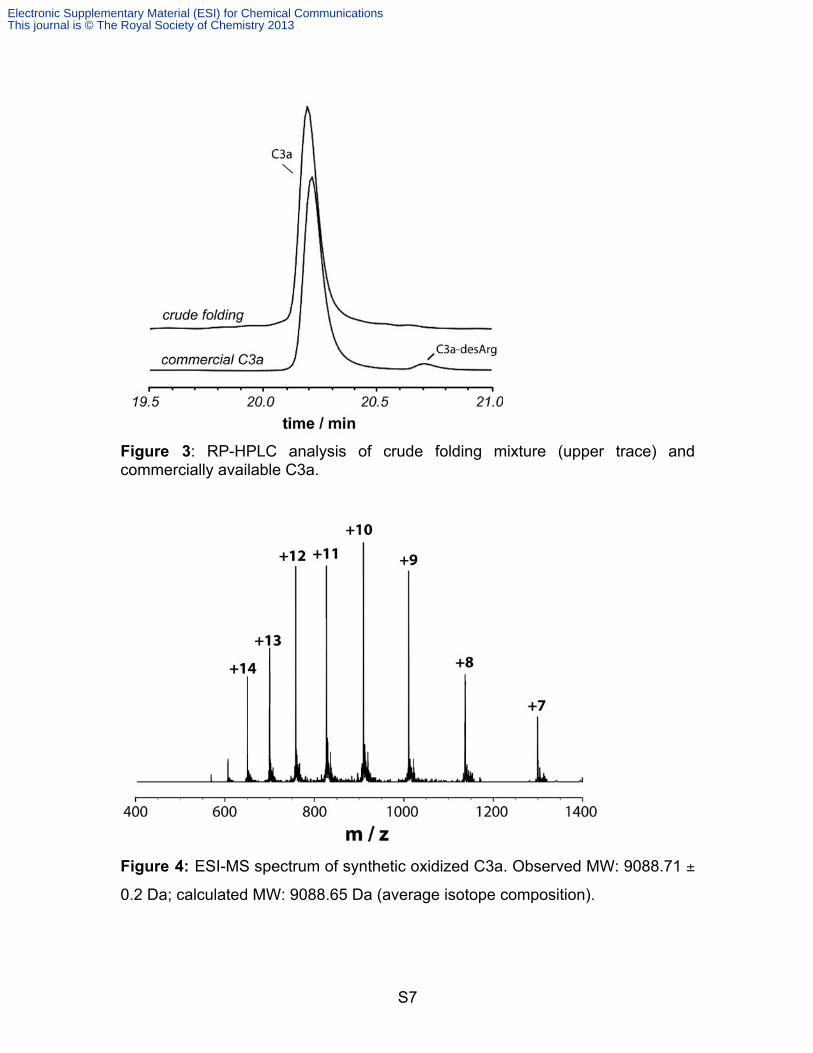
Figure 3: RP-HPLC analysis of crude folding mixture (upper trace) and commercially available C3a.
Figure 4: ESI-MS spectrum of synthetic oxidized C3a. Observed MW: 9088.71 ±
0.2 Da; calculated MW: 9088.65 Da (average isotope composition).
Electronic Supplementary Material (ESI) for Chemical CommunicationsThis journal is © The Royal Society of Chemistry 2013
S8
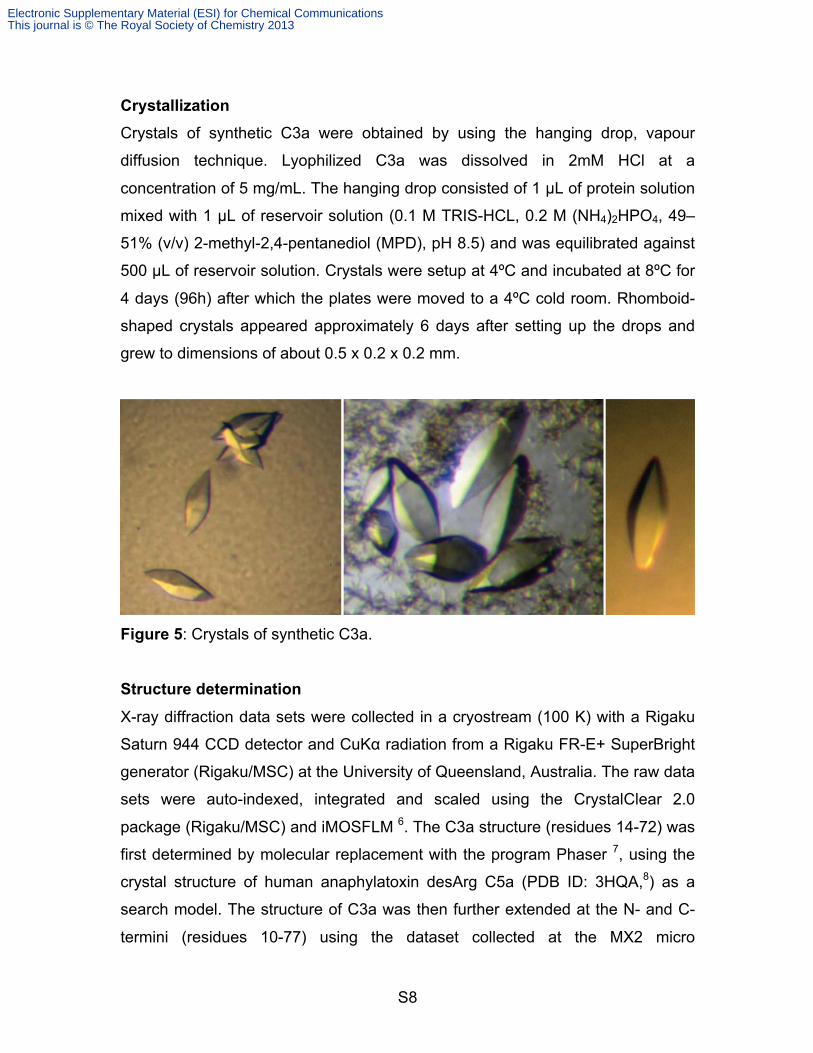
Crystallization Crystals of synthetic C3a were obtained by using the hanging drop, vapour
diffusion technique. Lyophilized C3a was dissolved in 2mM HCl at a
concentration of 5 mg/mL. The hanging drop consisted of 1 µL of protein solution
mixed with 1 µL of reservoir solution (0.1 M TRIS-HCL, 0.2 M (NH4)2HPO4, 49–
51% (v/v) 2-methyl-2,4-pentanediol (MPD), pH 8.5) and was equilibrated against
500 µL of reservoir solution. Crystals were setup at 4ºC and incubated at 8ºC for
4 days (96h) after which the plates were moved to a 4ºC cold room. Rhomboid-
shaped crystals appeared approximately 6 days after setting up the drops and
grew to dimensions of about 0.5 x 0.2 x 0.2 mm.
Figure 5: Crystals of synthetic C3a.
Structure determination X-ray diffraction data sets were collected in a cryostream (100 K) with a Rigaku
Saturn 944 CCD detector and CuKα radiation from a Rigaku FR-E+ SuperBright
generator (Rigaku/MSC) at the University of Queensland, Australia. The raw data
sets were auto-indexed, integrated and scaled using the CrystalClear 2.0
package (Rigaku/MSC) and iMOSFLM 6. The C3a structure (residues 14-72) was
first determined by molecular replacement with the program Phaser 7, using the
crystal structure of human anaphylatoxin desArg C5a (PDB ID: 3HQA,8) as a
search model. The structure of C3a was then further extended at the N- and C-
termini (residues 10-77) using the dataset collected at the MX2 micro
Electronic Supplementary Material (ESI) for Chemical CommunicationsThis journal is © The Royal Society of Chemistry 2013
S9
crystallography beamline at the Australian Synchrotron. Buccaneer 9, Coot 10 and
Arp/Warp 11 were used for model building and manual adjustment, and
REFMAC5 12 was used for refinement until satisfactory model statistics were
obtained (Table 1). The final C3a model consists of 68 residues, one MPD and
19 water molecules. The structure quality analysis was done using Molprobity 13
and SFcheck 14 in the CCP4i program suite 15.
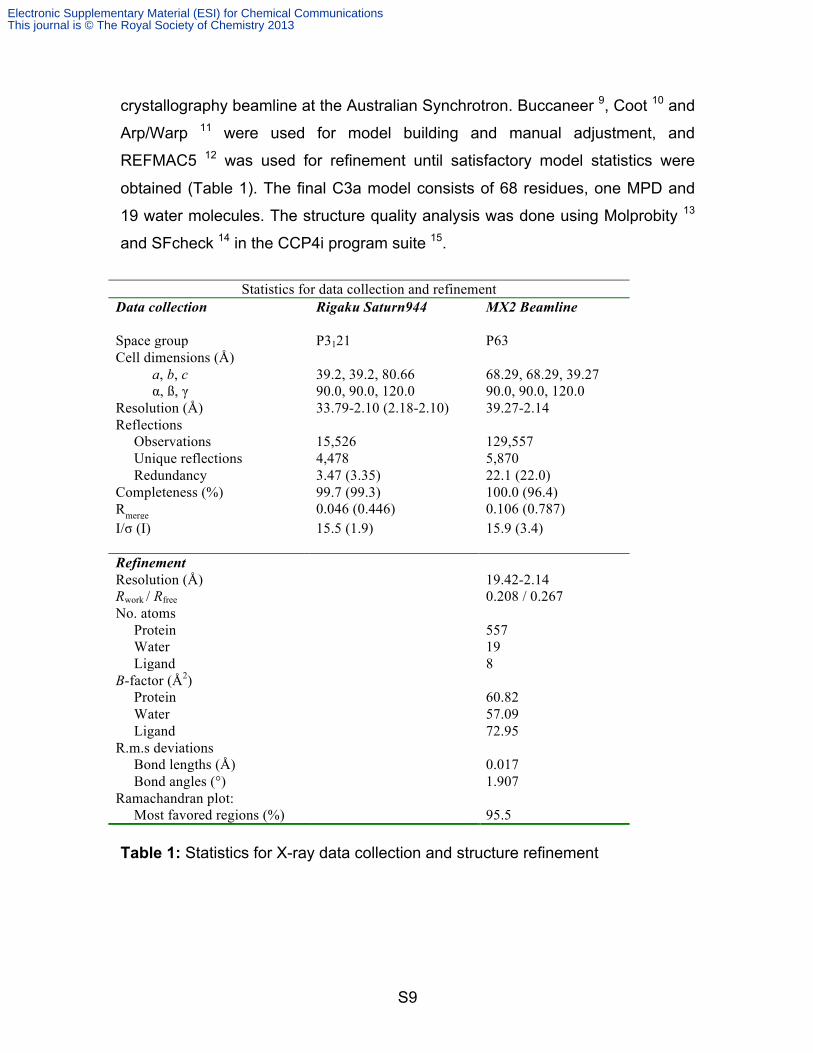
Statistics for data collection and refinement
Data collection Rigaku Saturn944 MX2 Beamline Space group P3121 P63 Cell dimensions (Å) a, b, c 39.2, 39.2, 80.66 68.29, 68.29, 39.27 α, ß, γ 90.0, 90.0, 120.0 90.0, 90.0, 120.0 Resolution (Å) 33.79-2.10 (2.18-2.10) 39.27-2.14 Reflections Observations
15,526
129,557
Unique reflections 4,478 5,870 Redundancy 3.47 (3.35) 22.1 (22.0) Completeness (%) 99.7 (99.3) 100.0 (96.4) Rmerge 0.046 (0.446) 0.106 (0.787) I/σ (I) 15.5 (1.9) 15.9 (3.4) Refinement Resolution (Å) 19.42-2.14 Rwork / Rfree 0.208 / 0.267 No. atoms Protein 557 Water 19 Ligand 8 B-factor (Å2) Protein 60.82 Water 57.09 Ligand 72.95 R.m.s deviations Bond lengths (Å) 0.017 Bond angles (°) 1.907 Ramachandran plot: Most favored regions (%) 95.5 Table 1: Statistics for X-ray data collection and structure refinement
Electronic Supplementary Material (ESI) for Chemical CommunicationsThis journal is © The Royal Society of Chemistry 2013
S10
Isolation of Human Monocyte-derived Macrophages (HMDM) Human monocyte-derived macrophages (HMDM) were isolated using Ficoll-
paque density centrifugation (GE healthcare Bio-Science, Uppsala, Sweden)
from buffy coat of anonymous human donors provided by Australian Red Cross
Blood Service, Brisbane. CD14+ monocytes were positively selected using
CD14+ MACS magnetic beads (Miltenyi Biotech, Auburn, CA, USA) after
successive magnetic sorting and washings. The CD14+ monocytes were then
cultured at 37°C, with 5% CO2 and differentiated to HMDM using 100 ng/mL of
recombinant human macrophage colony stimulating factor (M-CSF) (PeptroTech
Inc, Rocky Hill, New Jersey, USA) at 1.5 × 10⁶ cells/mL. HMDM were kept in
IMDM supplemented with 10% FBS, penicillin (10 U/mL), streptomycin (10 U/mL)
and L-glutamine (2 mM) (Invitrogen). HMDM were supplemented after 5 days
with fresh medium containing 100 ng/mL M-CSF. HMDM were harvested by
gentle scraping in saline solution on day 7.
Intracellular Calcium Release Assay HMDM were plated at 5 × 10⁴ cells/well in a 96-well cleared-bottom black-wall
assay plate (Corning) and incubated overnight at 37oC. Before assay, the
medium was removed and cells were incubated with dye-loading buffer (12 mL
assay buffer, 4 µM Fluo-3 AM, 25 µL Pluronic acid F-127 and 1% FBS) for an
hour at 37oC. After an hour, cells were washed once with assay buffer (HBSS
supplemented with 2.5 mM probenecid and 20 mM HEPES, pH 7.4). To
determine the agonist activity of C3a, the synthesised and the commercial C3a
protein (57 µM stock in PBS) were further diluted with HBSS buffer to the desired
concentrations for intracellular calcium release assay. For antagonist assay, the
C3a antagonist (SB290157)16 was diluted with HBSS buffer to give a range of
concentrations and then was pre-incubated with the cells for 15 min before the
addition of C3a agonist. FLIPR was used to monitor the intracellular release of
Ca2+ via fluorescence measurement for 5 min (excitation 495 nm, emission 520
nm). The intracellular Ca2+ release was monitored immediately for 5 min after the
injection of the desired concentration of the C3a. Duplicate measurements were
Electronic Supplementary Material (ESI) for Chemical CommunicationsThis journal is © The Royal Society of Chemistry 2013
� S11
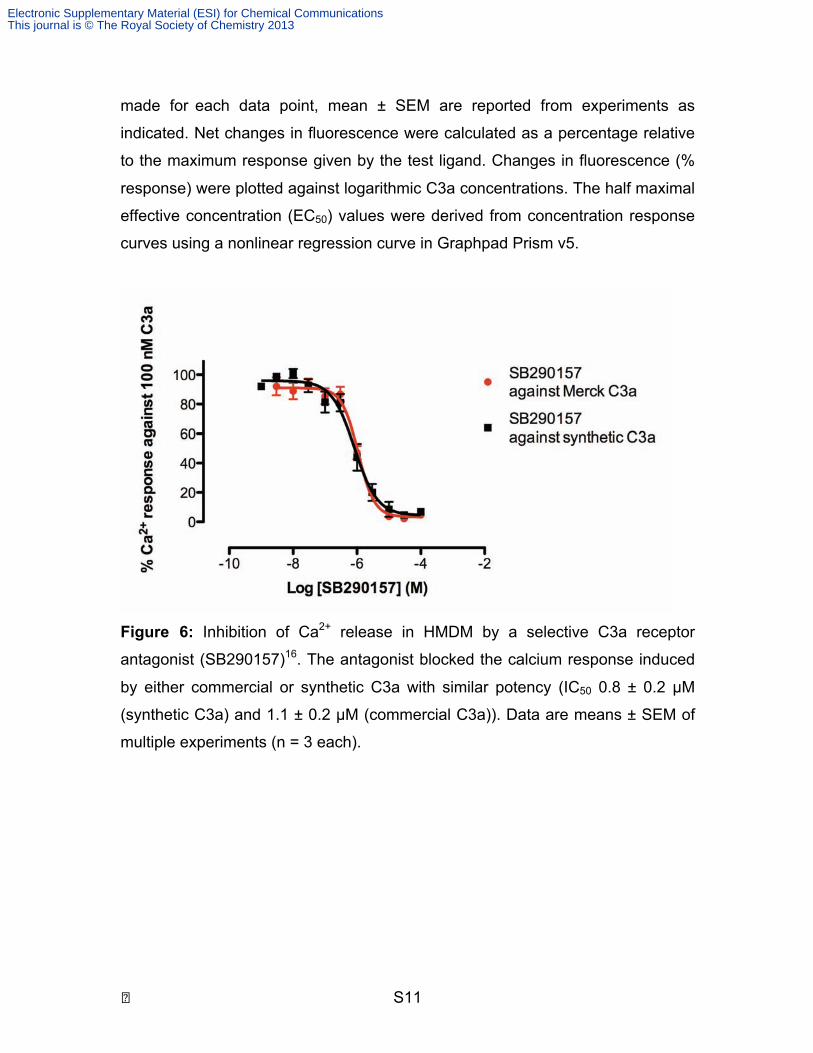
made for each data point, mean ± SEM are reported from experiments as
indicated. Net changes in fluorescence were calculated as a percentage relative
to the maximum response given by the test ligand. Changes in fluorescence (%
response) were plotted against logarithmic C3a concentrations. The half maximal
effective concentration (EC50) values were derived from concentration response
curves using a nonlinear regression curve in Graphpad Prism v5.
Figure 6: Inhibition of Ca2+ release in HMDM by a selective C3a receptor
antagonist (SB290157)16. The antagonist blocked the calcium response induced
by either commercial or synthetic C3a with similar potency (IC50 0.8 ± 0.2 µM
(synthetic C3a) and 1.1 ± 0.2 µM (commercial C3a)). Data are means ± SEM of
multiple experiments (n = 3 each).
Electronic Supplementary Material (ESI) for Chemical CommunicationsThis journal is © The Royal Society of Chemistry 2013

S12
Selectivity assays To test the selectivity of synthetic C3a, several desensitization assays were
carried out. HMDM cells were treated with 300 nM of commercial C3a ligand at t0
to desensitize the C3a receptor. In the first control assay, 1 µM of commercial
C3a was injected at t920 (s) to confirm C3aR desensitization (i.e. no calcium
release after second injection). Similarly, in the second control assay, 1 µM C5a
was injected at t920 (s) to show a second calcium response, indicating selective
desensitization of C3aR but not C5aR by commercial C3a. In subsequent
selectivity assays, 1 µM synthetic C3a was injected at t920 (s) and did not induce
a second calcium response. Identical results were observed in C3aR
desensitization with 300 nM synthetic C3a and injection of 1 µM synthetic C3a at
t920 (s), indicating selectivity of synthetic C3a to C3aR.
Figure 7: Desensitisation assays for synthetic C3a. (A) HMDM was treated with
commercial C3a ligand (300 nM) at t0 to desensitise the C3a receptor.
Commercial C3a at 1 µM was injected at t920 (s) to confirm C3aR desensitisation
(i.e. no calcium release after 2nd injection). (B) Similar to A, but C5a (1 µM ) was
0 500 1000 1500
1000
1500
2000
2500
3000
3500
Time (s)
Ca
2+ r
es
po
ns
e
300 nM Merck C3a
1 µM Merck C3a
0 500 1000 1500
1000
1500
2000
2500
3000
3500
Time (s)
Ca
2+ r
es
po
ns
e
300 nM Merck C3a
1 µM Syn C3a
0 500 1000 1500
1000
2000
3000
4000
Time (s)
Ca
2+ r
es
po
ns
e
300 nM Merck C3a
1 µM C5a
0 500 1000 1500
1000
2000
3000
4000
Time (s)
Ca
2+ r
es
po
ns
e
300 nM Syn C3a
1 µM Syn C3a
A
B
C
D
Electronic Supplementary Material (ESI) for Chemical CommunicationsThis journal is © The Royal Society of Chemistry 2013
S13
injected at t920 (s) showing a second calcium response, indicating that
commercial C3a only desensitises the C3a receptor and not the C5a receptor (or
other GPCRs). (C) After desensitisation with commerial C3a, the synthetic C3a
did not stimulate a second calcium response, suggesting it is selective to C3a.
(D) Instead of using commercial C3a for the 1st injection, synthetic C3a (300 nM)
was used to desensitise the C3aR. The synthetic C3a has similar effects as the
commerical C3a as shown in Fig. A.
Electronic Supplementary Material (ESI) for Chemical CommunicationsThis journal is © The Royal Society of Chemistry 2013

S14
[125I]-C3a Radioligand Binding Assay Receptor binding was performed by ligand competition with 80 pM [125I]-C3a
(2200 Ci/mmol; Perkin Elmer, Torrance, CA, USA), HMDM (1.2 × 10⁶ cells/mL),
80 pM [125I]-C3a with/without various concentrations of unlabeled C3a or C3a
non-peptidic agonist/antagonist, were mixed with solvent (50 mM Tris, 3 mM
MgCl2, 0.1 mM CaCl2, 0.5% (w/v) bovine serum albumin, pH 7.4) for 60 min in a
96-well Nunc round bottom plate at room temperature. Unbound [125I]-C3a was
removed by filtration through glass microfiber filter GF/B (Whatman Iner. Ltd,
England) which had been soaked in 0.6% polyethyleneimine to reduce non-
specific binding. The filter was washed 3 times with cold buffer (50 mM Tris-HCl)
pH 7.4 and bound [125I]-C3a was assessed by scintillation counting on a
Microbeta counter. Specific [125I]-C3a binding was defined as the difference
between total binding and non-specific binding as determined in the presence of
1 µM unlabeled C3a. The IC50 value was derived from the concentration of
agonist required to inhibit 50% of [125I]-C3a binding.
Electronic Supplementary Material (ESI) for Chemical CommunicationsThis journal is © The Royal Society of Chemistry 2013
S15
References (1) Hackeng, T. M.; Griffin, J. H.; Dawson, P. E. Proc. Natl. Acad. Sci. U. S. A. 1999, 96, 10068. (2) Schnölzer, M.; Alewood, P.; Jones, A.; Alewood, D.; Kent, S. B. Int. J. Pept. Protein Res. 1992, 40, 180. (3) Sarin, V. K.; Kent, S. B.; Tam, J. P.; Merrifield, R. B. Anal. Biochem. 1981, 117, 147. (4) Villain, M.; Vizzavona, J.; Rose, K. Chem. Biol. 2001, 8, 673. (5) Bang, D.; Kent, S. B. Angew. Chem. Int. Ed. 2004, 43, 2534. (6) Battye, T. G. G.; Kontogiannis, L.; Johnson, O.; Powell, H. R.; Leslie, A. G. W. Acta Crystallogr. Sect. D. Biol. Crystallogr. 2011, 67, 271. (7) Storoni, L. C.; McCoy, A. J.; Read, R. J. Acta Crystallogr. Sect. D. Biol. Crystallogr. 2004, 60, 432. (8) Cook, W. J.; Galakatos, N.; Boyar, W. C.; Walter, R. L.; Ealick, S. E. Acta Crystallogr. Sect. D. Biol. Crystallogr. 2010, 66, 190. (9) Cowtan, K. Acta Crystallogr. Sect. D. Biol. Crystallogr. 2008, 64, 83. (10) Emsley, P.; Lohkamp, B.; Scott, W. G.; Cowtan, K. Acta Crystallogr. Sect. D. Biol. Crystallogr. 2010, 66, 486. (11) Morris, R. J.; Perrakis, A.; Lamzin, V. S. Methods Enzymol. 2003, 374, 229. (12) Vagin, A. A.; Steiner, R. A.; Lebedev, A. A.; Potterton, L.; McNicholas, S.; Long, F.; Murshudov, G. N. Acta Crystallogr. Sect. D. Biol. Crystallogr. 2004, 60, 2184. (13) Chen, V. B.; Arendall, W. B.; Headd, J. J.; Keedy, D. A.; Immormino, R. M.; Kapral, G. J.; Murray, L. W.; Richardson, J. S.; Richardson, D. C. Acta Crystallogr. Sect. D. Biol. Crystallogr. 2010, 66, 12. (14) Vaguine, A. A.; Richelle, J.; Wodak, S. J. Acta Crystallogr. Sect. D. Biol. Crystallogr. 1999, 55, 191. (15) Potterton, E.; Briggs, P.; Turkenburg, M.; Dodson, E. Acta Crystallogr. Sect. D. Biol. Crystallogr. 2003, 59, 1131. (16) Ames, R. S.; Lee, D.; Foley, J. J.; Jurewicz, A. J.; Tornetta, M. A.; Bautsch, W.; Settmacher, B.; Klos, A.; Erhard, K. F.; Cousins, R. D.; Sulpizio, A. C.; Hieble, J. P.; McCafferty, G.; Ward, K. W.; Adams, J. L.; Bondinell, W. E.; Underwood, D. C.; Osborn, R. R.; Badger, A. M.; Sarau, H. M. J. Immunol. 2001, 166, 6341.
Electronic Supplementary Material (ESI) for Chemical CommunicationsThis journal is © The Royal Society of Chemistry 2013