efficiency measurement william greene stern school of business new york university
TRANSCRIPT

Efficiency Measurement
William GreeneStern School of BusinessNew York University

Lab Session 2
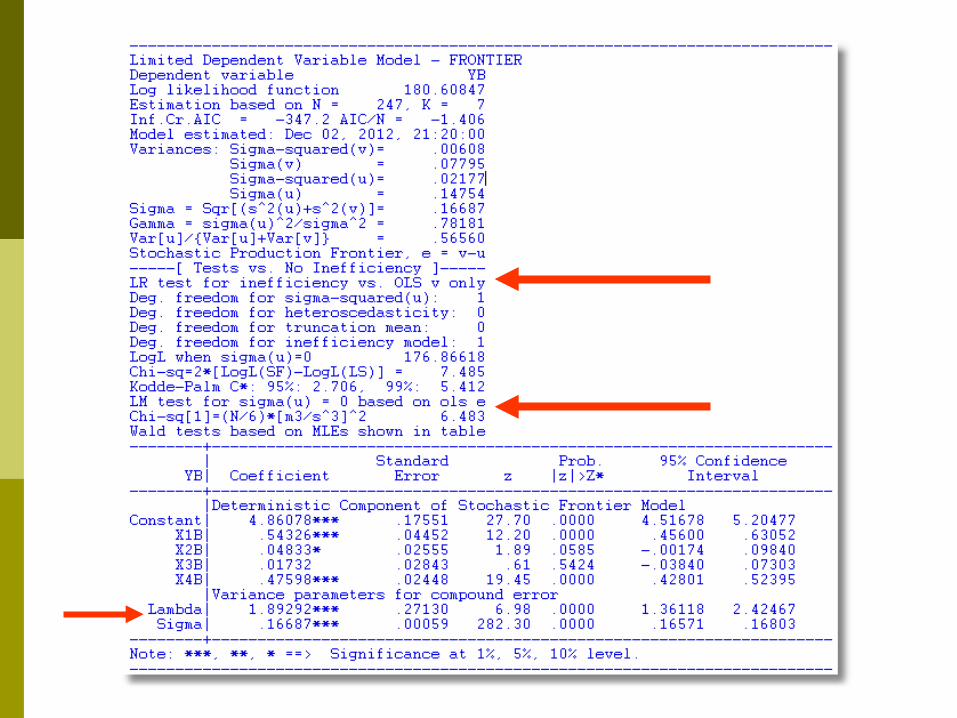
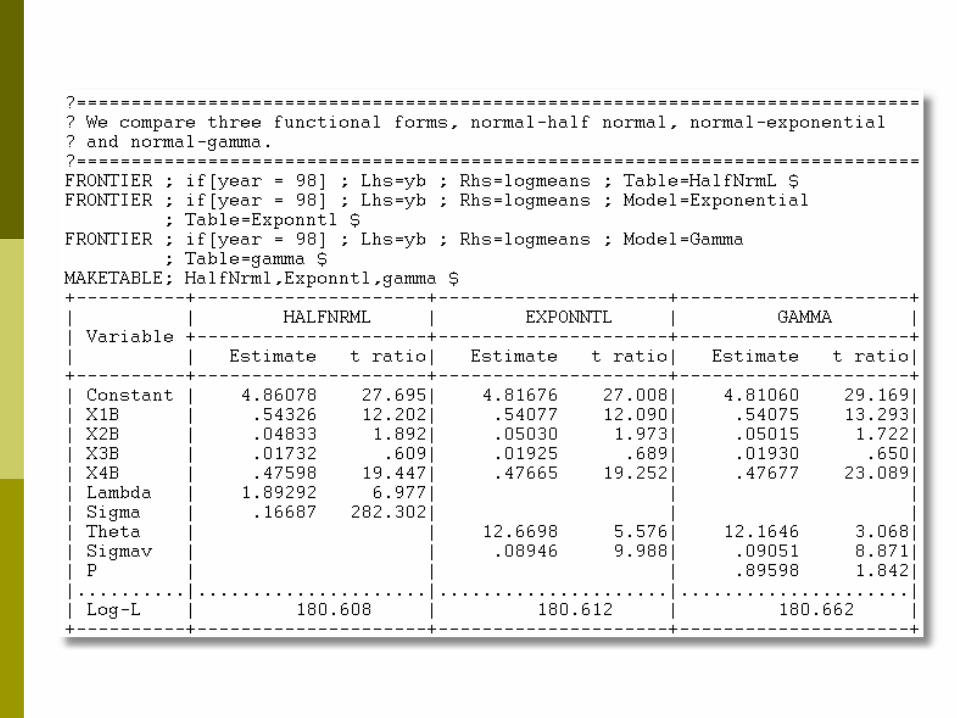
Stochastic Frontier Estimation
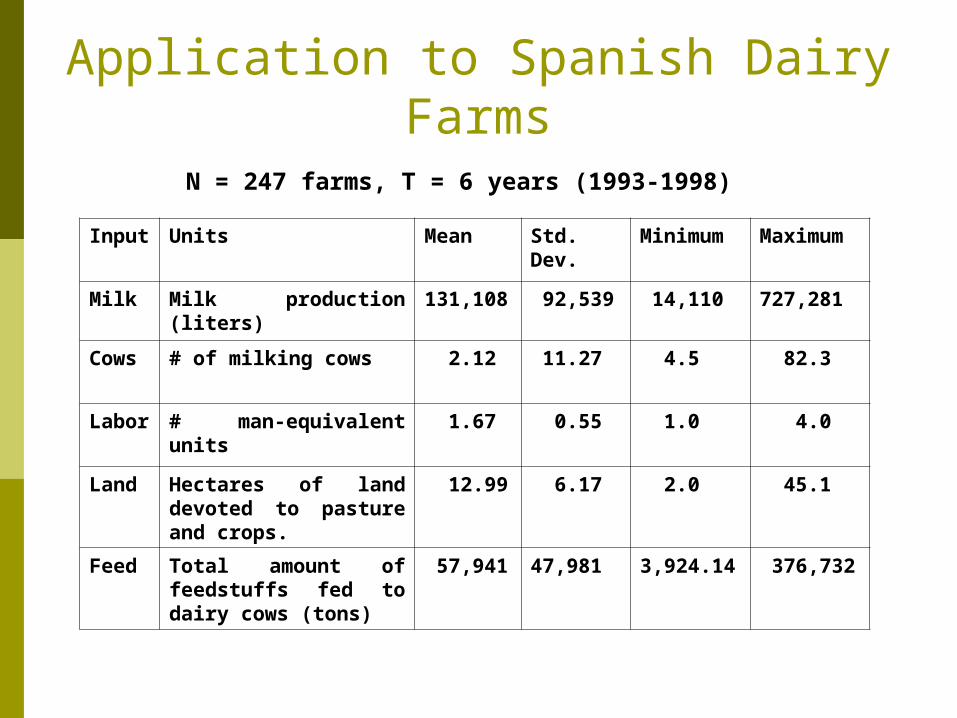
Application to Spanish Dairy Farms
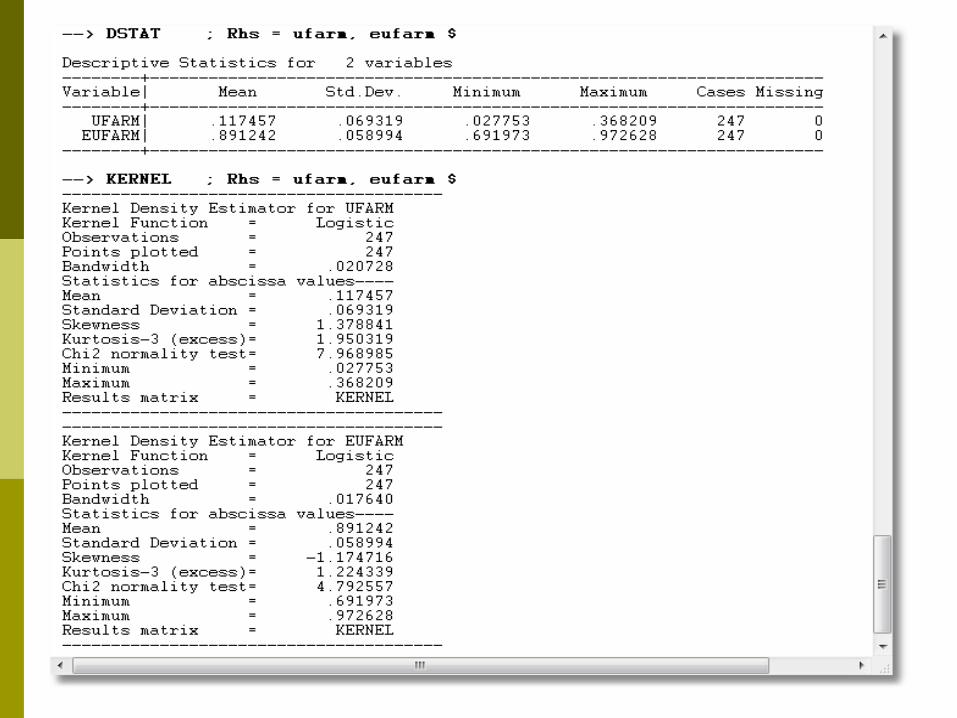
Input Units Mean Std. Dev.
Minimum
Maximum
Milk Milk production (liters)
131,108 92,539 14,110 727,281
Cows # of milking cows 2.12 11.27 4.5 82.3
Labor
# man-equivalent units
1.67 0.55 1.0 4.0
Land Hectares of land devoted to pasture and crops.
12.99 6.17 2.0 45.1
Feed Total amount of feedstuffs fed to dairy cows (tons)
57,941 47,981 3,924.14 376,732
N = 247 farms, T = 6 years (1993-1998)
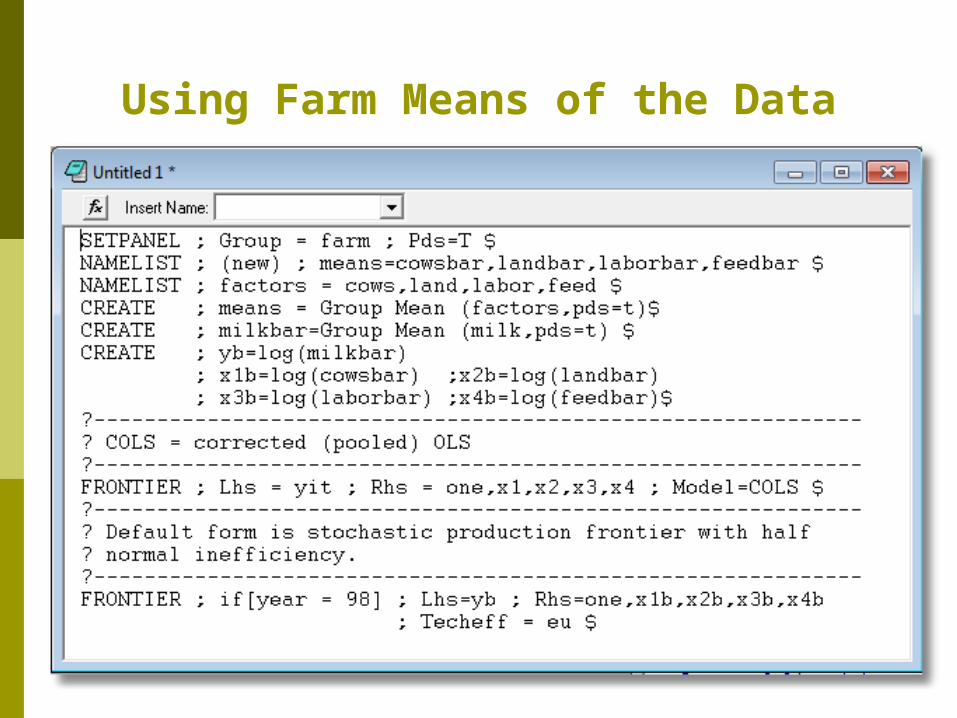
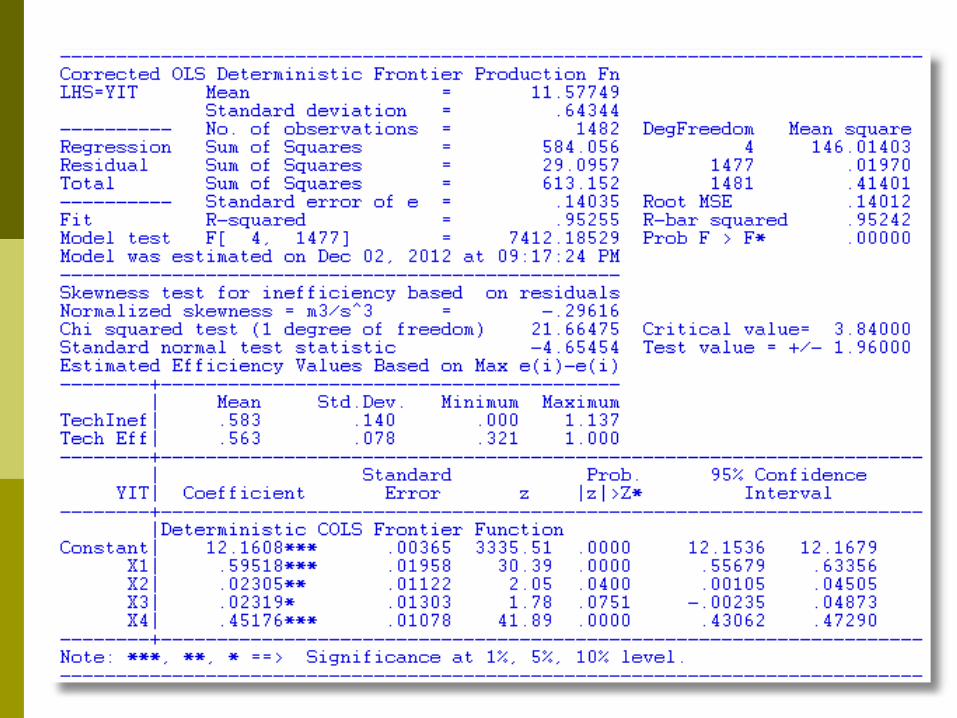
Using Farm Means of the Data
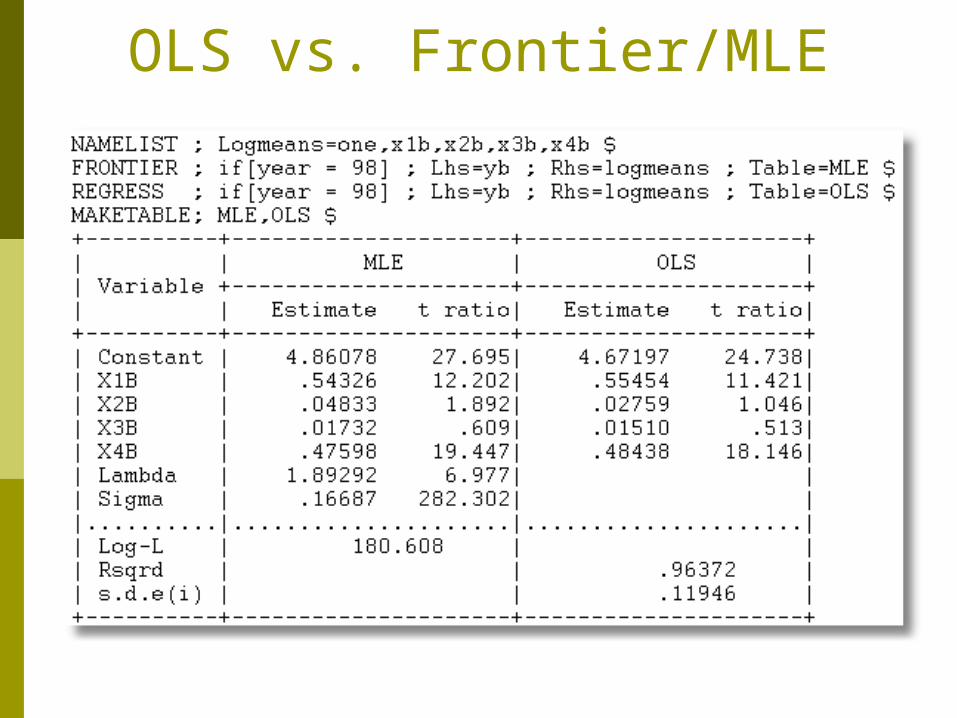
OLS vs. Frontier/MLE
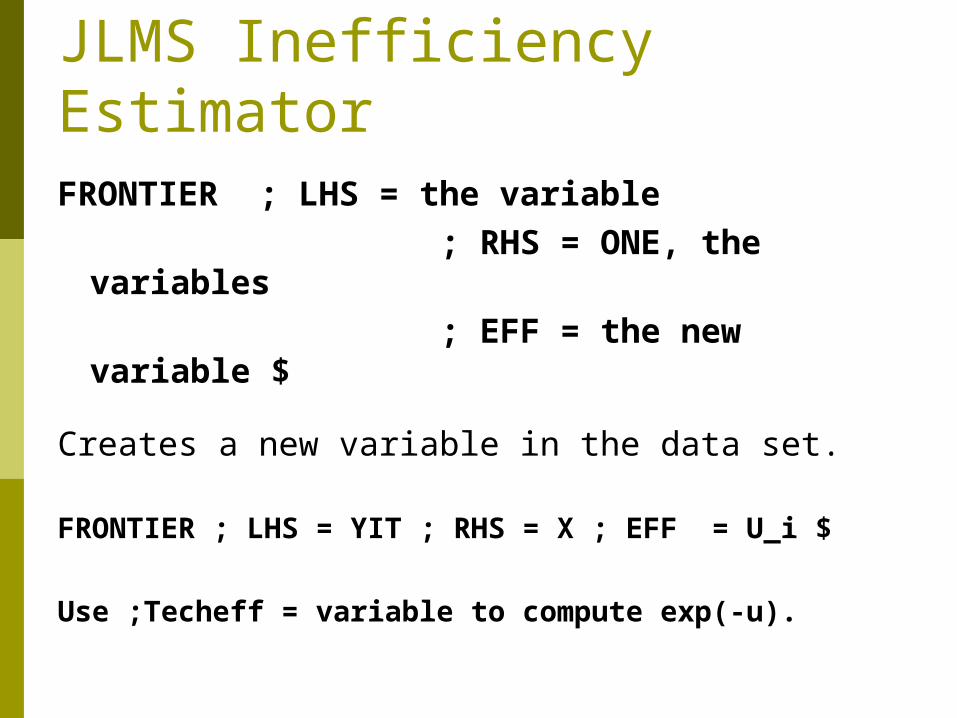
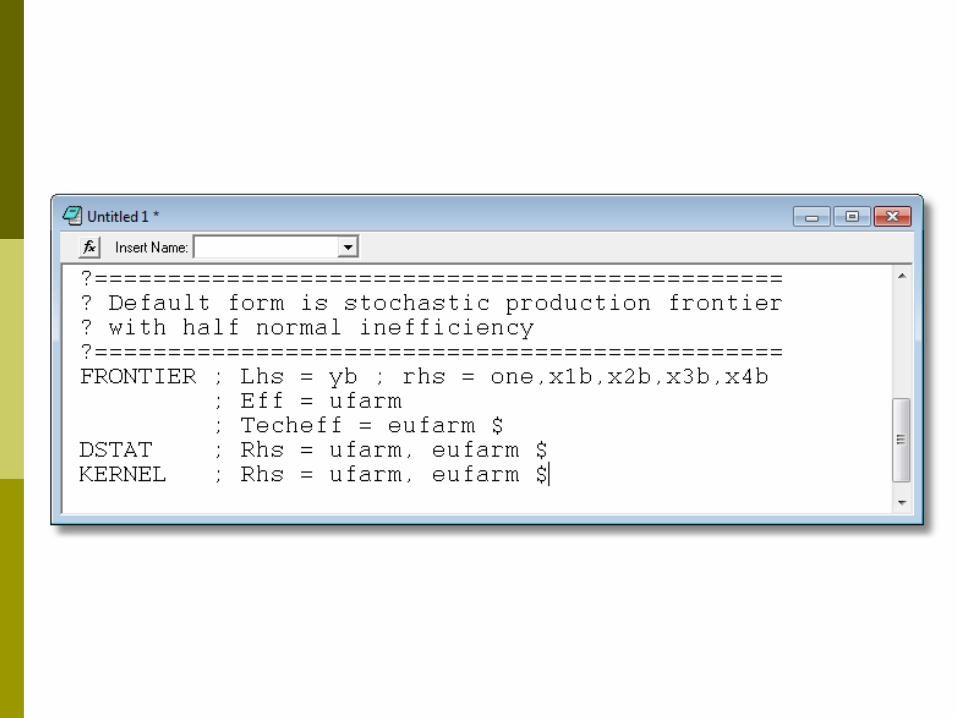
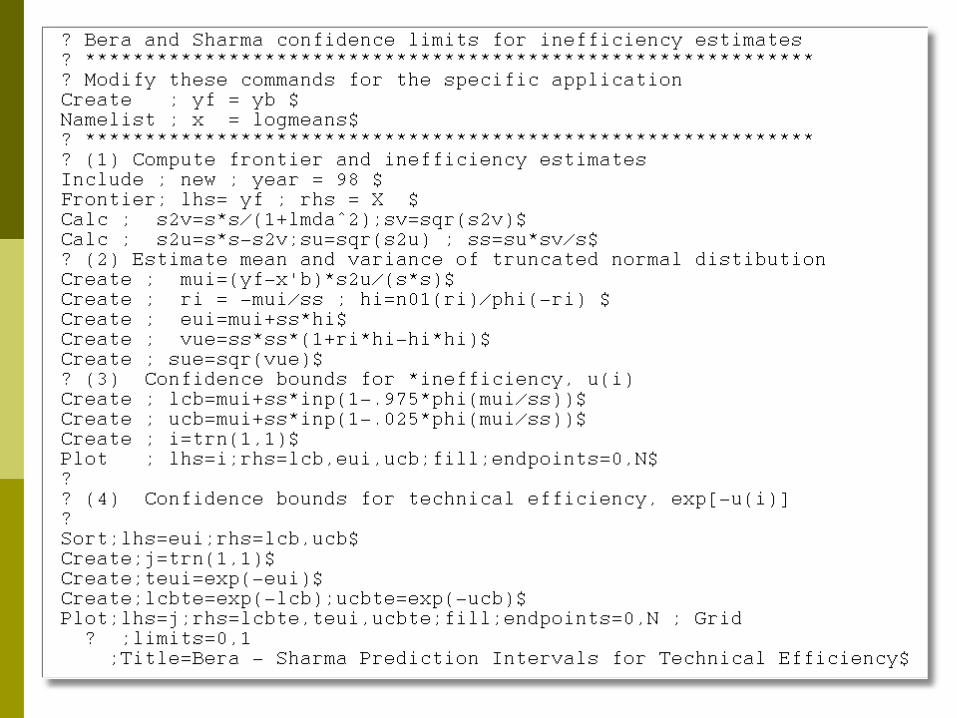
JLMS Inefficiency EstimatorFRONTIER ; LHS = the variable ; RHS = ONE, the variables ; EFF = the new variable $
Creates a new variable in the data set.
FRONTIER ; LHS = YIT ; RHS = X ; EFF = U_i $
Use ;Techeff = variable to compute exp(-u).
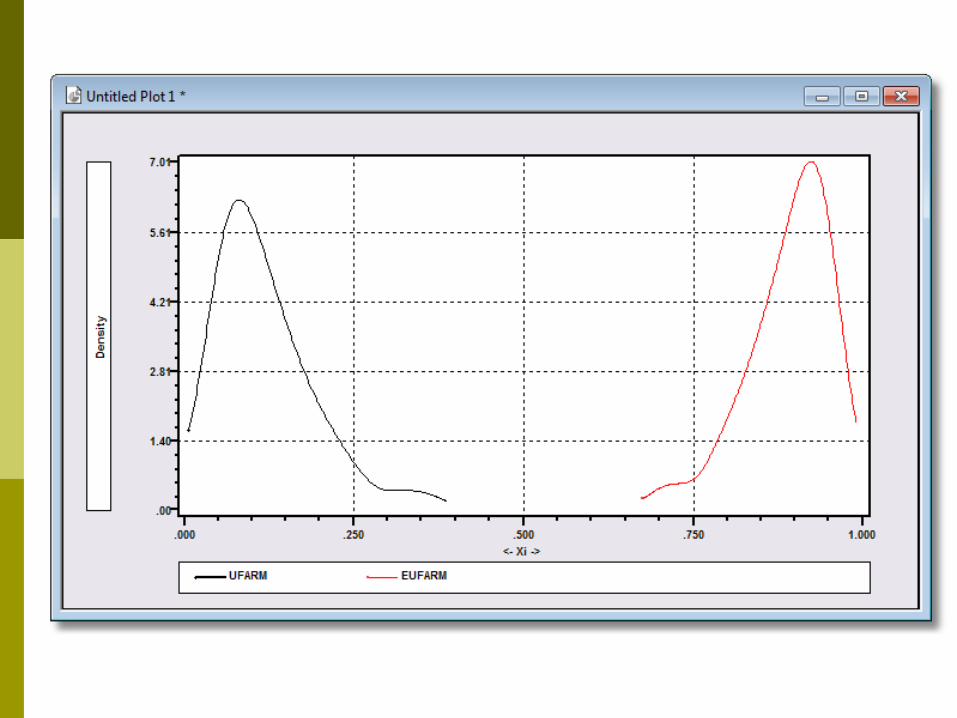
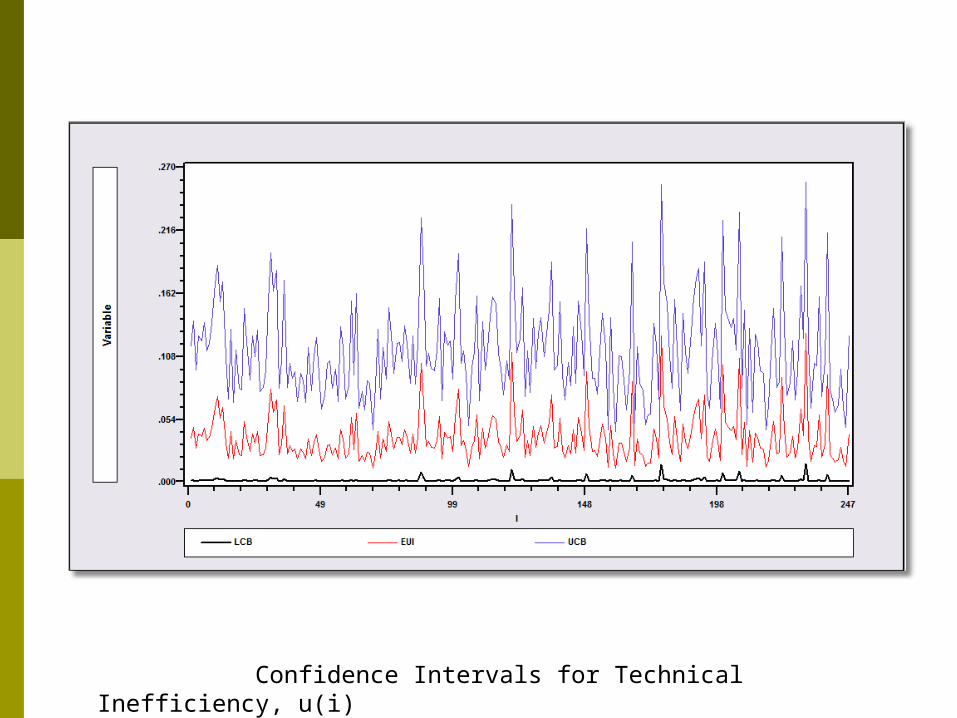
Confidence Intervals for Technical Inefficiency, u(i)
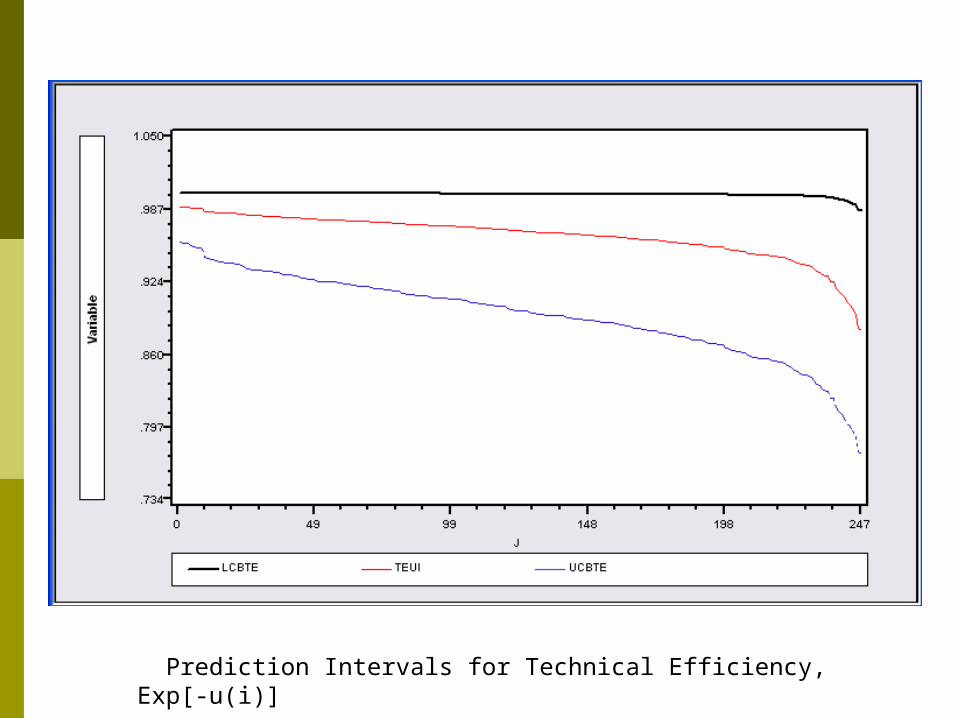
Prediction Intervals for Technical Efficiency, Exp[-u(i)]
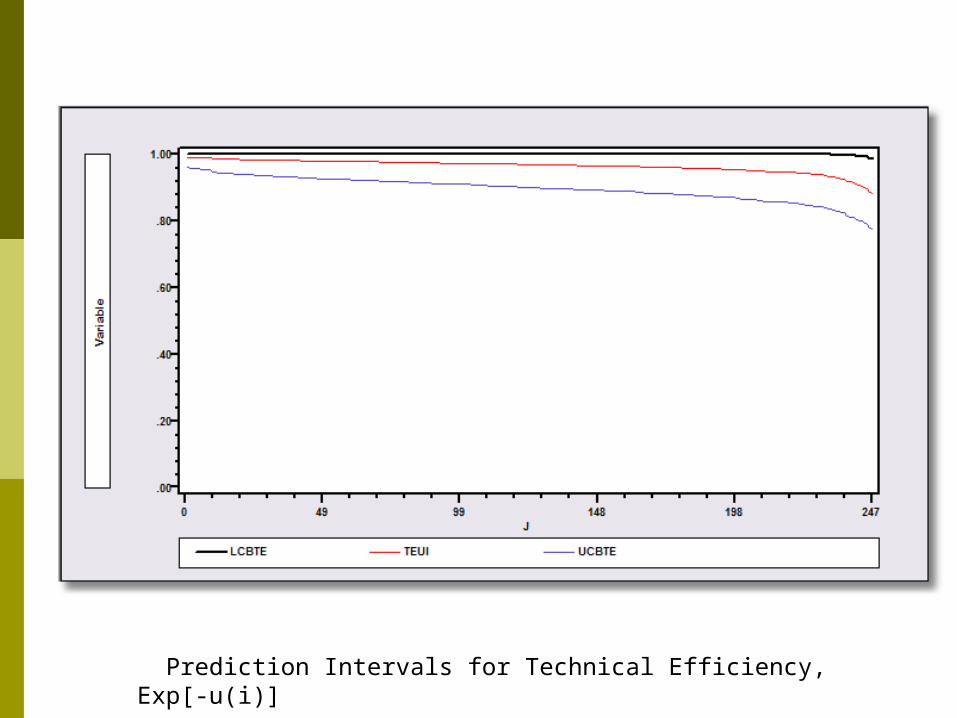
Prediction Intervals for Technical Efficiency, Exp[-u(i)]
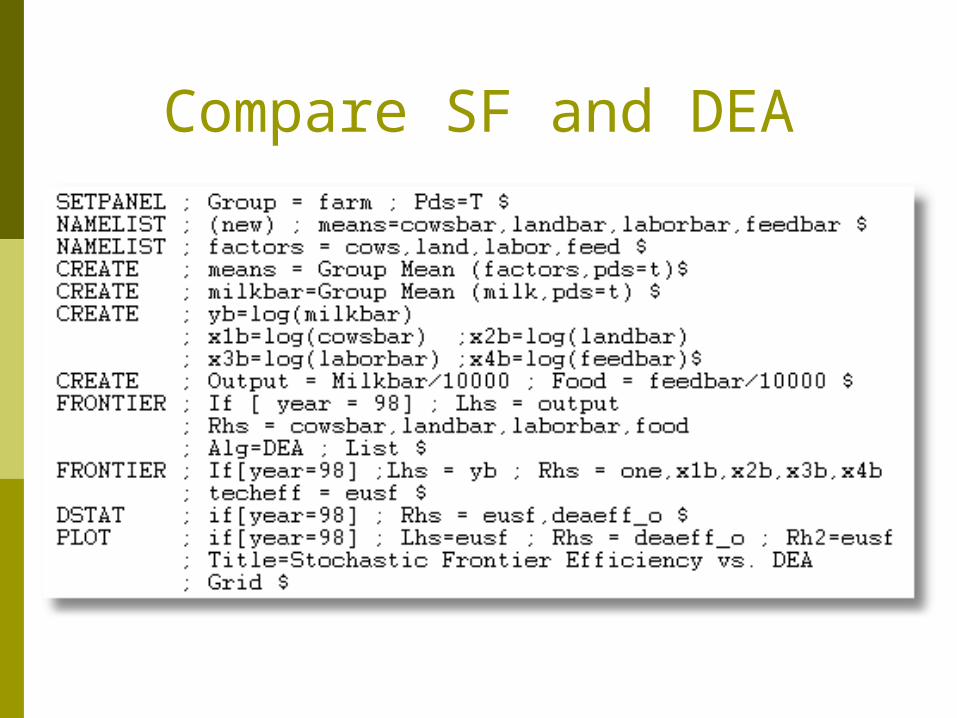
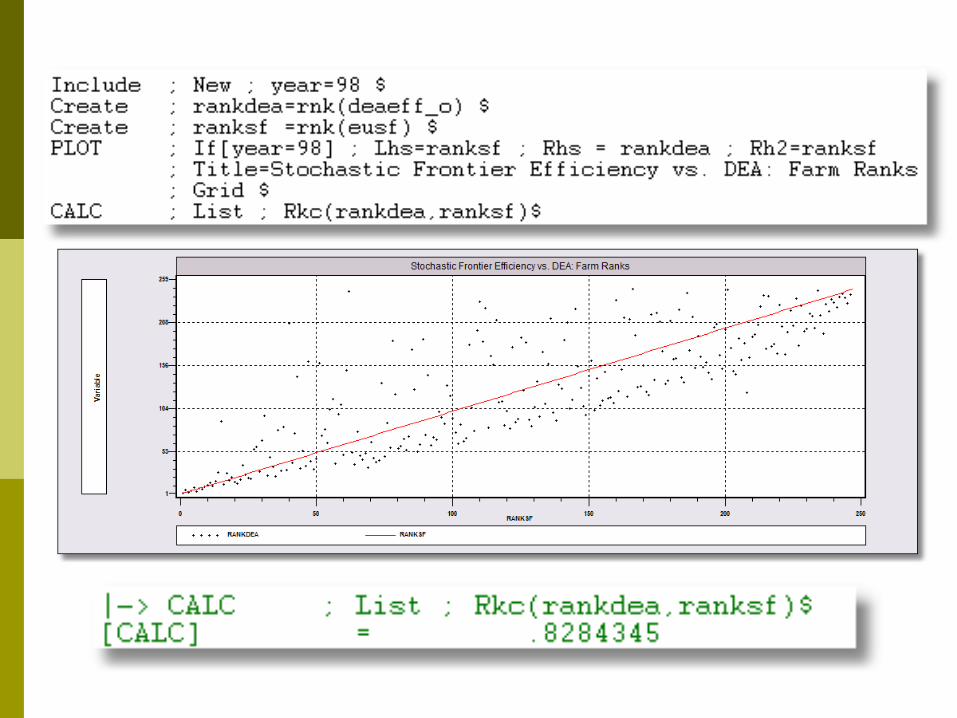
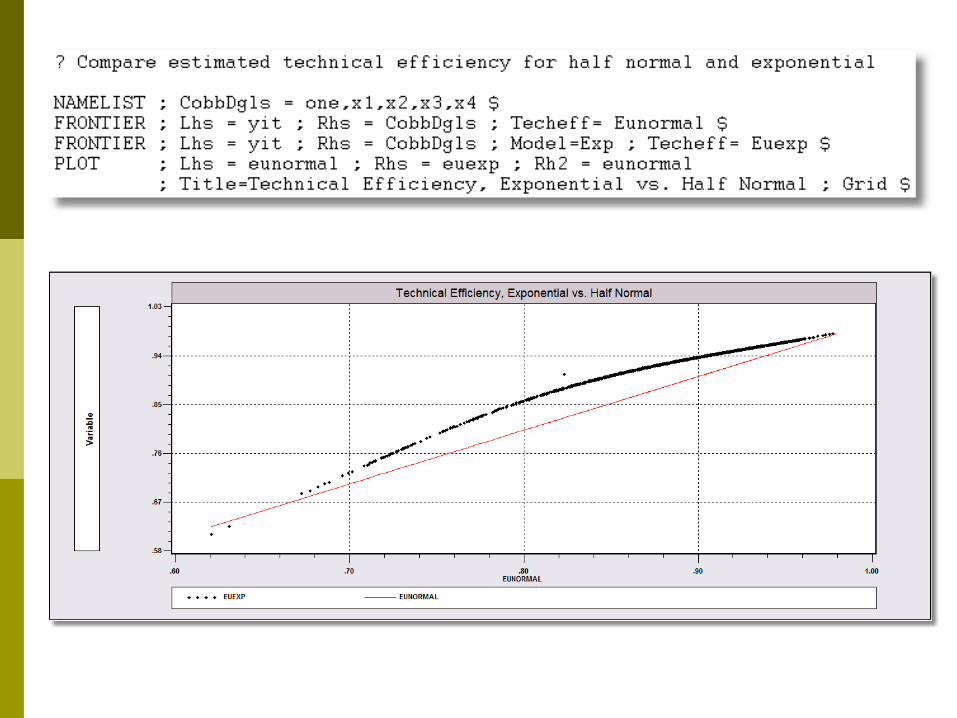
Compare SF and DEA
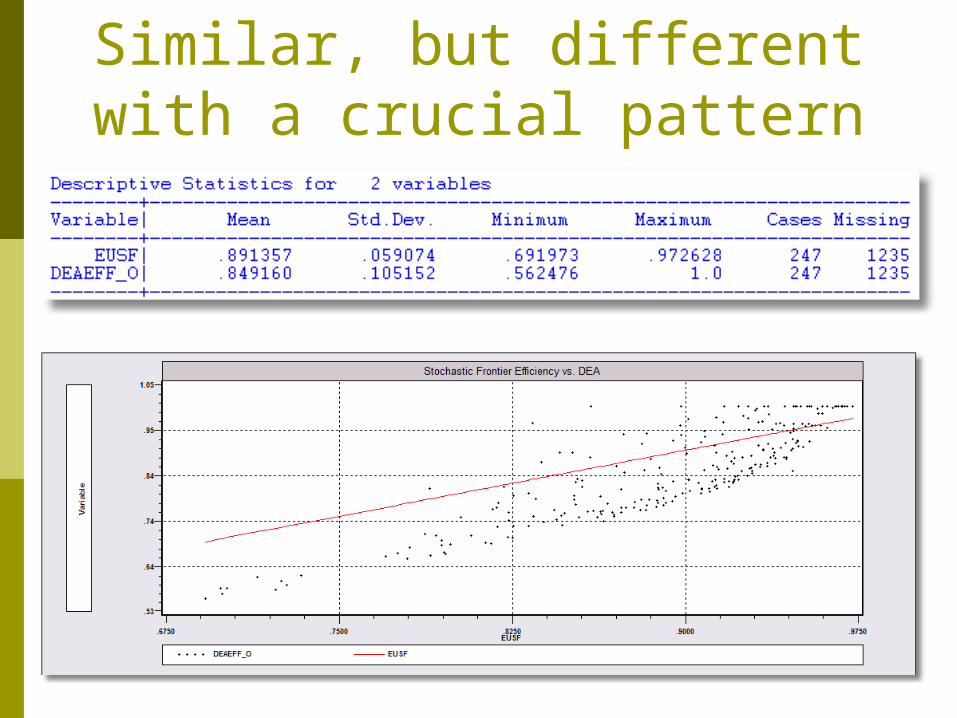
Similar, but differentwith a crucial pattern
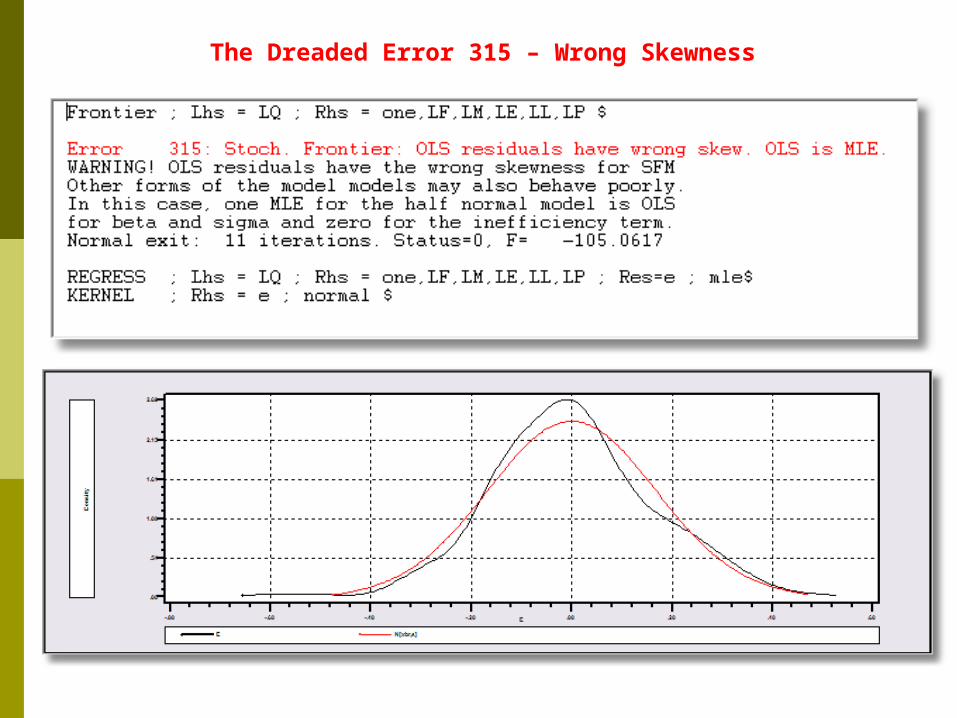
The Dreaded Error 315 – Wrong Skewness
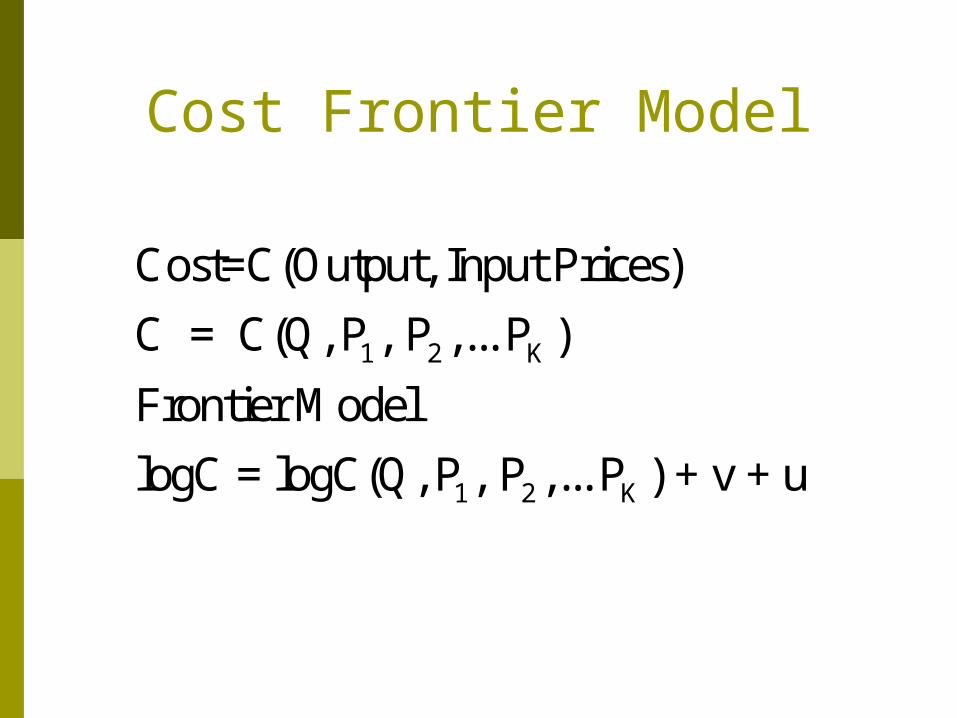
Cost Frontier Model
1 2 K
1 2 K
Cost=C(Output, Input Prices)
C = C(Q, P , P ,... P )
Frontier Model
logC = logC(Q, P , P ,... P ) + v + u
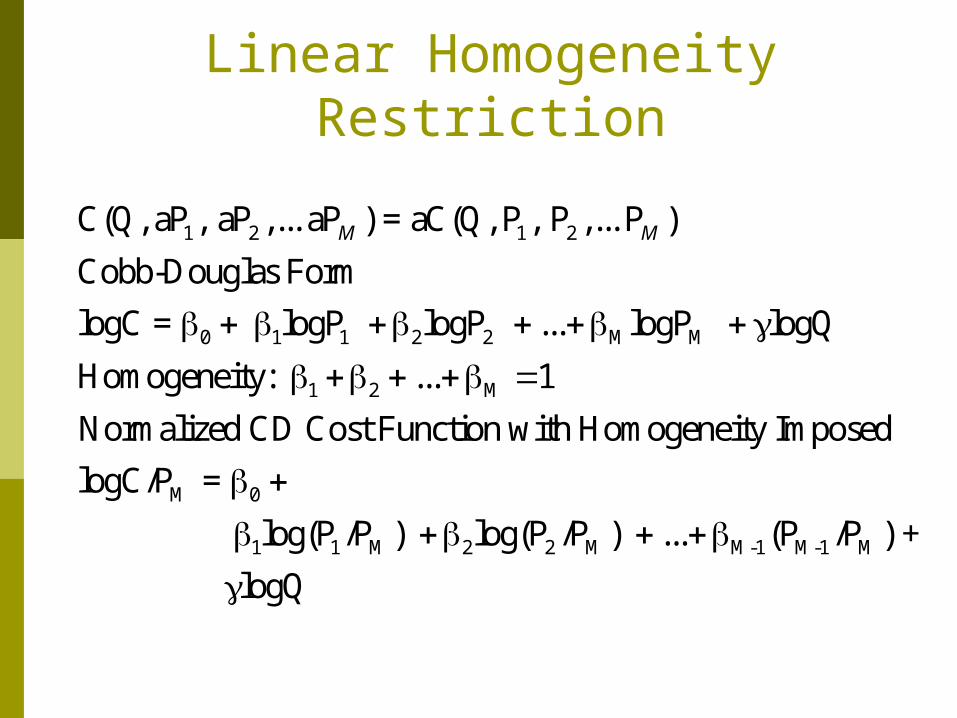
Linear Homogeneity Restriction
1 2 1 2
0 1 1 2 2 M M
1 2 M
M
C(Q, aP , aP ,... aP ) = aC(Q, P , P ,... P )
Cobb-Douglas Form
logC = logP logP ... logP logQ
Homogeneity: ... 1
Normalized CD Cost Function with Homogeneity Imposed
logC/P =
M M
0
1 1 M 2 2 M M-1 M-1 M
log(P /P ) log(P /P ) ... (P /P ) +
logQ
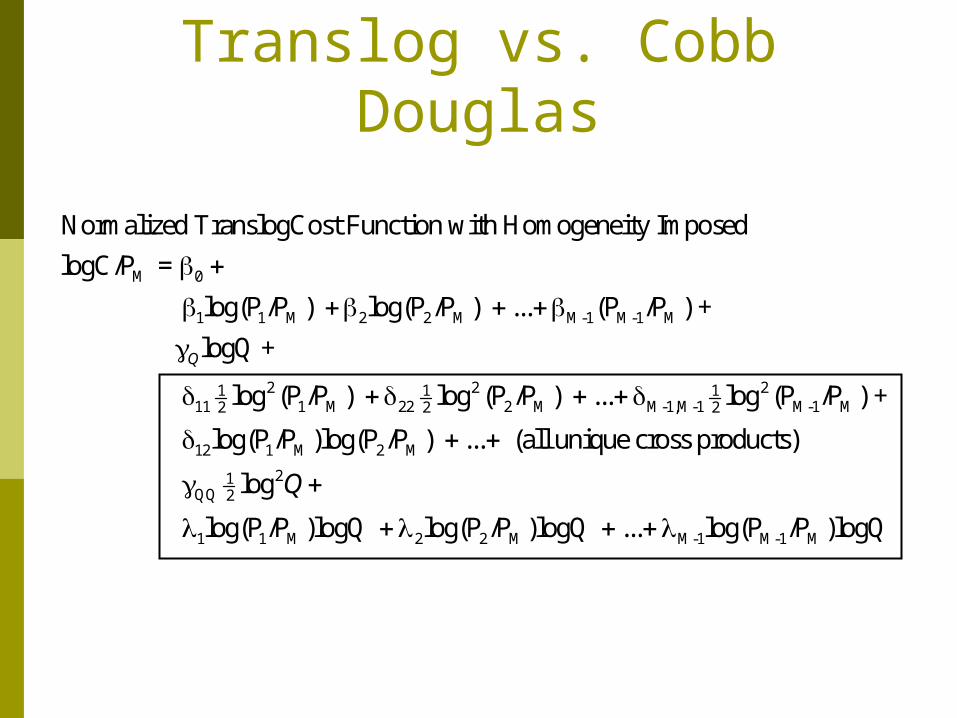
Translog vs. Cobb Douglas
M 0
1 1 M 2 2 M M-1 M-1 M
2111 1 M 222
Normalized TranslogCost Function with Homogeneity Imposed
logC/P =
log(P /P ) log(P /P ) ... (P /P ) +
logQ +
log (P /P )
Q
2 21 12 M M-1,M-1 M-1 M2 2
12 1 M 2 M
21QQ 2
1 1 M 2 2 M
log (P /P ) ... log (P /P ) +
log(P /P )log(P /P ) ... (all unique cross products)
log
log(P /P )logQ log(P /P )logQ
Q
M-1 M-1 M ... log(P /P )logQ
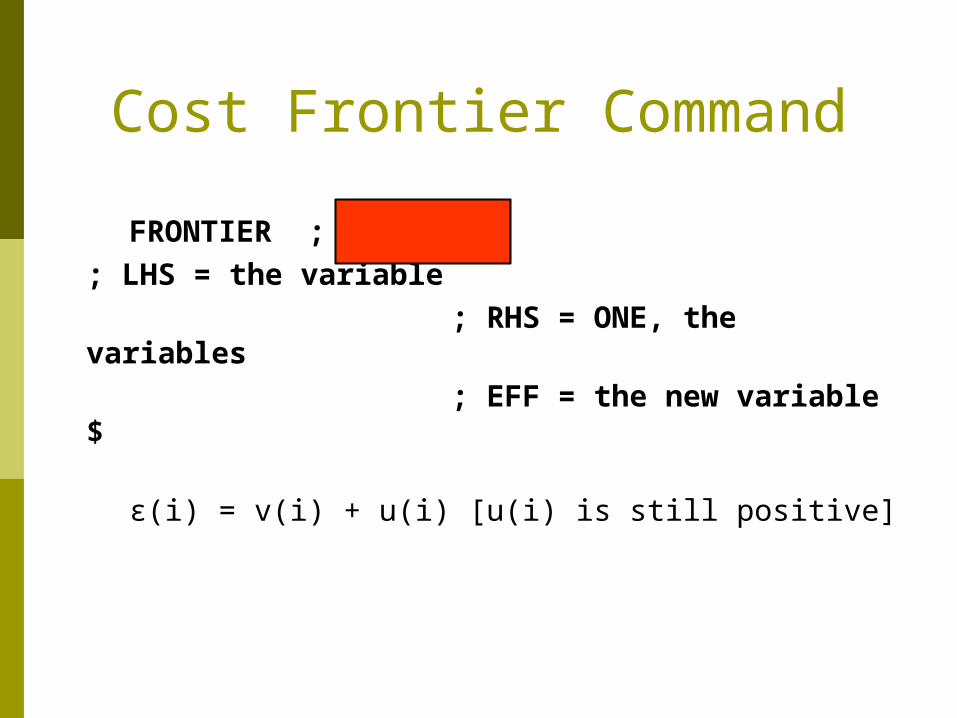
Cost Frontier Command
FRONTIER ; COST; LHS = the variable
; RHS = ONE, the variables
; EFF = the new variable $
ε(i) = v(i) + u(i) [u(i) is still positive]
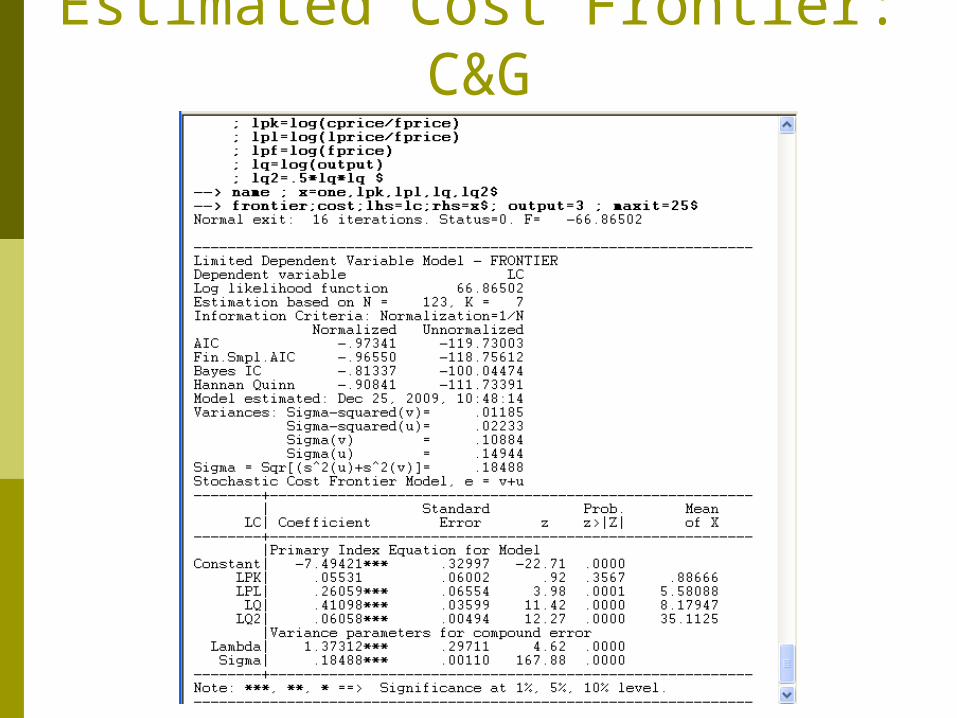
Estimated Cost Frontier: C&G
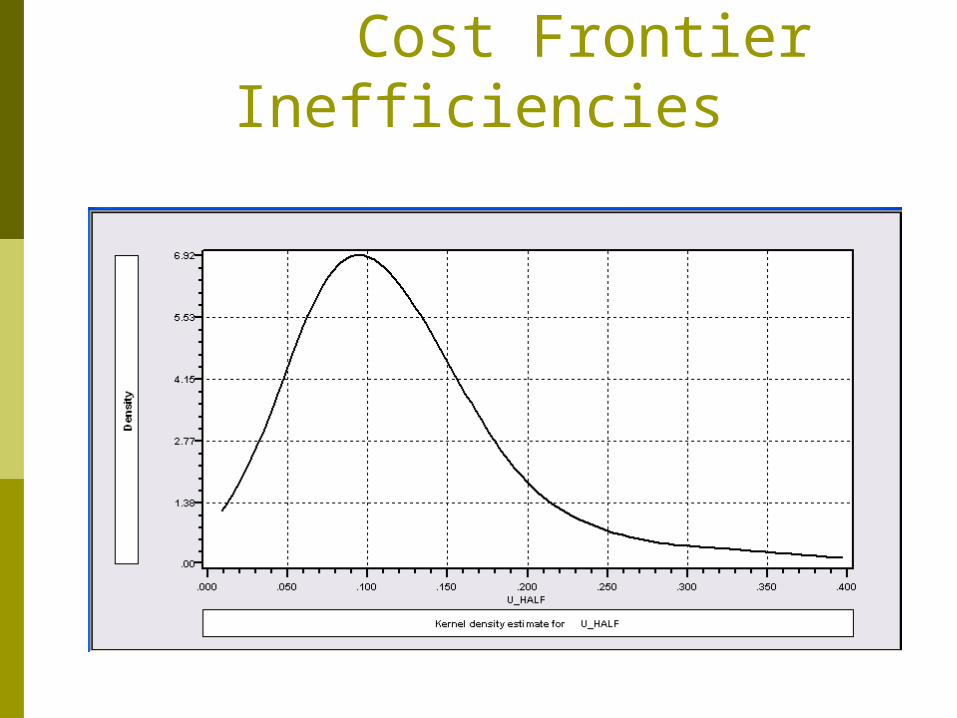
Cost Frontier Inefficiencies
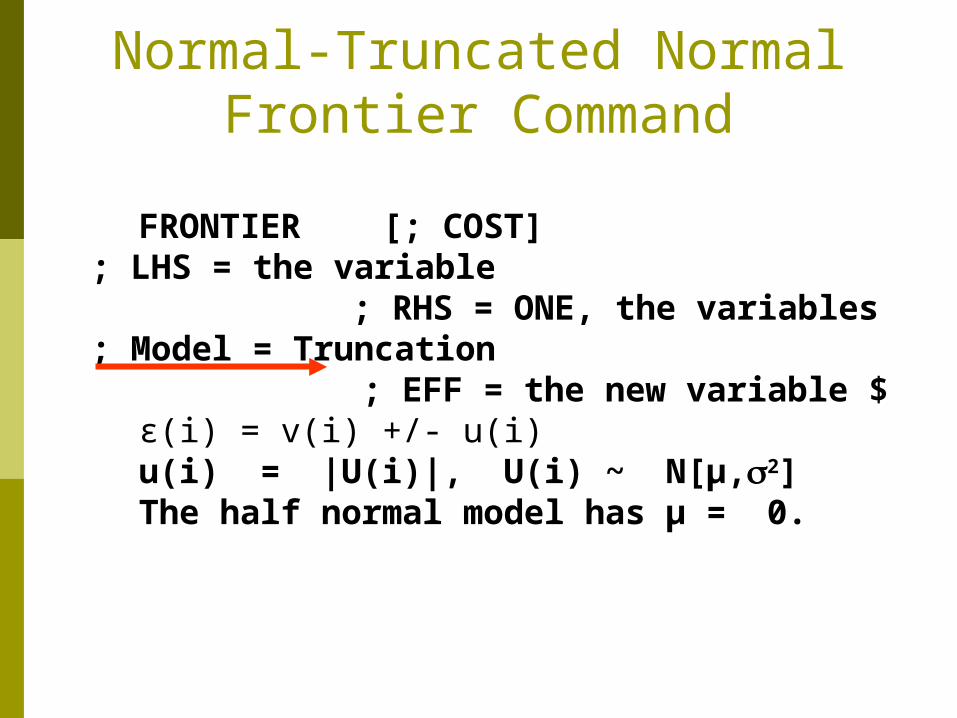
Normal-Truncated NormalFrontier Command
FRONTIER [; COST]; LHS = the variable
; RHS = ONE, the variables; Model = Truncation
; EFF = the new variable $ ε(i) = v(i) +/- u(i) u(i) = |U(i)|, U(i) ~ N[μ,2] The half normal model has μ = 0.
Observations Truncation Model estimation is often
unstable Often estimation is not possible When possible, estimates are often wild
Estimates of u(i) are usually only moderately affected
Estimates of u(i) are fairly stable across models (exponential, truncation, etc.)
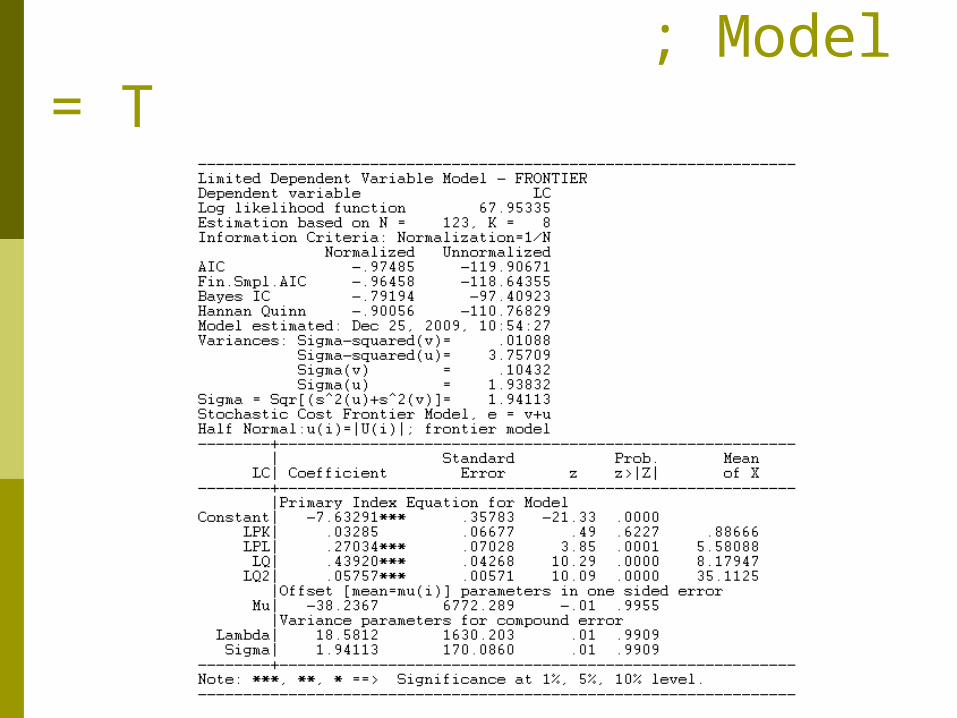
Truncated Normal Model ; Model = T
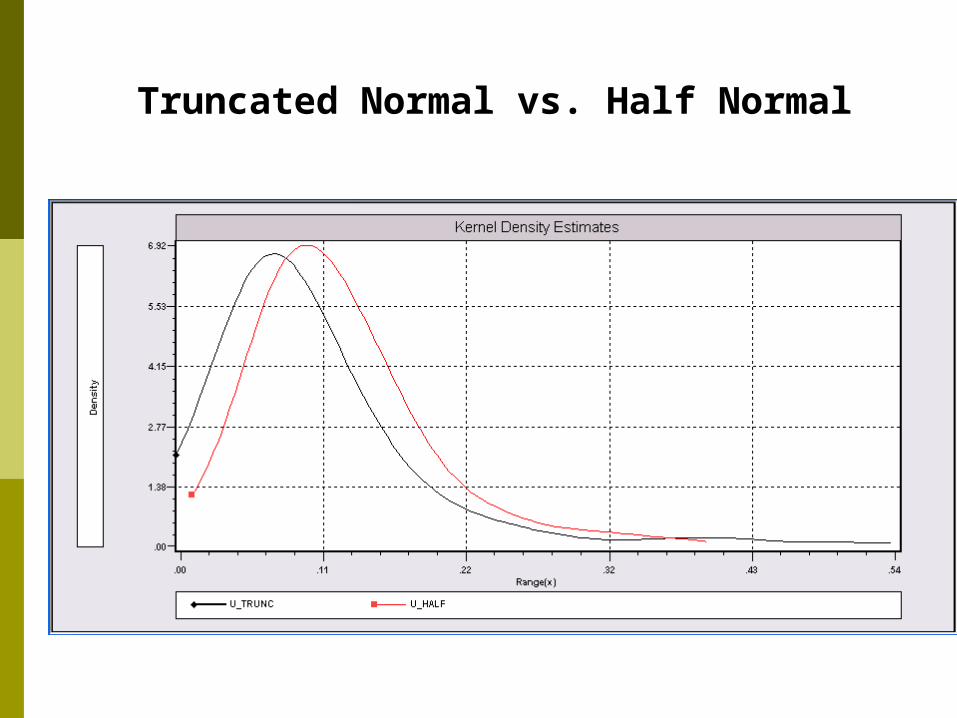
Truncated Normal vs. Half Normal
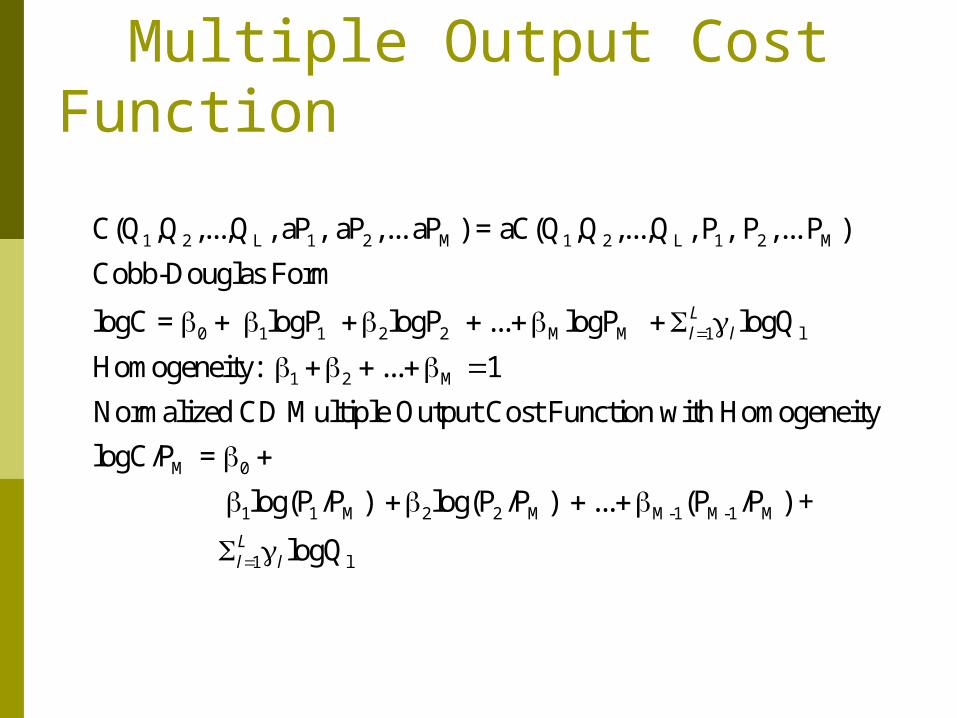
Multiple Output Cost Function
1 2 L 1 2 M 1 2 L 1 2 M
0 1 1 2 2 M M 1 l
1 2 M
C(Q ,Q ,...,Q , aP , aP ,... aP ) = aC(Q ,Q ,...,Q , P , P ,... P )
Cobb-Douglas Form
logC = logP logP ... logP logQ
Homogeneity: ... 1
Normalized CD Multiple Output Cost
Ll l
M 0
1 1 M 2 2 M M-1 M-1 M
1 l
Function with Homogeneity
logC/P =
log(P /P ) log(P /P ) ... (P /P ) +
logQ
Ll l
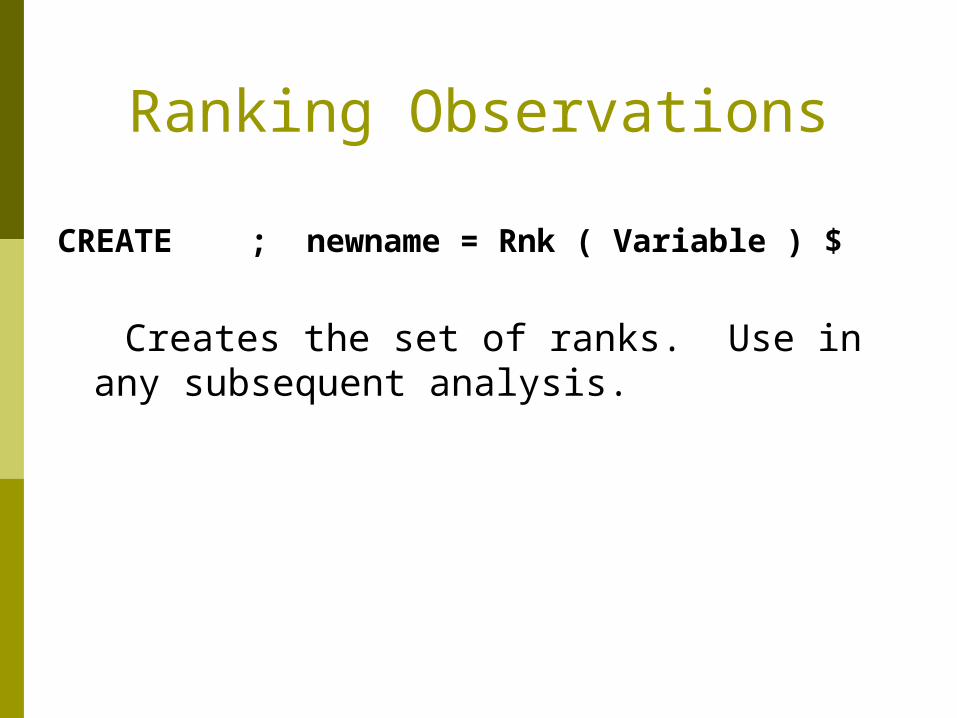
Ranking Observations
CREATE ; newname = Rnk ( Variable ) $
Creates the set of ranks. Use in any subsequent analysis.