efficiency measure of insurance v/s tak ful firms using ... · atiquzzafar & uzma: efficiency...
TRANSCRIPT
Islamic Economic Studies
Vol. 22, No. 1, May, 2014 (139-158) DOI No. 10.12816/0004133
139
Efficiency Measure of Insurance v/s Tak ful Firms Using
DEA Approach: A Case of Pakistan
ATIQUZZAFAR KHAN
UZMA NOREEN Abstract
This study aims at comparing the Pakistan’s Tak ful and conventional
insurance companies in terms of efficiency and productivity for the period
2006-2010. We apply Data Envelopment approach to estimate technical,
allocative and cost efficiencies. The results indicate that the insurance
industry as a whole is cost inefficient due to high allocative inefficiency.
However, technical efficiency components show improving trends. Results
further indicate that Tak ful firms are more efficient as compared to
conventional insurance firms. Malmquist productivity index shows a
significant improvement in scale efficiency. However, we do not find any
considerable contribution of technology to improve overall productivity. The
study suggests introduction of innovative and diversified products in
insurance industry of Pakistan, particularly for Tak ful companies.
Keywords: Tak ful, insurance, Comparative Analysis, Non-Parametric
Methods.
JEL Classification: G22, P51 D22, C14.
KAU-IEI Classification: I44.
1. Introduction
The insurance industry plays an important role in the development of social and
economic sectors of an economy by minimizing risk of all economic activities on the
one hand and by channelizing long term financial resources on the other. An efficient
Assistant Professor, International Institute of Islamic Economics, International Islamic University,
Islamabad, Sector H-10, Pakistan. Email: [email protected]. Lecturer, International Institute of Islamic Economics, International Islamic University, Islamabad,
Pakistan. Email: [email protected].

140 Islamic Economic Studies Vol. 22, No.1
and productive insurance sector also contributes to economic growth of a country by
transforming savings into investment projects through the financial intermediation
(Financial Sector Assessment: 2005). Insurance companies offer different services
to households and businesses for their well-being. The primary service of insurance
company is to provide risk coverage against any loss to property, business and life,
etc. Thus, an insurance company encourages the otherwise risk-averse individuals
and entrepreneurs to undertake high return activities, of course with higher risk, than
they would normally hesitate to do so.
Given the importance of insurance in the country’s socio-economic development
and its distinct functions from other financial institutions, it seems attractive to look
at its performance, particularly in the presence of dual insurance system where
Tak ful1 and conventional insurance firms are working side by side. Before the
introduction of Tak ful rules in 2005, insurance sector in Pakistan comprised of only
conventional insurance firms. Since 2005, Tak ful industry started operation and
now 5 Tak ful firms (two family and three general Tak ful firms) are offering
different Shar ah2 compliant products in the market. First Tak ful firm in Pakistan
started its operation in 2006, and now five Tak ful firms are operational in the
country by 2011. Since 2006, Tak ful industry demonstrated healthy growth in its
net & gross premium and assets structure [See Appendix A Table 1].
Efficiency is an important issue for Tak ful firms as they are facing intense
competition from the well-established conventional insurers. Moreover Tak ful
operators have the vast opportunity to attract those customers who were not
previously having the conventional insurance because of its incompliance with
Shar ah; hence it is possible to increase customer base and the insurance penetration
rate in Pakistan.
In recent years there has been a significant growth in insurance sector of Pakistan
along with the entry of Tak ful firms in industry. This very fact motivates us to
undertake the efficiency and productivity analysis of insurance and Tak ful firms.
The present study attempts to measure the performance of insurance and Tak ful
industry and tries to explore the relationship between the efficiency and productivity
1 Tak ful is the concept of Islamic insurance (as alternative to conventional insurance) based on
principles of shared responsibility and risk sharing through mutual cooperation, rather than risk
exchange.
2 Sacred orders of Allah in the Qur’ n, religious, social and commercial practices of the Prophet
(SAW), Qiy s (Analogy), and Ijm (the agreement of whole Islamic world on an issue) form the basis
of Shar ah.

Atiquzzafar & Uzma: Efficiency Measure of Insurance v/s Tak ful 141
with different operational measures of risk protection. More specifically, the study
will concentrate on the comparison of cost efficiency and total factor productivity of
different Tak ful and conventional firms under reference. It is expected that the
findings of this study will help the insurers, regulators, government and Shar ah
Boards of Tak ful companies to design new and innovative Shar ah compliant
products in Pakistan, which in return will stimulate Tak ful demand and increase the
insurance penetration in the country
The rest of the paper is planned as follows. Section 2 reviews the relevant
literature on efficiency and productivity of insurance and Tak ful companies. Section
3 outlines the related concepts and empirical methodology. Section 4 presents data
and the description of the selected variables and Section 5 analyzes the results. The
last section concludes the study.
2. Literature Review
There are many studies that explore the efficiency and productivity of insurance
sector, both in developed and developing economies, by using parametric and non-
parametric approaches. However very few studies are available that measures the
efficiency of Tak ful industry. Most of the studies on insurance efficiency have
focused heavily on the developed countries and particularly, on the insurance
industry in USA and the west [see, Gardner and Grace (1993), Yuengert (1993),
Cummins et al. (1999), Amel et al. (2004), Greene and Segal (2004) and Jeng et al.
(2007)].
Studies that evaluated the performance of European insurance sector include
Diacon et al. (2002), Ennsfellner et al. (2004), Cummins and Misas (2006), Fenn et
al (2007). For instance, Ennsfellner et al. (2004) investigate the production efficiency
of Austrian insurance industry, while Cummins and Misas (2006) examine the
impact of organizational structure on the efficiency of Spanish insurance firms.
Other studies in European countries focus on productivity measurement using
Malmquist index and stochastic frontier analysis [see for example, Cummins et al.
(1996) for Italy, Fenn et al. (2007) for European countries]. These studies document
that both efficiency and productivity of insurance companies altered significantly
due to deregulatory process in these countries. Further, it is concluded that growth
in new products and adoption of technology has improved the performance of
insurance sector in these economies significantly.
Although, most of the literature is centered upon the performance of insurance
sector either in U.S. or other developed countries, however, in recent years, we find

142 Islamic Economic Studies Vol. 22, No.1
other studies that investigate efficiency and productivity of this sector in Asian
economies. While majority of these studies cover East Asian economies (see for
example, Mansoor and Radam, 2000; Karim and Jhantasana, 2005; Hao and Chou,
2005; and Jeng and Lai, 2005), there are a few studies on South Asian countries as
well.
Most of the studies have attempted to measure the efficiency of conventional
insurance, but a few studies have also focused on the efficiency of Tak ful firms, for
instance Kader et al. 2010; Yusop et al. 2011; Ismail et al, 2011; examines the
efficiency of Tak ful firms operating in different countries. Kader et al (2011)
investigated the cost efficiency of Tak ful firms operating in seventeen Islamic
countries. Their study concludes that average cost efficiency scores of Tak ful firms
are comparable with developed conventional insurers. They further suggest that a
skilled and experienced Board of Directors can contribute positively to optimal
resource allocation and hence the efficiency.
Ismail et al. (2011) perform a study to measure the efficiency of Tak ful and
conventional insurers in Malaysia over the period 2004-2009.They find that
efficiency score for Tak ful firms’ remains lower (i.e. 64 percent) than their
conventional counterparts (i.e. 87 percent). The study further suggests that Tak ful
firms should reduce their agency cost and management expenses and improve their
investment gains by investing in healthy projects. Saad et al. (2006) also analyze the
efficiency of life insurance industry in Malaysia, using the data on Tak ful and
conventional insurance firms. The findings of the study indicate that conventional
firms are performing better as compared to Tak ful firms. They further suggest that
Tak ful firms should increase their size to optimal level in order to improve the
efficiency score.
Despite the fact that a growing literature is available on efficiency of insurance
sector as well as on Tak ful firms around the globe, we do not find even a single
study that measures the comparative performance of Pakistan’s insurance and
Tak ful sector. Of course, a few studies are available on comparison of Islamic and
conventional banking efficiency (see, Khyzer et al, 2011; Akhtar et al, 2011; Shah
et al, 2012). Thus it will be interesting to investigate the relationship between the
efficiency and productivity of two different organizational forms i.e. Tak ful and
conventional firms having different operational framework towards risk protection.

Atiquzzafar & Uzma: Efficiency Measure of Insurance v/s Tak ful 143
3. Methodology
The efficiency concept is basically used to evaluate the performance of a firm.
Conventionally, financial ratios such as return on assets, return on equity, expense
to premium ratios etc. are used to measure their performance. However the
emergence of frontier methodologies with their meaningful and reliable measures
now dominates the conventional approaches to evaluate efficiency and most studies
follow the new approach.
There are two main frontier based approaches used to measure the efficiency:
namely parametric and non-parametric approach. The parametric approach requires
the specification of functional form of the production, cost and profit frontier and
some distributional assumptions about the error term. On the other hand, non-
parametric approach does not assume any specific functional form for evaluating
efficiency, and therefore, does not take into account the error term. (Cummins and
Xie; 2008).
Data Envelopment Analysis (DEA) was first introduced by Charnes et al. (1978)
and extended by Banker, et al. (1984). The purpose of this approach was to measure
the relative efficiency of each DMU (Decision Making Unit) with the best practices
firm. DEA decomposes the cost efficiency (CE) into two components. One is
technical efficiency (either maximizing output for a given level of inputs or
minimizing inputs for a given level of output). The other is allocative efficiency
(using input in optimal proportions given the input prices and output quantities).
Technical Efficiency (TE) can be further decomposed into Pure Technical Efficiency
(PTE) and Scale Efficiency (SE). SE occurs when firm operates at Constant Returns
to Scale (CRS) and PTE occurs when firm maximizes its output with Variable
Returns to Scale (VRS). The resultant efficiency measure, ranging between zero
(least efficient) and one (most efficient), depicts the distance from each unit to
frontier.
The present study uses non-parametric approach by applying DEA. We choose
this approach on the basis of certain advantages. The main advantage of this
approach lies in lesser demand for data and therefore it is appropriate for small
sample size. Further, DEA3 analyzes the efficiency of each firm separately, and can
easily identify the efficiency and productivity changes across the firms (Cummins
3 For further details on DEA see [Coelli (1996) and Coelli et al. (1997)].

144 Islamic Economic Studies Vol. 22, No.1
and Xie; 2008). We use the software package DEAP4 developed by Coelli (1996) to
measure the cost efficiency and its components.
Finally, to measure the change in efficiency and technology, we adopt the DEA
based Malmquist Index Approach. The idea was first presented by Malmquist (1953)
and later extended by Caves et al. (1982). There are several methods to compute the
Malmquist productivity index. We estimated output oriented Malmquist index in this
study, which is based on DEA. Malmquist indices can also be calculated by using
DEAP software package. To estimate the Malmquist Productivity Index we need a
balanced panel data. For this purpose, we include only 16 firms for the period 2007-
2010.
4. Data and Variable Description
4.1. Data
The data sample for this analysis consists of 12 conventional insurance and 5
Tak ful companies operating in Pakistan (List of insurance and Tak ful companies
is given as Appendix B). The sample size represents more than 80% of the market
share (in terms of premium) reflecting the fact that the selected sample is the
representative of Pakistan Insurance and Tak ful sector. To estimate the cost
efficiency, we use un-balanced panel data for the period 2006 to 2010, obtained from
the annual reports of insurance and Tak ful companies.
4.2. Variable Description
The most critical task of the efficiency analysis for financial sector is to define
output, inputs and their prices. 5 An appropriate selection of the output-input
variables in the insurance industry makes it a more difficult and challenging job.
The precision of the efficiency results depends upon the definition of outputs,
inputs quantities and their respective prices. There has been much debate on the
selection criteria of input-output variables in financial sector, particularly, for
insurance industry (see for example, Yuengert, 1993; Cummins and Weiss, 1998;
Worthington and Hurley, 2002).
4 Data Envelopment Analysis Program (DEAP), software used to calculate efficiency score. 5 See, Sealey and Lindley (1977), for a detailed discussion on variable selection.

Atiquzzafar & Uzma: Efficiency Measure of Insurance v/s Tak ful 145
Table-1
Descriptive Statistics
Description Mean Median Standard Deviation
Output Variables
invested assets 13.28 x 10⁹ 10.10 x 10⁸ 37.9 x 10⁹
Net Premium 3.12 x 10⁹ 5.42 x 10⁸ 6.22 x 10⁹
Input Variables
Labor 635 223 975
Total Fixed Assets 1.97 x 10⁸ 1.03 x 10⁸ 2.27 x 10⁸
Business Services 9.82 x 10⁸ 8.81 x 10⁷ 2.40 x 10⁹
Equity capital 3.16 x 10⁹ 9.70 x 10⁸ 4.50 x 10⁹
Input Prices
Labor 473498 455424 259383
Total Fixed Assets 0.1664 0.1435 0.1154
Business Services 0.0808 0.0419 0.1201
Equity capital 0.4826 0.4760 0.2620
Different output variables have been identified by various studies to measure the
efficiency and productivity of insurance sector. Risk pooling (or risk bearing) and
intermediation services are considered two main services that insurance industry
provides to customers [Cummins and Zi (1998)]. Much of the existing literature
prefer to use premium income as a common measure of risk pooling as policy holders
in fact buy protection against risk by purchasing insurance policies.
For intermediation function we used the proxy of invested assets [See Cummins
et al. (1999), Worthington and Hurley (2002), Jeng and Lai (2005)]. Worthington
and Hurley (2002) consider invested assets as an output with the argument that net
profit of most general insurers comes from the intermediation function of borrowing
from policyholders and investing in marketable securities rather than premium
The choice of input variables is somehow undisputed as compared to the selection
of output variables in insurance analysis. In general, three types of input variables
namely Labor, Capital and business services are used to measure the efficiency [see
Meador et al (1996), Cummins et al (1996), Greene and Segal (2004),Cummins and
Xie (2008)]. Some studies also used the equity capital as an input [Cummins,
Turchetti, and Weiss (1996), Greene and Segal (2004), and Jeng and Lai (2005)]. It
is important in the sense that insurers need to maintain equity capital for the payment
of claims to their policyholders if losses exceed the expected limits. We include four
146 Islamic Economic Studies Vol. 22, No.1
inputs Labor (X1), total fixed assets (X2), business Services (X3) and equity capital
(X4), in the present study.
5. Results and Discussion
In this section we discuss the results of cost efficiency and its decomposition into
technical and allocative efficiency arrived at by DEA analysis. We also measure total
factor productivity by decomposing it into technical efficiency change and technical
change
5.1. Efficiency Results
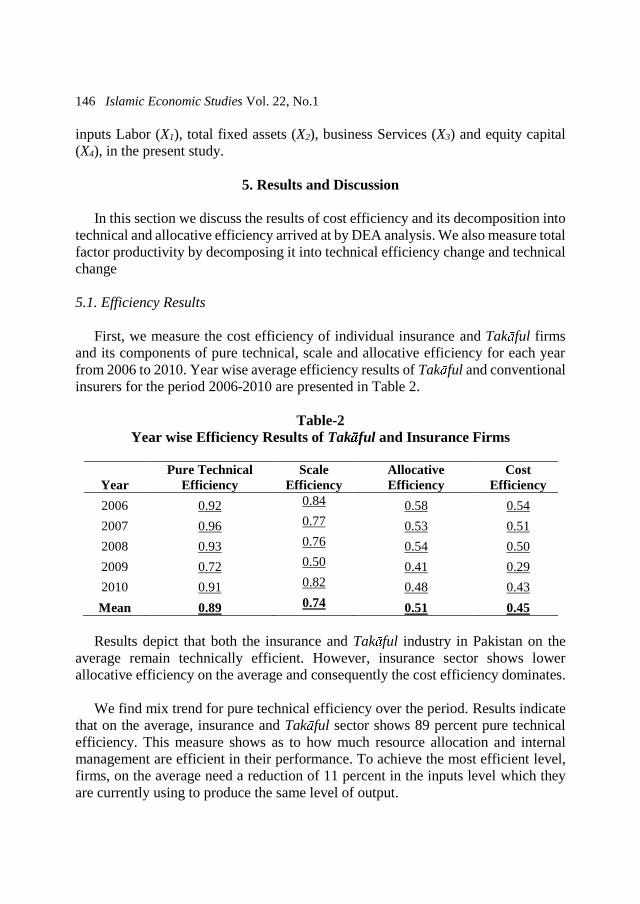
First, we measure the cost efficiency of individual insurance and Tak ful firms
and its components of pure technical, scale and allocative efficiency for each year
from 2006 to 2010. Year wise average efficiency results of Tak ful and conventional
insurers for the period 2006-2010 are presented in Table 2.
Table-2
Year wise Efficiency Results of Tak ful and Insurance Firms
Results depict that both the insurance and Tak ful industry in Pakistan on the
average remain technically efficient. However, insurance sector shows lower
allocative efficiency on the average and consequently the cost efficiency dominates.
We find mix trend for pure technical efficiency over the period. Results indicate
that on the average, insurance and Tak ful sector shows 89 percent pure technical
efficiency. This measure shows as to how much resource allocation and internal
management are efficient in their performance. To achieve the most efficient level,
firms, on the average need a reduction of 11 percent in the inputs level which they
are currently using to produce the same level of output.
Year
Pure Technical
Efficiency
Scale
Efficiency
Allocative
Efficiency
Cost
Efficiency
2006 0.92 0.84 0.58 0.54
2007 0.96 0.77 0.53 0.51
2008 0.93 0.76 0.54 0.50
2009 0.72 0.50 0.41 0.29
2010 0.91 0.82 0.48 0.43
Mean 0.89 0.74 0.51 0.45

Atiquzzafar & Uzma: Efficiency Measure of Insurance v/s Tak ful 147
Similarly, scale efficiency of insurance industry remains about 74 percent
indicating a significant expansion in insurance sector of Pakistan during 2006-2010.
This measure indicates whether the firm is operating on optimal scale or otherwise.
Scale efficiency equal to one (i.e. constant returns to scale) is the indication that firm
is operating at optimal scale, while deviation from unity (either increasing returns to
scale or decreasing returns to scale) depicts that firm is away from its optimal level.
Another important source of cost efficiency is firm’s allocative efficiency. If a
firm is successful to equate its marginal products to input price ratios then it is
optimizing its resources to produce a certain level of output. It is notable that
insurance sector of Pakistan remains about 49 percent allocatively inefficient during
the period of study, which might have contributed to cost inefficiency of this sector
significantly. Average cost efficiency of this sector is recorded only 45 percent over
the period concerned showing that insurance and Tak ful firms could have reduced
about 55 percent expenditures as compared to the existing level to produce same
output level.
Figure-1
Firm Wise cost efficiency and its components (2006-2010)
Firm wise efficiency score depicts that only one firm that is also the largest firm
in sample is 100 percent cost efficient. It is noteworthy that allocative efficiency
dominates the cost efficiency as firm even with highest technical efficiency shows
lower cost efficiency, as they remain less efficient allocatively. These results are not
0.00
0.20
0.40
0.60
0.80
1.00
1.20
Ad
amje
e
Ask
ari
Atl
as
Pre
mie
r
Shah
een
EFU
-Gen
EFU
-Lif
e
Stat
life
NIC
L
new
jub
lie IGI
Hab
ib
Taka
ful P
ak.
Pak
-Qat
ar(G
en
era
l)
Pak
-Qat
ar(F
amily
)
Pak
-Ku
wai
t
Daw
oo
d T
akfu
l
TE
AE
CE

148 Islamic Economic Studies Vol. 22, No.1
unexpected because insurance sector of Pakistan has been highly concentrated as few
firms are dominating the whole sector. This high concentration plus product
differentiation of insurance industry might have resulted into care free attitude on
the insurance firms who do not use their resources efficiently. However, recent wave
of competition and deregulatory process may improve the resource allocation
mechanism in these firms by providing them a level playing field to insurance sector
in coming years.
Comparative analysis of Tak ful and conventional insurers shows that overall
Tak ful firms are more cost efficient as compared to their conventional counterparts.
It is noteworthy that allocative efficiency dominates the cost efficiency as Tak ful
firms are cost efficient due to high allocative (68%) efficiency, while conventional
firms observed low allocative efficiency (43%) even though they are technically
more efficient.
Table-3
Efficiency Comparison of Tak ful and Conventional Firms
Firms* PTE SE6 AE CE
Conventional Firms 0.89 0.86 0.43 0.40
Tak ful Firms 0.87 0.38 0.68 0.60
* PTE = Pure Technical Efficiency, SE = Scale Efficiency, AE = Allocative Efficiency &
CE = Cost Efficiency
High allocative efficiency of Tak ful firms indicates that this industry is choosing
the optimal combination of inputs. However lower scale efficiency of Tak ful firms
indicates that the operators should expand their size to enjoy the benefits of
economies of scale.
6 All Takaful firms are operating at Increasing Returns to Scale (IRS), while among conventional firms
51% are operating at Constant Returns to Scale, 44% at Increasing Returns to Scale and only 5% at
Decreasing Returns to Scale.

Atiquzzafar & Uzma: Efficiency Measure of Insurance v/s Tak ful 149
5.2. Productivity Results
In this section, the results for total factor productivity and its components are also
presented. We estimate output oriented Malmquist index in this study, which is based
on DEA. Table 4 presents year wise average results for Malmquist index and its
components of technical efficiency change, technological change and total factor
productivity change.
Table-4
Malmquist Index Results
YEAR EFFCH* TECHCH PECH SECH TFPCH
2008 0.997 1.021 0.955 1.044 1.017
2009 1.022 0.94 0.985 1.038 0.961
2010 1.083 1.001 0.974 1.112 1.083
Mean 1.033 0.987 0.971 1.064 1.019
*EFFCH = Efficiency Change, TECHCH = Technological Change, PECH = Pure
Efficiency Change, SECH
= Scale Efficiency Change and TFPCH = Total Factor Productivity Change.
If the value of Malmquist index and any of its components exceeds unity, it
indicates the improvement in performance, while a value equal to unity shows no
change and less than unity shows the deterioration in its performance. The results
show that on the average insurance sector experienced growth in total factor
productivity, mainly due to scale efficiency change, while deterioration is observed
in technical change.
The average growth in total factor productivity is found to be 1.9 percent
annually. Similarly, there has been significant technical efficiency improvement as
this measure registers a 3.3 percent growth on the average, which is also consistent
with our previous results of cost efficiency obtained on the basis of DEA. However,
we find deterioration in technological change.
As can be seen from Table 4, there has been a decline in productivity in the year
2009, which may be the consequence of decline in overall economic growth, high
inflation rate, floods, global financial crisis and internal security situation of the
country. These factors might have caused a reduction in productivity. Malmquist
productivity results also show that insurance industry has experienced an overall
productivity growth, which is contributed mainly by scale efficiency change.
150 Islamic Economic Studies Vol. 22, No.1
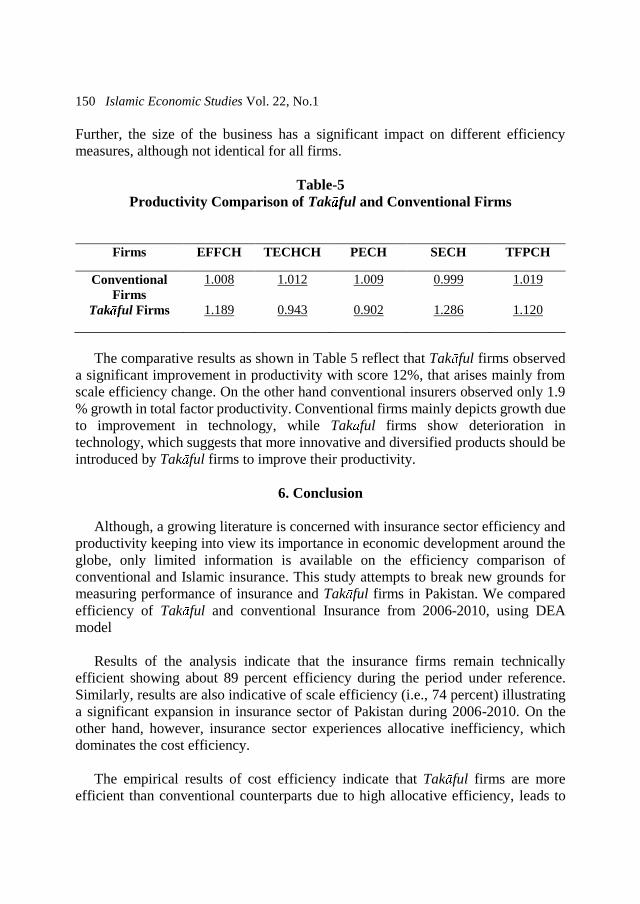
Further, the size of the business has a significant impact on different efficiency
measures, although not identical for all firms.
Table-5
Productivity Comparison of Tak ful and Conventional Firms
Firms EFFCH TECHCH PECH SECH TFPCH
Conventional
Firms
1.008 1.012 1.009 0.999 1.019
Tak ful Firms 1.189 0.943 0.902 1.286 1.120
The comparative results as shown in Table 5 reflect that Tak ful firms observed
a significant improvement in productivity with score 12%, that arises mainly from
scale efficiency change. On the other hand conventional insurers observed only 1.9
% growth in total factor productivity. Conventional firms mainly depicts growth due
to improvement in technology, while Tak ful firms show deterioration in
technology, which suggests that more innovative and diversified products should be
introduced by Tak ful firms to improve their productivity.
6. Conclusion
Although, a growing literature is concerned with insurance sector efficiency and
productivity keeping into view its importance in economic development around the
globe, only limited information is available on the efficiency comparison of
conventional and Islamic insurance. This study attempts to break new grounds for
measuring performance of insurance and Tak ful firms in Pakistan. We compared
efficiency of Tak ful and conventional Insurance from 2006-2010, using DEA
model
Results of the analysis indicate that the insurance firms remain technically
efficient showing about 89 percent efficiency during the period under reference.
Similarly, results are also indicative of scale efficiency (i.e., 74 percent) illustrating
a significant expansion in insurance sector of Pakistan during 2006-2010. On the
other hand, however, insurance sector experiences allocative inefficiency, which
dominates the cost efficiency.
The empirical results of cost efficiency indicate that Tak ful firms are more
efficient than conventional counterparts due to high allocative efficiency, leads to
Atiquzzafar & Uzma: Efficiency Measure of Insurance v/s Tak ful 151
the conclusion that their choice of inputs is optimal. Further we compared Tak ful
and conventional insurers in terms of economies of scales. The results suggest that
all of the Tak ful firms are operating at IRS as compared to 44% in case of
conventional firms using this model. This means that large number of Tak ful firms
enjoying a chance to increase their operations to reduce scale inefficiency and
improve their performance. Most of the conventional firms (51%) are operating at
CRS with the exception of only 5% with DRS, which show that they are operating
at optimal scale.
Malmquist index also shows high productivity results for Tak ful firms, mainly
due to scale efficiency change. However we do not find any contribution from
technology change for both types of firms. It is recommended that Tak ful and
conventional firms should introduce new and innovative products to improve the
productivity. Finally, the comparative analysis highlights that Tak ful firms are
efficiently competing with their conventional counter parts despite the fact that they
are new in the field. It is recommended that Tak ful firms should increase their
efficiency and win the competition by improving their services, product quality and
marketability of their products. To conclude, the study observes a significant
improvement in the performance of insurance sector of Pakistan that is mainly
contributed by technical and scale efficiency. However, firms could not succeed to
allocate their resources optimally, perhaps due to market imperfections in the
insurance industry.
It can be claimed that our study lays the foundations for further research to be
carried out on the Tak ful industry in different parts of the Islamic World with
different perspectives, like macroeconomic environment, consumer preferences
and corporate governance.

152 Islamic Economic Studies Vol. 22, No.1
References
Akhtar, W., Raza, A., Zaib, O., and Akram, M., 2011. Efficiency and Performance
of Islamic Banking: The Case of Pakistan. Far East Journal of Psychology and
Business 2, 54-70.
Amel, D., Barnes, C., Panetta, F., and Salleo, C., 2004. Consolidation and efficiency
in the financial sector: A review of the international evidence. Journal of Banking
and Finance 28, 2493-2519.
Banker, R., Charnes, A., and Cooper, W., 1984. Some models for estimating
technical and scale inefficiencies in data envelopment analysis. Management
Science 30, 1078-1092.
Caves, D., Christensen, L., and Diewert, E., 1982. Economic theory of index
numbers and the measurement of input, output, and productivity. Econometrica
50, 1393-1414.
Charnes, A., Cooper, W., and Rhodes, E., 1978. Measuring the Efficiency of
Decision Making Units. European Journal of Operational Research, 2, 429-444.
Coelli, T., 1996. A Guide to DEAP Version 2.1: A Data Envelopment Analysis
(Computer) Program. CEPA Working paper, 96/08.
Coelli, T., Rao, P., and Battese, G., 1997. An Introduction to Efficiency and
Productivity Analysis. Kluwer, Boston.
Cummins, D., Turchetti, G., and Weiss, M., 1996. Productivity and Technical
Efficiency in the Italian Insurance Industry. Working Paper, Wharton Financial
Institution Centre, University of Pennsylvania, Philadelphia.
Cummins, D., and Zi, H., 1998. Measuring cost efficiency in the U.S. life insurance
industry: Econometric and mathematical Programming approaches. Journal of
Productivity Analysis, 10, 131-152.
Cummins, D., and Weiss, M., 1998. Analyzing firm performance in the insurance
industry using frontier efficiency methods. Working Paper, Wharton Financial
Institution Centre, University of Pennsylvania, Philadelphia.
Atiquzzafar & Uzma: Efficiency Measure of Insurance v/s Tak ful 153
Cummins, D., Tennyson, S., and Weiss M., 1999. Consolidation and efficiency in
the US life insurance industry. Journal of Banking & Finance 23, 325-357.
Cummins, D., and Misas, R., 2006. Deregulation, consolidation and efficiency:
evidence from the Spanish insurance industry. Journal of Money, Credit and
Banking 38, 323-355.
Cummins, D., and Xie, X., 2008. Mergers and acquisitions in the US property-
liability Insurance industry: productivity and efficiency effects. Journal of
Banking and Finance 32, 30-55.
Diacon, S., Starkey, K., O’Brien, C., 2002. Size and efficiency in European long-
term insurance companies: An international comparison. The Geneva Papers on
Risk and Insurance 27, 444-466.
Ennsfellner, K., Lewis, D., and Anderson, R., 2004. Production Efficiency in the
Austrian Insurance industry: A Bayesian Examination. The Journal of Risk and
Insurance 71, 135-159.
Fenn, P., Vencappa, D., Diacon, S., Klumpes and O’Brien, C., 2008. Market
structure and the efficiency of European insurance companies: a stochastic
frontier analysis. Journal of Banking and Finance 32, 86-100.
Fukuyama, H., 1997. Investigating productive efficiency and productivity Changes
of Japanese life insurance companies. Pacific-Basin Finance Journal 5, 481-509.
Gardner, L., and Grace, M., 1993. X-efficiency in the US life insurance industry.
Journal of Banking and Finance 17, 497-410.
Greene, W., and Segal, D., 2004. Profitability and efficiency in the U.S. life
insurance industry. Journal of Productivity Analysis 21, 229–247.
Hardwick, P., 1997. Measuring cost inefficiency in the UK life insurance industry.
Applied Financial Economics 7, 37- 44.
Hao, J., and Chou, L., 2005. The Estimation of efficiency for life insurance industry:
The case in Taiwan. Journal of Asian Economics 16, 847–860.
154 Islamic Economic Studies Vol. 22, No.1
Ismail, N., Alhabshi, D., and Bacha, O., 2011. Organizational Form and Efficiency:
The Coexistence of Family Takaful and Life Insurance in Malaysia. Journal of
Global Business and Economics 3, 122-137.
Jeng, V., Lai, G., and McNamara, M., 2007. Efficiency and Demutualization:
Evidence from the U.S. Life Insurance Industry in the 1980s and 1990s. The
Journal of Risk and Insurance 74, 683-711.
Jeng, V., and Lai, G.C., 2005. Ownership structure, agency costs, specialization, and
efficiency: analysis of Keiretsu and independent insurers in the Japanese non-life
insurance industry. The Journal of Risk and Insurance 72, 105-158.
Kader, H., Adams, M., and Hardwick, P., 2010. The Cost Efficiency of Takaful
Insurance Companies. The Geneva Papers on Risk and Insurance—Issues and
Practice 35, 161–181.
Karim, A., and Jhantasana, C., 2005. Cost efficiency and profitability in Thailand’s
Life insurance Industry: A stochastic cost frontier approach. International
Journal of Applied Econometrics and Quantitative Studies 2, 19-36.
Khyzer, B., Ahmed, Z., and Warriach, K., 2011. Scale Efficiency of Islamic Banks
of Pakistan. Arabian Journal of Business and Management Review 5, 5-25.
Malmquist, S., 1953. Index Numbers and Indifference Curves. Trabajos de
Estatistica 4, 209-42.
Mansoor, S., and Radam, A., 2000. Productivity and efficiency performance of the
Malaysian life insurance industry. Journal Ekonomi Malaysia 34, 93-105.
Pakistan Financial sector Assessment, 2005. State Bank of Pakistan: Karachi.
Rees, R., and Kessner, E., 1999. Regulation and efficiency in European insurance
Markets. Economic Policy 14, 363-397.
Saad, N et al, 2006. Measuring Efficiency of Insurance and Takaful Companies in
Malaysia Using Data Envelopment Analysis (DEA). Review of Islamic
Economics 10, 5-26.
Sealey, C., and Lindley, J., 1977. Inputs, outputs and a theory of production and cost
at depository financial institutions. The Journal of Finance 32, 1251-1266.

Atiquzzafar & Uzma: Efficiency Measure of Insurance v/s Tak ful 155
Shah, A., Shah, A., and Habib, A., 2012. Comparing the efficiency of Islamic versus
conventional banking: through data envelopment analysis (DEA) model. African
Journal of Business Management 6, 787-798.
Worthington, A., and Hurley, E., 2002. Cost efficiency in Australian general
insurers: A non-parametric approach. British Accounting Review 34, 89-108.
Weiss, M., 1999. Efficiency in the Property-Liability Insurance Industry. Journal of
Risk and Insurance 58, 452-479.
Yusop, Z., Radam, A., and Ismail, N., 2011. Risk management efficiency of
conventional life insurers and Takaful operators. Insurance Markets and
Companies: Analyses and Actuarial Computations 2, 58-68.
Yuengert, M.A., 1993. The measurement of efficiency in life insurance: Estimates
of mixed normal-gamma error model. Journal of Banking and Finance 17, 483-
496.

156 Islamic Economic Studies Vol. 22, No.1
Appendix-A
Premium, Assets and Investment Income of Tak ful Industry
Year Net Premium Gross Premium Total Assets Investment Income
2006 32587061 128968834 314028583 18699897
2007 122158639 265261596 2049709638 72611699
2008 430305193 799922277 2561899601 68721395
2009 1157135909 1463608137 3015843070 189346770
2010 1580238472 2243204264 3341469369 181640658
Efficiency score of Tak ful firms
Tak ful Firms PTE SE AE CE
Tak ful Pak. 0.95 0.25 0.75 0.71
Pak-Qatar(Gen) 0.99 0.22 0.67 0.67
Pak-Qatar(FMY) 0.57 0.53 0.63 0.36
Pak-Kuwait 1.00 0.31 0.73 0.73
Dawood Takful 0.84 0.59 0.59 0.50
Mean 0.87 0.38 0.68 0.60
Malmquist Results for Tak ful Firms
FIRM EFFCH TECHCH PECH SECH TFPCH
Tak ful Pak. 2.198 0.919 1.003 2.192 2.020
Pak-Qatar(Gen) 1.045 0.915 0.989 1.056 0.956
Pak-Qatar(Fmy) 0.857 0.922 0.797 1.075 0.790
Pak-Kuwait 1.171 1.029 1.000 1.171 1.205
Dawood Takful 0.674 0.931 0.719 0.937 0.628
Mean 1.189 0.943 0.902 1.286 1.120
Atiquzzafar & Uzma: Efficiency Measure of Insurance v/s Tak ful 157
Appendix-B
List of Insurance and Tak ful Companies used in this Study
List of Insurance Companies
1. State Life Insurance Corporation Ltd.
2. Adamjee Insurance Company Ltd.
3. Askari General Insurance Company Ltd.
4. Atlas General Insurance Company Ltd.
5. Premier Insurance Company Ltd.
6. Shaheen Insurance Company Ltd.
7. E.F.U. General Insurance Company Ltd.
8. E.F.U. Life Insurance Company Ltd.
9. National Insurance Corporation Ltd.
10. New Jubilee Insurance Company Ltd.
11. International General Insurance Co. of Pak.
12. Habib Insurance Company Ltd.
List of Tak ful Companies
1. Tak ful Pakistan Ltd.
2. Pak-Qatar General Tak ful Ltd.
3. Pak-Qatar Family Tak ful Ltd.
4. Pak-Kuwait Tak ful Ltd.
5. Dawood Family Tak ful Ltd
