efficiency control of risk - dow
TRANSCRIPT

dows.com
358 US Route One, Falmouth, Maine 04105 207.878.3000 800.578.9981 [email protected]
Copyright ©2007 Dow Publishing Company, Inc. All Rights Reserved. -1-
EFFICIENCY AND THE CONTROL OF RISK: THE ESSENCE OF SUCCESSFUL PORTFOLIO MANAGEMENT
The purpose of this paper is not to pontificate on how one should invest his money. Our clients already know that we have few inhibitions expounding on that score. The intent here is to suggest the appropriate subjects of scrutiny for those interested in how their money is managed, whether they manage it themselves or have somebody else manage it for them.
TABLE OF CONTENTS Areas of Focus ......................................................................1 Market Risk Modification ...................................................... 8 Performance and Rates of Return........................................2 Modifying Market Risk in a Bond Portfolio ........................... 8 Definitions of "Loss," "Risk," and "Volatility".........................2 Modifying Market Risk in a Common Stock Portfolio .......... 8 How to Control Risk and Volatility ........................................2 Efficiency in the Management of a Portfolio ........................ 9 Asset Allocation.....................................................................3 Sources of Investment Inefficiency ....................................10 Diversification ........................................................................3 Measuring the Magnitude of Inefficiency ...........................11 Quality Discrimination ...........................................................4 Illustrations of the Importance of Efficiency .......................12 Determining the Quality of a Common Stock or Bond.........4 Back, Again, to Performance and Rates of Return ...........12 Measuring the Quality of a Portfolio .....................................5 Past Performance as a Measure of a Money Manager ....13 Measuring the Quality of a Mutual Fund ..............................6 How We Can, and Cannot, Enhance Portfolio Return ......14 1998 - An Example of a Payback for Quality .......................7 Conclusion...........................................................................14
AREAS OF FOCUS There appear to be three major areas upon which one might focus in the management of an investment portfolio: (1) The nature and degree of risk and volatility to which the portfolio is exposed; (2) the monetary efficiency with which the portfolio functions; and (3) the rate of return that the portfolio generates.
It is my personal impression, in observing the actions and comments of others over the years, and especially so in the years of the great bull market that has persisted with little interruption since August of 1982, that more and more investors focus, first and predominantly, upon performance and rates of return, with the issues of risk and efficiency less well understood and so largely neglected.
It is my belief that, if one wishes truly to maximize the probability of long-term investment success which, in the future, may entail coping with bear markets as well as bull markets, recessions as well as recoveries, credit crunches as well as periods of declining interest rates, and conceivably even deflation or depression, as well as inflation, disinflation, and economic boom, the prioritizing of, and emphasis on, the three above-mentioned considerations should be as follows:
1. A portfolio's exposure to risk should be, overwhelmingly, the primary consideration. 2. Though secondary, the matter of efficiency should be given intense consideration. 3. The issue of performance and rates of return should be a non-consideration.

dows.com
358 US Route One, Falmouth, Maine 04105 207.878.3000 800.578.9981 [email protected]
Copyright ©2007 Dow Publishing Company, Inc. All Rights Reserved. -2-
PERFORMANCE AND RATES OF RETURN We shall have more to say about performance and rates of return farther on. At this point, however, let us explain briefly why this subject is relegated to such a low position on the above totem pole. The answer is that, after we have made the decisions about the exposure of our portfolio to risk and volatility and have attempted to optimize the efficiency with which our portfolio functions, we no longer have any control over its performance and rate of return.
Safety and return are correlated inversely and rigidly, as are the two ends of a teeter board. To try to push one end up with the expectation that the other end will not go down is futile.
Furthermore, it seems pretty safe to say that, though investors vary widely with respect to their individual tolerances for risk and volatility, they all share the common goal of wanting to maximize the after-tax rates of return on their portfolios.
DEFINITIONS OF "LOSS," "RISK," AND "VOLATILITY There are two kinds of financial loss. We can lose our principal and/or we can lose our purchasing power. We lose our principal when we buy a stock at $50 per share and sell it at $25 per share; and we lose purchasing power when we hold bonds for a quarter of a century, during which inflation averages 3%, and so are able to purchase only half the goods and services with the bonds' principal at the end of the period as we could have at the beginning.
Let us define "risk" as the "possibility of a loss that is permanent" and "volatility" as the "probability that losses will be only temporary."
Let us further recognize a gray area between risk and volatility. What, for a long investment time horizon portfolio, may be simple volatility, for a shorter time horizon, may be bona fide risk. While a twenty-year U. S. Government bond presumably poses no risk of money loss for the investor who puts it away for twenty years, it poses the possibility of a considerable money loss for one who might choose to sell it in five or ten years.1
HOW TO CONTROL RISK AND VOLATILITY There are four important ways in which we can control the nature and magnitude of the risk and volatility to which a portfolio is exposed:
1. asset allocation 2. security diversification 3. quality discrimination 4. market risk modification
1 The resale price of a bond moves inversely with interest rates and, the longer until the bond matures, the wider the price fluctuations can be.

dows.com
358 US Route One, Falmouth, Maine 04105 207.878.3000 800.578.9981 [email protected]
Copyright ©2007 Dow Publishing Company, Inc. All Rights Reserved. -3-
ASSET ALLOCATION Asset allocation is the deployment of one's financial resources among various asset categories. In an earlier era, asset allocation typically referred to the disposition of a portfolio among the three major asset classes - cash, bonds, and common stocks. In more recent times, the asset allocation decision has come to include sub-categories of these three major asset classes, as well as new categories outside the traditional three. Within the universe of common stocks, for example, one might select among growth, income, value, and cyclical stocks, or among large-cap, mid-cap, small-cap, and micro-cap stocks. Other asset categories now commonly used in the asset allocation process include convertible bonds, real estate investment trusts, venture capital, gold, foreign securities, limited partnerships, options, and commodities futures. In fact, the number of financial assets to which allocations might be made is limited only by the imagination of the asset allocator.
Needless to say, the simplest way to minimize the exposure of a portfolio to volatility and the risk of a money loss is to keep it invested in cash - bank CDs, money market funds, or U. S. Treasury bills. Unfortunately, such a strategy also maximizes the portfolio's exposure to the risk of a purchasing power loss and minimizes its expected return. In search of higher returns, then, investors venture out to bonds, common stocks, and other more volatile and riskier assets.
It is important to recognize that arriving at an optimum asset allocation is more a personal than a financial decision. Whether one should be 100% in cash, 100% in common stocks, or somewhere in between depends upon one's personal tolerance for volatility and risk. There is no "one-size-fits-all" financially correct asset allocation, nor is there any mathematical formula for arriving at an appropriate asset allocation for any individual investor.
The asset allocation decision is often compared to one of choosing between "eating" well and "sleeping" well. While there is, hopefully for everyone, some choice that will permit both, the analogy does illustrate how truly subjective the asset allocation decision is.
If we are confused by the great proliferation of options in the asset allocation process, it is suggested that a simple return to basics will go far toward resolving the issue. If we think in terms of just cash, bonds, and common stocks, and allocate accordingly, most of the risk control available in the asset allocation decision will have been achieved.2
DIVERSIFICATION Assuming that we are going to venture beyond cash, we, then, become interested in the second way of controlling volatility and risk - diversification.
2 To make the asset allocation decision still easier, and probably more efficient, it is suggested that one even cast out consideration of bonds. By allocating between just cash and common stocks, historically, one has been able to achieve greater safety, less volatility, and higher returns than by including bonds in a portfolio. Please see the article, "A 'Barbell' Approach to Asset Allocation," on our web site.

dows.com
358 US Route One, Falmouth, Maine 04105 207.878.3000 800.578.9981 [email protected]
Copyright ©2007 Dow Publishing Company, Inc. All Rights Reserved. -4-
Diversification refers to the ownership of securities within the same asset category but of different issuers. In the case of corporate bonds and common stocks, diversification implies not having a heavy concentration in the security of any one company or even in the securities of companies in any one industry.
When taking initial positions in securities, diversification is not a difficult objective to pursue. One merely makes sure his commitment to each new acquisition is modest in size. Nor is it difficult to maintain good diversification in a tax-sheltered account. If one has the good fortune to own a common stock that appreciates so much that his portfolio becomes heavily concentrated in it, the size of the position can be pruned without any tax consequence. In a taxable account, however, the sale of a highly appreciated common stock for the purpose of diversifying can be a less pleasant experience.
Even in the best of times, what appeared to be a good common stock can go sour. Diversification, then, is a strategy for bull markets as well as bear markets. Good diversification is achieved to the extent that an isolated precipitous decline in the price of an individual security in a portfolio would not be an overly emotional experience.
As a rule-of-thumb, initial stock positions probably ought not exceed 5%, and initial industry positions probably ought not exceed 10%, of the value of a portfolio; and, when a single issue grows to 10%, or an industry position grows to 20%, of the entire value of a portfolio, the situation might become worrisome.3
QUALITY DISCRIMINATION It is in the area of quality discrimination that investors seem to be most at sea in controlling the risk to which they expose their portfolios. It is my personal impression that great numbers of investors give little consideration to the quality of the securities they own and, of those concerned with quality, many are uncertain about how to measure it.
One of the ironies of the issue of quality is that common stock investors usually give even less consideration to this factor than do bond investors. This is so, in spite of the fact that the common stock of a given company is always riskier than even the lowest quality bond of that same company. In other words, though a focus on quality would seem to be of critical importance in either instance, it would seem to be of even greater importance to a common stock investor than to a bond investor.
DETERMINING THE QUALITY OF A COMMON STOCK OR BOND There is more than one way to measure the quality of a security We usually do it with Standard & Poor's ratings. S&P common stock ratings are based upon the growth and stability of a
3 For more information on "How Many Stocks to Buy," please see the article by that title on our web site.

dows.com
358 US Route One, Falmouth, Maine 04105 207.878.3000 800.578.9981 [email protected]
Copyright ©2007 Dow Publishing Company, Inc. All Rights Reserved. -5-
company's earnings and dividends over the previous ten years. In explaining the rationale of its approach, S&P says the following:
The investment process involves assessment of various factors - such as products and industry position, corporate resources and financial policy - with results that make some common stocks more highly esteemed than others. In this assessment, Standard & Poor's believes that earnings and dividend performance is the end result of the interplay of these factors and that, over the long run, the record of this performance has a considerable bearing on relative quality.
Capital structure, for example, is indirectly reflected in these ratings in that a highly leveraged balance sheet would generate a more volatile earnings record and so a lower S&P rating.
A Value Line "Financial Strength" rating might be used as a measure of quality except that its emphasis is largely on the balance sheet, and so it gives less recognition to the nature of the business in which the company operates. Because of the stability of its industry, for example, a pharmaceutical company should be able to tolerate comfortably more debt in its capital structure than a cyclical automobile company or a company in the rapidly evolving computer industry.4
A Value Line "Safety" rating might also be used as a measure of quality. This rating is a combination of a company's "Financial Strength" rating and the relative volatility of its stock over some period of time. If, however, we define "quality" as a measure of the reliability of the underlying company, if we reserve the concept of "market risk" (which we shall discuss shortly) for issues dealing with the pricing of a common stock relative to these fundamentals, and if we distinguish between "risk" and "volatility," the Value Line "Safety" rating seems like a hybrid that is both redundant and superfluous.
MEASURING THE QUALITY OF A PORTFOLIO Measuring the quality of a whole portfolio of securities using Standard & Poor's quality ratings is a bit more complex than looking up the rating on an individual issue. It is, however, a technique easily available to anybody who wants to spend a little time at it; and doing so could be as important to one's financial well being as taking one's blood pressure could be to his physical well being.
If one is measuring the quality of a bond portfolio, he needs a Standard & Poor's Bond Guide; and, if he is measuring the quality of a common stock portfolio, he needs a Standard & Poor's Stock Guide. Most libraries carry these publications, and one's broker will usually be happy to send one to a client. The guides are published monthly but, for our purposes here, a several-month-old copy is nearly as good as an up-to-date one. The S&P rating on a specific bond or common stock does not change very often. 4 Many of the common stocks in a category we call "aggressive growth" do not have long enough histories to have earned S&P ratings. In these cases we defer to the Value Line "Financial Strength" ratings for purposes of quality discrimination.
dows.com
358 US Route One, Falmouth, Maine 04105 207.878.3000 800.578.9981 [email protected]
Copyright ©2007 Dow Publishing Company, Inc. All Rights Reserved. -6-
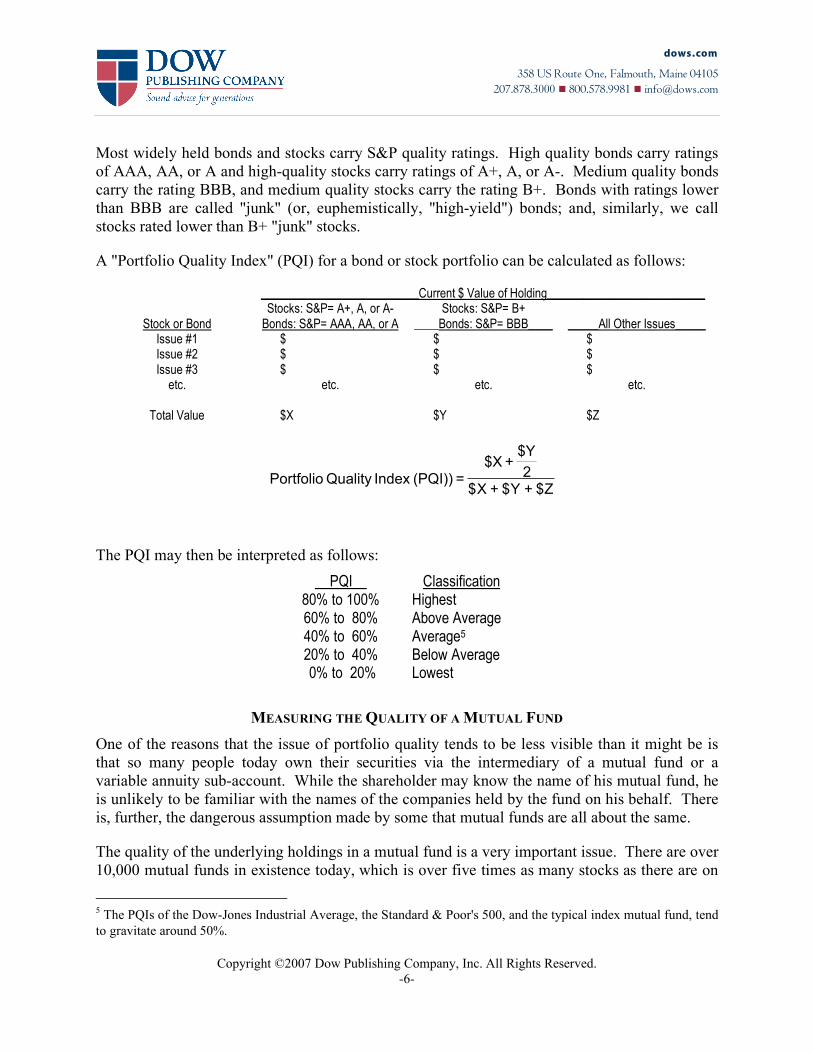
Most widely held bonds and stocks carry S&P quality ratings. High quality bonds carry ratings of AAA, AA, or A and high-quality stocks carry ratings of A+, A, or A-. Medium quality bonds carry the rating BBB, and medium quality stocks carry the rating B+. Bonds with ratings lower than BBB are called "junk" (or, euphemistically, "high-yield") bonds; and, similarly, we call stocks rated lower than B+ "junk" stocks.
A "Portfolio Quality Index" (PQI) for a bond or stock portfolio can be calculated as follows:
__________________________Current $ Value of Holding__________________________
Stock or Bond Stocks: S&P= A+, A, or A-
Bonds: S&P= AAA, AA, or A Stocks: S&P= B+
____Bonds: S&P= BBB____
_____All Other Issues_____ Issue #1 $ $ $ Issue #2 $ $ $ Issue #3 $ $ $
etc. etc. etc. etc.
Total Value $X $Y $Z
The PQI may then be interpreted as follows:
PQI Classification 80% to 100% Highest 60% to 80% Above Average 40% to 60% Average5 20% to 40% Below Average 0% to 20% Lowest
MEASURING THE QUALITY OF A MUTUAL FUND One of the reasons that the issue of portfolio quality tends to be less visible than it might be is that so many people today own their securities via the intermediary of a mutual fund or a variable annuity sub-account. While the shareholder may know the name of his mutual fund, he is unlikely to be familiar with the names of the companies held by the fund on his behalf. There is, further, the dangerous assumption made by some that mutual funds are all about the same.
The quality of the underlying holdings in a mutual fund is a very important issue. There are over 10,000 mutual funds in existence today, which is over five times as many stocks as there are on
5 The PQIs of the Dow-Jones Industrial Average, the Standard & Poor's 500, and the typical index mutual fund, tend to gravitate around 50%.
$Z+$Y+$X
2
$Y+$X
=(PQI) Index Quality Portfolio
Z$+Y$+X$2
$Y + $X
=(PQI))Index Quality Portfolio

dows.com
358 US Route One, Falmouth, Maine 04105 207.878.3000 800.578.9981 [email protected]
Copyright ©2007 Dow Publishing Company, Inc. All Rights Reserved. -7-
the New York Stock Exchange, and the quality of their portfolios ranges from the sublime to the ridiculous. Furthermore, being judged largely upon performance alone, mutual funds have tended to hold increasingly aggressive, lower quality portfolios in recent years.
One way of measuring the quality of a mutual fund portfolio is to get a copy of the portfolio and use the technique described above. Because so many mutual funds hold well over one-hundred different issues, however, this may not be an easy task.
A good alternative is to use a page on the fund from the Morningstar or CDA/Wiesenberger service which will show the fund's top twenty-five or so holdings.6 The presumption that might be made is that the rest of the fund's portfolio is of the same quality character as its largest holdings.7
1998 - AN EXAMPLE OF A PAYBACK FOR QUALITY Incorporating high-quality in a common stock portfolio is comparable to buying fire insurance on our house. In particular, we do not need it unless we have a fire. Similarly, we really have not needed portfolio insurance during most of the current great bull market which got underway in August of 1982.
1998, however, was instructive. It was the year that the economies and currencies of the Far East went into free fall, and those of Latin America followed suit. Investors around the world became increasingly concerned about the possibility of global depression, deflation, and even an international monetary collapse. The result was what is known as a "flight to safety" or a "flight to quality." Money invested in these so-called "emerging" markets left those markets and came to the United States as a safer haven, causing the emerging markets to go down and the U. S. markets to be buoyed up. Similarly, money invested in low-quality U. S. securities was redeployed into issues of higher-quality, causing the latter to outperform the former. Just how one might have protected himself from the ensuing stock market carnage by maintaining a portfolio with a respectable "Portfolio Quality Index" is illustrated in the following table:
6 In the case of many bond portfolios Morningstar conveniently calculates for us the "average credit quality" of the entire portfolio. 7 Actually, this may be a rather generous assumption. That is because mutual funds tend to have their larger holdings in larger capitalization companies which, in turn, tend to be higher quality companies than are smaller capitalization companies. Looking at just the top holdings of a mutual fund, then, is apt to bias its PQI upward.

dows.com
358 US Route One, Falmouth, Maine 04105 207.878.3000 800.578.9981 [email protected]
Copyright ©2007 Dow Publishing Company, Inc. All Rights Reserved. -8-
IMPACT OF THE 1998 FLIGHT TO QUALITY ON MUTUAL FUND PORTFOLIOS OF VARYING QUALITY
Market Sector
Average PQI % Total Return
12/31/97 to 9/11/98 Latin America Funds 0% -52.24% Diversified Emerging Market Funds 0% -39.24% U. S. Small Cap Funds 18% -18.10% U. S. Mid-Cap Funds 25% -8.50% U. S. Large Cap Funds 77% +1.92%
The above computations are derived from data found in the Standard & Poor's and Morningstar Mutual Fund services.
MARKET RISK MODIFICATION Market risk refers to the vulnerability of a security uniquely attributable to the level of its price. Market risk may manifest itself in the collapse of a security's price, either because of a change in the investment community's perception of that particular company or because of a change in the community's perception of the entire industry or other category of which that particular security is a member.
MODIFYING MARKET RISK IN A BOND PORTFOLIO For a high-quality bond or a high-quality bond portfolio, market risk is almost synonymous with "interest rate" risk. Falling interest rates tend to push the prices of bonds up, while rising rates tend to push them down.
We can modify our market risk in a bond portfolio by modifying the average maturity of the bonds in the portfolio. If we lengthen the average maturity of the portfolio, we increase our exposure to market risk; and, if we shorten the average maturity, we lessen our exposure to market risk.
One common tool for trying to control market risk in a bond portfolio is the "yield curve." The yield curve is a plot of bond maturities on the horizontal axis and bond yields on the vertical axis, as seen in the chart to the right. The traditional yield curve rises sharply in the early years and more gradually in the later years. It is often argued that an optimum maturity for buying bonds is at the break in the yield curve, or where the curve turns most sharply from steep to relatively flat.8 It is felt that, at this maturity, one has reached a point of diminishing returns, in that
8 Mathematicians would refer to this "break" in the yield curve as a "point of inflexion."
Yield Curve Yield
Maturity
dows.com
358 US Route One, Falmouth, Maine 04105 207.878.3000 800.578.9981 [email protected]
Copyright ©2007 Dow Publishing Company, Inc. All Rights Reserved. -9-
exposing oneself to the risk of still longer maturities produces too little incremental return.9
In recent years, the break in the yield curve has commonly occurred at about three- to five-year maturities. At such times, though owning longer maturities would have exacerbated market risk, there would appear to have been little in the way of additional return available for doing so.
MODIFYING MARKET RISK IN A COMMON STOCK PORTFOLIO In the case of common stocks, we can control market risk by modifying the price-earnings ratios to which we allow our portfolio to be exposed.10 A useful tool for this purpose is what is known as the "relative price-earnings ratio" which ratio is published by the Value Line service for the companies it covers, and can be easily calculated, in any event.11 If a common stock sells at a relative price-earnings ratio of 1.50, for example, we might conclude that it harbors a market risk that is 50% greater than that of the average common stock.12
As a rule-of-thumb, it might be prudent to consider pruning large positions in stocks with relative price earnings ratios in excess of 2.00.13
Probably the best example of the potential consequences of exposing a common stock portfolio to excess market risk is the collapse of the so-called "nifty fifty" in the early 1970s. The nifty fifty was a group of large capitalization growth stocks which, at their peak, had price-earnings ratios that averaged 42-to-1 and relative price-earnings ratios that averaged 2.2-to-1. During the bear market that followed, while the market as a whole (as measured by the Standard & Poor's 500) declined by 48%, the nifty-fifty, collectively, declined 62%, with some stocks in the group declining over 90%.14
EFFICIENCY IN THE MANAGEMENT OF A PORTFOLIO With the stock market's having been so extravagantly rewarding to almost everybody who has participated in it over the past seventeen years, there does not seem to have been a great deal of emphasis by investors placed upon efficiency. If one earned the 10% produced by the average equity mutual fund in 1998, he may have been less concerned over the fact that the stock market,
9 Value Line, in its "Selections & Opinions," publishes weekly a U. S. Treasury yield curve to which one might refer. 10 Besides the price-earnings ratio, other yardsticks frequently used to measure market risk include the price-to-sales ratio, the price-to-cash flow ratio, and the price-to-book ratio. 11 To calculate a company's relative price-earnings ratio, divide its price-earnings ratio by the price-earnings ratio of the market as a whole. 12 For more information on price-earnings ratios, relative price-earnings ratios, and a more esoteric concept we call the "relative relative" price-earnings ratio, please see our paper, "High Price-Earnings Ratios and the Control of Risk," on our web site. 13 Alternatively, one might use a "relative relative" price-earnings ratio of 1.50 as a hurdle rate. Please see the preceding footnote. 14 For more on the "nifty fifty," please see our paper, "High Price Earnings Ratios and the Control of Risk," on our web site.

dows.com
358 US Route One, Falmouth, Maine 04105 207.878.3000 800.578.9981 [email protected]
Copyright ©2007 Dow Publishing Company, Inc. All Rights Reserved. -10-
as measured by the Standard & Poor's 500 Stock Index, returned 29%, and so he should have been able to earn 29% simply by selecting stocks at random from the index and never bothering to manage his portfolio thereafter. After all, even after the 19% shortfall is subtracted from the 29% return, the investor still nets 10% - hardly catastrophic.
If, however, one is willing to recognize that stock market returns, historically, have averaged 11% per year, not 29% per year, and that bond returns have averaged less than half what the stock market has averaged, he will soon realize that the efficiency with which stocks and bonds are owned can be a very important factor over the long term.
Let me provide an example of the ultimate in inefficient portfolio management. An individual recently told me of an investment firm meeting he had attended, sponsored by a competitor of ours. He said that the firm was advising people to employ it to help them find a service which, in turn, would help select and monitor a manager who would manage a portfolio of mutual funds for them. The individual wondered what ever was happening at that firm to the old fashioned broker who, himself, used to help clients assemble and manage investment portfolios.
Contemplate the absurdity of what this individual had observed. People were being asked to pay a brokerage firm to engage a service to select a manager who would second guess mutual fund managers who, in turn, are trying to second guess corporate managers. Paying for five levels of management service can, indeed, detract considerably from the efficiency of investing.
The essence of efficiency in the management of one's investments is not paying for services that add negligible value to the investment process. The greatest irony of all, however, is that so many services for which investors pay dearly actually impact negatively upon their returns. They are not only no better off for utilizing the services, they are worse off.
SOURCES OF INVESTMENT INEFFICIENCY The most conspicuous sources of investment inefficiencies are mutual funds, variable annuities, and fee-based managed accounts.
To understand how one measures inefficiencies in investing, one must first understand the concept of a legitimate market benchmark. A market benchmark is typically a market index which is made up of a representative cross-section of securities of a particular type. For common stocks, the most commonly used benchmark is the Standard & Poor's 500.
When comparing the performance of a portfolio of securities against the Standard & Poor's 500, it should be realized that this index represents large capitalization stocks which, in turn, means that, on average, it consists of higher quality stocks than most other stock market indices.
It should next be realized that, because an index is not actively managed, the performance of a broadly diversified portfolio of stocks, randomly selected from those in the index and never managed thereafter, should approximate the performance of the index. Though such a portfolio

dows.com
358 US Route One, Falmouth, Maine 04105 207.878.3000 800.578.9981 [email protected]
Copyright ©2007 Dow Publishing Company, Inc. All Rights Reserved. -11-
is not apt to track the index precisely, it should track the index quite closely; and, furthermore, the likelihood of such a portfolio's performing better than the index is just as great as its performing worse.
If, over a reasonable period of time, a common stock portfolio, made up of stocks of no higher quality than those in the Standard & Poor's 500, underperforms that index, the inescapable conclusion must be that it is an inefficient investment vehicle. Furthermore, the measure of its inefficiency is no less than the amount by which it underperforms that index.
Nor is it useful, in such an instance, to show how a portfolio may have outperformed a lower quality index such as the Standard & Poor's MidCap or SmallCap index or the Russell 2000. If a portfolio of lower quality securities performs less well than the S&P 500, then, in addition to being less efficient than a portfolio randomly selected from the S&P 500 and unmanaged, it is also more risky. There is no point in taking on added risk to reap a lower return.
MEASURING THE MAGNITUDE OF INEFFICIENCY Mutual funds and variable annuities operate in fish bowls, and so the various financial services are able to measure their track records, individually and collectively, with precision.
The following table shows the performance of the average bond mutual fund, relative to the Lehman Brothers Long-Term U. S. Government bond index, and the performance of the average stock mutual fund, relative to the Standard & Poor's 500 Stock Index, over various periods ending December 31, 1998. It also shows the incremental income experienced by the investor invested in the same asset class directly, as opposed to indirectly via mutual funds:
AVERAGE ANNUAL TOTAL RETURN FOR PERIODS ENDING DECEMBER 31, 1998 CATEGORY 1 YEAR 3 YEARS 5 YEARS 10 YEARS 15 YEARS 20 YEARS
U. S. Government Bonds 12.66% 8.75% 9.21% 11.46% 12.56% 11.15% Bond Mutual Funds 5.12% 5.87% 5.49% 7.55% 8.62% 8.42%
Efficiency Shortfall 7.54% 2.88% 3.72% 3.91% 3.94% 2.73% Return on Direct Investments vs. Mutual Funds +147% +49% +68% +52% +46% +32%
Common Stocks 28.57% 28.23% 24.06% 19.21% 17.90% 17.75% Stock Mutual Funds 9.74% 14.69% 13.03% 13.79% 13.34% 15.28%
Efficiency Shortfall 18.83% 13.54% 11.03% 5.42% 4.56% 2.47% Return on Direct Investments vs. Mutual Funds +193% +92% +85% +39% +34% +16%
Source: CDA/Wiesenberger. Proxy for bond funds = "All Fixed Income" and proxy for stock funds = "All Equity."
As can be seen, over the past twenty years, while an unmanaged list of long-term U. S. Government bonds returned an average of 11.15% per year, the average "professionally" managed bond mutual fund returned only 8.42% per year - an average shortfall of 2.73% per year. Put another way, by owning U. S. Government bonds outright, one earned 32% more than by owning a typical bond mutual fund. Particularly astounding is the nearly tripling of the average annual shortfall from the 20-year average of 2.73% to 7.54% in 1998. (For variable
dows.com
358 US Route One, Falmouth, Maine 04105 207.878.3000 800.578.9981 [email protected]
Copyright ©2007 Dow Publishing Company, Inc. All Rights Reserved. -12-
annuities invested in bond funds, the average shortfall over the 20-year period was 4.13% per year, providing the direct investor with a 59% advantage over the variable annuity investor.)
In the case of common stocks, though the mutual fund efficiency shortfall has averaged 2.47% (3.17% for variable annuities) per year over the past twenty years, it has also been growing larger in the more recent periods. In 1998, the efficiency shortfall for the average equity mutual fund was a staggering 18.83% - over seven times the average of the previous twenty years. By owning his stocks outright in 1998, an investor could have earned nearly three times as much on his investments as by owning the average equity mutual fund. The inefficiencies inherent in mutual funds is explained largely by "market impact costs" - the sacrifices in transaction prices institutions must accept in order to buy and sell the large blocks of stocks in which they must deal.15
The magnitude of inefficiency in a fee-based managed account depends largely upon the size of the management fee being paid, but also depends upon the magnitude of market impact costs if the management company pools its trades and executes them in large blocks. To the degree that bonds and cash, as opposed to common stocks, are held in a fee-based managed account, the portfolio is apt to be less efficient. That is because the fees charged will probably consume a greater proportion of the total return generated by the bonds and cash over time.
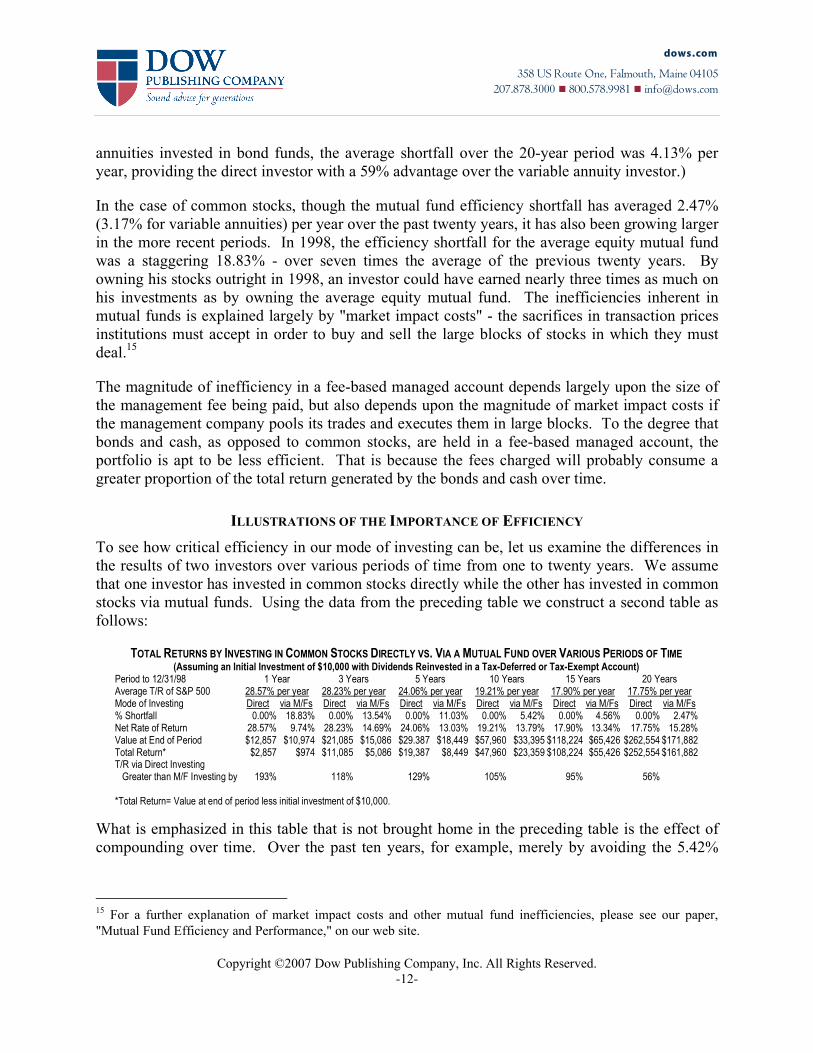
ILLUSTRATIONS OF THE IMPORTANCE OF EFFICIENCY To see how critical efficiency in our mode of investing can be, let us examine the differences in the results of two investors over various periods of time from one to twenty years. We assume that one investor has invested in common stocks directly while the other has invested in common stocks via mutual funds. Using the data from the preceding table we construct a second table as follows:
TOTAL RETURNS BY INVESTING IN COMMON STOCKS DIRECTLY VS. VIA A MUTUAL FUND OVER VARIOUS PERIODS OF TIME (Assuming an Initial Investment of $10,000 with Dividends Reinvested in a Tax-Deferred or Tax-Exempt Account)
Period to 12/31/98 1 Year 3 Years 5 Years 10 Years 15 Years 20 Years Average T/R of S&P 500 28.57% per year 28.23% per year 24.06% per year 19.21% per year 17.90% per year 17.75% per year Mode of Investing Direct via M/Fs Direct via M/Fs Direct via M/Fs Direct via M/Fs Direct via M/Fs Direct via M/Fs % Shortfall 0.00% 18.83% 0.00% 13.54% 0.00% 11.03% 0.00% 5.42% 0.00% 4.56% 0.00% 2.47% Net Rate of Return 28.57% 9.74% 28.23% 14.69% 24.06% 13.03% 19.21% 13.79% 17.90% 13.34% 17.75% 15.28% Value at End of Period $12,857 $10,974 $21,085 $15,086 $29.387 $18,449 $57,960 $33,395 $118,224 $65,426 $262,554 $171,882 Total Return* $2,857 $974 $11,085 $5,086 $19,387 $8,449 $47,960 $23,359 $108,224 $55,426 $252,554 $161,882 T/R via Direct Investing Greater than M/F Investing by
193%
118%
129%
105%
95%
56%
*Total Return= Value at end of period less initial investment of $10,000.
What is emphasized in this table that is not brought home in the preceding table is the effect of compounding over time. Over the past ten years, for example, merely by avoiding the 5.42%
15 For a further explanation of market impact costs and other mutual fund inefficiencies, please see our paper, "Mutual Fund Efficiency and Performance," on our web site.

dows.com
358 US Route One, Falmouth, Maine 04105 207.878.3000 800.578.9981 [email protected]
Copyright ©2007 Dow Publishing Company, Inc. All Rights Reserved. -13-
average annual shortfall experienced by the mutual fund investor, the direct investor more than doubled the return on his money.
Efficiency in the management of an investment portfolio clearly can be just as important as the asset allocation decision. An investor may easily negate all the incremental return he expects from owning stocks instead of bonds, or bonds instead of cash, by having his securities held by an inefficient intermediary.
BACK, AGAIN, TO PERFORMANCE AND RATES OF RETURN As indicated earlier, once an investor has arrived at an allocation of his financial assets to the investment categories with which he is comfortable, after he has established some diversification guidelines, after he has defined the parameters of quality that he requires of his individual investments, after he has put limits on the market risk to which he wants his portfolio exposed, and after he has determined the vehicle by which he will acquire and hold his investments, there is not much room left to influence performance and rates of return.
Admittedly, fine tuning and maintaining the character of a portfolio might consist of: (1) selling a stock that is no longer growing in a growth portfolio and replacing it with one that is; (2) pruning the position in a highly-appreciated stock; (3) replacing a stock or bond that is no longer high-quality in a high-quality portfolio; or (4) lightening or eliminating the position in a stock with an abnormally high price-earnings ratio.
Efficacy in making such decisions, however, is better measured directly by these same criteria than by examining the results achieved after the fact. Inferring how well a portfolio is managed by comparing its rate of return with some benchmark is like judging the condition of an airplane by whether we arrive at our destination early, on time, late, or not at all. It is far more comforting to know that somebody has checked out the condition of the craft before it takes off, rather than deducing what its condition must have been, after it is on the ground again. Nor should we penalize the pilot if our flight is delayed because he chose to make an extra safety check before take-off.16
PAST PERFORMANCE MEASUREMENTS OF MONEY MANAGERS Fee-based money managers, as do mutual funds, typically market their wares on the basis of the rates of return they demonstrate having achieved for their clients in the past. Because of past abuses in calculating and presenting such data, much effort has been going into the development of uniform "performance presentation standards," whereby managers are all being expected to use the same techniques for measuring and presenting their past performance. To conform to these evolving and increasingly complex standards, money managers are being required to
16 Alternative analogy: We should not regret having owned a high quality security or a high quality portfolio during a period when low quality does better than high quality anymore than we should regret having spent money on fire insurance on our house during a period when our house did not burn down.

dows.com
358 US Route One, Falmouth, Maine 04105 207.878.3000 800.578.9981 [email protected]
Copyright ©2007 Dow Publishing Company, Inc. All Rights Reserved. -14-
expend considerable time, energy, and money in categorizing their portfolios into composites, adjusting for cash flows in and out of each portfolio, and measuring with precision the total returns generated from one period to the next. The utility of such measurements, however, is questionable for three reasons:
(1) Countless studies, over the past four decades, have demonstrated the validity of the "efficient market hypothesis," which asserts essentially that an investor cannot outperform the market sector in which he invests with a probability greater than that of random chance. Furthermore, when measured in terms of rates of return, there is no positive correlation between the past performance of a money manager and his future performance. Performance measurement, then, is the measurement of "luck," not "skill."17
(2) As performance measurement is increasingly refined, it becomes more costly to provide. Such costs must ultimately be borne by the money manager's clients, and so these clients' portfolios become burdened with still greater inefficiency.
(3) Investors utilizing such information, not only derive no benefit from it and pay a price for receiving it, but may be misled into making inappropriate money manager selections by using it.
HOW WE CAN, AND CANNOT, ENHANCE PORTFOLIO RETURN We can enhance the return on our portfolio by changing our asset allocation and so exposing our portfolio to greater volatility. We may be able to enhance its return by exposing it to greater risk. If we win, we enjoy a greater return; if we lose, we experience a lesser return. We may also be able to enhance our return by improving the efficiency with which our portfolio is managed.
We cannot enhance our return by moving back and forth among cash, bonds, and stocks; by moving back and forth between the U. S. stock market and foreign stock markets; by rotating among investment categories; or by trying to exploit mispriced securities in the marketplace. Nor can we enhance our return by employing a money manager to try to do these things for us.
Though, intuitively, we may think it should be possible for somebody to perform these several feats successfully, empirically, we know it is not. The reason we know is because nobody has yet been identified who can perform them with a consistency greater than that of random chance.
CONCLUSION Learning about investing is as much learning about human limitations and what it is not within our power to do, as it is learning about opportunities and what it is within our power to do.
17 For more on the "efficient market hypothesis," please see our paper, "The Mother of All Hedge Funds and the Efficient Market Hypothesis," on our web site.

dows.com
358 US Route One, Falmouth, Maine 04105 207.878.3000 800.578.9981 [email protected]
Copyright ©2007 Dow Publishing Company, Inc. All Rights Reserved. -15-
If we will focus upon the risks to which we subject our portfolio and the efficiency with which it functions, and leave to fate the rates of return that we are dealt, we shall have done all we can do. Over time, we will do neither better nor worse than others with the same portfolio profile. With the conviction that we have done the best that could humanly be done, we should then be satisfied. Clifford G. Dow, Sr., CFA, CHFC, CFP® Chief Investment Officer 1999 Securities offered through Delta Equity Services Corporation. Advisory services offered through Delta Global Asset Management, an SEC Registered Investment Advisor. 579 Main Street, Bolton, MA 01740 978.779.5361 FINRA SIPC MSRB