efficiency and productivity in the australian health care … · cullen and ergas: efficiency and...
TRANSCRIPT

Attachment 1
AHMAC CEOs Strategic Discussion 10 April 2014 – Agenda paper – Attachment 1 (issued 3 April 2014) 1
Efficiency and Productivity in the Australian Health Care Sector
David Cullen and Henry Ergas1
Contents
1 Introduction .......................................................................................................................... 2
Overview of the paper .......................................................................................................... 4
2 A macro view of the relationship between health and productivity .................................... 9
Macro drivers of health expenditure .................................................................................... 9
Macro outcomes of health expenditure ............................................................................. 11
Macro efficiency of the Australian health care system ...................................................... 13
Health’s contribution to economic growth ......................................................................... 14
3 Measuring productivity in health ........................................................................................ 20
Theoretic difficulties in conceptualising productivity in health .......................................... 20
A primer on efficiency and productivity in health .............................................................. 26
Current measures of productivity in health ........................................................................ 31
4 Drivers of inefficiency in health .......................................................................................... 33
Are inputs and outputs measured appropriately? .............................................................. 34
Are the right incentives in place? ........................................................................................ 35
5 Conclusion ........................................................................................................................... 38
Appendix A: Allocative and social (distributive) efficiency ...................................................... 40
1 The views expressed in this paper are those of the authors and do not necessarily represent the views of
the governments, or the departments of health, of the Commonwealth of Australia or of any state or territory.
David Cullen is Assistant Secretary, Strategic Policy Unit, Australian Department of Health; Adjunct Professor of Health Economics and Aged Care Policy at the National Centre for Social and Economic Modelling; and Adjunct Senior Fellow at the Australian National University’s Australian Centre for Economic Research on Health.
Henry Ergas is the Senior Economic Adviser at Deloitte Australia and Inaugural Professor of Infrastructure Economics at the University of Wollongong’s SMART Infrastructure Facility.

Cullen and Ergas: Efficiency and Productivity in the Australian Health Care Sector
2
1 Introduction
If, as the Maori proverb says, ‘language is the window to the soul’, then productivity and, in
particular, public sector productivity are, it seems, the new black.2 Usage of the term
‘productivity’ increased dramatically in public discourse over the last century, to the stage
where it now appears almost as often as the term ‘efficiency’. Concern with public sector
efficiency and public sector productivity is a much more recent phenomenon, and here the
two terms seem to have developed concurrently (see the Ngrams in Figure 1).
Figure 1 Ngrams of the use of the terms ‘efficiency’ and ‘productivity’ in public discourse3
2 In one week in early March 2012, the then Australian Treasurer, the then leader of the Federal Opposition
and his Treasury Spokesman, the Secretary of the Commonwealth Treasury and the Reserve Bank Governor all made speeches mentioning productivity.
3 The charts illustrate the frequency of the appearance of the specified terms per million (or billion) words in
the ‘Google Million’ – a sample set of books published in English with dates ranging from 1500 to 2008. No more than about 6000 books were chosen from any one year, which means that all of the scanned books from early years are present, and books from later years are randomly sampled. The random samplings reflect the subject distributions for the year. The analysis for ‘health’ is based on all English language books, rather than the Google Million.
The analysis for health economics is based on all English language books, rather than the Google Million.
Data from: Jean-Baptiste Michel, J-B; Shen, YK; Aiden, AP; Veres, A; Gray, MK; Brockman,W; the Google Books Team; Pickett, JP; Hoiberg, D; Clancy, D; Norvig, P; Orwant, J; Pinker, Steven; Nowak, MA and Aiden, EL. (2011). ‘Quantitative Analysis of Culture Using Millions of Digitized Books’. Science 331 (6014): 176-182.

Cullen and Ergas: Efficiency and Productivity in the Australian Health Care Sector
3
In health policy, after some initial concern in the early twentieth century, the terms
‘efficiency’ and ‘productivity’ were almost absent from the health economic discourse until
the last quarter of the century, with discussion of efficiency dominating those of
productivity. Since the mid-1990s, the concept of ‘cost effectiveness’ has also begun to
demand attention in the public discourse on health.
At a macro-economic level, the concern with productivity is understandable. In the last four
decades of the twentieth century, average annual income in Australia consistently grew by
around two per cent per annum in real terms. Labour productivity growth was responsible
for about 90 per cent of the growth in average incomes that Australians enjoyed over that
period. The first decade of the twenty-first century departed somewhat from this trend,
with favourable changes in the terms of trade contributing around half of the growth in
annual incomes. Overall, however, the rate of growth in average incomes was not
substantially different from earlier decades. That is, the contribution of productivity growth
to income growth declined in both proportional and absolute terms. With the inevitable
decline in the terms of trade that can be expected in the coming decade, and demographic
pressures on labour force participation, the head winds against continued growth in
incomes are strengthening. Indeed, labour productivity growth will need to double its trend
rate if trend growth in incomes is to be maintained.4
An increasing concern with fiscal sustainability has heightened concerns with productivity in
the public sector.5 It has been claimed that the public services sector in Australia is ‘dragging
the productivity chain, with annual labour productivity growth at -0.6 per cent, in contrast
to the private sector, which stands at 1.4 per cent’.6 The need to address these issues has
been pressed, perhaps not surprisingly, by major consulting firms.7
4 Gruen, D. (2012) ‘The importance of productivity’. Speech at the Productivity Perspectives Conference held
by the Productivity Commission and the Australian Bureau of Statistics at Old Parliament House, Canberra, November 2012.
5 Atkinson AB. (2005). The Atkinson review: final report – Measurement of government output and
productivity for the national accounts. Basingstoke, England: Palgrave Macmillan.
Statistics New Zealand (2010). Measuring government sector productivity in New Zealand: a feasibility study. Wellington: Statistics New Zealand.
Diewert, W. (2011). ‘Measuring productivity in the public sector: some conceptual problems’. Journal of Productivity Analysis, 36(2): 177-191.
6 Ernst and Young, Australia. (2014). Ensuring Australia’s economic sustainability — Government Agenda.
7 Baily, MN; Croxson, K; Dohrmann, T and Mendonca, L. (2011). The public-sector productivity imperative.
McKinsey & Company.
Accenture. (2012) Delivering Public Service for the Future: Navigating the Shifts – Global Study.
PwC. (2013). Improving public sector productivity through prioritisation, measurement and alignment.
Eggers, WD and Jaffe, J. (2013) Gov on the Go: Boosting public sector productivity by going mobile. Deloitte Development LLC.

Cullen and Ergas: Efficiency and Productivity in the Australian Health Care Sector
4
The ageing of the population, and the implications of that ageing for health expenditure,
together with the dominant role played by the public sector in the financing and delivery of
health care services has seen a particular focus on productivity in the health sector.8 Indeed,
it has been claimed that, ‘an unsustainable and fragmented health system is one of the
biggest threats to Australia’s productivity and long-term prosperity’.9 In response to these
issues, Australia’s Productivity Commission has indicated that it is considering running a
roundtable on productivity enhancement pathways in health later this year.10
Overview of the paper
This paper seeks to assist Health Chief Executives intervene in the debates about health
system productivity that have, to date, been driven largely by Treasuries, who, by and large,
subscribe to the views of the Nobel laureate Paul Krugman that:
Productivity isn’t everything, but in the long run it is almost everything. A country’s ability to improve its standard of living over time depends almost entirely on its ability to raise its output per worker.
11
The authors of the current paper find this statement potentially misleading. In the long run,
a very small share of economic growth, maybe 10 per cent or so, comes from doing existing
things better. Rather, particularly in high income economies, which are not growing
primarily by catching up, growth comes largely from doing new things and shifting resources
from less socially valuable old things to more socially valuable new things. Dynamic
efficiency – which includes the reallocation of resources over time – counts for far more
than simply getting more output (be it in terms of quantity or quality) per unit of input.12
That is not to dispute the proposition that increases in dynamic efficiency are a component
of productivity growth. Rather, the point is that policy makers need to pay particular
attention to the factors that encourage or impede the development of new ways of doing
things and the reallocation of resources from more to less productive uses. That suggests a
focus on efficiency, as against one on merely 'squeezing the lemon'.
8 Schreyer, S and Mas, M. (2013). ‘Measuring Health Services in the National Accounts: An International
Perspective" in: Measuring and Modeling Health Care Costs. Proceedings of Conference held in Washington D.C.by the National Bureau of Economic Research, 18-19 October 2013.
Peacock, S; Chan, C; Mangolini, M and Johansen, D. (2001). Techniques for Measuring Efficiency in Health Services., Productivity Commission Staff Working Paper. Canberra: Productivity Commission.
9 Ernst and Young, Australia (2014) op. cit.
10 Harris, P. (2014). ‘Productivity in Government’. Presentation to the Committee for the Economic
Development of Australia’s Forum, Economic and Political Overview 2014, in Melbourne on 21 February 2014.
11 Krugman, P. (1997). The Age of Diminishing Expectations. 3
rd edition. Cambridge: MIT Press.
12 Huerta de Soto, J. (2009). The theory of dynamic efficiency. Routledge foundations of the market economy.
Milton Park, Abingdon, Oxon: Routledge.

Cullen and Ergas: Efficiency and Productivity in the Australian Health Care Sector
5
That is all the more the case because efficiency differs from productivity in a crucial respect.
Productivity is an average concept: in a production function, which relates inputs to outputs,
it corresponds to average product. Efficiency, in contrast, is a marginal concept – it looks at
valuations at the margin of decision. What distinguishes prosperous economies is that they
have mechanisms that work well in stimulating and guiding individual choice, which is
always a question of margins. In that sense, the challenge for policy makers is to focus on
how policy affects where the margins lie, and how decisions are taken at the margin.
All that is especially important in Australia, which unlike most mature economies, prospers
through combinations of extensive and intensive growth, usually associated with resource
booms and swings in the terms of trade. In fact, it is precisely for such growth patterns that
conventional productivity measurement can be most misleading, as shifts in the allocation
of resources that reflect increases in marginal product may reduce not only the growth rate
but even the level of average product, as conventionally measured, at least in the short run.
The present authors therefore have sympathy with the view that policy makers should focus
on which activities in the public sector provide value for money and which don’t – and
reallocate between them (and presumably, also between them and the private sector).
The paper first examines the macro-economics of health. This analysis is intended to
empower health policy makers in their discussions with their counterparts in Treasuries, by
demonstrating that there is nothing a priori wrong with societies choosing to make greater
investments in health (that is, with health forming an increasing share of GDP). Rather, such
increases may be unavoidable, given that health is a superior good, whose demand rises
more rapidly than overall incomes, and even desirable given the important role that the
health care sector can play in lifting productivity in the economy as a whole – so that, health
spending needs to be considered, at least in part, as investment rather than as expenditure.
This section of the paper also examines the international evidence of the relationship
between key health outcomes – for example, Quality Adjusted Life Years (QALYs) and
longevity – and the health system. Examined in terms of that relationship, Australia has a
relatively 'efficient' health system, at least in the sense that spending seems low compared
to the key health outcomes achieved.
None of this should be cause for complacency, however. While per capita GDP has driven
increases in health expenditure in the past, the future will see a greater impact of ageing
and possibly of new behavioural issues (such as chronic disease). These trends will test
affordability and, in a system where prices do not play an important role in signalling
demand or directing supply, efficiency. Moreover, evidence of some 'flat of the curve'

Cullen and Ergas: Efficiency and Productivity in the Australian Health Care Sector
6
spending13, and of allocative and productive inefficiency in the system (for instance,
reflected in large and persistent cost differences for similar procedures14), suggest the scope
to get better value for money.
The paper therefore then examines the measurement of productivity in the health sector. It
begins with a theoretic analysis of the inherent difficulties in measuring ‘health system
productivity’. The principal difficulty is that most outputs in the health care sector are not
priced at market prices. This makes it difficult to measure health outputs in a way that is
comparable to outputs in the market sector. Compounding this difficulty, most health
outcomes are not solely the product of health system inputs but also of other inputs,
ranging from social context to nutrition and individual behaviour. As well as dealing with
interdependencies with other determinants of health status, such as education, welfare and
living standards, the measurement of productivity in health would also need to deal with
timing difficulties – given that the success or failure of health care interventions is not
immediately evident (with long lag times for some treatments, and to build the evidence
base for treatment). It is also important to recognise the high social costs that can come for
using the wrong interventions, which promotes risk aversion. Any useful analysis would
need to measure outcomes across the continuum of care rather than within segments. And
it would also need to measure outcomes across the public and private sector (which are
partly complements and partly substitutes) and capture difficult to measure outcomes such
as quality and safety, equitable access and serving vulnerable communities.
It is important for health policy makers to understand these difficulties as they mean that it
is complex, in a non-market environment, to provide the incentives required for productivity
advance, and it is important to be cautious about nostrums (such as targets and indicators)
that can simply distort behaviour. As the Commission on the Measurement of Economic
Performance and Social Progress – the Nobel laureates Joseph Stiglitz and Amartya Sen, and
Jean-Paul Fitoussi – have said, ‘what we measure affects what we do, and if our measures
are flawed, decision making may be distorted’.15
The next section of the paper then turns to the drivers of inefficiency in health, as an
understanding of these drivers and the types of inefficiencies that arise in health is central
to the development of measures of productivity and efficiency that will actually be useful in
assisting managers and policy makers to identify and rectify inefficiencies. A useful place to
13
Schoder, J and Zweifel, P. (2011). ‘Flat-of-the-curve medicine: a new perspective on the production of health’. Health Economics Review, 1(1):2.
14 Duckett, SJ; Breadon, P; Weidmann, B and Nicola, I. (2014). Controlling costly care: a billion dollar hospital
opportunity. Melbourne: Grattan Institute. 15
Stiglitz, JE; Sen, AK and Fitoussi, J-P. (2009). Report by the Commission on the Measurement of Economic Performance and Social Progress, p. 7. See also: Stiglitz, JE; Sen, AK and Fitoussi, J-P. (2010). Mismeasuring Our Lives: Why GDP Doesn't Add Up. New York: The New Press.
Cullen and Ergas: Efficiency and Productivity in the Australian Health Care Sector
7
begin is to ask why it is that some health care providers (small or large, individuals or
corporations) fail to minimize inputs and input costs or to maximise outputs (outcomes). On
the one hand, they may be seeking to minimise costs or maximise outputs, but failing to do
so because of institutional constraints or because of a lack of information, which prevent
them from identifying efficient input combinations and processes. On the other hand, they
may not be seeking to minimise costs or maximise outputs, but rather to satisfy other
demands, including behavioural or motivational reasons.
There are four main conceptual sources of technical inefficiency (which may, of course,
occur independently or in parallel), namely:
• Failing to minimise the physical inputs used;
• Failing to use the least cost combination of inputs;
• Operating at the wrong point on the short-run average cost curve; and
• Operating at the wrong point on the long-run average cost curve.
In one sense, therefore it should be easy for policy makers to design systems that can be
efficient and for managers within those systems to drive efficiency. The difficulties are not
theoretical but rather practical: Are inputs and outputs measured appropriately and are the
right incentives in place to ensure managers can achieve efficiencies once identified?
Efficiency issues must not, however, be treated as technical and measurement questions
but rather as core management objectives. This is the subject of the final section of this
paper. Complex and unpalatable choices must be made if significant efficiency gains are to
be realized. Most important, perhaps, efficiency improvement must never be seen as a one-
off purging of current inefficiencies. There may well be a powerful case for a specific
structural intervention, but this should not obscure the need to imbue and constantly renew
a culture of continuous efficiency improvement at all levels of the system. Without such a
culture, all that will be achieved is a shift from one position of static productivity to another.
Following the World Health Organisation’s Commission on Macroeconomics and Health16,
the present authors consider that a successful approach to developing an efficiency
improvement program needs to contain the following components:
• identification and quantification of major areas of technical inefficiency;
• identification of key causes of identified inefficiencies;
• assessment of possible interventions to improve efficiency;
• assessment of likely constraints on and barriers to achieving identified efficiencies;
• development of a reinvestment program for the employment of at least some of the
funds released through efficiency gains;
16
Hensher, M. (2001). Financing Health Systems through Efficiency Gains. World Health Organisation Commission on Macroeconomics and Health Working Paper Series Paper No. WG3 : 2.

Cullen and Ergas: Efficiency and Productivity in the Australian Health Care Sector
8
• implementation of structural changes required to facilitate major or one-off
improvements, including willingness to invest in such changes; and
• implementation of organizational and cultural shift to continuous productivity
improvement, including appropriate performance management systems.
At the core of the issue is the need for specificity: for while each efficient health care
provider is efficient in the same way, each inefficient health care provider is inefficient in its
own way. It is therefore important to identify specific problems at all levels of the provision
of health care services and to develop solutions that will fit localised realities and overcome
specific obstacles.
Cullen and Ergas: Efficiency and Productivity in the Australian Health Care Sector
9
2 A macro view of the relationship between health and productivity
At a macro level, there is a clear relationship between health system spending and key
macro parameters, so that spending depends largely on per capita GDP. There is also some
relationship between key health outcomes – for example, Quality Adjusted Life Years
(QALYs) and longevity – and health system inputs. Moreover, the international variation in
that relationship suggests that Australia has a relatively 'efficient' health system, at least in
the sense that our spending seems low compared to the key health outcomes.
Macro drivers of health expenditure
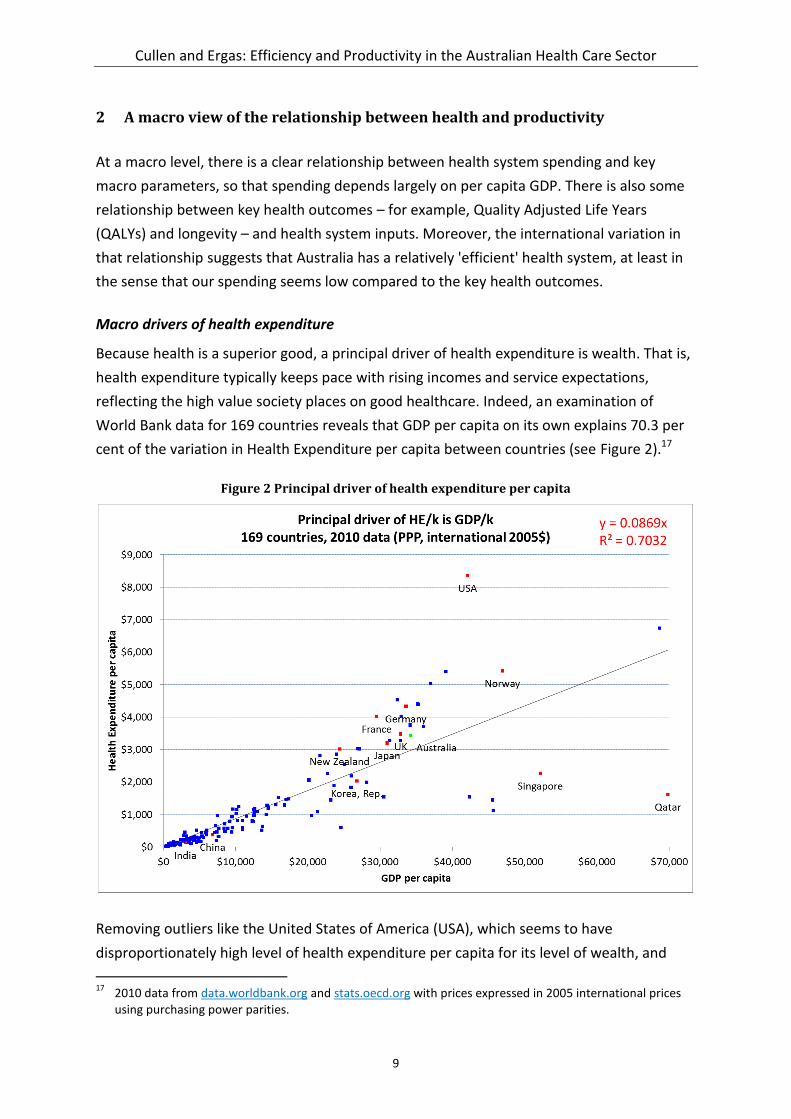
Because health is a superior good, a principal driver of health expenditure is wealth. That is,
health expenditure typically keeps pace with rising incomes and service expectations,
reflecting the high value society places on good healthcare. Indeed, an examination of
World Bank data for 169 countries reveals that GDP per capita on its own explains 70.3 per
cent of the variation in Health Expenditure per capita between countries (see Figure 2).17
Figure 2 Principal driver of health expenditure per capita
Removing outliers like the United States of America (USA), which seems to have
disproportionately high level of health expenditure per capita for its level of wealth, and
17
2010 data from data.worldbank.org and stats.oecd.org with prices expressed in 2005 international prices using purchasing power parities.
Cullen and Ergas: Efficiency and Productivity in the Australian Health Care Sector
10
Singapore and Qatar, where special economic circumstances mean that GDP per capita may
not be good measure of average personal wealth, improves the fit of the model to 87.5 per
cent. Further improvements to the model can be made by retaining the USA in the model
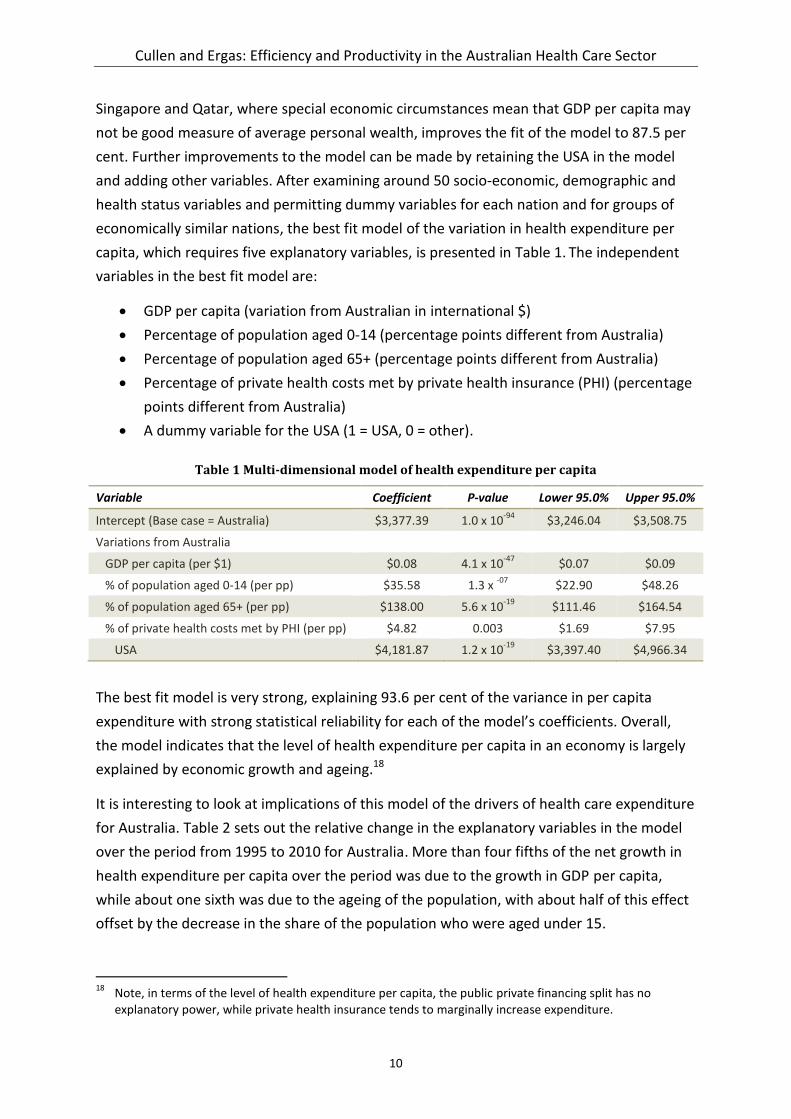
and adding other variables. After examining around 50 socio-economic, demographic and
health status variables and permitting dummy variables for each nation and for groups of
economically similar nations, the best fit model of the variation in health expenditure per
capita, which requires five explanatory variables, is presented in Table 1. The independent
variables in the best fit model are:
GDP per capita (variation from Australian in international $)
Percentage of population aged 0-14 (percentage points different from Australia)
Percentage of population aged 65+ (percentage points different from Australia)
Percentage of private health costs met by private health insurance (PHI) (percentage
points different from Australia)
A dummy variable for the USA (1 = USA, 0 = other).
Table 1 Multi-dimensional model of health expenditure per capita
Variable Coefficient P-value Lower 95.0% Upper 95.0%
Intercept (Base case = Australia) $3,377.39 1.0 x 10-94
$3,246.04 $3,508.75
Variations from Australia
GDP per capita (per $1) $0.08 4.1 x 10-47
$0.07 $0.09
% of population aged 0-14 (per pp) $35.58 1.3 x -07
$22.90 $48.26
% of population aged 65+ (per pp) $138.00 5.6 x 10⁻¹⁹
$111.46 $164.54
% of private health costs met by PHI (per pp) $4.82 0.003 $1.69 $7.95
USA $4,181.87 1.2 x 10⁻¹⁹
$3,397.40 $4,966.34
The best fit model is very strong, explaining 93.6 per cent of the variance in per capita
expenditure with strong statistical reliability for each of the model’s coefficients. Overall,
the model indicates that the level of health expenditure per capita in an economy is largely
explained by economic growth and ageing.18
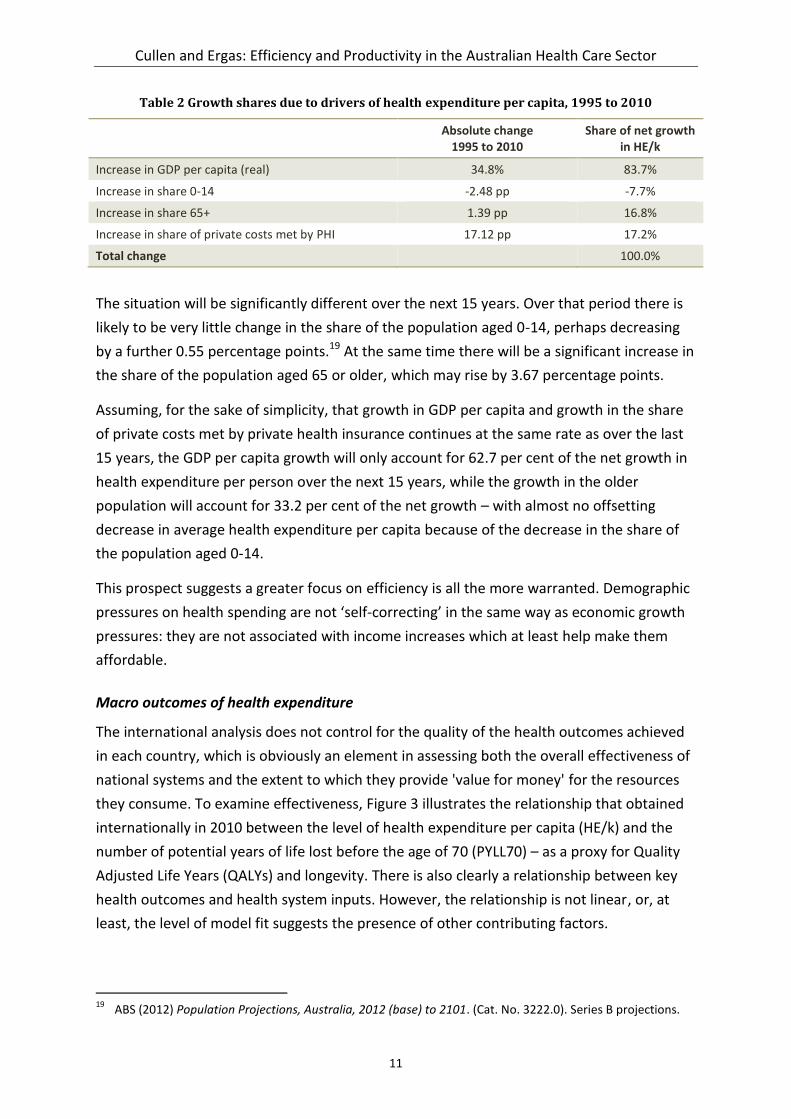
It is interesting to look at implications of this model of the drivers of health care expenditure
for Australia. Table 2 sets out the relative change in the explanatory variables in the model
over the period from 1995 to 2010 for Australia. More than four fifths of the net growth in
health expenditure per capita over the period was due to the growth in GDP per capita,
while about one sixth was due to the ageing of the population, with about half of this effect
offset by the decrease in the share of the population who were aged under 15.
18
Note, in terms of the level of health expenditure per capita, the public private financing split has no explanatory power, while private health insurance tends to marginally increase expenditure.
Cullen and Ergas: Efficiency and Productivity in the Australian Health Care Sector
11
Table 2 Growth shares due to drivers of health expenditure per capita, 1995 to 2010
Absolute change 1995 to 2010
Share of net growth in HE/k
Increase in GDP per capita (real) 34.8% 83.7%
Increase in share 0-14 -2.48 pp -7.7%
Increase in share 65+ 1.39 pp 16.8%
Increase in share of private costs met by PHI 17.12 pp 17.2%
Total change 100.0%
The situation will be significantly different over the next 15 years. Over that period there is
likely to be very little change in the share of the population aged 0-14, perhaps decreasing
by a further 0.55 percentage points.19 At the same time there will be a significant increase in
the share of the population aged 65 or older, which may rise by 3.67 percentage points.
Assuming, for the sake of simplicity, that growth in GDP per capita and growth in the share
of private costs met by private health insurance continues at the same rate as over the last
15 years, the GDP per capita growth will only account for 62.7 per cent of the net growth in
health expenditure per person over the next 15 years, while the growth in the older
population will account for 33.2 per cent of the net growth – with almost no offsetting
decrease in average health expenditure per capita because of the decrease in the share of
the population aged 0-14.
This prospect suggests a greater focus on efficiency is all the more warranted. Demographic
pressures on health spending are not ‘self-correcting’ in the same way as economic growth
pressures: they are not associated with income increases which at least help make them
affordable.
Macro outcomes of health expenditure
The international analysis does not control for the quality of the health outcomes achieved
in each country, which is obviously an element in assessing both the overall effectiveness of
national systems and the extent to which they provide 'value for money' for the resources
they consume. To examine effectiveness, Figure 3 illustrates the relationship that obtained
internationally in 2010 between the level of health expenditure per capita (HE/k) and the
number of potential years of life lost before the age of 70 (PYLL70) – as a proxy for Quality
Adjusted Life Years (QALYs) and longevity. There is also clearly a relationship between key
health outcomes and health system inputs. However, the relationship is not linear, or, at
least, the level of model fit suggests the presence of other contributing factors.
19
ABS (2012) Population Projections, Australia, 2012 (base) to 2101. (Cat. No. 3222.0). Series B projections.

Cullen and Ergas: Efficiency and Productivity in the Australian Health Care Sector
12
Figure 3: Relationship between PYLL70 and HE/k, Selected OECD countries, 2010
The model in Table 3 captures the effects of these other contributing factors by modelling
the impact of changes in three variables on the number of potential years of life lost under
the age of 70 per 100,000 people. The variables are health expenditure per capita, smoking
rates (lagged by 20 years) and the level of alcohol consumption (using a 10 year average
effect). The model fit appears to be very strong, explaining 98.8 per cent of the variance in
the output variable with strong statistical significance for each coefficient. The model effects
are also as expected – increasing health expenditure per capita and decreasing smoking
rates or alcohol consumption all decrease the number of potential years of life.
Table 3: Model of PYLL70 per 100,000 people, Australia, 1980-2006
Variable Coefficient P-value Lower 95.0%
Upper 95.0%
Intercept 102.00
Health System Expenditure (HSE/k) per capita in 2010-11 dollars
(coefficient is per $1 change)
-0.61 9.0 x 10-07
-0.80 -0.42
Percentage of population aged 15 plus who are daily smokers, lagged 20 years
(coefficient is effect per percentage point change)
57.99 2.4 x 10-06
38.68 77.30
Alcohol consumption, litres per person aged over 15, average of preceding ten years
(coefficient is effect per litre change)
477.30 3.0 x 10-07
339.59 615.00

Cullen and Ergas: Efficiency and Productivity in the Australian Health Care Sector
13
In summary, the multivariate regression equation estimates that:
each $1 increase in health expenditure per capita is associated with saving 0.61 of a
year of life for every 100,000 people under the age of 70;
each percentage point decrease in smoking rates is associated with saving 57.99
years of life for every 100,000 people under the age of 70; and
each litre decrease in alcohol consumption is associated with saving 477.30 years of
life for every 100,000 people under the age of 70.20
Without claiming these relationships are necessarily fully causal, the relative importance of
each of these factors in addressing premature mortality can be illustrated by converting
each of the marginal effects to the impact of a one percent change in each of the variables
(from the current level). Using the modelled parameters, and treating these as causal
effects:
each one per cent increase in health expenditure per capita saves 13.2 years of life
for every 100,000 people under the age of 70;
each one per cent decrease in smoking rates saves 31.0 years of life for every
100,000 people under the age of 70; and
each one per cent decrease in alcohol consumption saves 60.6 years of life for every
100,000 people under the age of 70.
Macro efficiency of the Australian health care system
Compared to other countries, Australia has an efficient health system, at least in the sense
that relatively high health outcomes are obtained with relatively low levels of expenditure.
This was confirmed by the most recent Global Burden of Disease Study21, which found that
Australia (compared with similar countries – the top 15 countries by income per capita), has
the 12th lowest health spending per capita and yet ranks highly in terms of health outcomes
- ranking 2nd among the 15 highest income countries in terms life expectancy and 4th in
terms of premature mortality.22 Figure 4 compares total public and private health
expenditure (as a proportion of GDP) with life expectancy to provide a broad measure of the
comparative efficiency of the health systems of 178 countries.
20
These are marginal effects. That is, they represent the impact of the first $1, one percentage point, or one litre change.
21 Burden of disease analysis is a technique used to assess and compare the fatal and non-fatal effects of
diseases among population groups over time and combines data around premature death, measured by the years of life lost and non-fatal health outcomes, measured by years lost due to disability into a summary measure called disability-adjusted life years.
22 Institute for Health Metrics and Evaluation, 2010 Global Burden of Disease Study,
http://www.healthmetricsandevaluation.org/

Cullen and Ergas: Efficiency and Productivity in the Australian Health Care Sector
14
The most ‘efficient’ national health systems, in the lower right quadrant, produce the best
health outcomes for the most reasonable levels of expenditure. Australia’s life expectancy is
higher than all but a handful of countries, while its level of health expenditure is the average
for comparable economies.23 Using similar metrics, Bloomberg recently found that Australia
had the seventh most efficient health system in the world.24
Figure 4: Relative efficiency of national health systems
Notwithstanding the relative efficiency of Australia’s health care system, managers in the
public and private sectors have a responsibility to monitor and ensure the ongoing efficient
operation of the services that they fund and deliver. Moreover, as the health care sector
becomes a greater part of Australia’s economy the need for efficiency will become greater
as crowding-out effects will increase competition for, and hence the price of, the resources
that the sector needs to deliver its services.
Health’s contribution to economic growth
Drawing on the clear, if complex, relationships between health outcomes and health system
inputs, it is possible to extrapolate some implied rates of return on health expenditure, but
23
Data for each country is for the most recent year available and is drawn from the World Bank http://databank.worldbank.org/data/databases.aspx
24 http://www.bloomberg.com/visual-data/best-and-worst/most-efficient-health-care-countries

Cullen and Ergas: Efficiency and Productivity in the Australian Health Care Sector
15
these need to be caveated by both the inherent complexity of the health 'production
function' and the possibility of diminishing returns – that is, being on the 'flat of the curve’.
First, however, it is necessary to consider the special nature of public and private spending
on health, which like spending on education, needs to be considered, at least in part, as
investment rather than consumption. In the standard neoclassical economic growth model
(the Solow Growth Model) the output of goods in an economy depends on physical capital
and labour hours.25 Human capital in the form of education also contributes to economic
growth by altering the quality of labour inputs.26 Similarly, human capital in the form of
health, which influences worker energy, effort and reliability, also contributes to economic
growth. Initial work strongly suggested that health status was an important contributor to
economic growth.27 More recent attempts to quantify this contribution have produced
some dramatic results.28 A 2004 study found that a one-year improvement in a population’s
life expectancy contributes to an increase of 4 per cent in output.29 In the Australian
context, a recent study found that a 1 per cent decrease in cancer mortality rates would
result in a 1.6 per cent increase in GDP per capita. Interestingly, the study also found that
the increase is greater when cancer deaths fall across the entire population, rather than just
among the working age population.30 The relatively large size of the economic growth feed-
back from health investment raises the possibility that some investments in health might, in
effect, ‘pay for themselves’ through their impact on overall incomes quite apart from any
improvement in welfare. Under this view spending on health should be regarded, at least in
part, as an investment rather than as consumption.
In determining the return that is achieved on this investment it is important to capture the
total growth effects of investments in health – which is more complex than for some other
investments because the interaction between health and growth is two-way. For example,
25
Solow, RM. (1956). A Contribution to the Theory of Economic Growth. The Quarterly Journal of Economics, 70(1), 65-94. doi: 10.2307/1884513
26 Mankiw, R & Weil, DN. (1992). A Contribution to the Empirics of Economic Growth. Quarterly Journal of
Economics, 107, 407-437. 27
Grossman, M. (1972). On the concept of health capital and the demand for health. The Journal of Political Economy, 80(2), 223-255.
Barro, RJ. (1991). Economic Growth in a Cross Section of Countries. The Quarterly Journal of Economics, 106(2), 407-443.
Meltzer, DO. (1992). Mortality Decline, the Demographic Transition, and Economic Growth. PhD Thesis, University of Chicago, Chicago.
28 A useful summary of the debate can be found in Muhammad Jami Husain, J. (2012). Alternative Estimates
of the Effect of the Increase of Life Expectancy on Economic Growth. Economics Bulletin 32(4): 3025-3035. 29
Bloom, D, Canning, D & Sevilla, JP. (2004). The Effect of Health on Economic Growth: A Production Function Approach. World Development, 32, issue 1, p. 1-13.
30 Swift, R. (2010). Cancer and economic growth in an aging population: estimating the impact for Australia.
Griffith Business School Discussion Papers – Economics. Brisbane: Griffith University.

Cullen and Ergas: Efficiency and Productivity in the Australian Health Care Sector
16
improvements in health (and especially life expectancy) can also influence life cycle savings
and capital accumulation, as individuals respond to the prospect of more years of
retirement by increasing savings.31 As a result, improvements in health not only increase
output directly through improved labour productivity (as reductions in years of illness
increase productive effort) but also through the greater accumulation of physical capital.
Finally, as improvements in health also lower rates of mortality and disease, they increase
the effective lifetime of, and decrease the depreciation rate of, human capital. As a result,
an increase in health raises investment in human capital and thereby has a further, indirect
positive effect on economic growth. In this regard, it has been shown that improved health
increases both the expected returns to and investment in education.32
Unfortunately, the implied rate of return is unlikely to be achieved, at least in modern
economies which are already at relatively high levels of income and population health. The
models used tend to ignore the significant two way causation effects (longevity driving
health expenditure) within the relationship between health expenditure and economic
growth. To produce some simple estimates of the contribution of health expenditure to
economic growth in Australia that attempts to control for two-way causation a model has
been developed that looks at the impact of health expenditure per capita (HE/k) on the
potential years of life lost before the age of 70 (PYLL70). Using PYLL70 as the dependent
variable excludes the age cohorts where most longevity gains accrue and where health
expenditure caused by age is greatest. This measure also focuses on the population who are
mostly in the workforce and where the direct productivity effects are likely to be greatest.33
The multivariate regression equation in Table 3 estimated that each $1 increase in HE/k
saves 0.61 PYLL for every 100,000 people under the age of 70. Quantifying this effect across
the Australian economy as a whole in 2010-11 suggests that the return to investment of
health expenditure is about 28.8 per cent (see Table 4).
This rate of return implies that the cost per life year purchased from the health care sector
was $163,934, which is on all fours with the Value of a Statistical Life Year (VSLY)
recommended for use in Commonwealth and COAG calculations of cost effectiveness.34 In
31
Lee, R, Mason. A & Miller, T. (2000). Life Cycle Saving and the Demographic Transition in East Asia. Population and Development Review 26(Supplement).
32 Bils, M & and Klenow, PJ. (2000). Does Schooling Cause Growth? The American Economic Review.
90(5):1160-1183. 33
For simplicity, the modelling assumes a steady state. That is, it assumes that the net present value of future benefits of current expenditure is equal to the current benefits of past expenditure.
34 The VSLY is a reasonably objective, market-based measure and is estimated by observing peoples’ demands
for compensation before accepting risk and willingness to pay to avoid risk. An implication here is that payers for health across the public and private financing systems, implicitly place similar values on life years saved as estimated from willingness to pay studies. See: Office of Best Practice Regulation. Department of Finance and Deregulation. (2008). Best Practice Regulation Guidance Note, Value of statistical life.

Cullen and Ergas: Efficiency and Productivity in the Australian Health Care Sector
17
2007, the VSLY was $151,000. A cost per life year saved of $163,934 would also imply that
the whole health system is cost effective by World Health Organization standards, which
define an ‘intervention’ as being cost effective if it saves one year of healthy life for up to
three times GDP per capita.35
Table 4: Impact of health expenditure on economic growth in 2010-11
Population 22.2 million A
Reduction in PYLL70/100,000 per $1 of HE/k 0.61 years B
HE/k $5,796 C
PYLL70 saved 709,638 years D=A*B*C
Value added to the economy $37.6 billion E=D*Participation*AWE*52*2
Total HE $130.3 billion F
ROI of HE (direct return) 28.8% =E/F
In summary, applying the estimated return on investment on health investment of 28.8 per
cent to the increase in health expenditure between 1993-94 and 2009-10 (see Table 5),
health was a significant contributor to economic growth, directly accounting for about 3.3
per cent of all economic growth in Australia.
Table 5: Impact of health expenditure on economic growth, 1993-94 to 2009-10
1993-94 2009-10 Growth
GDP (2009-10 prices) $746.9 b $1,292.3 b 73.0%
Total health expenditure (GDP adjusted) $54.8 b $121.4 b 121.3%
ROI of additional HE (28.8%) $19,157 b
Share of GDP growth due to HE 3.3%
In terms of life expectancy, this analysis implies that an increase in life expectancy of 1 year
would increase GDP by 0.5 per cent. The full effect of health expenditure on economic
growth is likely to be much higher. First, increases in life expectancy are likely to increase
the length of working lives. It is worth stepping back to consider a simple thought
experiment. Assume life expectancy is 80 years and a working life of 40 years. If life
expectancy increases by a year but there is no change in working lives, then the impact on
the size of the economy will be limited to those whose lives would otherwise end before
retirement age. However, if working lives remain a constant share of lifespan, then they will
increase by 1.25 per cent (six months on 40 years). The total impact of health expenditure
35
World Health Organisation. (2011). Choosing interventions that are cost-effective (WHO-CHOICE), cost effectiveness thresholds. Note, Australian GDP per capita in 2011 was $62,877.

Cullen and Ergas: Efficiency and Productivity in the Australian Health Care Sector
18
on life expectancy is then likely to be 3½ times that estimated. On that basis, the share of
GDP growth due to health expenditure would be in the order of 10 per cent.36
It is interesting to note that the most recent study by the OECD, which uses a quite different
methodology, is consistent with this estimate.37 The OECD study has found that an increase
in health expenditure by government by 1 per cent of GDP would tend to increase the
growth rate for GDP by 0.03 percentage points per year (cumulatively) and the net present
value of all future gains from the increase in health expenditure would be 12 per cent of
GDP (discount rate of 5 per cent), but with the majority of the effect occurring after five
years. Between 1993-94 and 2009-10 the share of GDP spent by governments on health in
Australia increased by 1.18 percentage points while GDP grew in real terms by 72 per cent.
Assuming half the total effects of the additional expenditure have been achieved within the
time frame then 7.1 percentage points of the GDP growth over the period can be attributed
to the increase in health expenditure. This equates to increases in health expenditure being
responsible for 9.7 per cent of the economic growth over the period.
These results need to be caveated in several respects. Most importantly, causality is
inevitably difficult to assess, and the regressions spelt out above cannot fully capture causal
effects. To that extent, the relations they estimate, though clearly strong, are in the nature
of associations, and extrapolations from the results risk confusing cause and effect.
No less importantly, even where the relationships do capture causality, there is the
possibility of diminishing returns. The best single variable line of fit of the relationship
between the international data for health expenditure per capita (HE/k) and the number of
potential years of life lost under age 70 (see Figure 3) was a logarithmic curve, which raises
the possibility that Australia lies towards the end of the HE/k scale where the logarithmic
curve is flattening. However, this does not mean the scope for the health system to
36
There are also other confounding factors to be considered. On the one hand, there could be ‘third round’ effects on health spending as a result of increased longevity from higher spending on health – depending on compression of morbidity. On the other hand, poor health can reduce the effectiveness of workers. To the extent that longevity is a useful proxy for the health of a population, then higher life expectancy might also be expected to reduce the productivity impact of poor health. Moreover, longer working lives are associated with increased levels of experience among older workers, which may also boost productivity for a portion of the workforce.
Longevity may also increase human capital investment in the economy. That is because longer working lives increase the length of time that individual workers earn a return on their education – shifting the balance between the costs (in terms of time and resources) of obtaining an education, and the benefits (in terms of higher wages) of that education. Other things equal, that shift provides individuals with a greater incentive to invest in their own human capital – thereby increasing the future output of those workers.
However, these effects are difficult to measure in practice, and more difficult still to disentangle from the effects of longevity on the population and participation components of the output equation.
37 Barbiero, O and Cournede, B. (2013). New Econometric Estimates of Long-term Growth Effects of Different
Areas of Public Spending. OECD Economic Department Working Paper No. 1100.

Cullen and Ergas: Efficiency and Productivity in the Australian Health Care Sector
19
contribute to income growth has been exhausted. Rather, if there is room for increases in
efficiency, then those efficiency improvements could boost incomes (and welfare more
generally) by shifting the position of the curve (as against merely moving along the existing
curve).
Put slightly differently, to the extent to which the Australian health care system is at the 'flat
of the curve', the marginal return on further spending will be smaller than the average
return has been in the past. That would suggest a need to pay greater attention to the
efficiency of spending that may have been done previously. Increasing the efficiency of that
spending will be important for three reasons: it will contribute to achieving further increases
in health outcomes, improving welfare and raising incomes; it will permit savings in outlays,
freeing resources for other uses; and to the extent to which it reduces the call on public
expenditure, it will allow reductions in taxes (or avoid increases in taxes), with
corresponding reductions in the efficiency costs taxes inevitably involve.
Cullen and Ergas: Efficiency and Productivity in the Australian Health Care Sector
20
3 Measuring productivity in health
Overall, the results presented above may be reassuring about past outcomes; they are,
however, anything but cause for complacency. While per capita GDP has driven increases in
health expenditure, the future will see a greater impact of ageing and possibly of new
behavioural issues (such as chronic disease). This will test affordability. Moreover, evidence
of some 'flat of the curve' spending, and of allocative and productive inefficiency in the
system (for instance, reflected in large and persistent cost differences for similar
procedures), suggest the scope to improve performance.
However, while it is important to improve productivity, it is also important for health policy
makers to recognise that it is complex, in a non-market environment, to provide the
incentives required for productivity advance. Moreover, precisely because of those
complexities, nostrums such as targets and indicators may simply distort behaviour,
reducing efficiency in the longer term.
This section begins with a consideration of the challenges involved in measuring 'health
system productivity' from the perspective of economic theory. It then provides a primer on
the definition and measurement of efficiency and productivity in health.38 The section
concludes by analysing the difficulties inherent in some of the proxy measures for
productivity and efficiency that are currently used in health.
Theoretic difficulties in conceptualising productivity in health
It is difficult to measure 'health system productivity' in a manner consistent with the
measurement of productivity in the market sector of the economy. First, because most
outputs in the health care sector are not priced at market prices, the health system's output
cannot readily be valued in a way comparable to outputs in the market sector. Second, and
compounding the first difficulty, most health outcomes are not solely the result of health
system inputs but also of other inputs, ranging from social context to nutrition and
individual behaviour.
Measurement difficulties inherent in the non-market sector
At an aggregate level (that is, applied to large parts of the economy) productivity is an
aspect of national income and product, and aggregate measures of productivity are usually
derived from some measure of national income and product. Those measures are, in turn,
attempts to meaningfully sum up the income and product of the individuals that comprise
38
For the Productivity Commission’s views on these matters see: Productivity Commission. (2013). On efficiency and effectiveness: some definitions. Staff Research Note. Canberra: Productivity Commission.

Cullen and Ergas: Efficiency and Productivity in the Australian Health Care Sector
21
the aggregate; where ‘meaningfully’ means that the aggregates are not arbitrary
summations but reflect economic valuations of what is being added up.
It is possible to do this in the presence of market decisions precisely because they are
guided by individual valuations. For example, individuals adjust their relative consumption
of apples and oranges to the relative price of apples and oranges; those adjustments made,
individuals must be placing the same relative value on apples and oranges, where that
relative value equals those products’ relative price, for if they were not, they would
reallocate their consumption. As a result, relative prices can be used as the basis for
meaningfully adding up apples and oranges (though even then, many additional
assumptions are required to get to something resembling the national income and product
measures for apples and oranges).
No such basis for meaningful aggregation exists for non-marketed goods and services. The
extreme cases are pure public goods, such as national defence, which (because they are not
excludable and non-rivalrous in consumption) provide the same level of output to all those
within a national economy. In these cases, all individuals consume the same level of output
and the only difference between them is in the value they place on that consumption. As a
result, the only meaningful way to add up individual levels of consumption would be to
know those individual values, which are not known. Moreover, even if the individual values
were known, and there was some way of defining the quantities of defence individuals
consumed, adding defence, thus valued, with (say) frozen pizza, valued at market prices,
would involve adding vertically summed valuations for the public good with horizontally
summed valuations for the second – which is not obviously meaningful.39
The point is that looking for a way of adding these outputs up with the market outputs
captured in national income accounting is not difficult but impossible: a search for a will o’
the wisp, which leads, as will o’ the wisps do, onto dangerous ground. It is not that the
resulting measures will be inaccurate but that they won’t make sense, any more than adding
up dollars and yen. Moreover, the greater the degree to which government is supplying the
kinds of goods we usually think it should – i.e. goods that have a high degree of ‘publicness’
– the less sense the measures will make.
Although health is not a pure public good, the delivery and financing arrangements for
health care in Australia mean that the health care sector cannot properly be considered to
be a part of the market sector of the Australian economy. Prices in the sector are not set by
39
That is, individuals do not equalize marginal valuations of defence to the relative price of defence, but equalize its quantity and adjust their marginal valuation. Of course, it is possible to imagine a pure Wicksellian exchange economy in which equalization of marginal valuations for public goods occurs, but that requires many unrealistic assumptions. A sketch of such an economy and the conditions for equalization is in James Buchanan (1968) The Demand and Supply of Public Goods, Rand-McNally, pp.12-47.
Cullen and Ergas: Efficiency and Productivity in the Australian Health Care Sector
22
reference to a market that comparatively prices the valuations of the various outputs by
consumers. Rather prices are, to a various but always considerable extent, set by
government – clearly in public hospitals (where service is rationed by waiting, rather than by
price), almost entirely in respect of subsidised pharmaceuticals and largely in the market for
subsidised medical services. As a result, prices in the health sector can and do move
independently of supply and demand. Thus, although pharmacies and medical services
operate in the private sector they cannot be said to operate in the market sector. As a
consequence it is not technically possible to measure productivity within the health sector
in a way that is directly commensurate with measures of productivity in the market sector.
The technical inability to measure productivity in the health sector should not, however, be
considered a misfortune. As noted above, the market concept of productivity is an average
concept: in a production function, which relates inputs to outputs, it corresponds to average
product – and average products can be very misleading.40 The related concept of efficiency,
in contrast, is a marginal concept – it looks at valuations at the margin of decision. This
concept is more appropriate for policy makers, where the challenge is to focus on how
policy affects where the margins lie, and how decisions are taken at the margin.
A concentration on productivity understood as efficiency rather than market productivity
forces the focus onto which activities in the public sector provide value for money and
which do not, and onto the question of reallocation both between public sector services and
between the public and private sectors. Moreover, while it is not possible to measure
productivity in the health care system on a basis strictly analogous to the market sector, the
reason we are interested in productivity is because we want to be more productive. Even if
we can’t measure public sector output in a way consistent with the conceptual framework
for national income measurement, we can identify a broad range of outputs the public
sector produces and measure those, relating them to the inputs it consumes as a proxy for
productivity.
A note of caution is needed however. In the private sector, the internal measures firms use
to gauge their performance ultimately don’t matter all that much – if the indicators a firm
uses are wrong, and induce responses from managers that reduce efficiency (say by
degrading product quality), the competitive process will sort it out. Not so in large parts of
the public sector, where consumers and taxpayers don’t have a choice. This results in a
paradox.
40
Conventional productivity measurement can be misleading even in the market sector. The mining industry has recently confirmed that shifts in the allocation of resources that reflect increases in marginal product may reduce not only the growth rate but even the level of average product, at least in the short run.

Cullen and Ergas: Efficiency and Productivity in the Australian Health Care Sector
23
The very difficulty of measuring efficiency in the public sector makes it attractive to rely on
intermediate indicators, such as measures of cost-effectiveness; but if those measures are
used as targets, and performance relative to the targets has any consequences, then we
need to worry about how those targets will affect behaviour – to an even greater extent
that we would in the market sector. In that context, it is useful to mention one stylized fact,
one economic theorem and one puzzle.
The stylized fact is Campbell’s Law, which says that ‘the more any quantitative social
indicator is used for social decision-making, the more subject it will be to corruption and the
more apt it will be to distort the social processes it is intended to monitor’.41
The economic theorem is Bengt Holmström’s multitasking theorem, a foundational result in
the economics of incentives.42 Broadly, it states that when activities are carried out together
and agents can reallocate effort from achieving one output to another, the efficient strength
of the incentives provided can be very sensitive to the value of the outputs most difficult to
measure. Put in somewhat obvious terms, strong incentives for observable outcomes can be
very dangerous if they lead the troops to always have (the easy to measure attribute of)
well-polished parade boots but to lack (the difficult to measure attribute of) well-honed
skills of tactical judgement under fire.
The final point for this section is a bit of a puzzle, to economists at least. This is the oil and
water nature of incentives and motivations: or slightly more technically, the non-convex
relation between bundles of incentives and motivations on the one hand and outcomes on
the other. Where motivations form a congruent package, adding a pinch of another type of
motivation or incentive can have very substantial adverse results. This is important because
in contexts where inputs and outputs are difficult to measure, motivation often relies on
strong norms of professional conduct, reinforced by well-structured career hierarchies in
41
Campbell, DT. (1975). ‘Assessing the impact of planned social change’, in Social Research and Public Policies: The Dartmouth/ OECD Conference, Hanover NH. Economists commonly refer to Goodhart’s Law which, as originally formulated (also in 1975), said that: ‘As soon as the government attempts to regulate any particular set of financial assets, these become unreliable as indicators of economic trends.’ Campbell’s formulation is more general and more closely linked to individual incentives.
42 Holmström, B, Moral Hazard in Teams. The Bell Journal of Economics 13, no. 2 (1982): 324–340.
Holmström's theorem is an impossibility theorem proving that no incentive system for a team of agents can make all of the following true:
1. Income equals outflow (the budget balances),
2. The system has a Nash equilibrium, and
3. The system is Pareto efficient.
Thus a Pareto-efficient system with a balanced budget does not have any point at which an agent can not do better by changing their effort level, even if everyone else's effort level stays the same, meaning that the agents can never settle down to a stable strategy; a Pareto-efficient system with a Nash equilibrium does not distribute all revenue, or spends more than it has; and a system with a Nash equilibrium and balanced budget does not maximise the total profit of everybody.
Cullen and Ergas: Efficiency and Productivity in the Australian Health Care Sector
24
which advancement occurs through tournaments. They are, in the jargon of the current
economics of organization, based on defining and enforcing identities, with reward
structures linked to the main features of those identities.43 There are sound efficiency
reasons for that, but what is interesting is that adding performance incentives that deviate
even slightly from that model can substantially undermine its effectiveness.
Quite why motivations would operate that way is puzzling.44 Take the claim that paying for
blood would ‘crowd out’ voluntary donations. At first blush, that such crowding out would
occur is somewhat implausible. After all, those who would otherwise have donated seem no
worse off merely as a result of payment being available. Indeed, to the extent to which they
receive the payment, they would appear to be better off, as they could get both the
satisfaction associated with the supply of blood and an increased income (which if they so
wanted, they could then donate to other worthwhile causes). Under conventional
assumptions (and certainly for ‘small’ payments, so that income effects can be ignored),
supply curves are upward sloping, and the relative price effect (that is, the fact that
payment increases the marginal revenue from supplying blood relative to other uses of
time) should induce even voluntary donors to increase (or at least not reduce) the amount
of blood they supply. Despite this, there are good reasons to expect that the opposite
reaction will occur in at least some circumstances. That should induce us to great caution
about tinkering with motivations and incentives. The failure to show that caution may lead
to organisations that are less productive, and especially less efficient, rather than more.
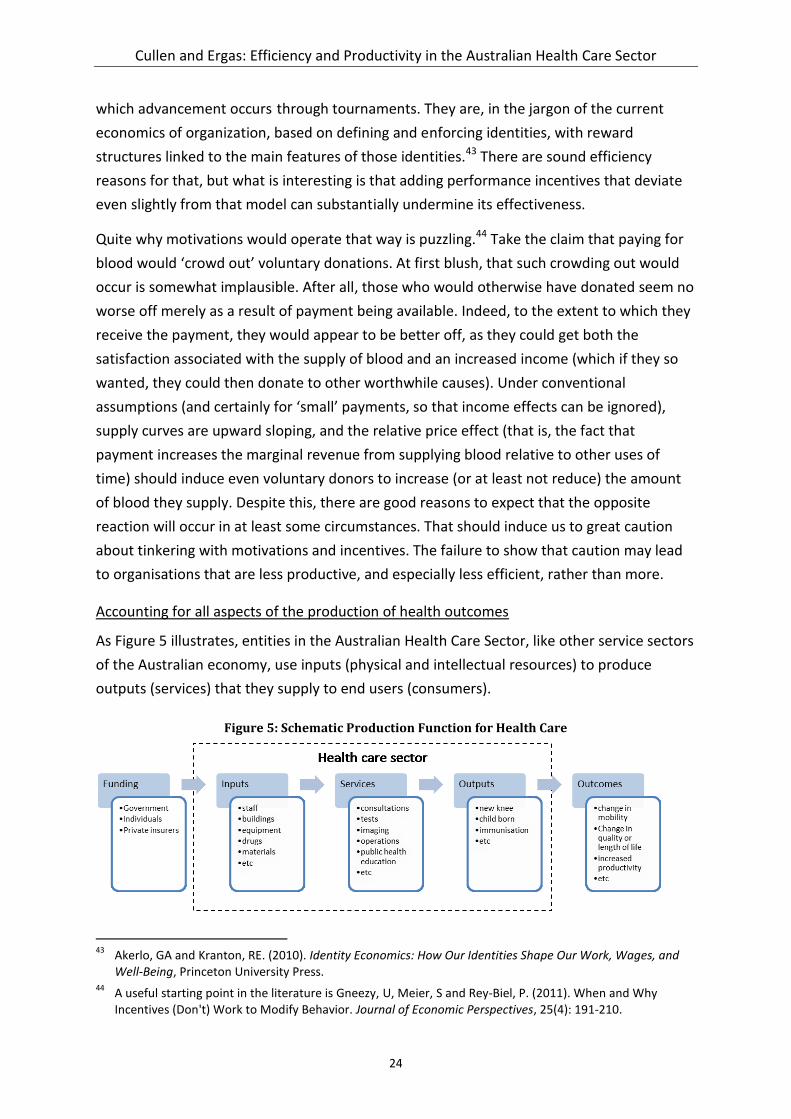
Accounting for all aspects of the production of health outcomes
As Figure 5 illustrates, entities in the Australian Health Care Sector, like other service sectors
of the Australian economy, use inputs (physical and intellectual resources) to produce
outputs (services) that they supply to end users (consumers).
Figure 5: Schematic Production Function for Health Care
43
Akerlo, GA and Kranton, RE. (2010). Identity Economics: How Our Identities Shape Our Work, Wages, and Well-Being, Princeton University Press.
44 A useful starting point in the literature is Gneezy, U, Meier, S and Rey-Biel, P. (2011). When and Why
Incentives (Don't) Work to Modify Behavior. Journal of Economic Perspectives, 25(4): 191-210.
Cullen and Ergas: Efficiency and Productivity in the Australian Health Care Sector
25
Demand for health services is generated by consumers who seek the outputs of those
services in the belief that those outputs will improve their health status (outcomes). Within
the Health Care Sector, inputs such as the health workforce (staff and their skills), buildings,
land, technology, medical supplies, food, bed linen, office supplies, utilities, etc are used to
produce outputs such as a new knee, immunity to disease, etc. The ‘services’ box represents
the micro-production functions of the health sector. Services are combinations of inputs
designed to produce certain outputs. The services of the health sector are numerous and
vary substantially in character encompassing consultative and procedural services delivered
in a range of community and institutional settings. They include GP consultations, acute care
treatment (such as hip replacements, cataract operations and oncology treatments),
immunisations, staff training and scientific research.
Outside the Health Care Sector lie the domains of Funding and Outcomes. The fact that
funding is largely exogenous has been discussed and is the technical reason why the health
sector cannot be considered to be a part of the market sector of the Australian economy.
Equally, the fact that the Outcomes domain also lies at least partly outside the sector
contributes to the difficulty in measuring efficiency/productivity in the health sector.
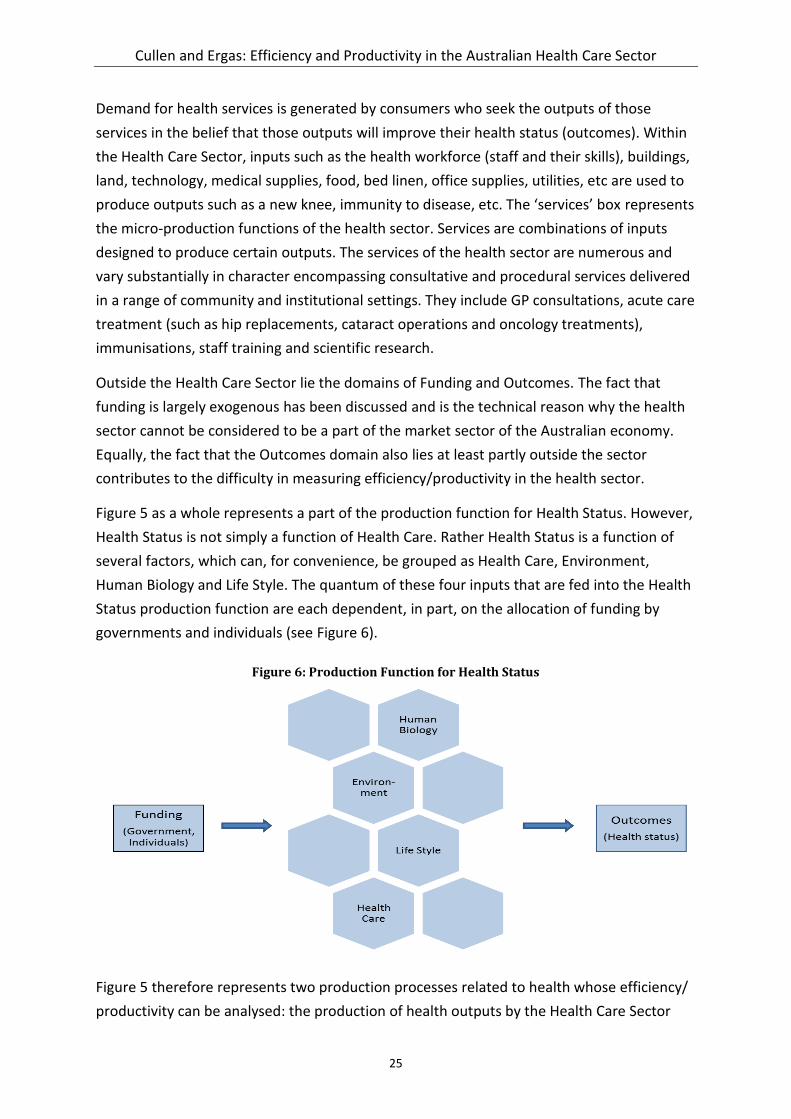
Figure 5 as a whole represents a part of the production function for Health Status. However,
Health Status is not simply a function of Health Care. Rather Health Status is a function of
several factors, which can, for convenience, be grouped as Health Care, Environment,
Human Biology and Life Style. The quantum of these four inputs that are fed into the Health
Status production function are each dependent, in part, on the allocation of funding by
governments and individuals (see Figure 6).
Figure 6: Production Function for Health Status
Figure 5 therefore represents two production processes related to health whose efficiency/
productivity can be analysed: the production of health outputs by the Health Care Sector

Cullen and Ergas: Efficiency and Productivity in the Australian Health Care Sector
26
(production within the dotted box) and the production of Health Status (between the
Funding domain and the Outcomes domain, noting that the Health Care Sector is only one
part of this production function – with the full production function shown in Figure 6).
Technically, these two production functions are related, as measuring the efficiency of the
Health Care Sector as a whole is the same as measuring the efficiency of the Health Status
production function, under the assumption that all other inputs as available for free in a
given quantity. However, different levels of aggregation and disaggregation are possible in
the two production processes, with the choice of production function and of the level of
aggregation or disaggregation to be studied determined by the question at issue.
As well as dealing with interdependencies with other determinants of health status, such as
education, welfare and living standards, the measurement of productivity in health also
needs to deal with timing difficulties – given that the success or failure of health care
interventions is not immediately evident (long lag times for some treatments, and to build
the evidence base for treatment).
The measurement of productivity in health also needs to recognise the high social costs for
using the wrong interventions, which promotes risk aversion. Any useful analysis would also
need to measure outcomes across the continuum of care rather than within segments. And
it would need to measure outcomes across the public and private sector and capture
difficult to measure outcomes such as quality and safety, equitable access and serving
vulnerable communities.
A primer on efficiency and productivity in health
One of the difficulties in measuring efficiency/productivity in health is that different
measurement approaches and adjustment levers may be appropriate in different situations.
Moreover, there are several different questions of efficiency and it is important to be clear
about what kind of efficiency is being measured. Consider the stylised representation of the
health production possibility frontier in Figure 7.
The horizontal axis represents the cost of health factor inputs. The vertical axis is the quality
and quantity of life; think of it as quality adjusted life years (QALYs). The dotted line is the
‘production possibility frontier’, meaning that all points on and up to the line can be
attained by the health system and points beyond it cannot. For a given cost (factor inputs)
higher up the survival/quality of life axis is to be preferred. Likewise, for a given
survival/quality of life value, lower cost is to be preferred.

Cullen and Ergas: Efficiency and Productivity in the Australian Health Care Sector
27
Figure 7: Stylised health production possibility frontier
Technical and productive efficiency
Do current processes within the health care sector maximize output for a given level of
input? This is the question of technical efficiency. Technical efficiency is the effectiveness
with which a given set of inputs is used to produce a given output. An entity is said to be
technically efficient if it is producing the maximum output from a given quantity of inputs,
such as labour, capital and technology. Put another way, technical efficiency occurs when
the optimum combination of factor inputs is used to produce an output.
In terms of the stylised current production possibility frontier in Figure 7, points on the
frontier (B, C, D and E) represent health systems that are technically efficient.
In the health care sector, the questions of technical efficiency can be asked at the level of an
individual output (a new knee, a new child, an immunized individual, etc) or at an aggregate
level, in which case outputs need to be aggregated through a system of weighting.
Inputs in health can be aggregated:
on the basis of cost; or
in a two dimensional model of non-labour costs; and quality adjusted labour inputs
(noting that quality adjustment for labour inputs is often done on the basis of relative
labour costs); or
in a multidimensional model of: non-labour costs; and several labour input quantities
(e.g., specialist, GP, nurses, allied health worker).
Outputs and outcomes in health, as in all sectors, have two components: quantity and
quality. The three-tiered ‘Outcome Measures Hierarchy’ in Figure 8 illustrates the

Cullen and Ergas: Efficiency and Productivity in the Australian Health Care Sector
28
comprehensiveness of the concept of ‘outcome’ in health care.45 The top tier is generally
the most important, with lower-tier outcomes involving a progression of results contingent
on the higher tiers.
Figure 8: Outcomes Measures Hierarchy
An important aspect of the quality dimension is to ensure homogeneity of clients, that is, to
control for variation due to differences in the nature and recipients of treatments. One way
to do this is to group clients into output groups by principal diagnosis, as there is a clear link
between diagnosis (e.g. knee that needs replacement) and output in the sense used in the
production function. At the level of an individual output, quantity controlled for quality, the
technical efficiency question for the relevant micro-production function is then solved by
capturing (and ensuring the commensurability of) all inputs. The difficulties that arise here
in the hospital sector are well known given the significant literature that has built up around
this issue:
Is principal diagnosis (or Diagnosis Related Group) a significantly robust discriminator
between types of interventions? It is not contradictory to hold that this level of
aggregation is appropriate for average pricing but may not be appropriate for
efficiency measurements, which are concerned with the marginal.
45
Porter ML. (2010). ‘What is value in health care’. New England Journal of Medicine, 363: 2477-2481.

Cullen and Ergas: Efficiency and Productivity in the Australian Health Care Sector
29
Are there other aspects of quality (for example, readmission) which are not captured
by principal diagnosis (or Diagnosis Related Group)?
Are all inputs identified and costed in a way which allows for aggregation and
comparison? In particular, are costs incurred outside the hospital sector appropriately
captured and, indeed, are costs incurred in different hospitals able to be
aggregated?46
46
Barbeta G; Turati G and Zago A. (2007). ‘Behavioural differences between public and private non-profit hospitals in the Italian Health Service’. Health Economics, 16(1): 75-96.
Beguin C and Simar L. (2004). ‘Analysis of the expenses linked to hospital stays: How to detect outliers’. Health Care Management Science, 7: 89-96.
Blank J and Eggink E. (2004). ‘The decomposition of cost efficiency: An empirical application of the shadow cost function model to Dutch general hospitals’. Health Care Management Science, 7: 79-88.
Burgess J and Wilson D. (1993). ‘Technical efficiency in Veterans Administration hospitals’. In The Measurement of Productivity Efficiency: Techniques and Applications, Fried H; Lovell C and Schmidt S (eds). Oxford: Oxford University Press.
Byrnes V and Valdmanis V. (1994). ‘Analysing technical and allocative efficiency of hospitals’. In Data Envelopment Analysis: Theory, Methodology and Applications, Charnes A; Cooper W; Lewin A and Seiford L (eds). Dordrecht: Kluwer Academic Publishers.
Dalmau E and Puig-Junoy J. (1998). ‘Market structure and hospital efficiency: Evaluating potential effects of deregulation in the National Health Service’. Review of Industrial Organization, 13: 447-466.
Dismuke C and Sena V. (1999). ‘Has DRG payment influenced the technical efficiency and productivity of diagnostic technologies in Portuguese public hospitals? An empirical analysis using parametric and non-parametric methods. Health Care Management Science, 2: 107-116.
Färe R; Grosskopf S; Lindgren B and Roos P. (1989). ‘Productivity developments in Swedish hospitals: a Malmquist output index approach’. In Data Envelopment Analysis: Theory, Methodology and Applications, Charnes A; Cooper W; Lewin A and Seiford L (eds). Dordrecht: Kluwer Academic Publishers.
Ferrier G; Rosko M and Valdmanis V. (2006) ‘Analysis of uncompensated hospital care using a DEA model of output congestion’. Health Care Management Science, 9: 187-188.
Hofmarcher M; Paterson I and Riedel M. (2002). ‘Measuring hospital efficiency in Austria: A DEA approach’. Health Care Management Science, 5: 7-14.
Hollingsworth B and Street A. (2006). ‘The market for efficiency analysis of health care organisations’. Health Economics, 15: 1055-1059.
Morey R; Fine D and Loree S. (1990). ‘Comparing the allocative efficiency of hospitals. International Journal of Management Science, 18: 71-83.
Ozcan Y; Luke R and Haksever C. (1992). Ownership and organizational performance: A comparison of technical efficiencies across hospitals types. Medical Care, 30: 781-84.
Pilyavsky A; Aaronson W; Bernet P; Rosko M; Valdmanis V and Golubchikov M. (2006) ‘East-west: does it make a difference to hospital efficiencies in Ukraine?’ Health Economics, 15: 1173-1186.
Rodríguez-Álvarez A and Lovell C. (2004). Excess capacity and expense preference behaviour in national health systems: An application to the Spanish public hospitals. Health Economics, 13: 157-169.
Rosko M. (2001). ‘Cost efficiency of US hospitals: a stochastic frontier approach’. Health Economics, 10: 539-551.
Siciliani L. (2006). ‘Estimating technical efficiency in the hospital sector with panel data: A comparison of parametric and non-parametric techniques’. Applied Health Economics & Health Policy, 5: 99-116.
Zuckerman S; Hardley J and Jezzoni L. (1994). ‘Measuring hospital efficiency with a cost function’. Journal of Health Economics, 13: 255-280.
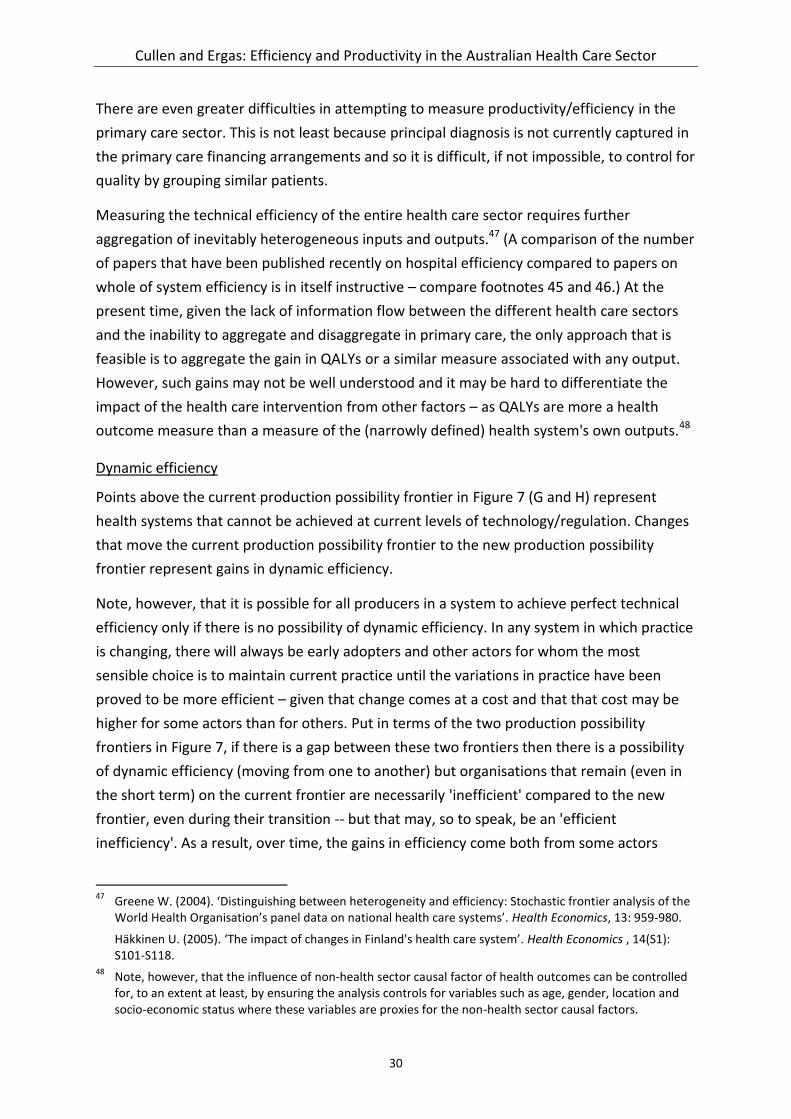
Cullen and Ergas: Efficiency and Productivity in the Australian Health Care Sector
30
There are even greater difficulties in attempting to measure productivity/efficiency in the
primary care sector. This is not least because principal diagnosis is not currently captured in
the primary care financing arrangements and so it is difficult, if not impossible, to control for
quality by grouping similar patients.
Measuring the technical efficiency of the entire health care sector requires further
aggregation of inevitably heterogeneous inputs and outputs.47 (A comparison of the number
of papers that have been published recently on hospital efficiency compared to papers on
whole of system efficiency is in itself instructive – compare footnotes 45 and 46.) At the
present time, given the lack of information flow between the different health care sectors
and the inability to aggregate and disaggregate in primary care, the only approach that is
feasible is to aggregate the gain in QALYs or a similar measure associated with any output.
However, such gains may not be well understood and it may be hard to differentiate the
impact of the health care intervention from other factors – as QALYs are more a health
outcome measure than a measure of the (narrowly defined) health system's own outputs.48
Dynamic efficiency
Points above the current production possibility frontier in Figure 7 (G and H) represent
health systems that cannot be achieved at current levels of technology/regulation. Changes
that move the current production possibility frontier to the new production possibility
frontier represent gains in dynamic efficiency.
Note, however, that it is possible for all producers in a system to achieve perfect technical
efficiency only if there is no possibility of dynamic efficiency. In any system in which practice
is changing, there will always be early adopters and other actors for whom the most
sensible choice is to maintain current practice until the variations in practice have been
proved to be more efficient – given that change comes at a cost and that that cost may be
higher for some actors than for others. Put in terms of the two production possibility
frontiers in Figure 7, if there is a gap between these two frontiers then there is a possibility
of dynamic efficiency (moving from one to another) but organisations that remain (even in
the short term) on the current frontier are necessarily 'inefficient' compared to the new
frontier, even during their transition -- but that may, so to speak, be an 'efficient
inefficiency'. As a result, over time, the gains in efficiency come both from some actors
47
Greene W. (2004). ‘Distinguishing between heterogeneity and efficiency: Stochastic frontier analysis of the World Health Organisation’s panel data on national health care systems’. Health Economics, 13: 959-980.
Häkkinen U. (2005). ‘The impact of changes in Finland's health care system’. Health Economics , 14(S1): S101-S118.
48 Note, however, that the influence of non-health sector causal factor of health outcomes can be controlled
for, to an extent at least, by ensuring the analysis controls for variables such as age, gender, location and socio-economic status where these variables are proxies for the non-health sector causal factors.

Cullen and Ergas: Efficiency and Productivity in the Australian Health Care Sector
31
pushing out the frontier and from others catching up: or if they don't, in a competitive
market, being forced to exit.
That poses obvious institutional issues for the health system, where the rewards and
punishments associated with innovating, catching up or failing to do so may not align with
the associated social benefits. The persistence of wide spreads in the efficiency with which
actors in the health system operates may in part reflect the 'efficient inefficiency' referred
to above; but it is also likely to reflect a selection environment that is too weak, in the sense
of not providing sufficient incentives for best practice and average practice to converge, and
adaptation costs that are unnecessarily high. Addressing those sources of potential
inefficiency could well be of critical importance, and requires a greater understanding of the
mechanisms shaping the pattern and persistence of deviations from best practice.
Allocative and social (distributive) efficiency
Allocative efficiency is concerned with the issue of whether the current health care sector
offers the most appropriate mix of services. Similarly, social efficiency is concerned with the
optimal distribution of resources in society, taking into account all external costs and
benefits as well as internal costs and benefits. These efficiencies, in the view of the authors
of the present paper, should not be the principal focus of the current discussion – not least
because the achievement of technical efficiency is a necessary precondition for the
achievement of allocative efficiency. For completeness, allocative and social efficiency are
further discussed in Appendix A.
Current measures of productivity in health
The difficulties discussed in this paper have led to the development of the view in some
quarters that other economic concepts, more amenable to application in the health care
sector, may be a more appropriate focus for discussion. There has tended to be a focus on:
• Micro-efficiency – Do processes maximise outputs for a given level of inputs (technical
and productive efficiency)? Is the most appropriate mix of services being delivered
(allocative efficiency)?
• Cost effectiveness / value for money – Are interventions achieving the best outcome
in the best way possible?
• Effectiveness – Are interventions achieving the desired outcome?
• Quality – Are interventions of the appropriate quality?
It is sometimes asserted that the use of these alternative measures as a proxy for
productivity can help policy makers decide the best allocation of funding to deliver the
desired outcomes. While all of these metrics are potentially of value, the claim that they can
determine funding allocations is problematic. The third and fourth ‘proxies’ are really
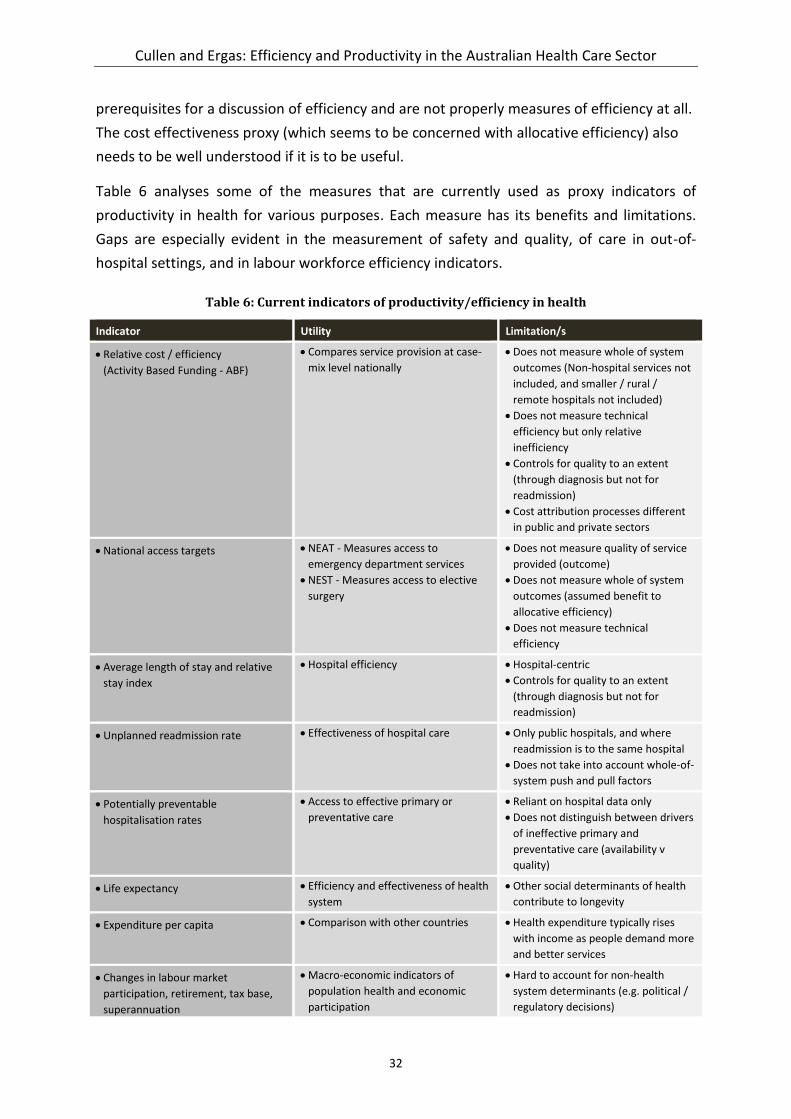
Cullen and Ergas: Efficiency and Productivity in the Australian Health Care Sector
32
prerequisites for a discussion of efficiency and are not properly measures of efficiency at all.
The cost effectiveness proxy (which seems to be concerned with allocative efficiency) also
needs to be well understood if it is to be useful.
Table 6 analyses some of the measures that are currently used as proxy indicators of
productivity in health for various purposes. Each measure has its benefits and limitations.
Gaps are especially evident in the measurement of safety and quality, of care in out-of-
hospital settings, and in labour workforce efficiency indicators.
Table 6: Current indicators of productivity/efficiency in health
Indicator Utility Limitation/s
Relative cost / efficiency
(Activity Based Funding - ABF)
Compares service provision at case-
mix level nationally
Does not measure whole of system
outcomes (Non-hospital services not
included, and smaller / rural /
remote hospitals not included)
Does not measure technical
efficiency but only relative
inefficiency
Controls for quality to an extent
(through diagnosis but not for
readmission)
Cost attribution processes different
in public and private sectors
National access targets NEAT - Measures access to
emergency department services
NEST - Measures access to elective
surgery
Does not measure quality of service
provided (outcome)
Does not measure whole of system
outcomes (assumed benefit to
allocative efficiency)
Does not measure technical
efficiency
Average length of stay and relative
stay index
Hospital efficiency Hospital-centric
Controls for quality to an extent
(through diagnosis but not for
readmission)
Unplanned readmission rate Effectiveness of hospital care Only public hospitals, and where
readmission is to the same hospital
Does not take into account whole-of-
system push and pull factors
Potentially preventable
hospitalisation rates
Access to effective primary or
preventative care
Reliant on hospital data only
Does not distinguish between drivers
of ineffective primary and
preventative care (availability v
quality)
Life expectancy Efficiency and effectiveness of health
system
Other social determinants of health
contribute to longevity
Expenditure per capita Comparison with other countries Health expenditure typically rises
with income as people demand more
and better services
Changes in labour market
participation, retirement, tax base,
superannuation
Macro-economic indicators of
population health and economic
participation
Hard to account for non-health
system determinants (e.g. political /
regulatory decisions)

Cullen and Ergas: Efficiency and Productivity in the Australian Health Care Sector
33
4 Drivers of inefficiency in health
This section of the paper is concerned with the drivers of inefficiency in health, as an
understanding of these drivers and the types of inefficiencies that arise in health is central
to the development of measures of productivity and efficiency that will actually be useful in
assisting managers and policy makers to identify and rectify inefficiencies. In brief, there are
four main conceptual sources of technical inefficiency namely:
• failing to minimise the physical inputs used;
• failing to use the least cost combination of inputs;
• operating at the wrong point on the short-run average cost curve; and
• operating at the wrong point on the long-run average cost curve.49
Table 7 provides a few health examples to help concretise these concepts.
Table 7: Typology of the conceptual sources of technical inefficiency
Failing to minimise the physical inputs
Excessive length of stay, with patients staying in hospital
after they have ceased to benefit from hospitalisation
Poor scheduling of diagnostics and procedures, resulting
in excessive hospital stay
Prescribing an intervention or diagnostic test which is
known to be of no therapeutic value or relevance
Over-prescribing of drugs (too high a dosage, too long a
course, more substances than required)
Excessive use of diagnostic tests (e.g. performing daily
tests when they are only interpreted once a week)
Wastage of stocks – e.g. allowing stocks to expire, or
allowing deterioration due to poor storage etc.
Over-staffing
Failing to use the least cost combination of inputs
Inappropriate overuse of more expensive staff relative to
less expensive staff, e.g. physicians vs. nurses for basic
prescribing of essential drugs, nurses vs. nursing assistants
for basic personal care, nurses vs. clerical staff for basic
administrative duties
Use of branded drugs when generics are available
Failure to secure lowest cost supply – e.g. buying supplies
from retail suppliers t rather than competitive bidding
Being locked in to purchasing consumables at a set price
from a manufacturer for a piece of equipment that has
been provided free or on loan
Using paramedic-staffed emergency ambulances to
transport patients home from hospital
Wrong point on the short-run average cost curve
Implementing budget cuts that protect salaries at the
expense of other expenditure items, hence reducing the
number of patients who can be treated, but with no
reduction in fixed costs
Refusing to fill a vacant anaesthetist post due to budget
restraints, forcing the surgical staff to limit operating time
A rural hospital operating at a low bed occupancy due to
limited local demand
Inadequate drug supply leading to under-utilisation of
primary care clinics
Wrong point on the long-run average cost curve
Planning to provide full pathology laboratory facilities at
every hospital when laboratory services actually
demonstrate economies of scale
Planning to build a teaching hospital that is larger than the
size at which diseconomies of scale are known to operate
in hospitals
49
The concepts of short run and long run concern the extent to which, over time, a production unit can change the level and combination of inputs it employs, and/or the level or type of output it produces. Conventionally, the long run refers to a period that is sufficiently long for a production unit to be completely free in its decisions from its present policies, possessions, or commitments. By contrast, in the short run, at least one significant factor of production cannot be changed—it’s fixed, in other words. The practical ability of firms or organizations to shift from a constrained short-run position to a flexible long-run choice of inputs and processes is fundamental to achieving technical and economic efficiency.

Cullen and Ergas: Efficiency and Productivity in the Australian Health Care Sector
34
Considered relative to those issues, it should, in one sense, be easy for policy makers to
design systems that can be efficient and for managers within those systems to drive
efficiency. The basic tasks are to: minimise the physical inputs used in the production of
each output, controlling for quality; ensure that the least cost combination of inputs is used;
operate at the right point on the short-run average cost curve; and operate at the right
point on the long-run average cost curve. But the practical difficulties remain considerable
and include:
• Are inputs and outputs measured appropriately?
• Are the right incentives in place to ensure managers can achieve efficiencies once
identified?
Are inputs and outputs measured appropriately?
We have set out our answer to the first of these questions above. In brief, there is currently
no easy way to consistently measure inputs and outputs across the whole of the health
system, except through macro-measures such as QALYs (for outcomes) and Health
expenditure per capita (for inputs). Nonetheless, this simple measure, controlling for the
influence of non-health sector causal factor of health outcomes by ensuring the analysis
controls for variables such as age, gender, location and socio-economic status where these
variables are proxies for the non-health sector causal factors, can provide a powerful
summary measure of productivity across the entire health system. However, given its very
aggregative nature, it does not lend itself to ready identification of causal links and hence to
relating specific interventions (for instance, in terms of funding levels and allocations) to
expected outcomes.
The overall efficiency of Australia’s health system is impacted by health interventions with
widely varying levels of cost-effectiveness. Following the McKeon review we categorise
health care interventions as either (Figure 9):
High-Value Interventions , which are typically public health or primary care
preventive programs applied at a population level;
Routine Treatment, which encompasses interventions by clinicians in primary care
and acute settings;
Low-Value Interventions, which may be cost effective but at a lower rate than other
interventions;
Waste, including duplication; and
Adverse Events, which create further demand for health services.

Cullen and Ergas: Efficiency and Productivity in the Australian Health Care Sector
35
Figure 9: Health system performance (Australian estimates)
The approach to improving efficiency/productivity needs to be different in each of these
domains. Moreover, it needs to be recognised that potentially contentious issues of
distribution will inevitably arise. For example, while a pure efficiency analysis might argue
for the allocation of scarce resources to areas of the cost curve in Figure 9 offering the
largest marginal improvement, this might clash with equity goals. For example, a
pharmaceutical can only be listed on the Commonwealth’s Life Savings Drug Program if it
has been accepted by the Pharmaceutical Benefits Advisory Committee as clinically
effective, but not recommended for inclusion on the Pharmaceutical Benefits Scheme due
to unacceptable cost-effectiveness. In this case, the issue of technical efficiency (within the
program) is subordinated to issues of distribution and to judgements about equity of access.
This is perhaps unavoidable, and indeed may be desirable, but it must be understood lest
system wide measures are inappropriately applied – which leads helpfully to the second
question.
Are the right incentives in place?
A useful place to begin to answer this question is to ask why it is that some health care
providers (small or large, individuals or corporations) fail to minimize inputs and input costs

Cullen and Ergas: Efficiency and Productivity in the Australian Health Care Sector
36
or to maximise outputs (outcomes). On the one hand, they may be seeking to minimise
costs or maximise outputs, but failing to do so because of institutional constraints or
because of a lack of information, which prevent them from identifying efficient input
combinations and processes. On the other hand, they may not be seeking to minimise costs
or maximise outputs, but rather to satisfy other demands, including behavioural or
motivational reasons.
The ways in which an absence of incentives for efficient behaviour or the presence of
constraints on decision-makers’ abilities to make efficient choices have been studied can
drive organizations in all sectors to either maximize profits or to minimize costs are well
understood.50 Specific examples of problematizing structural incentives and constraints in
health care are set out in Table 8.51
Table 8: Blockages to efficiency
Incentive/constraint Economic impact
Public ownership Managers cannot have a claim on residual profits/savings
Multiple objectives Multiple policy objectives require managers to make trade-offs and exercise discretion between efficiency, equity, access, participation and quality
Payment systems Fee-for-service and case-based payments provide incentives to provider to increase activity/revenue compared to fixed budgets. Remuneration may not be affected by performance or quality
Market information There is often a lack competitive performance information/signals
Input indivisibilities Under-utilization of fixed, indivisible assets
Demand Spare rural population; Preferences for inefficient and unnecessary care
Information systems Limited data availability on services for decision-makers, little data on prices for lower-level managers
The above should not be seen as a criticism of, for example, ‘public ownership’. Rather our
intention is to enumerate the issues that any analysis of, and incentives for, efficiency must
take into account. Most importantly, efficiency issues must not be treated as technical and
measurement questions but rather as core management objectives. Complex and
unpalatable choices must be made if significant efficiency gains are to be realized. Most
important, perhaps, efficiency improvement must never be seen as a one-off purging of
current inefficiencies. There may well be a powerful case for a specific structural
50
Baumol, WJ. (1977). Economic theory and operations analysis. New Jersey, Prentice-Hall.
Liebenstein, H. (1966). Allocative efficiency vs. “X-efficiency”. American Economic Review, 56: 392–415.
Williamson, OE. (1963) The economics of discretionary behaviour. New Jersey, Prentice-Hall. 51
Somanathan A et al. (2000). Operating efficiency in public health sector facilities in Sri Lanka: measurement and institutional determinants of performance. Small Applied Research Paper No. 12. Partnerships for Health Reform Project. Bethesda, MD.

Cullen and Ergas: Efficiency and Productivity in the Australian Health Care Sector
37
intervention, but this should never obscure the need to imbue and constantly renew a
culture of continuous efficiency improvement at all levels of the system. Without such a
culture, all that will be achieved is a shift from one position of static productivity to another.
Following the World Health Organisation’s Commission on Macroeconomics and Health52,
the present authors consider that a successful approach to developing an efficiency
improvement program needs to contain the following components:
• identification and quantification of major areas of technical inefficiency;
• identification of key causes of identified inefficiencies;
• assessment of possible interventions to improve efficiency;
• assessment of likely constraints on and barriers to achieving identified efficiencies;
• development of a reinvestment program for the employment of at least some of the
funds released through efficiency gains;
• implementation of structural changes required to facilitate major or one-off
improvements, including willingness to invest in such changes; and
• implementation of organizational and cultural shift to continuous productivity
improvement, including appropriate performance management systems.
52
Hensher, M. (2001). Financing Health Systems through Efficiency Gains. World Health Organisation Commission on Macroeconomics and Health Working Paper Series Paper No. WG3 : 2.

Cullen and Ergas: Efficiency and Productivity in the Australian Health Care Sector
38
5 Conclusion
There is no a priori reason to be concerned with the growth of the health care sector’s share
of the economy. Indeed, if the aggregate health benefits of care truly outweigh the total
social costs, and that relation remains true at the margin, then there would be a concern if
an increasing share of the economy was not devoted to living longer and healthier lives.
Nonetheless, there are cogent reasons to be concerned with the efficiency of the health
care system notwithstanding (and indeed in part because of) the difficulties inherent in
measuring efficiency in health. The authors of the current paper draw four implications for
health policy makers from the analysis reported in this paper.
Firstly, in talking to Treasuries, health policy makers have a positive story to tell and should
so do, both in respect of the contribution that health investment makes to the economy and
in respect of the relative efficiency of Australia’s health care system. To support these
discussions there would be value in developing a whole-of-system measure of productivity,
noting that current data constraints mean that this measure could only be built at a high
level – for example the relationship between the QALYs and health expenditure per capita.
Secondly, there is arguably currently too much emphasis placed on the issue of allocative
efficiency. While there can be gains in shifting from less to more valued forms of care even
in a system that is technically inefficient, those gains are likely to be small relative to the
gains that would come from increasing technical efficiency. In any case, many issues labelled
as issues of allocative efficiency are really issues of distribution. That is, they are concerned
with society’s judgements about the distribution of care (access and equity), which can
involve decisions to invest in interventions that, evaluated without taking distribution into
account, are not cost effective.
Thirdly, technical inefficiency is a localised phenomenon and systems are required that
support (through measurement), accommodate, encourage and reward (through savings
redirection, for example) innovation so that managers can manage. One-size-fits-all
measures of efficiency risk concentrating the minds of managers on meeting targets rather
than on improving efficiencies. A reliance on such measures may also mean that managers
do not have access to the data that they need to identify the localised inefficiencies that
characterise the specific environment in which they work. In addition, technical
inefficiencies that are imposed on managers (for example, the dead weight burdens of
decisions about equity and distribution) need to be identified and quantified so that
managers are accountable for that which they can control.
Fourthly and finally, given the importance of dynamic efficiency in driving productivity,
measurement systems must not constrain variation so much that change is impossible.

Cullen and Ergas: Efficiency and Productivity in the Australian Health Care Sector
39
Unfortunately, some 'adverse events' may be necessary if the possibility of dynamism is to
be allowed. Put another way, judgements as to whether or not a process is efficient require
a priori a specification of the quality of the product to be produced. Failure to produce to
the specified quality is not inefficiency but rather ineffectiveness – and some degree of
ineffectiveness may be the inevitable cost of experimentation and adjustment. Thus, in
developing systems to measure efficiency there would be considerable value in drawing
from the well-understood health care performance and quality literature on the differences
between measurement for performance management and measurement for quality
improvement, which are directly analogous to some of the challenges in measuring
productivity and efficiency in health care.

Cullen and Ergas: Efficiency and Productivity in the Australian Health Care Sector
40
Appendix A: Allocative and social (distributive) efficiency
Does the current health care sector offer the most appropriate mix of services? This is the
question of allocative efficiency. An economic sector can be technically efficient but produce
goods that people don’t want. Allocative efficiency occurs when goods are distributed
according to consumer preferences.53 For example, in Figure 10 , marginal cost equals
marginal utility at the quantity Qe. It is easy to see geometrically that this is the point where
the yellow and green areas (which represent the excess of benefit over cost is maximized.)54
In terms of the stylised current production possibility frontier in Figure 7, point C on the
frontier represents a health system that is allocatively efficient. Given that allocative
efficiency occurs at the output level where Price equals the Marginal Cost of production, it is
necessary to express the value of the QALYs obtained in dollar terms. The point on the
current production possibility frontier at which allocative efficiency occurs is then the point
C, where the slope of the frontier is equal to the inverse of this hurdle rate.55
Economically, point C is preferable to point B as the forgone (non-health) consumption
involved in getting from C to B exceeds the value of improved health. Intuitively, all
potential treatments are considered, but only options that improve health for less than the
hurdle rate per QALY, or that scale back on treatments costing more than the hurdle rate
per QALY, are chosen. In the aggregate, health outcomes would improve and costs would
likely decline, but some subsets of the population, such as incurable patients, could end up
being worse off.56
53
A more precise definition of allocative efficiency is that it occurs at the output level where Price equals the Marginal Cost of production. This is because that is the point where the price that consumers are willing to pay is equivalent to the marginal utility that they get. Therefore the optimal distribution is achieved when the marginal utility of the good equals the marginal cost.
54 The green area in Figure 10 is the Provider Surplus – that is, the excess of the price received for the
quantity of goods supplied over the cost of producing that quantity of goods. The yellow area is the Consumer Surplus – that is, the excess of the utility received for the quantity of goods demanded over the cost of purchasing that quantity of goods.
55 If the costs of each unit increase in QALYs are ranged from lowest to highest, at some point the cost
exceeds the hurdle rate threshold. At that point, the system has reached the (self-imposed) point of diminishing returns. The slope of the production function becomes too shallow at that point, schematically illustrated as point C in the chart. That’s where additional spending cannot improve allocative efficiency.
56 Assume the health system is located on the production possibility frontier at point D. Now consider two
approaches to expanding a new, potentially cost-effective treatment. In the case where only those appropriate for care get it, outcomes and costs improve, to point E, still on the best practice production possibility frontier. But in the case where treatment is extended across all patients, corresponding to point F, outcomes are worse, and costs are higher because the procedure is now done for a wider swath of patients. Extending treatment could even lead to a negative correlation between spending and outcomes, as illustrated by points E and F.
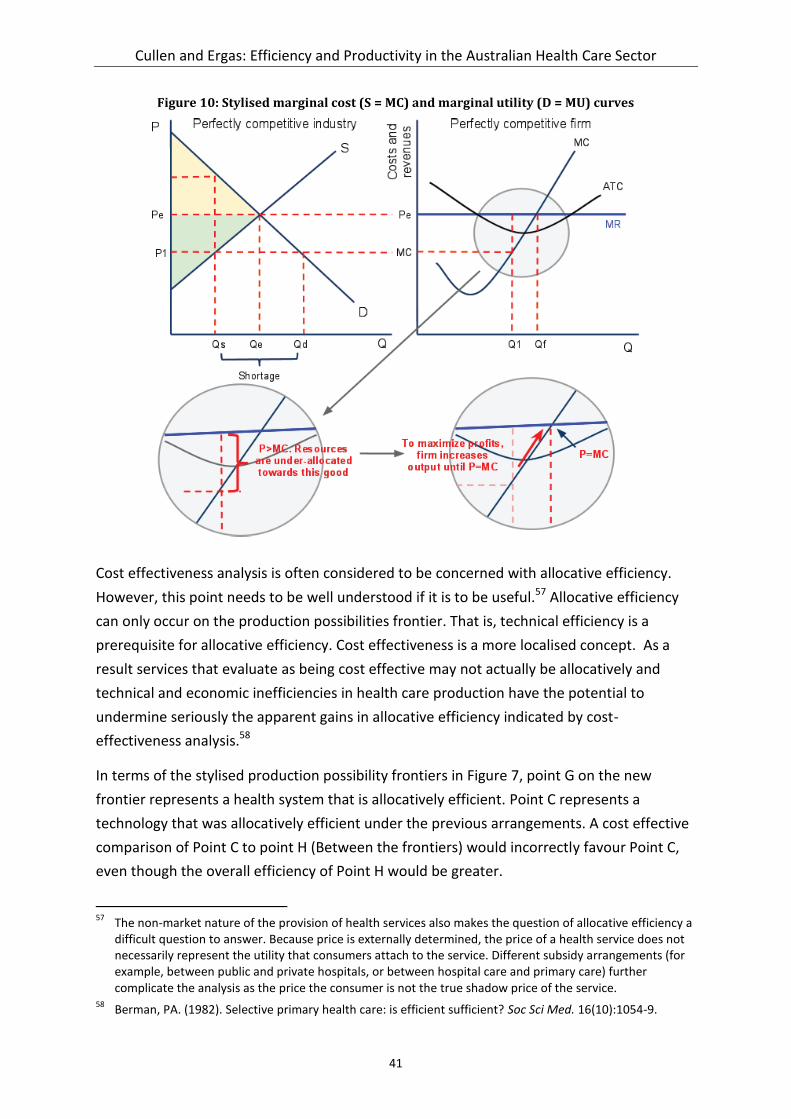
Cullen and Ergas: Efficiency and Productivity in the Australian Health Care Sector
41
Figure 10: Stylised marginal cost (S = MC) and marginal utility (D = MU) curves
Cost effectiveness analysis is often considered to be concerned with allocative efficiency.
However, this point needs to be well understood if it is to be useful.57 Allocative efficiency
can only occur on the production possibilities frontier. That is, technical efficiency is a
prerequisite for allocative efficiency. Cost effectiveness is a more localised concept. As a
result services that evaluate as being cost effective may not actually be allocatively and
technical and economic inefficiencies in health care production have the potential to
undermine seriously the apparent gains in allocative efficiency indicated by cost-
effectiveness analysis.58
In terms of the stylised production possibility frontiers in Figure 7, point G on the new
frontier represents a health system that is allocatively efficient. Point C represents a
technology that was allocatively efficient under the previous arrangements. A cost effective
comparison of Point C to point H (Between the frontiers) would incorrectly favour Point C,
even though the overall efficiency of Point H would be greater.
57
The non-market nature of the provision of health services also makes the question of allocative efficiency a difficult question to answer. Because price is externally determined, the price of a health service does not necessarily represent the utility that consumers attach to the service. Different subsidy arrangements (for example, between public and private hospitals, or between hospital care and primary care) further complicate the analysis as the price the consumer is not the true shadow price of the service.
58 Berman, PA. (1982). Selective primary health care: is efficient sufficient? Soc Sci Med. 16(10):1054-9.

Cullen and Ergas: Efficiency and Productivity in the Australian Health Care Sector
42
A further complexity is that the concept of allocative efficiency works best for a perfect
market. In non-perfect markets managers can have other goals – for example, managers can
seek to maximise profits, or revenue, or sales. In seeking each of these outcomes, managers
will strive for technical efficiency but not necessarily for allocative efficiency. As Figure 11
illustrates, for a given demand curve, the quantities that a provider will seek to supply
depend on their goals
profit maximisation occurs at quantity Q1 , where marginal revenue (MR) equals
marginal cost (MC);
revenue maximisation occurs at quantity Q2 , where marginal revenue (MR) equals 0;
allocative efficiency occurs at quantity Q3 , where Price (P) or Marginal Utility (MU)
equals Marginal Cost (MC); and
sales maximisation (making maximum sales whilst still making normal profits) occurs
at quantity Q4 , where Average Revenues (AR) = Average Costs (AC).
Figure 11: Efficiency and goals
The final concept is social efficiency, which represents the optimal distribution of resources
in society, taking into account all external costs and benefits as well as internal costs and
benefits. Social Efficiency occurs at an output where Marginal Social Benefit (MSB) =
Marginal Social Cost (MSC). This is closely related to the concept of Pareto efficiency – the
point where it is impossible to make anyone better off without making someone worse off.
It is also closely related to Distributive Efficiency, which is concerned with allocating goods
according to those who need them most.