efficiency analysis of cereal -legume … area of kaduna state. maiangwa and rahman (1997) reported...
TRANSCRIPT

Gashua Journal of Irrigation and Desertification Studies (2016), Vol. 2. No. 2 ISSN: 2489 - 0030
Saleh et al., 2016 Page 23
EFFICIENCY ANALYSIS OF CEREAL -LEGUME BASED CROPPING SYSTEM IN
KACHIA AND KAGARKO LOCAL GOVERNMENT AREAS OF KADUNA STATE
Saleh, P., Tiku, N.E. and Galadima, M.
Department of Agricultural Economics and Extension
Faculty of Agriculture
Federal University Gashua Yobe State
Email: [email protected]
Abstract
The study was to examine the level of resource used efficiency in cereal legume base cropping
system in Kachia and Kagarko Local Government Areas of Kaduna State. A multi stagesampling
procedure was use, the random sampling techniques was employed for the selection of a total of
150 farmers who were interviewed through the used of structured questionnaire aimed to
captured the objectives of the study. Data were analysed with the use of descriptive statistics and
stochastic production function. Findings from the results shows that the major cereal legume
combination observed in the cultivated farmer’s plots in the area were maize and soya bean,
sorghum and groundnut maize and groundnut, maize and soya bean and sorghum and soya bean
in the respective order. Farmers were relatively efficient in the used of the production resources
and technology at their disposal, with seed and fertilizer as the most significant resources which
affects the efficiency of the cereal legume production. Age and house hold size were the most
significant socio economics variables that affects inefficiency of production in the study area.
Keywords: Stochastic, Production, frontier, efficiency, Cereal, Legume.
INTRODUCTION
Agriculture still occupies a key position in
Nigeria’s economy. Over 70 percent of the
population resides in the rural areas and earn
their living from agriculture (Ogungbile and
Olukosi, 1991). Agriculture plays an
important role in employment and revenue
generation as well as in the provision of raw
materials for industrial development. The
sector holds the key to rapid economic
transformation, poverty alleviation, stable
democracy and good governance
(Rahman,2008). However, the nation’s
agricultural potentials are far from being
fully realized and this has serious
implications for food security and
sustainable economic development.
The under-development of agriculture is,
indeed worrisome, given the fact that the
country is naturally well endowed for
agricultural production. According to Azeez
(2002), a large percentage of Nigeria
population derived their income from
agriculture and agriculture related activities
in which 75% of its rural inhabitants are
farmers.
However over the years, the of rate growth
in agricultural production has stagnated and
failed to keep pace with the needs of rapidly
growing population, resulting in a

Gashua Journal of Irrigation and Desertification Studies Vol. 2. No. 2 pp 23 – 37 2016
Saleh et al., 2016 Page 24
progressive rise in import bills for food. The
gap between population and food supply
continues to widen (CBN,2005).
Nigerian agriculture has suffers greatly from
low funding. Research has shown that most
of the farmers are Small Scale and poor (
World Bank,2006). Because of this poverty
they cannot adopt improved technologies
such as fertilizers, herbicides, improved
variety of seeds and modern farm machinery
such as tractors and combined harvesters.
They use traditional tools that are capable of
generating only a very small income. They
produce primarily for consumption
(Rahman, et al. 2002; Imonke, 2003).
Farmers attitude towards risk and
uncertainty is one of the major factors,
which influence farm production decisions
with respect to cropping pattern, and the use
of technology. Cereal-legume mixtures are
most common type of intercropping practice
by most farmers in the Northern Nigeria and
this may due to the possible benefits the
cereal can derived from legume (Rahman,
2001). The systems facilitate adequate
utilization of resources such as land, labour
and capital, but the interpretation of crop
performance in terms of resource
productivity becomes complicated.
Cereal- legume mixture is the most popular
mixed cropping in Northern and middle belt
zones of Nigeria. This is due to the
beneficial impact of legumes on the cereals
such as provision of vegetation cover to
check erosion as well as competitive effect
of weeds on available water and nutrients
(Anon, 1996). Farmers are now adopting
cereal-legume mixtures in their farms one of
the techniques for integrated soil fertility
management for sustainable yield and steady
income.
Intercropping creates more opportunity to
market small surpluses of greater range of
products, increasing cash income for
different family members especially women
(Guyer, 1986).
Intercropping of maize or sorghum with
groundnut generally leads to greater
production per unit area than growing the
crops in pure stands ( Awal ,2006). This is
because there is more efficient use of
resources such as light, water, soil nutrients
by cropping mixtures than the same crop
grown sole. It is as a result of this that
farmers still cultivate crops mixtures instead
of sole. In Nigeria, a large proportion of the
land is devoted to mixed cropping (Olukosi
and Ogungbile, 1991). The motive of the
farmer’s preference for mixed cropping is
mostly associated with risk. There could be
other factors that influence farmer’s decision
in favour of mixed cropping system; which
are yet to be identified and understood. The
nature of input-output relationship, price
efficiency of inputs the technical and
managerial factors influencing the decision
of peasant farmers to continue in cereal-
legume system is the main focus of the
research.
THEORETICAL FRAMEWORK
In Nigeria, a large proportion of the land is
devoted to mixed cropping (Olukosi and
Ogungbile, 1991). The motive of the
farmer’s preference for mixed cropping is
mostly associated with risk.
The cereal-legume mixture is the most
common type of intercropping practice in
the tropics and this may be due to the
possible benefit the cereal can derive from
the atmospheric nitrogen fixed by legume
nodules.
Efficiency Analysis of Cereal -Legume Based Cropping System in Kachia and Kagarko Local Government Areas
of Kaduna State
Saleh et al., 2016 Page 25
It has been contested that non-legumes can
acquire adequate supply of nitrogen when
grown together (Anon, 1996). According to
Mandal (1990), there was increase yield of
maize and groundnut in a mixture of the two
crops. This was attributed to the greater
utilization of the environmental resources
compared to when the crops are planted
sole.
They also observed the same trend in maize-
cowpea mixture. Enyi (1973) also reported
that intercropping sorghum with pigeon peas
increase total grain yield per hectare.
In a series of mixtures of maize and several
legumes in Sri Lanka, it was found that
maize yield were increase by 103% with
cowpea, 16 – 28% with mung bean, 16-42%
with groundnut while the corresponding
legume yield were all reduce (Gunasena et
al., 1979). Some research workers on the
other hand recorded little or no advantage of
cereal legume mixtures over the sole crops.
In fact, in some cases, decreased yields were
reported. In a sorghum-soyabean fertilizer
experiment at Samaru, Abaver (1984)
reported that the presence of soyabean
reduce sorghum yield by about 20%. This he
concluded may be due to vigorous
competition of soyabean with sorghum for
mineralized soil or nitrogen fertilizer. In
maize-soyabean mixture at Samaru, maize
yield were not significantly affected by the
presence of soyabean, but soyabean yield
was reduce to 45% of the sole crop yield
(Fisher, 1980). Though, the yield of a
particular crop as a component in a mixture
may be of some economic significance. It
was reported by Rahman (1998), that
millet/cowpea and sorghum/cowpea
mixtures were more profitable than the sole
cowpea and so the farmers preference to
mixed cropping.
Most of the farmers in the northern Nigeria
grow maize in mixtures with leguminous
crops such as cowpea, soya beans and
groundnut as observed by Rahman et al.
(2002). Among the mixtures maize/cowpea
mixture recorded the highest yield of
1168.15kg, follow by maize/ soya bean.
Maize/cowpea mixture had the highest gross
margin of N33, 943.20/ha, follows by
maize/groundnut mixtures among all the
maize cropping system in Giwa Local
Government Area of Kaduna State.
Maiangwa and Rahman (1997) reported that
growing cowpea in mix cropping with millet
allowed farmers to maximized profit and use
labour efficiently. Millet as an important
source of various type of food to farmers
met their family needs and may be difficult
to persuade the farmers from growing
cowpea and millet in mixtures.
METHODOLOGY
Study Area
The study was conducted in two Local
Government Areas (LGAs) of Kaduna State,
namely Kachia and Kagarko Local
Government Areas. The state lies in the
North Central position between latitude 9o
10 N and 11:30 North and Longitude 6o E
and 9o: 10 East of the prime meridian. The
state shares common borders with Katsina,
Kano, Zamfara, Federal Capital Territory,
Plateau, Niger and Nassarawa States.
The Area fall within Samaru Agricultural
Zone with an annual rainfall varying
between 1107mm and 1286mm
(Ileoje,1989).
Gashua Journal of Irrigation and Desertification Studies Vol. 2. No. 2 pp 23 – 37 2016
Saleh et al., 2016 Page 26
Sampling Procedure
A multistage sampling procedure was used
for the study. A pre surveyed was carried
out to identified Wards with higher
concentration of cereal-legume farmers. The
first stage involved purposive selection of 10
wards out of the 20 wards that made up the
two Local Government areas (Kachia &
Kagarko).
The second stage involved a random
selection of one village from the wards. The
third stage involved a random selection of
farmers from each of the selected villages
base of a proportionality factor of 10% to
make up a total of 150 farmers. (That is 75
farmers from each Local Government Area).
Data Collection
Primary data were used for this study. The
data were collected based on the 2011
Cropping Seasons through the use of
structured questionnaire which was
administered to the farmers engaging in
cereal-legume mixtures.
Analytical Tools
The following tools of analysis were
employed to achieve the objectives of this
study.
Descriptive statistics and Stochastic
production frontier
Descriptive Statistic
Data analysis was done by means of
descriptive statistic such as frequency
distribution table, percentage and
proportions to assess the socio-economic
characteristics of the farmers and the
existing Cereal- legumes based farming
system in the study area.
Stochastic Frontier model
The stochastic productions function as
specified by (Battese and Coelli, 1995;
Amaza and Olayemi, 2002) was stated as:
𝑌𝑖𝑡 = 𝑓(𝑋𝑖𝑡𝛽)𝑒𝑥𝑝(𝑉𝑖𝑡 – 𝑈𝑖𝑡)
(1)
Where;
Yit= output
.𝑋𝑖𝑡 = a vector of inputs
𝛽 = a vector of parameters to be estimated
𝑓 =is the Cobb-Douglas functional form.
𝑉𝑖𝑡 =are random error that are assumed to
account for measurement errors of the farm
that are assumed to be independently and
identically distributed (𝑖𝑖𝑑), 𝑁(0, ơ𝑣2)
𝑈𝑖𝑡 = are non-negative technical
inefficiency in the production and obtained
by truncation (at zero ) of the normal
distribution with𝑁 (𝑚𝑖𝑡, ơ𝑣2. )
Where m = 𝑧𝑖𝑡𝜎,
The values of the unknown parameters of
this model were estimated by maximum
likelihood method, after making
assumptions regarding the distributions of
𝑈𝑖𝑎𝑛𝑑𝑉𝑖which are often assumed to be
normal and half normal, respectively. As
presented in the model, the stochastic
frontier has two error terms,
𝜎2 = 𝜎𝑣2 + 𝜎𝑢
2( 2)
and
𝛾 = 𝜎𝑢2/𝜎𝑣
2 where, 𝛾 is defined for (0 <𝛾<
1) (3 )
unlike in the traditional production function.
One error term,𝑈𝑖, accounts for technical
inefficiency and the other 𝑉𝑖, to account for
other factors such as measurement errors in
the output variable. Therefore the cobb-
dauglass specification is as follow;

Efficiency Analysis of Cereal -Legume Based Cropping System in Kachia and Kagarko Local Government Areas
of Kaduna State
Saleh et al., 2016 Page 27
𝑙𝑛𝑌 = 𝛽0 + 𝛽1𝑙𝑛𝑞1 + 𝛽2𝐿𝑛𝑞2 +
𝛽3𝐿𝑛𝑞3 + 𝛽4𝐿𝑛𝑞4 + 𝛽5𝐿𝑛𝑞5 + 𝑉𝑖 − 𝑈𝑖( 4
)
Where,
𝐿𝑛= Natural logarithm to base 10
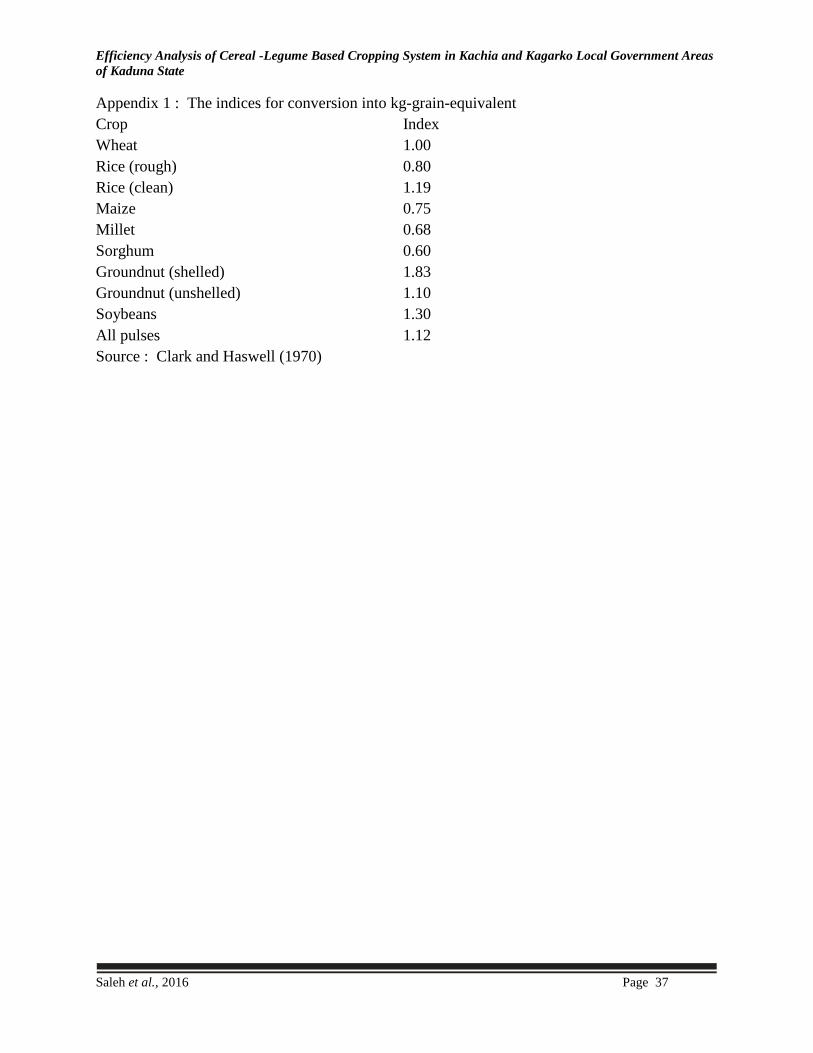
𝑌𝑖 = Total output of ith farm ( kg grain
equivalent)
𝛽0−𝛽5 = Parameters to be estimated,
q1 = Farm size (ha)
𝑞2 = Labour (Man-days)
q3 = Seed (kg)
𝑞4 = Fertilizer (kg)
𝑞5= Agrochemical (litres)
Efficiency determinants:
A unique feature of the stochastic frontier is
the decomposition of the component error
term (Vi-Ui) into mutually exclusive events.
This is usually achieved by estimating the
mean conditional distribution of U given V
expressed as:
𝐸(𝑉 𝑒𝑖⁄ ) = 𝑈𝑖 = 𝜎∗[𝑓∗{−𝜇 𝜎∗⁄ }[1 −
𝐹(𝑈𝑖 𝜎∗⁄ )−1] (5)
Where; 𝜎∗ = (𝜎𝑣2𝜎𝑢2 𝜎2⁄ )1
2 , 𝜇 =
(−𝜎𝑢2𝑒𝑖),
𝑓𝑖𝑠𝑡ℎ𝑒 𝑠𝑡𝑎𝑛𝑑𝑎𝑟𝑑 𝑑𝑒𝑛𝑠𝑖𝑡𝑦 𝑓𝑢𝑛𝑐𝑡𝑖𝑜𝑛 𝑎𝑛𝑑 𝐹𝑖𝑠𝑡ℎ𝑒
𝑑𝑖𝑠𝑡𝑟𝑖𝑏𝑢𝑡𝑖𝑜𝑛𝑎𝑙 𝑎𝑠𝑠𝑢𝑚𝑝𝑡𝑖𝑜𝑛.
The values of the unknown coefficients were
estimated using the maximum likelihood
[ML] method.
𝑉1 = Random errors which are assumed to
be independently and identically distributed
as N (0, 𝜎2 v).
𝑈𝑖 =Non- negative random variable
associated with technical inefficiency of
production assumed to be independently
distributed such that μi is obtained by
truncation (at zero) of the normal
distribution with variance 𝜎u2 and mean μ
where the mean is defined by;
μ=δo+δ1z1δ1z2+δ3z3+δ4z4+δ5z5+δ6z6+δ7
z7+δ8z8 (6 )
Where;
δ= a vector of unknown parameters to be
estimated
zi = ( I = 1, 2, 3, 4, 5) = Factors contributing
to inefficiency
z1 = Total Farm size .(hectares)
z2 = Age of the farmers in years,
z3 = Farming experience (years)
z4 = Education level ( Years of schooling
by farmer)
z5 = Household size (No of persons )
z6 = Non Farm income (N)
z7 = Gender {Dummy1 for male 0
otherwise}
z8 = Extension contact( No, of visits to a
farmer by extension worker)
RESULTS AND DISCUSSION.
Socio Economic Characteristics of Cereal
Legume Farmers
Age Distribution of Farmers: The analysis
of sample farmers in the study area revealed
that the age bracket of farmers ranged
between 25 and 75 years. Majority of the
farmers were between the age limit of 46 –
55 years (36.7%). The most active age group
between the ages of 25–35 years is relatively
low (15.33%). This is due to the fact that
most of the farmers within this age bracket
are still in the school or have preference for
white collar jobs in the cities. The older age
group is the lowest (6.33%) and the average
age of the farmers in the study was 48.37.
This is presented Table 3.1.
Sex Distribution of Farmers: Gender
influences the knowledge, perceptions and
needs of the farmers as well as their access
to Agricultural technologies, information
Gashua Journal of Irrigation and Desertification Studies Vol. 2. No. 2 pp 23 – 37 2016
Saleh et al., 2016 Page 28
and productive resources. Almost all the
respondents in Kachia local government
area were males 93.3% with only five
farmers representing 6.67% were females. In
Kagarko Local Government area 86.67% of
the respondents were males with only
13.33% females .Women in the area were
more limited than men in their access to
critical farm resources such as farm land,
credit and improved inputs due to cultural,
tradition and sociological factors as
observed (Tanko, 1994). This implies that
most of the sampled farmers in the study
area are men and that women interest and
involvement in farm decisions making was
limited even though women were actively
participated in the production process. This
result agreed with findings of Rahman
(2008) that accessibility rate of women to
productive resources was very low in
northern Nigeria.
Household Size of the Farmers: A family
size or household size is the total number of
individuals or people who lived within and
feed in the same pot in the household. A
household is made up of the head, wives,
children and extended family members as
defined by (Ogungbile et al., 2002). The
study revealed that the household size of the
respondent ranged from 2 – 45 number
persons. The modal household size was 6 –
10, (44%) in Kachia and (46.66%) in
Kagarko local government areas
respectively . This is in line with findings of
Ogungbile et al., (2002) on the family size
in Northern Nigeria which shown that most
of the household size were within the ranges
of 6 to 10 persons. The average household
size in the study area was found to be ten
persons per household.
Household size is an important socio-
economic characteristic in agricultural
production in Nigeria. The level of
mechanization is very low in the area; hence
farmers depend on human labour in carry
out farm activities. The size of household
determines the size of farm holding and
consequently the output from production.
From the findings it shows that most (86%)
of the household size in the study area are in
the range (6 > 15 people). This implied that
greater proportion of labour for cereal-
legume mixtures could come from family
labour and the labour is readily available for
timely operations in the farm activities.
Educational Qualification of Farmers
The study revealed that most of the farmers
in the study area have only primary school
qualification with Kachia having (33.33%)
and Kagarko local government having
(40%). Those that have adult education
qualification were (26.67%) in Kachia and (
29.33) in Kagarko local government areas
respectively.
Those with secondary school education were
(18.66%) in both local government areas.
Kachia local government area has more
farmers with post secondary school
qualification (21.33%) than Kagarko with
only (12%) post secondary school
qualification as presented in the Table 1.
The analysis revealed that the average
farmer in the study area was moderately
educated. The implication is that they were
better able to take decision as regards to
perceptions, adoption and acceptance of
innovations.
Farming Experience of Farmers
Farming experience is the number of years
over which the farmers has been engaged in

Efficiency Analysis of Cereal -Legume Based Cropping System in Kachia and Kagarko Local Government Areas
of Kaduna State
Saleh et al., 2016 Page 29
farming. Length of time in farming business
can be linked with age. The study revealed
that farmers experience in cereal-legume
mixtures production ranges from 5 – 46
years. Kagarkohave more sample farmers
with more than 20 years experience in cereal
legume mixture production (34.67)
compared tokachia local government with
only (26.67%). The distribution of farmers
experience is presented in table 1.
The analysis revealed that about (81.34%) of
the farmers in Kagarko local government
area have more than ten years experience in
cereal- legume production while those in
kachia were (54%). This implies that
farmers were able to make effective farm
management decision on both resource
allocation and adhering to best agronomic
practices. The average farming experience
of 25years in both Local government areas
shows that the respondents have sufficient
experience in cereal- legume mixture.
Farm Size
Farm size refers to the total land area in
hectares that the farmers cultivate. The size
of land devoted to any cropping enterprise is
a measure of the scale of that enterprise. The
farm size of the respondents ranged from
one hectare to ten hectares with an average
of 2.6 ha. This implies that the production of
cereal mixtures in the area is under small
scale enterprise. Sampled farmers with farm
size greater than 5.5hacteres are more in
Kachia Local Government Area (27%) than
in Kagarko with only (4%).
It can be deduced that 62% of the
respondents had total farm size of less than
4 hectares and only 38% percent have a total
farm size of 4 hectares and above. This
implies that most of the farmers in study
area have small farm holdings and may not
practiced mechanize farming.
Characterization of Cereal-legumes in
Study Area
Cropping Pattern
Cropping system is one of the important
aspects of agronomic practices that affects
the efficiency of technology being used in
crop production Rahman et al. (2002)
The study revealed that the predominant
cropping system in the area was mostly
Cereal-Legume mixed cropping. Various
combinations of cereals and legume were
observed in mixture as shown in Table 2.
The most popular cereal legume mixture in
the study were maize/soyabeans (30%)
followed by Sorghum/groundnut (25%).
This is in line with the findings of (Rahman,
2002) that most of the farmers in northern
Nigeria grow maize in mixtures with
legumes crop such as cowpea, soybeans and
groundnut. Others combinations were soya
beans/sorghum, maize/groundnut and
millet/groundnut. The dominant crops were
sorghum, maize, groundnut, soya beans,
cowpea and millet. These crops are
intercropped in rows in most of the farms
with exception of cowpea and millet which
are on relay.
Estimate of Input and Output
Relationship (Production Frontier
Estimate)
The parameters of the model were estimated
by maximum likelihood (MLE) using the
computer programme frontier 4.1 developed
by Coelli (1996). Frontier is a single purpose
package specifically designed for estimation
of stochastic production frontier and
technical efficiency. The maximum
likelihood estimate of the stochastic

Gashua Journal of Irrigation and Desertification Studies Vol. 2. No. 2 pp 23 – 37 2016
Saleh et al., 2016 Page 30
production for the cereal-legume crop
mixtures is presented in Table 3. The ( 𝜎 )
sigma square (7.4345) is statistically
different from zero indicating a good fit and
the correctness of the specified distribution
assumption of the composite error terms.
The variance ratio defined as Gamma( 𝛾 )
was estimated to be 0.1313 implying that
technical inefficiency account for about
13.13% of the variation in output levels of
cereal-legume crop mixtures.
Production Determinant
The production function indicates the
relative importance of the factor inputs used
in farming among the cereal-legume crop
mixture farms in the study area. Seed and
fertilizer were the most important factor
influencing the production in the study area.
The coefficient of seed (0.37180) is positive
and significant at 1% level of probability.
Seed is therefore a significant factor
associated with changes in output of cereal-
legume crop mixtures. The coefficient of
fertilizer (0.2877) was also found to be
positive and significant at 1% level of
probability. Though land, labour, and agro
chemicals were positively related to output
variations in the study area, estimates from
the result shows that their variables were not
significant factors influencing output of the
cereal-legume crop mixture farms.
Mathematically the Cobb-Douglas
specification can be expressed as shown
below
𝑙𝑛𝑌 = 1.6489 + 1.7159q1 + 0.2035q2 +
0.3718q3 + 0.2877q4 + 0.0664q5
( 0.2570) (0.1671) (0.1568)
(0.1198) (0.0892) ((0.0742)
Determinants of Inefficiency
The sources of inefficiency were examined
using the estimated (𝛿) coefficients
associated with the inefficiency factors. The
factors includes: Farm size, age, farming
experience, Education, Household size,
Income, Gender and extension contact.
According to Udoh (2005), Edet et-al.,
(2006) estimated coefficients of
inefficiency provides some explanations for
the relative technical efficiency levels
among individual farms. In this study, only
age (-0.0117) and household size (-0.2146)
were statistically significant at 1% level of
probability. That is as the age and household
number increases the level of technical
efficiencies increases. This may be
attributed to the fact that farmers with larger
families have more family labour and this is
important for timely operation of farming
activities which is capable of translating into
higher efficiencies. The older farmers
because of long years spent in cultivation of
cereal legume mixtures might have acquired
more experience that could lead to the
higher efficiency in production.
Therefore, the inefficiency model can be
mathematically expressed as shown below.
𝜇 = -0.2487 + 0.0083 - 0.0117 - 0.0434 +
0.0036 - 02146+-0.4361+0.0697+0.0036
(0.4646) (0.0105) (0.0012) (0.0011)
(0.0066) (0.0002) (0.0002) (0.1737)
(0.0008)
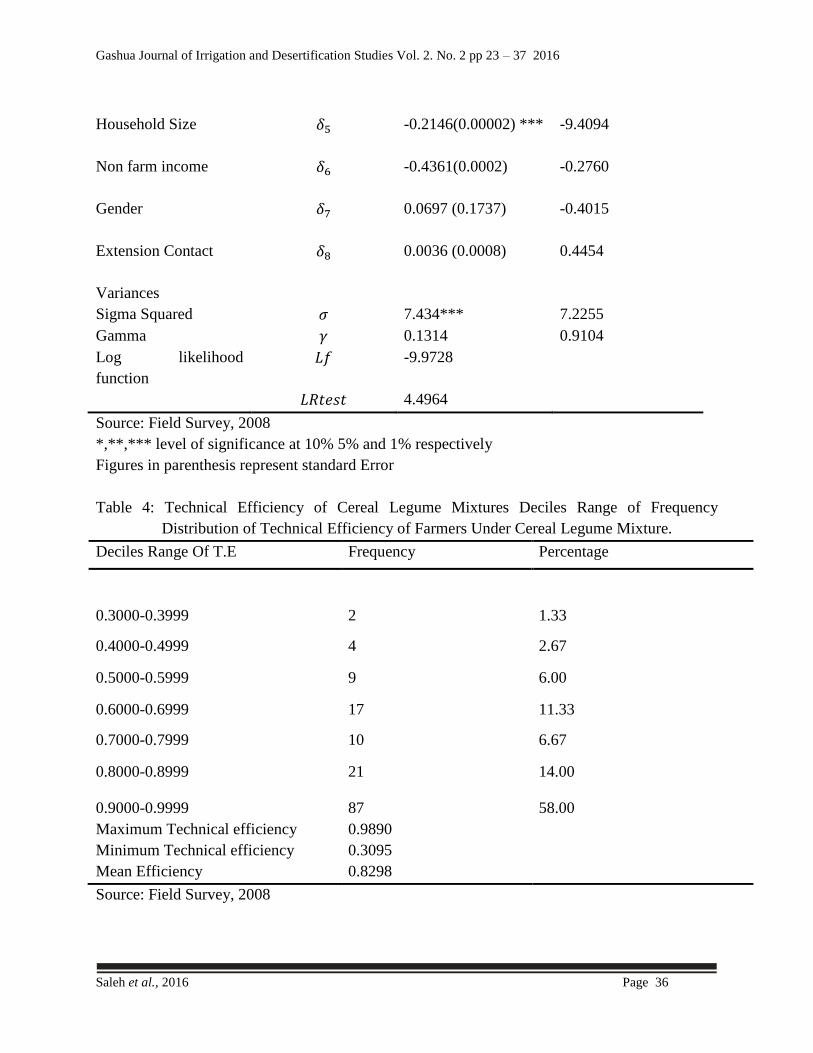
As shown in the table 5 the technical
efficiencies of the cereal legumes ranged
from 0.3095 to 0.9890 with an average
technical efficiency of 0.8298. The Table 4
further revealed that only 15 farmers had
technical efficiency (T.E) of less than 60%.
About 108 farmers representing 72% of the
total respondents sampled had efficiency
Efficiency Analysis of Cereal -Legume Based Cropping System in Kachia and Kagarko Local Government Areas
of Kaduna State
Saleh et al., 2016 Page 31
ranging between 0.80 and 0.99 indicating
that more than half of the farmers under
cereal legume mixture in the study area were
relatively efficient. The average TE of about
0.8298 recorded from the analysis of cereal
legume crop mixture in the study area. This
implied that the efficiency could be
increased by about 18% through better use
of available resources. The observed
distribution suggest that little production
resources are wasted due to inefficient used
of resources. With mean efficiency value of
about 82% the analysis revealed that
production has not reached the frontier
threshold.
CONCLUSION
The dominant cereal-legume mixture in the
study area are maize/soyabean,
sorghum/groundnut maize/groundnut,
maize/cowpea and sorghum/soya bean.
The sample farmers are moderately efficient
technically given their resources and
available technology Seed and fertilizer
were the most important factor of production
that influences the output of the mixture in
the study area.
Two socioeconomic variables (household
size and age of the farmers) were inversely
and significantly related to the technical
inefficiency with the technical efficiency
range of 0.6805(0.9890-0.3095) Table5 in
the area. Therefore, the null hypothesis was
rejected.
RECOMMENDATIONS
The following recommendations are hereby
made:
i. The 82.98% level of technical
efficiency shows that there is
room to improve production to
reach the optimum level of
100%. This requires addressing
those factors that constraint
efficient production by the
cereal-legume farmers.
ii. Agricultural societies should be
encouraged in the study area in
order to cater for the agricultural
needs of small scale farmers.
iii. Kaduna state Government should
encourage the establishment of
Agro processing industries for
value change addition of cereal
and legume corps in the area.
REFERENCES
Amaza, P.S (2002), Resource used
Efficiency in food
productioninGombe State, Nigeria.
Unpublished Ph.D Thesis in
Department of Agricultural
Economics, University of
Ibadan,Ibadan. 26-28
Awal, M.A, Koth, H., Ikeda, T (2006)
Radiation Interception and use by
maize/peanut intercrop Canopy.
Agriculture and forest
meteorology;139: 73-84.
Azeez, I.O. (2002). Evaluation of Media for
disseminating forest conservation
information in South Western
Nigeria.Ph.D Dissertation submitted
to Faculty of Agriculture and
Forestry University of Ibadan.37 .
Battese, G. (1992).A role on Estimation of
Cobb Douglas production function
when some explanatory variables
have zero values. Journal of
Agricultural Economics ; 8(1):75-85
Battese, G.E. and Coelli,T.J., (1995).
A model for Technical Efficiency

Gashua Journal of Irrigation and Desertification Studies Vol. 2. No. 2 pp 23 – 37 2016
Saleh et al., 2016 Page 32
Effect in stochastic Production for
panel Data EMP Econ 20: 325-45.
Clark, C. and Haswell, M. (1970).The
Economics of Subsistence
Agriculture.Forth Edition,
Macmillan and Co. Ltd., London and
Basingstoke.
Coelli, T.J., PrasadaRao, D.S and
Battese,G.E. (1998). An introduction
to Efficiency and productivity
Analysis. Kluwer Academic
Publishers Boston/Dordrecht.
CBN, (2005).Annual Report and Statement
of Accounts Central Bank of Nigeria.
Abuja Publication, Nigeria.
Coelli, T.J (1996). A Guide to frontier 4.1 A
Computer programme for Stochastic
frontier production and cost function
Estimation. Working papers 7/96.
Department of Economics University
of New England Armidale.
Elemo, K. A. Kumar, V.Olukosi J.O. and
Ogungbile A.O. (1990). Review of
research work on mixed cropping in
the Nigerian savanna. Samaru
miscellaneous paper
127:125.
Elemo, K.A. and Ayejolu, B.O.
(1991).Performance of Cowpea
Mixture in Olukosi J. O.,
Ogungbile, A. O. and Kalu
B. A (eds) Appropriate Agicultural
Technologies for Resource Poor
Farmers. A publication of Nigerian
Farming Research Network.
Guyer, J. I.( 1986). Intra household
processes and farming system
research.Perspective from
anthropology. In: J.L. Moock (ed.)
Understanding Africa’s Rural
household and farming systems.
West View Press Inc.’ Boulder
Colorado.
Olukosi, J.O. and Ogungbile, A.O. (1991).
An Overview of the problems of
resource-Poor
Farmers in Nigeria agriculture In: Olukosi,
J. O.Ogungbile A.O. andKaluB.A.
(eds). Appropriate
Agricultural Technologies for poor
farmers.A publication of the
Nigerian Farming System Research
Network.
Rahman S. A (1998). Economics of Cowpea
Production in selected Villages of
Katsina and Zamfara StatesUnder
Indigenous & Improved Practice, An
M.SC Thesis Department of
Agricultural Economics and Rural
Sociology Ahmadu Bello University,
Zaria.
Rahman S.A (2000). Resource use
efficiency in cereal-legumes mixture
in Giwa and Soba Local Government
Area Kaduna State.A Ph.D.Thesis to
the Department of Agricultural
Economics and Rural Sociology,
ABU Zaria. 88-92
Rahman, S.A. and Lawal, S.B (2002).
‘Economic Analysis of Maize Based
cropping system in GiwaLocal
Government Area of Kaduna State’.
ASSET Series A, 3 (2). 145-154
Rahman, S.A.( 2008). Women involvement
in Agriculture in Northern and
Southern Kaduna State, Nigeria.
Journal of Gender Studies; vol. 17.
17-26
Rahman, S. A. (2006)Yield and Benefit-
costs of cereal-legume rotations in
the Guinea Savanna of Northern

Efficiency Analysis of Cereal -Legume Based Cropping System in Kachia and Kagarko Local Government Areas
of Kaduna State
Saleh et al., 2016 Page 33
Nigeria. Tropical Science Journal,
46 (3.151-154.
Tanko, N.M (1994). Contribution of Rural
women to Agricultural Planning and
Economic Development in
Nigeria.Winrock International
Institute of Agricultural
Development,
Whatmore, S (1991) Women in Agriculture.
Journal of Rural Studies 7(1/2)
Special issue.
Udoh, E.J., (2005). Technical Inefficiency in
Vegetable farms of humid region:
An analysis of Dry season farming
by Urban Women in south-south
zone Nigeria. Journal of Agriculture
and Social Sciences. 1:80-5.
World Bank. (2006) Poverty reduction and
growth: Virtuous and vicious circles.
Washington World Bank.
Table 3.1 Socio - economics characteristics of respondents
Kachia LGA Kagarko
LG
Age Group
(Years)
Frequency Percentage Frequency Percentage
25- 35 13 17.4 10 13.33
36-45 18 24.4 19 25.33
46-55 27 36.0 28 37.33
56-65 11 14.6 14 18.67
66-75 6 8.0 4 5.33
Total 75 100 75 100
SEX
Male
Female
70
5
93.33
6.67
65
10
86.667
13.33
Total 75 100 75 100
House hold size
1-5 13 17.33 8 10.68
6-10 33 44.00 35 46.66
11-15 13 17.33 28 37.33
>-15 16 21.33 4 5.33

Gashua Journal of Irrigation and Desertification Studies Vol. 2. No. 2 pp 23 – 37 2016
Saleh et al., 2016 Page 34
Total
Educational
Level
75 100 75 100
Adult
Education
20 26.67 22 29.33
Primary
Education
25 33.33 30 40.00
Secondary
School
14 18.67 14 18.67
Post
Secondary
School
Total
16
75
21.33
100
9
75
12.00
100
Farming
Experience
(years)
1-5 17 22.67 4 5.33
6 – 10 19 25.33 10 13.33
11 – 15 10 13.33 14 18.67
16 – 20 9 12.00 21 28.00
>29 20 26.67 26 34.67
Total 75 100 75 100
Total Farm
Size (ha)
1-2.5 26 34.67 22 29.33
2.6-3.5 15 20.00 30 40.00
3.6-4.5 9 12.00 13 17.33
4.6-5.5 5 6.67 7 9.33
>5.5 20 26.67 3 4.00
Total 75 100 75 100
Source: Field Survey, 2008

Efficiency Analysis of Cereal -Legume Based Cropping System in Kachia and Kagarko Local Government Areas
of Kaduna State
Saleh et al., 2016 Page 35
Table 2: Major types of cereal-legume mixtures in the study area
Cropping System No. of Farmers Percentage
Maize/Cowpea
Maize/Soyabean/Sorghum
Millet/Groundnut
Maize/Groundnut
Sorghum,/Soyabeans
Maize/Soyabeans
Sorghum/Groundnut
15
6
5
25
20
44
35
10
4
3.33
16.67
13.33
30.16
23.33
Total 150 100.00
Source: Field Survey, 2008
Table 3.Estimated cobb-douglas stochastic production function for cereal-legume Mixtures
Input Variables Parameters Coefficient t-ratio
Constant 𝛽0 1.6489(0.2570) ***
6.4139
Land 𝛽1 1.7159(0.1671)
0.1026
Labour 𝛽2 0.2035(0.1568)
1.2978
Seed 𝛽3 0.3718(0.1198) ***
3.1033
Fertilizer 𝛽4 0.2877(0.0892) ***
3.226
Agrochemical 𝛽5 0.0664(0.0742)
0.8949
Inefficiency Model
Constant 𝛿0 -0.2487(0.4646)
-0.5352
Farm Size 𝛿1 0.0083(0.0105)
0.7876
Age 𝛿2 -0.0117(0.0012) ***
-9.3258
Farming Experience 𝛿3 -0.0434(0.0011)
-0.0380
Education 𝛿4 0.0036 (0.0066) 0.5499
Gashua Journal of Irrigation and Desertification Studies Vol. 2. No. 2 pp 23 – 37 2016
Saleh et al., 2016 Page 36
Household Size 𝛿5 -0.2146(0.00002) ***
-9.4094
Non farm income 𝛿6 -0.4361(0.0002)
-0.2760
Gender 𝛿7 0.0697 (0.1737)
-0.4015
Extension Contact 𝛿8 0.0036 (0.0008)
0.4454
Variances
Sigma Squared 𝜎 7.434*** 7.2255
Gamma 𝛾 0.1314 0.9104
Log likelihood
function
𝐿𝑓 -9.9728
𝐿𝑅𝑡𝑒𝑠𝑡 4.4964
Source: Field Survey, 2008
*,**,*** level of significance at 10% 5% and 1% respectively
Figures in parenthesis represent standard Error
Table 4: Technical Efficiency of Cereal Legume Mixtures Deciles Range of Frequency
Distribution of Technical Efficiency of Farmers Under Cereal Legume Mixture.
Deciles Range Of T.E Frequency Percentage
0.3000-0.3999 2 1.33
0.4000-0.4999 4 2.67
0.5000-0.5999 9 6.00
0.6000-0.6999 17 11.33
0.7000-0.7999 10 6.67
0.8000-0.8999 21 14.00
0.9000-0.9999
Maximum Technical efficiency
Minimum Technical efficiency
Mean Efficiency
87
0.9890
0.3095
0.8298
58.00
Source: Field Survey, 2008
Efficiency Analysis of Cereal -Legume Based Cropping System in Kachia and Kagarko Local Government Areas
of Kaduna State
Saleh et al., 2016 Page 37
Appendix 1 : The indices for conversion into kg-grain-equivalent
Crop Index
Wheat 1.00
Rice (rough) 0.80
Rice (clean) 1.19
Maize 0.75
Millet 0.68
Sorghum 0.60
Groundnut (shelled) 1.83
Groundnut (unshelled) 1.10
Soybeans 1.30
All pulses 1.12
Source : Clark and Haswell (1970)