efficacy of ftir analysis in determining co2 loading on
TRANSCRIPT

48th International Conference on Environmental Systems July 2018, Albuquerque, NM 1
Roger Huang – KBR Wyle/ NASA ARC
Mark Silveria – KBR Wyle/ NASA ARC
Jessica Kong – KBR Wyle/ NASA ARC
Grace Belancik – NASA ARC
Darrell Jan – NASA ARC
Efficacy of FTIR Analysis in Determining CO2 Loading on Diglycolamine
ICES Paper 2018-262

Outline
• Liquid amine background
• Microgravity adaptation
• FTIR motivation
• Experimental Method
• pH Desorption
• FTIR Analysis/ Calibration
• Results
• Discussion
48th International Conference on Environmental Systems July 2018, Albuquerque, NM 2

Liquid Amine Background
• Industrial plant gas sweetening (H2S, CO2 removal)
• Liquid amine systems used in submarines since the 1950s• Monoethanolamine (MEA) scrubbers
• Maintained CO2 concentration at 1% of the atmosphere
• Advantages over solid sorbent bed systems• Power and volume savings
• Potential usage in human spaceflight• JSC evaluation of various liquid amines in FY16
48th International Conference on Environmental Systems July 2018, Albuquerque, NM 3

48th International Conference on Environmental Systems July 2018, Albuquerque, NM 4
Liquid Amine Background
Typical CO2 removal plant process diagram
Gravity-dependent design

48th International Conference on Environmental Systems July 2018, Albuquerque, NM 5
Microgravity Adaptation
Goal: design a liquid amine-based CO2 capture system that can operate in microgravity
• Contactor designs for adsorbing and desorbing• Captured liquid flow• CO2 mass flux• Separation of gas and liquid

48th International Conference on Environmental Systems July 2018, Albuquerque, NM 6
Microgravity Adaptation
Adsorb vs Degas (regeneration) mechanics for Diglycolamine (DGA)• Tasks split between JSC and ARC
Focal points for ARC:• Degas rate
• Temperature• Surface Area• Liquid Flowrate (contact time)• CO2 loading• H2O concentration
48th International Conference on Environmental Systems July 2018, Albuquerque, NM 7
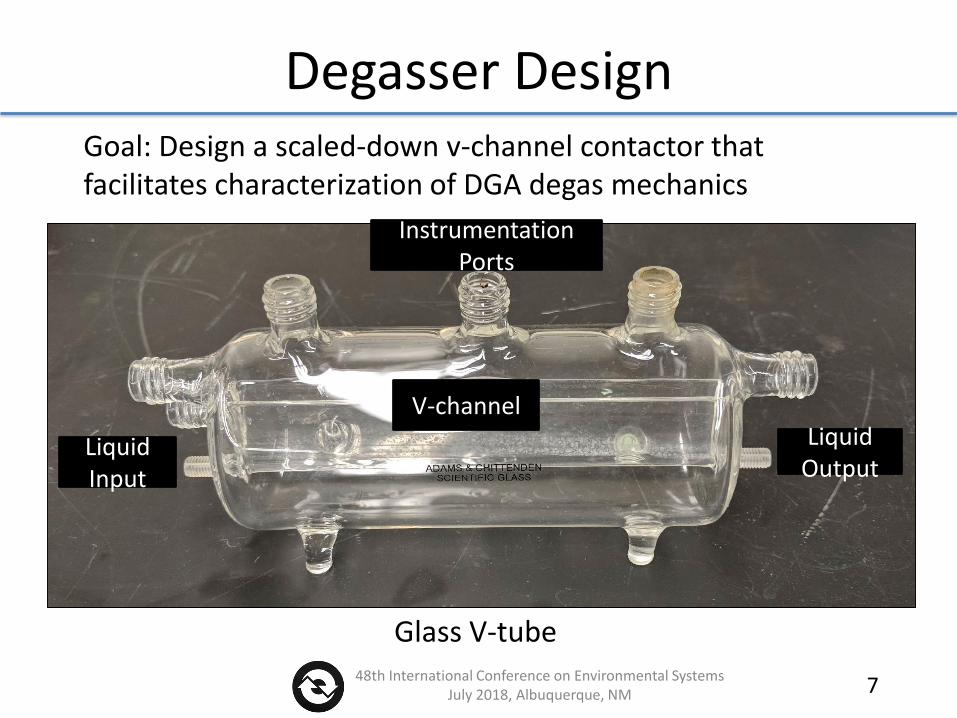
Degasser Design
Liquid Input
Liquid Output
V-channel
Instrumentation Ports
Glass V-tube
Goal: Design a scaled-down v-channel contactor that facilitates characterization of DGA degas mechanics
48th International Conference on Environmental Systems July 2018, Albuquerque, NM 8
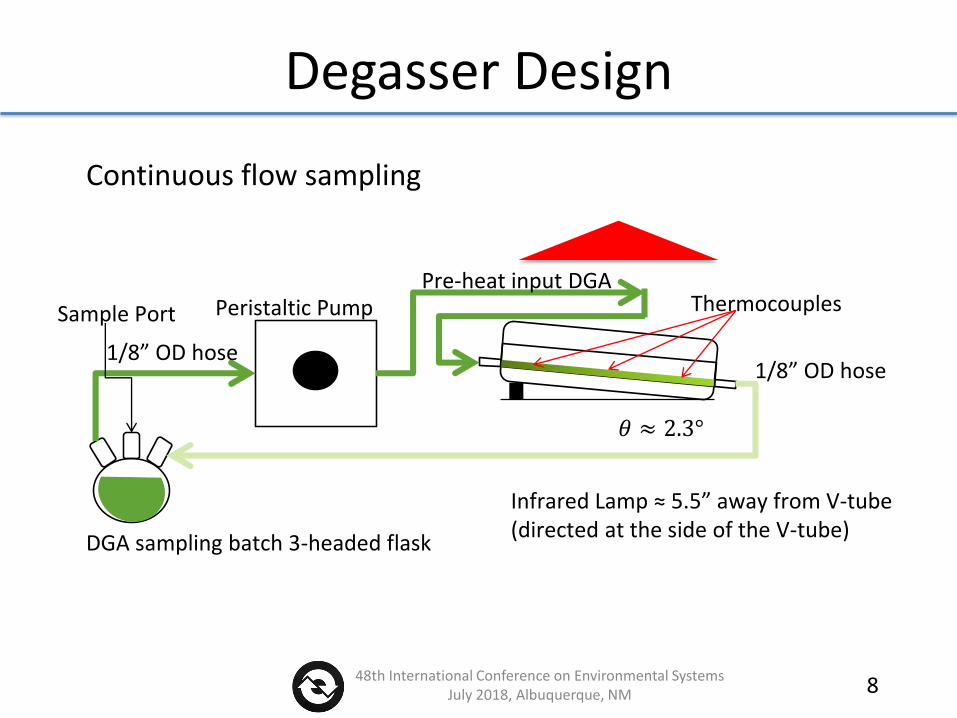
Degasser Design
𝜃 ≈ 2.3°
DGA sampling batch 3-headed flask
Sample Port
Infrared Lamp ≈ 5.5” away from V-tube(directed at the side of the V-tube)
Peristaltic Pump
1/8” OD hose1/8” OD hose
Pre-heat input DGAThermocouples
Continuous flow sampling
48th International Conference on Environmental Systems July 2018, Albuquerque, NM 9
FTIR Motivation
How do we measure CO2 loading in the DGA?• Solution pH level• Viscosity• Raman Spectroscopy• Fourier Transform Infrared Spectroscopy (FTIR)
• MEA CO2 loading (Einbu, Aslak, et al., 2012)• pH desorption method (Rogers, Tanya, et al., 2017)
• “Acid desorption” “Acid Test”• 96%-98% CO2 recovery (Zhou, Shan, et al., 2010)
pH desorption requires ~1mL of solutionFTIR can potentially only require ~100µL
48th International Conference on Environmental Systems July 2018, Albuquerque, NM 10
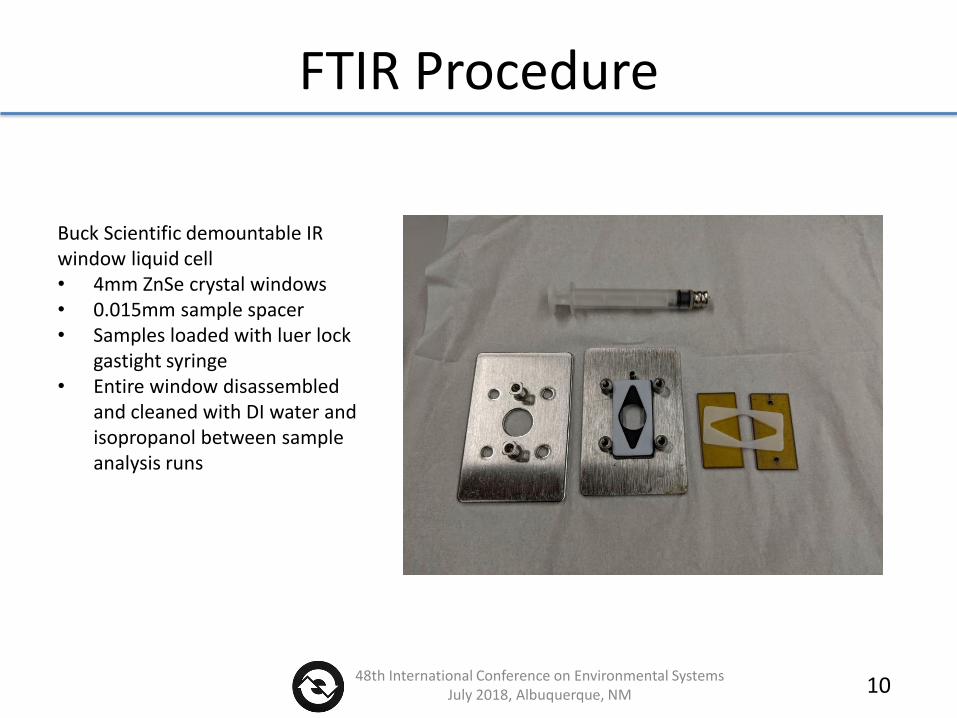
FTIR Procedure
Buck Scientific demountable IR window liquid cell• 4mm ZnSe crystal windows• 0.015mm sample spacer• Samples loaded with luer lock
gastight syringe• Entire window disassembled
and cleaned with DI water and isopropanol between sample analysis runs

48th International Conference on Environmental Systems July 2018, Albuquerque, NM 11
FTIR Procedure
Mattson Galaxy 6020 FTIR using WinFIRST v2.10• Transmittance collected at 10kHz• Wavenumbers 400 – 4000 cm-1
• Resolution = 4
Spectragryph V1.1.0• Baselines and pre-loaded calibration
standards• Experimental samples normalized on peak
at 894 cm-1
• Peak that remained consistent in all samples of DGA
48th International Conference on Environmental Systems July 2018, Albuquerque, NM 12
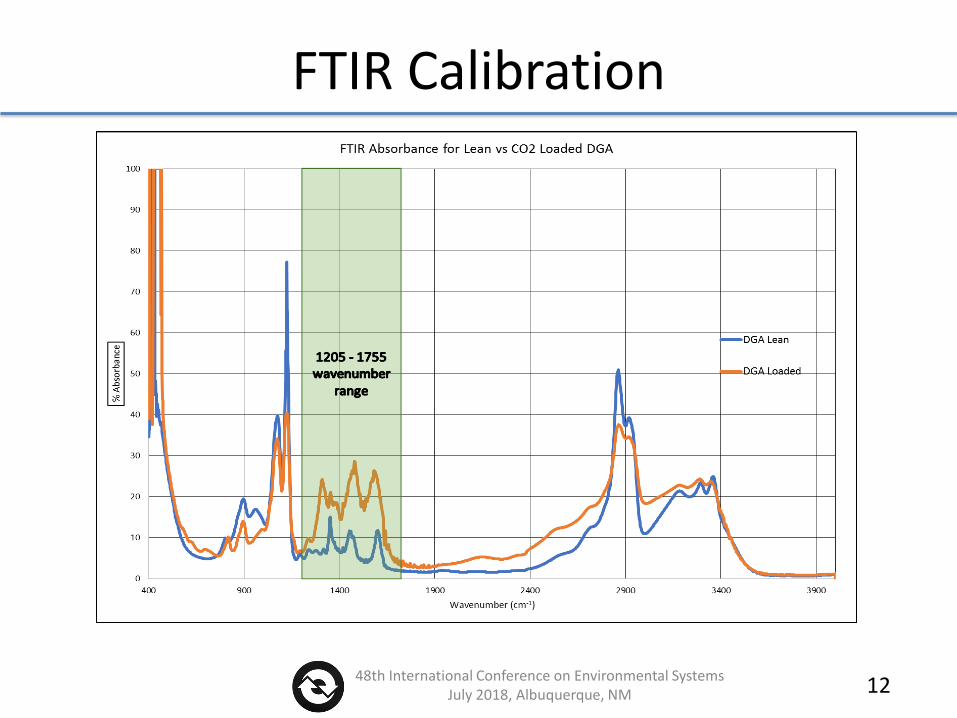
FTIR Calibration

48th International Conference on Environmental Systems July 2018, Albuquerque, NM 13
FTIR Calibration
Calibrate against pH desorption for range of CO2 % loading on DGA
0.0%
1.0%
2.0%
3.0%
4.0%
5.0%
6.0%
7.0%
8.0%
0 2 4 6 8 10 12 14 16
%C
O2
Exposure time to CO2 (minutes)
pH Desorption of Standards
Pure DGA
Aqueous DGA

48th International Conference on Environmental Systems July 2018, Albuquerque, NM 14
FTIR Calibration
Calibration points for DGA run at various concentrations of water solution (0%, 4%, and 8%)

48th International Conference on Environmental Systems July 2018, Albuquerque, NM 15
Results
Initial baseline – pure DGA, 85°C, ~0.4mL/min flowrate, continuous flow sampling, no sweep gas
48th International Conference on Environmental Systems July 2018, Albuquerque, NM 16
Results
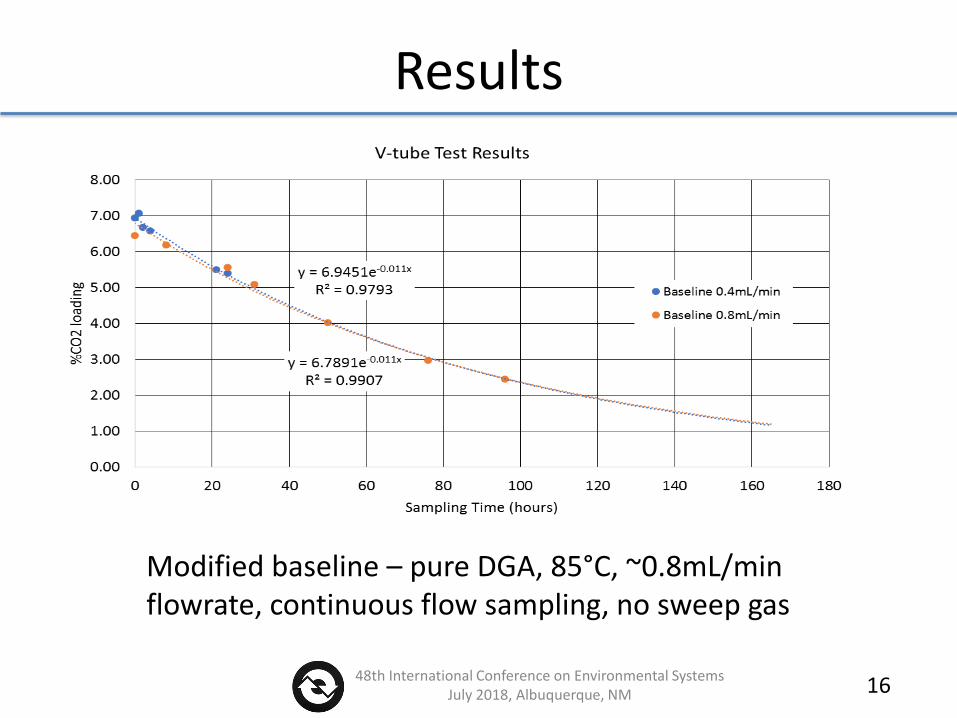
Modified baseline – pure DGA, 85°C, ~0.8mL/min flowrate, continuous flow sampling, no sweep gas

48th International Conference on Environmental Systems July 2018, Albuquerque, NM 17
Results
Discoloration of evaporated (and re-condensed) DGA

48th International Conference on Environmental Systems July 2018, Albuquerque, NM 18
Results
Experimental – pure DGA, 105°C, ~0.8mL/min, continuous flow sampling, no sweep gas
48th International Conference on Environmental Systems July 2018, Albuquerque, NM 19
Results
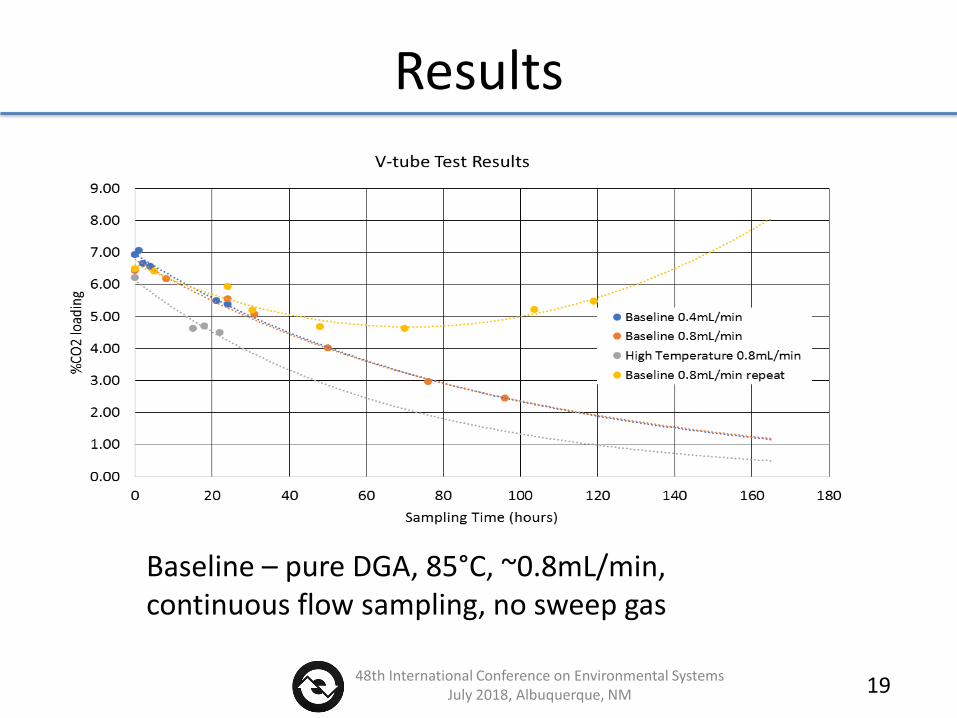
Baseline – pure DGA, 85°C, ~0.8mL/min, continuous flow sampling, no sweep gas

48th International Conference on Environmental Systems July 2018, Albuquerque, NM 20
Results
Experimental – pure DGA, 85°C, ~0.8mL/min, continuous flow sampling, 400mL/min N2 sweep gas
48th International Conference on Environmental Systems July 2018, Albuquerque, NM 21
Results
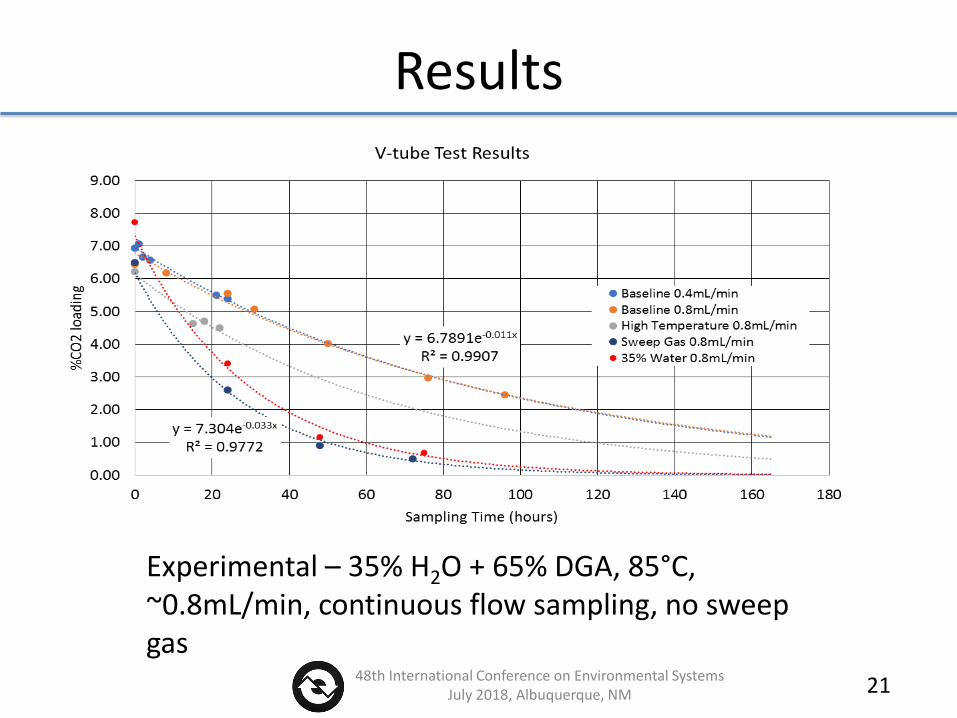
Experimental – 35% H2O + 65% DGA, 85°C, ~0.8mL/min, continuous flow sampling, no sweep gas
48th International Conference on Environmental Systems July 2018, Albuquerque, NM 22
Discussion and Current/Future Work
Moderate success using FTIR spectroscopy to analyze CO2 % loading on DGA• Repeatability• Reducing sampling volume
35% H2O + 65% DGA solution• Single pass flow• Scaling up• Bubbling• Re-capturing evaporated H2O and DGA

Acknowledgements
Many thanks to the team at JSC, especially Tanya Rogers and Giraldo Alvarez, who provided valuable insights and inputs throughout the experimental testing process.
48th International Conference on Environmental Systems July 2018, Albuquerque, NM 23

48th International Conference on Environmental Systems July 2018, Albuquerque, NM 24
Backup Slides
48th International Conference on Environmental Systems July 2018, Albuquerque, NM 25
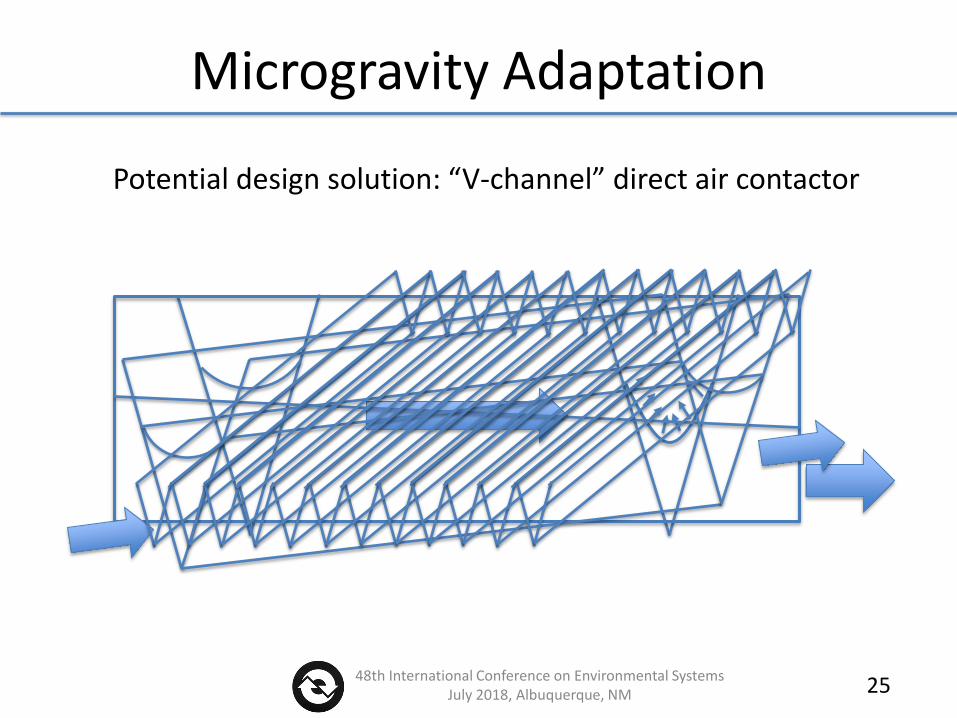
Microgravity Adaptation
Potential design solution: “V-channel” direct air contactor

48th International Conference on Environmental Systems July 2018, Albuquerque, NM 26
𝜃 ≈ 2.3°
DGA sampling batch 3-headed flask
Sample Port
Infrared Lamp ≈ 5.5” away from V-tube(directed at the side of the V-tube)
Peristaltic Pump
1/8” OD hose1/8” OD hose
Pre-heat input DGAThermocouples
Degasser Design
Single-pass flow sampling