efficacy of export-import bank o f india (exim...
TRANSCRIPT

EFFIC
A The
CACY O
esis submittof the
OF EXPO(E
ed to the Porequiremen
DOCTOR
C
V
Ph
Und
Dr. PR
RESE
DepartSchoPond
Pud
J
ORT-IMPEXIM Ba
Pondicherry nts for the a
R OF PH
IN
COMMERBy
V. Vijayaku
h.D. SCHO
der the Guid
P. NATARROFESSOR &EARCH SUP
tment of C
ool of Mandicherry Uducherry-6
JANUARY
PORT Bank)
University award of th
ILOSOP
RCE
umar
OLAR
dance of
RAJAN & Head
PERVISOR
Commerceagementniversity605014
2014
BANK O
in partial fhe degree of
HY
e
OF INDIA
fulfillment f
A

Dr. P. NProfess
Ba
Mr
Po
tha
an
an
can
Pla
Depart
NATARAJAsor & Head
This is to
ank of In
r. V. Vija
ndicherry
at the res
ny Degree
nd it rep
ndidate.
ace: Pond
Head tment of Co
N d
o certify
ndia (EX
ayakumar
y Universi
search wo
, Diploma
presents
dicherry
ommerce
CERthat the
XIM Bank
r, (Full Tim
ity, Pondi
rk has no
a, Associa
entirely
C
Schoo
RTIFICThesis e
k)” is ba
me Schol
cherry du
ot previou
ateship, F
an indep
Countersig
Del of Manag PonPuducherr
CATEentitled “E
ased on t
lar) in the
uring the y
usly forme
Fellowship
pendent w
gned
DSchool of
partment ogement, ndicherry Ury 605014
D
Efficacy
the origin
e Departm
year 2007-
ed the bas
p or any
work on
(Dr.Guide
Dean Managem
of Commer
University,
Date:
of Expor
nal work
ment of Co
- 08 to 2013
sis for the
other sim
the par
. P. Natare and Sup
ent
rce
rt-Import
done by
ommerce,
3 - 14, and
e award of
milar title
rt of the
rajan) pervisor
t
y
,
d
f
e
e

V. vijayPh. D. (F
Import
Pondic
degree
done b
Dr.P.N
any oth
Place: P
Date:
yakumar F. T.) Schola
I, Vijayak
t Bank o
cherry Uni
e of Doctor
by me dur
NATARAJA
her Degree
Pondicherry
ar in Comme
kumar. V,
of India (
iversity in
rate of Phi
ring 2007
AN and th
e, Diploma
y
rce
DECLA
hereby de
(EXIM Ba
partial ful
ilosophy in
- 08 to 20
he research
a, Associate
ACKN
School
ARATI
eclare that
ank)” sub
lfillment o
n Commer
013 - 14, u
h work hav
eship or an
NOWLED
of ManagePondicherrPuducherry
ION
the thesis
mitted to
of the requ
rce is a rec
under the
ve not form
ny other sim
V. Vijaya
GEMENT
ment, ry Universityy 605 014.
s entitled,
Departm
uirements f
cord of ori
supervisi
med the ba
milar titles
akumar
T
y,
“Efficacy
ment of C
for the aw
iginal rese
on and gu
asis for the
s.
of Export
Commerce,
ward of the
earch work
uidance of
e award of
t
,
e
k
f
f

First of all, I sincerely thank the ALMIGHTY for their blessings in
successful completion of this piece of research work.
I express my deep sense of gratitude and sincere heartfelt thanks to my
guide and research supervisor Dr. P. Natarajan, Professor & Head Department of
Commerce, school of Management, Pondicherry University. Without his guidance,
advice and supervision, support, cooperation and patience I would not have submitted
this research work. No words are there to explain my gratefulness and indebtedness to
my research supervisor. I am really blessed and very proud to have a research
supervisor like him.
I wish to thank the former Deans and the present Dean Prof.Dr.R.
Prabhakara Raya, School of Management, Pondicherry University, for providing me an
opportunity to pursue Ph.D. Degree course in Pondicherry University.
I extend my heartfelt gratitude to Dr. P.Palanisamy, Professor, Department
of Commerce, Pondicherry University and Dr. S. Sudalai Muthu, Associate Professor,
Department of banking technology, Pondicherry University for constantly observing
my research and for their valuable suggestions. I express my sincere thanks to Dr. K
Chandrashekara Rao, Professor & Head, Department of Banking Technology for his
valuable suggestions.
I express my sincere thanks to Dr. Malabika Deo, Dr. Daniel Lazar, Shri
S.Aravanan, Dr. G. Shanmugasundaram, Dr. S. Shijin, Dr. Velmurugan P.S and Shri.
K.B. Nideesh, Faculty members of Department of Commerce for their encouragement
during the period of course.
I am thankful to Dr. Thyagarajan, Assistant Professor, Department of
International Business and Mrs Thirupurasundari, Faculty, Department of Statistics
Pondicherry University, Puducherry, for their valuable suggestions in analysis point of
view.
I express gratitude to Dr. Chinta Vengteswara Rao, Mr. N. Azhguraja, Faculty,
Department of Commerce for their encouragement.
I would like to thank the Non - Teaching staffs of Pondicherry University
for having helped me in completing this research work. I am also grateful to office staff,
Mrs. Punitha and Mr. Ammaiappan, Department of Commerce for their assistance
during the course.
I feel pleasure in thanking my friends, co – scholars, senior and junior who
have supported me in various stages of completion of this dissertation work.
Several people who remain unnamed helped me at various stages of the
study and I owe my gratitude to them for their direct or indirect support and co-
operation in successful completion of this dissertation work.
(Vijayakumar .V)

Dedicated to my Beloved Parents
and Teachers
LIST OF TABLES
Table No. Name the of Tables Page
No.
Table-1.1
Table-1.2
Table-1.3
Table -1.4
Table – 4.1
Table – 4.2.1
Table - 4.2.2
Table - 4.3.1
Table - 4.3.2
Table – 4.4.1
Table - 4.4.2
Table - 4.5.1
Table – 4.5.2
Table - 4.6.1
Table – 4.6.2
Table - 4.7.1
Table – 4.7.2
Table - 4.8.1
Table – 4.8.2
Table - 4.9.1
Table – 4.9.2
Table - 4.10.1
Table – 4.10.2
Composition of exports by major markets
Commodity Composition of India’s Imports
India's Trade Share and Export-Import Ratio with Major Trading
Partners
Export Credit
Overall operational performance of Exim Bank
Region wise disbursement of Line of Credits
Paired samples statistics of financial assistance Lines of Credits
Assistance under Export Oriented Units Scheme
Paired samples statistics of financial assistance Export Oriented Units
Assistance under Production Equipment Finance Scheme
Paired samples statistics of assistance Under Production Equipment
Finance
Assistance under Overseas Investment Finance Scheme
Paired samples statistics of financial assistance Overseas Investment
Finance
Assistance under Working Capital Scheme
Paired samples statistics of financial assistance to Working Capital
Finance
Assistance under Technology Up Gradation Fund Scheme
Paired samples statistics of financial assistance To Technology Up
Gradation Fund
Assistance under import finance scheme
Paired samples statistics of financial assistance to Import Finance
Assistance under Bulk Import Scheme
Paired samples statistics of assistance under Bulk Import Finance
Assistance under Project Export Scheme
Paired samples statistics of financial assistance under Project Export
Finance
10
13
15
18
91
93
94
95
96
97
98
99
100
101
102
103
104
105
106
107
108
109
110
Table – 4.11
Table – 4.12
Table – 4.13
Table – 4.14
Table – 4.15
Table – 4.16
Table-5.1
Table-5.2
Table- 5.3
Table- 5.4
Table- 5.6
Table -5.5
Table -5.7
Table-5.8
Table-5.9
Table-5.10
Table-5.11
Table-5.12
Table- 6.1
Table- 6.2.1
Table- 6.2.2
Table- 6.3.1
Table- 6.3.2
Table- 6.4.1
Table- 6.4.2
Table- 6.5.1
Descriptive statistics for the first decade & Analysis of Variance
Descriptive statistics for the second decade& Analysis of Variance
Descriptive statistics for various schemes & Analysis of Variance
Descriptive statistics for various schemes & Analysis of Variance
Descriptive statistics for the reform period (1992-93 to 2011-12) &
Analysis of Variance
Descriptive statistics for various schemes of assistance & Analysis of
Variance
Current Ratio
Debt - Equity Ratio
Fixed Asset Ratio
Proprietary Ratio
PBT to Capital Ratio
Capital to Asset Ratio
PBT to Net worth Ratio
Return on Capital Employed
Interest spread of Exim Bank of India
Activity Ratios of Exim Bank of India
Overall Camel Ratings of Exim Bank of India
Altman’s Multiple Discriminate Analysis of Exim Bank
Macroeconomic variables
Correlation between exim bank’s scheme-wise assistance and GDP
Regression coefficient between exim bank’s scheme-wise assistance and
GDP
Correlation between exim bank’s scheme-wise assistance and export
Regression coefficient between exim bank’s scheme-wise assistance
and Export
Correlation between Exim bank’s scheme-wise assistance and import
Regression coefficient between Exim bank’s scheme-wise assistance
and Import
Correlation between Exim bank’s scheme-wise assistance and Balance
of Payments
112
114
115
117
118
120
125
126
128
129
130
131
133
134
136
138
143
145
149
150
151
153
154
155
156
157

Table- 6.5.2
Table- 6.6.1
Table: 6.6.2
Table: 6.7.1
Table: 6.7.2
Regression coefficient Exim bank’s scheme – wise assistance and
Balance of Payments
Correlation between Exim bank’s scheme - wise assistance and Balance
of Trade
Regression coefficient Exim bank’s scheme – wise assistance and
Balance of Trade
Correlation between Exim bank’s scheme-wise assistance and total
credit exposure
Regression coefficient Exim bank’s scheme – wise assistance and total
credit exposure
158
159
160
161
162

CONTENTS
CHAPTER – I
CHAPTER II
CHAPTER III
CHAPTER IV
CHAPTER V
CHAPTER VI
CHAPTER VII
Certificate Declaration Acknowledgement List of tables Contents
INTRODUCTION AND DESIGN OF THE STUDY
REVIEW OF LITERATURE
PROFILE OF EXPORT – IMPORT BANK OF INDIA
(EXIM BANK)
OPERATING EFFICACYOF EXIM BANK OF INDIA
- AN EVALUATION
FINANCIAL EFFICACY OF EXIM BANK OF INDIA
– AN ANALYSIS
EXIM BANK AND ECONOMIC GROWTH
SUMMARY OF FINDINGS, SUGGESTION AND
CONCLUSIONS
BIBILOGRAPHY
Page No.
1-28
29-52
53-88
89-122
123-146
147-162
163-173
174-178

CHAPTER – I
INTRODUCTION AND DESIGN OF THE STUDY
1.1 INTRODUCTION
1.2 EXPORT AS AN ENGINE OF GROWTH
1.3 IMPACT OF EXPORTS IN THE DEVELOPMENT PROCESS
1.4 INTERNATIONAL COOPERATION IN TRADE FINANCE
1.5 EXPORT PERFORMANCE OF INDIA AND EDES
1.6 TRADE COMPOSITION
1.7 TRADE CREDIT
1.8 TRADE POLICY
1.9 INSTITUTIONAL SUPPORT FOR EXPORT PROMOTION
1.10 SIGNIFICANCE OF THE STUDY
1.11 SCOPE OF THE STUDY
1.12 STATEMENT OF THE PROBLEM
1.13 OBJECTIVES OF THE STUDY
1.14 HYPOTHESIS OF THE STUDY
1.15 METHODOLOGY OF THE STUDY
1.16 LIMITATION OF THE STUDY
1.17 REPORT FORMAT

1
CHAPTER – I
INTRODUCTION AND RESEARCH DESIGN
1.1 INTRODUCTION
Foreign trade has been conducted ever since national borders were formed and has
played a major role in shaping the world economy. Foreign trade consists of transactions that
are devised and carried out across national borders to satisfy the objectives of individuals and
organizations. In its many forms Foreign trade ranges from export-import trade to licensing,
joint ventures, wholly owned subsidiaries, Turnkey operation and management contracts.
World trade and investment have assumed a here to fore unknown importance to the
global community. Foreign trade is vital to economic growth because it expands a nation’s
consumption possibilities1. By specializing in its area of greatest relative productivity, each
nation can consume more than it could produce alone. This is simple yet elusive essence of
foreign trade2.
Foreign trade is important and necessary because economic isolationism has become
impossible. Failure to become a part of global market answers a nation of declining
economic influence and a deteriorating standard3. Since 1950s, growth of international trade
and investment has been substantially larger than the growth of domestic economies. In the
past centuries trade was conducted internationally, but not at the level or with the impact on
nations, firms and individuals that it has recently achieved. In the past thirty years, the
volume of international trade has expanded from US $ 200 billion to more than US$ 8
trillion. Countries that have never been thought of major participants have emerged as major
1 Rubener,alex,the export Cult, A Global Disply of economic Distortion, pp.28-39,1987. 2 Ohmae, Kenichi Triad Power: The Coming Shape of Global Competition, New York, the Free Press, 1985, p.9 3 Czinkota, Ronkainen , Moffett, International Business, the Dryden Press, Third editon,1994, p.3.
2
economic powers. Thus, both as an opportunity and a challenge, foreign trade is important to
countries, companies and individuals.
Akamatsu’s “Wild Geese” theory of economic development, which was propounded
in the early 1960s, to a large extent, explains the growth experience of Japan, South Korea
and other far East Asian miracle economies and basic evolution of economies4.The theory in
brief divides economic development into three phases, Stage one is defined as the period in
which domestic production equals domestic consumption. Over time domestic cost tend to
decline through economies of scale as well as import of technology within the frame work of
a protected market. Stage two is marked by a commencement of exports with the domestic
cost structure reaching international levels. Thus, domestic production becomes larger than
domestic consumption. Stage three envisages a slow factor of production like labour as well
as the operation of the ‘catching up cycles’ in other developing countries. India is rapidly
entering stage two of Akamastu’s theory.
1.2 EXPORT AS AN ENGINE OF GROWTH
Countries have achieved rapid economic development through export led growth
strategy. Export growth not only contributes directly to economic growth, but also permits
more imports, and a rapid modernization of production.
The result is efficient domestic industry that meets the market test of international
competition. According to World Development Report, 1989:
“Global development experience of the past few decades shows that a policy regime
with fewer barriers to trade, both tariff and non-tariff and which provides equal incentives for
exports as well as production for the domestic market enables countries to achive not only
impressive export growth but also rapid and sustainable economic growth”. 4 Bhatt, Vinay Ram, ‘Wild Geese Chase’, The Times of India, March 10,2003, p.16.
3
The fact that high growth rates can be achieved via export route has been brought out
by the experiences of great many countries across the world. The experiences of Japan and
South Korea provide interesting examples.
1.3 IMPACT OF EXPORTS IN THE DEVELOPMENT PROCESS
Export led growth is an appealing strategy for developing nations. In the early stages
of development, a country needs to import real capital (machines), which often entails
borrowing in a foreign currency. Export allows borrowing of nation to earn the foreign
currency required to service its external debt. This strategy is often successful – the U.S.A is
perhaps the best example that followed such a strategy in its early stages of development—at
least over the short run.5
It is important for policy-makers to improve “Export Competitiveness” while
promoting development. While export competitiveness starts with increasing international
market shares, it goes far beyond that it involves diversifying the export basket, sustaining
higher rates of export growth over time, up grading the technological and skill content of
export activity, and expanding the base of domestic firms able to complete internationally so
that competitiveness becomes sustainable and is accompanied by rising incomes.
Competitive exports allow countries to earn more foreign exchange and so to import the
products, services and technologies they need to raise productivity and living standards.
Greater competitiveness also allows countries to diversify away from dependence on a few
primary commodity exports and move up the skills and technology ladder, which is essential
for increasing local value added and sustaining rising wages. It permits a greater realization
of economies of scale and scope by offering larger and more diverse markets. Exporting
5 Wray, Randall L., “Export led growth Prospects”, charted financial analyst, Dec 2001, pp.14-16.

4
feedback into the capacities; it exposes enterprises to higher standards, provides them to
greater competitive pressures, thereby encouraging domestic enterprises to make more
vigorous efforts to acquire new skills and capabilities.
However, these developmental impacts from improved export competitiveness cannot
be taken for granted. For same product at the same time, most of them may well become
worse off. Similarity, in the absence of adequate national capabilities and increase in local
value added and expansion in market shares may not produce the expected benefits. Export
competitiveness is important and challenging, but it needs to be seen as a means to an end—
namely development6.
The above discussion focuses on the broader outlook of the overall impact of exports
in development process. To have specific outlook, it would be note worthy to mention the
benefits and risk associated with exporting.
1.1.1 EXPORT BENEFITS
The export benefits may vary by company and product or service. They are:
• There is potential for greatly increased company turnover.
• Economies of scale are achieved
• Potential levels of profitability are much increased.
• The product or service offered is more competitive and reflects
overseas market needs and conforms to a wider legal environment.
• Companies became much more integrated with market they serve and
this encourages higher standards and the use of more high technology.
6 Ricupero, rubens : Transnational Corporations and Export Competitiveness, an overview, (World Investment Report,2002, UNCTAD) Foreign Trade Review, Vol.37, No. 3 and 4, Oct,2002 – Mar,2003,pp3-4,23.
5
• Diversification of risk, company risk and business risk are not
confined to one market.
• The company becomes more competitive in all areas of the business.
1.1.2 EXPORT RISK
• Repatriation of profits from the target country may be constrained or
forbidden
• Fluctuation in exchange rate may decrease or eliminate profits, or even
in losses.
• The export market evolves a longer time scale of payment. This may
be 90 or 180 days or even some years.
• Product launch in an overseas market is more costly and complex in
comparison with a domestic launch.
• Trade barriers are politically and economically manipulated.
• Economic and political risk is much more.
• Instability in the target market/country can lead to losses from war or
civil strife or nationalization by the foreign government.
• In case of non-payment and other contractual problems, there may be
questions of jurisdiction, i.e. Indian courts may not be able to enforce
contracts between parties in different countries.

6
1.3 INTERNATIONAL COOPERATION IN TRADE FINANCE
The global financial crisis, which has resulted in slowdown in economic growth, has
also impaired the access to trade finance. As a result cost of finance had increased by over 3-
4% in international markets, last year, even for exporters considered to be good. Many
Governments have quickly sought to mitigate the potential impact of the crisis on their
domestic economy and export sector, through various measures, albeit in varying degrees and
forms. The main actions taken by Governments can be grouped in two categories:
(i) to increase banks’ liquidity to alleviate liquidity pressure including for trade
finance;
(ii) to enhance the long-term competitiveness of the country’s exports by developing
and expanding export promotion programs.
The commitment of G-20 leaders calling for collective fight against protectionism, and the
action by Multilateral Agencies to counter the shortage in trade finance indicates the need for
international cooperation in trade finance.
Export Credit Agencies (ECAs), particularly in developing countries, have assumed
greater role to channel trade finance to firms. In some countries, Government has channeled
the trade credit enhancement measures through the ECAs. Exchange of information and
institutional cooperation are the two important strategies for enhancing trade finance and
trade amongst the trading partners. During the recently concluded BRIC Summit, Exim Bank
of India entered into a Memorandum of Cooperation with three major development banks of
Brazil, Russia and China. One of the objectives of the Memorandum is to develop
comprehensive long-term cooperation among the signatories to facilitate and support cross-
border transactions and projects of common interest. Such institutional cooperation is

7
pertinent in enhancing trade finance. Earlier, Exim Bank of India mooted the idea of forming
the Asian Exim Banks Forum, in 1996, in order to forge a stronger link among the member
institutions. The forum facilitated signing of bilateral L/C confirmation facility among the
members. The forum is also exploring the possibility of setting up a regional ECA with the
support of multilateral funding institution like ADB. Extending the similar concept at global
level, Bank took the initiative of setting up a Global Network of Exim Banks and
Development Finance Institutions (G-NEXID), under the auspices of UNCTAD, with the
objective of supporting rapidly increasing trade between developing countries with expanded
financial services that can spur and stabilize economic growth. Such cooperation is expected
to reduce the costs of trade for the developing countries, spurring investment across borders
and making financing more readily available to new and innovative businesses and enabling
the growth of “niche markets.”
Multilateral / regional development finance institutions should play a pivotal role in
rebuilding confidence amongst member governments, banks and financial institutions in the
region, through provision of well targeted credit enhancements, policy support, and capacity
building initiatives. These may include technical assistance / advice on trade finance policy,
loans for creation of finance-related infrastructure, and support in creation and strengthening
of institutions that support trade finance transactions. The institutions from developed
countries should also extend credit lines to Governments / institutions in developing
countries with the objective of enhancing trade financing. Rules-setting organizations, like
WTO, may have to provide necessary comfort to banks and financing institutions (that are
providing finance and guarantees), especially from developing countries, and set flexible
policies for developing countries that encourages concessional trade financing; it may be
8
appreciated that the priority task would be to enhance the capacity in developing countries to
mitigate the effects of increased perception of risks and to provide the market with earmarked
liquidity for trade finance. It is also necessary to persuade the Bank for International
Settlements (BIS) to build suitable models and treat trade finance differently under Basel - II.
Greater level of institutional cooperation among the developing countries is required for
closely monitoring payment delays and sharing of information on credit risks.
Such international cooperation would be collectively beneficial to enhance trade
finance and thereby contribute to the growth in trade and economic development.
1.4 EXPORT PERFORMANCE OF INDIA AND EDES
The share of the select Emerging and Developing Economies (EDEs) in the US$ 18
trillion world exports in 2011 has increased to a sizeable 41% with a change in share of
15.6% over 2000. If the four newly Industrialized Asian Economies namely, Singapore,
Hong Kong, Taiwan and Republic of Korea, which have now been classified under advanced
economies by the IMF, are also included and the share would be 50.5%. The performance of
China is spectacular with its share in world exports increasing by 6.6% points between 2000
and 2011, comprising 42.4% of the total increase in EDEs share over this period, while
India's rise in share of 1% point constitutes only 6.5% of the total increase. However, China's
export growth rate at 20.3% in 2011 was substantially lower than that of India. India's export
growth rate of 33.8 % in 2011 over and above the 37.3% growth of 2010 is one of the highest
in the world.
India's share in world merchandise exports which started rising fast from 2004,
reached 1.5 percent in 2010 and 1.7 % in 2011. It declined marginally to 1.6% in 2012
9
(January-October), mainly due to its relatively negative export growth of - 5.1% compared to
world export growth of - 0.2 % (Table 7.3). In contrast China's share increased to 11.2% in
2012 (January -October) with a positive export growth of 7.9%.
Latest monthly growth rates of exports and imports of some of India's major trading
partners have been low or negative. The EU's import growth has been negative for most of
the months in 2012. There has been a slight but unsteady pick-up in import growth in the last
two or three months in countries like the US, Hong Kong, and Singapore and in December
2012 in China.
1.5 Trade Composition
1.5.1 Export composition
Compositional changes in India's export basket have been taking place over the years.
While the share of primary products in India's exports fell over the years from 16 % in 2000-
1, in 2012- 13 (April-November) it regained the share of 16 % mainly because of the export
of agricultural items like rice and guar gum meal. The share of manufacturing exports fell
drastically from 78.8% in 2000-1 to 66.1% in 2011-12 and further to 64.5% in 2012-
13(April-November) mainly because of the fall in shares of traditional items like textiles and
leather and leather manufactures even though the share of engineering goods and chemicals
and related products increased. Share of gems and jewellery fell marginally. Share of
petroleum, crude & products exports, which also include refined items, increased from 4.3%
in 2000-1 to 18.3% in 2011-12 and 18.6% in 2012-13(April- November).
The destination-wise exports of major items to the major trading partners from 2009-
10 to 2012-13 (April-November) show great changes in the composition of exports to USA
and China (Table 1.1). In the case of India's exports to the USA, the share of exports of

10
primary products has increased from 6.8% in 2009-10 to 21.3% in 2012-13 (April-
November), mainly because of the rise in share of agriculture and allied products, while the
share of manufactured goods in India's exports to the USA has fallen from 89.1% to 74.2%
during the same period.
Table 1.1: Composition of exports by major markets Percentage share Growth rate*
2000- 2009- 2010- 2011- 2011- 01 10 11 12 12
2012- 13
2009- 10
2010- 2011- 2011- 11 12 12
2012- 13
(Apr.- Nov.)
(Apr.-Nov.)
(Apr.-Nov.) (Apr.-Nov.)
I Primary products World 16.0 14.9 13.2 15.2 13.3 16.0 3.8 23.9 39.8 37.2 11.2 USA 9.4 6.8 8.0 14.5 11.9 21.3 -13.5 52.8 149.
5 123.
7 101.6
EU 13.1 8.6 8.2 9.7 9.0 9.9 -5.7 22.2 33.8 38.3 -2.0 China 45.2 65.7 51.6 55.2 49.5 38.4 26.9 4.7 24.8 7.0 -42.1 others 18.9 13.1 11.7 13.1 11.7 14.9 -1.7 31.7 35.7 41.9 17.5 (a) Agri. & allied products World 14.0 10.0 9.7 12.4 10.7 14.0 1.1 36.1 53.9 60.8 21.1 USA 9.0 5.8 7.1 13.7 11.0 20.4 -12.1 58.7 165.
7 139.
3 107.3
EU 11.9 7.1 7.1 8.1 7.6 8.7 -6.4 27.7 30.4 37.9 1.3 China 18.9 14.8 16.8 26.5 20.4 17.8 122.8 50.6 84.2 79.1 -35.0 others 16.8 11.3 10.2 12.0 10.7 13.8 -3.3 33.8 41.9 54.2 18.9 (b) Ores and minerals World 2.0 4.9 3.4 2.8 2.6 2.0 9.9 -1.3 -0.4
-14.3 -29.6
USA 0.4 1.0 0.9 0.8 0.9 1.0 -21.1 18.5 24.4 22.0 29.2 EU 1.3 1.5 1.2 1.6 1.4 1.2 -2.5 -3.5 54.6 40.7 -20.4 China 26.3 50.9 34.8 28.7 29.1 20.6 12.8 -8.7 -3.7 -
16.6 -47.2
others 2.2 1.8 1.5 1.1 1.0 1.1 9.6 18.6 -7.4 -23.7
1.9
II Manufactured goods World 78.8 67.2 69.0 66.1 66.9 64.5 -5.9 44.2 16.2 27.7 -10.4 USA 90.6 89.1 87.4 81.4 83.3 74.2 -8.7 27.0 27.9 35.2 -0.2 EU 86.8 73.2 72.1 74.9 73.9 72.6 -15.4 25.8 18.6 34.4 -12.8 China 54.6 32.2 42.4 39.2 42.3 58.0 29.5 75.4 7.8 4.3 2.3 others 71.4 65.1 67.8 63.5 64.4 60.8 -2.5 53.4 13.6 25.7 -12.6 (a) Textiles incl. RMG World 23.6 10.5 9.1 8.7 8.6 8.7 -1.2 21.3 16.9 29.1 -6.4 USA 27.2 18.4 17.1 14.1 13.7 12.0 -7.6 20.2 13.0 19.2 -1.7 EU 29.2 18.5 16.3 16.3 15.7 14.4 -6.7 12.1 14.6 36.6 -18.7 China 9.3 1.8 2.8 4.1 3.7 8.6 47.0 104.
2 68.5 51.4 73.6
others 20.2 7.4 6.4 6.2 6.3 6.5 6.2 27.1 17.9 27.3 -4.0 (b) Gems & jewellery World 16.6 16.2 16.1 14.7 14.9 15.4 3.7 39.6 10.8 38.6 -4.0 USA 29.3 24.2 20.8 19.5 22.3 18.0 2.8 11.7 28.5 52.7 -9.4 EU 11.5 6.7 6.8 9.2 9.2 7.1 -26.2 31.4 52.9 90.8 -31.5

11
This decline has been mainly because of the fall in growth rates of exports of textiles and
gems and jewellery.
China 0.0 3.8 0.5 0.7 0.7 0.7 -41.4 -81.0
42.8 25.0 -25.5
others 14.4 19.2 19.5 16.6 16.4 18.0 10.7 49.1 3.6 30.5 1.5 (c) Engineering goods World 15.7 18.2 19.8 19.2 19.2 19.3 -18.7 53.0 17.3 15.8 -6.4 USA 13.4 17.1 20.2 19.8 20.5 17.1 -33.9 53.0 34.5 37.9 -6.6 EU 14.0 20.8 20.9 21.0 20.8 21.5 -25.1 28.6 14.6 26.3 -8.4 China 9.9 12.4 25.8 18.8 20.7 24.4 63.6 177.
9 -
14.8 -
21.3 -11.9
others 17.5 18.2 18.9 18.6 18.4 18.9 -15.8 53.2 19.3 14.6 -5.2 (d) Chemicals & related products World 10.4 12.8 11.5 12.2 11.8 13.7 0.9 26.0 28.6 35.4 7.4 USA 5.7 17.2 17.7 16.9 15.9 17.2 7.4 33.2 30.9 28.9 21.1 EU 9.7 12.5 12.8 14.1 13.6 15.1 -11.8 30.9 25.6 36.6 -1.2 China 15.5 10.2 9.4 11.1 12.1 15.5 40.8 23.3 37.7 48.5 -4.5 others 12.4 12.4 10.4 10.9 10.6 12.4 1.7 22.9 28.2 35.6 8.0 (e) Leather & leather Mnfrs World 4.4 1.9 1.6 1.6 1.6 1.7 -5.5 16.3 22.6 36.0 -2.8 USA 3.7 1.5 1.4 1.3 1.3 1.4 -17.8 17.4 26.6 29.3 20.8 EU 11.4 6.3 5.5 5.8 5.9 5.8 -2.1 12.6 20.2 39.7 -12.5 China 1.1 0.4 0.5 0.7 0.7 1.1 -2.2 55.5 65.2 74.3 12.9 others 1.6 0.7 0.6 0.6 0.6 0.7 -9.9 24.8 24.2 26.4 12.8 (f) Handicrafts including carpet handmade World 2.8 0.5 0.5 0.4 0.4 0.4 -10.6 35.7
-12.9 -6.7 7.4
USA 6.0 1.5 1.6 1.2 1.2 1.3 -14.6 40.4 2.4 14.6 16.5 EU 4.4 1.1 1.0 0.7 0.7 0.8 -7.5 8.4 -
12.1 -3.8 -2.9
China 0.3 0.1 0.0 0.1 0.1 0.1 106.9 -40.9
40.1 16.3 -2.4
others 0.8 0.2 0.3 0.2 0.2 0.2 -13.1 80.1 -29.2
-27.9
8.5
III Petroleum, crude & products World 4.3 15.8 16.5 18.3 18.7 18.6 2.3 47.1 34.0 54.3 -7.3 USA 0.0 2.3 3.7 3.5 4.5 3.7 180.3 110.
9 30.1 139.
9 -8.0
EU 0.0 16.9 18.8 15.0 16.5 17.0 45.4 42.7 -9.4 19.2 -8.7 China 0.0 0.8 5.3 6.3 8.6 3.2 -8.4 745.
2 38.1 608.
2 -72.2
others 8.1 19.9 19.4 23.5 23.3 23.5 -3.9 43.6 47.0 59.4 -6.5 Total exports World 100.0 100.0 100.0 100.0 100.0 100.0 -3.5 40.5 21.3 32.7 -7.0 USA 100.0 100.0 100.0 100.0 100.0 100.0 -7.6 29.5 37.4 43.9 12.2 EU 100.0 100.0 100.0 100.0 100.0 100.0 -8.4 27.9 14.1 31.4 -11.2 China 100.0 100.0 100.0 100.0 100.0 100.0 24.2 33.3 16.8 12.4 -25.4 others 100.0 100.0 100.0 100.0 100.0 100.0 -3.4 47.2 21.3 33.3 -7.6 Source: Economic Survey 2012 -13. * Growth rate in US dollar terms. Notes: 1. RMG stands for ready-made garments. 2. Share in a particular item means share of each country in total exports of India to that country. 3. Totals may not add up mainly due to some unclassified items.

12
In the case of India's exports to China, the share of primary products has fallen from
65.7% in 2009-10 to 38.4% in 2012-13 (April-November) because of the fall in share and
growth rate of ores & minerals. The share of manufactures in India's exports to China has
increased from 32.2% to 58.0% during this period, mainly because of the rise in share of
engineering goods, textiles, and chemicals and related products. In the case of India's exports
to the EU, there has been a marginal rise in the share of primary products and petroleum
products and a fall in the share of manufactured goods.
The reason for India's export growth in 2012- 13 (April-November), being more
negative than in 2009-10 is the aftermath of the global recession and it can be seen from
India's commodity-country export performance. India's exports to EU and China have been
more negative during the recent global slowdown than in 2009-10, while its performance to
USA has been better for most of the sectors except gems and jewellery. The performance of
India's exports to EU of textiles and readymade garments, gems and jewellery and ores: and
to China of manufactures, engineering goods, chemicals gems and jewellery and ores was
worse off in 2012-13(April-November) compared to 2009-10. India's POL export growth to
all major markets also decelerated in 2012-13 (April- November) compared to 2009-10.
Thus, the Euro Zone crisis and the Chinese slowdown have affected India's exports more
during the recent slowdown than in 2009-10.
1.5.2 Export diversification
In 2011, India had a global export share of 1% or more in 53 out of a total of 99
commodities at the two-digit harmonized system (HS) level. While noticeable changes can
be seen in India's market diversification, the same is not the case with its export basket
diversification.

13
1.5.3 Import composition
There have been some significant compositional changes in India's import basket in recent
years. The share of POL imports increased from 28.7% in 2010-11 to 31.7% in 2011-12
(with a very high growth rate) and 34.6% in 2012-13 (April-November).
Table 1.2 : Commodity Composition of India’s Imports
Percentage share CAGR Growth rate*
Commodity Group 2000- 2010- 2011- 2011- 2012- 2000-01 to
2009-10
2010- 2011- 2011- 2012- 01 11 12 12 13 11 12 12 13 (Apr.-Nov.)
(Apr. -Nov.)
I. Food and allied products, 3.3 2.9 3.1 3.1 3.5 22.7 2.2 44.4 38.0 11.6 of which
1. Cereals 0.0 0.0 0.0 0.0 0.0 24.3 15.8 -34.2
-46.6 6.8
2. Pulses 0.2 0.4 0.4 0.4 0.4 38.3 -23.1 27.2 11.3 9.2 3. Edible oils 2.6 1.8 2.1 2.1 2.5 17.2 19.0 57.7 55.3 18.0 II. Fuel, of which 33.5 30.9 37.4 34.3 38.0 21.0 22.4 59.7 52.3 9.8 4. POL 31.3 28.7 31.7 30.7 34.6 21.0 21.6 46.2 50.6 11.7 III. Fertilizers 1.3 1.9 2.4 2.3 2.2 29.0 4.8 72.1 32.2 -6.8 IV. Capital goods, of which 10.5 13.6 14.1 12.6 11.9 26.1 19.2 36.9 25.6 -6.5
5. Machinery except electrical 5.9 7.0 7.2 6.7 6.3 24.4 24.0 35.8 28.2 -5.8
& machine tool 6. Electrical machinery 1.0 1.0 1.0 1.0 0.9 22.7 25.1 33.1 26.6 -5.5 7. Transport equipment
1.4 3.1 3.0 2.5 2.3 36.4 -0.9 31.8 13.1 -8.3
V. Others, of which 52.5 49.6 49.0 47.6 44.3 19.3 43.2 30.8 29.6 -7.6 8. Chemicals 5.9 5.2 5.1 5.0 5.1 19.5 29.6 31.8 24.3 1.1 9. Pearls, precious, semi- 9.7 9.3 6.1 6.1 4.1 14.0 116.9 -
13.3 4.3 -32.3
precious stones
10. Gold & silver 9.3 11.5 12.6 13.0 10.5 23.0 43.0 44.5 59.2 -20.4
11.Electronic goods 7.0 7.1 7.1 7.0 6.5 21.6 28.4 31.7 22.2 -7.7
Total imports 100.0 100.0 100.0 100.0 100.0 21.5 28.2 32.3 36.2 -0.8 Source: Economic Survey 2012 -13.
* Growth rate in US dollar terms
The share of gold and silver imports increased from 9.3% in 2000-1 to 12.6% in
2011-12 with a high import growth rate of 44.5%. However, in part because of policy
14
measures like raising import duty on gold, there was a moderation in gold and silver imports
in 2012-13 (April-November) with its share falling to 10.5% following a negative growth of -
20.4%. The import share of pearls, precious and semiprecious stones also fell sharply in
2011-12 to 6.1% following a negative growth of -13.3% and further to 4.1% in 2012-13
(April- November), with a high negative growth rate of - 32.3%. Another important
development is related to the share of capital goods imports which raised from 10.5% in
2000-1 to 13.6 % in 2010- 11 and further to 14.1% in 2011-12, declining thereafter to 11.9%
in 2012-13 (April-November) following a negative growth rate of - 6.5%. Among capital
goods, the import shares of all items machinery except electrical and machine tools, transport
equipment, project goods, and electrical machinery fell, clearly signaling a slowdown in
industrial activity. The share of electronic goods, which includes both consumer electronics
and capital goods, also fell in 2012-13 (April-November) (Table 1.2).
1.5.4 Direction of Trade
There has been noteworthy market diversification in India's trade. Region-wise, while
India's exports to Europe and America have declined, its exports to Asia and Africa have
raised. However, in 2012-13 (April- November), the share of India's exports to the USA
raised to 13.5%. Within Asia, while the share of North East Asia (consisting of China, Hong
Kong, Japan) and ASEAN (Association of South East Asian Nations) fell from 14.8% and
12.0% in 2011-12 to 13.1% and 10.3% respectively in 2012-13 (April- November), there was
a noticeable rise in the share of West Asia-GCC (Gulf Cooperation Council) countries from
14.9% in 2011-12 to 17.7% in 2012-13 (April- November).
15
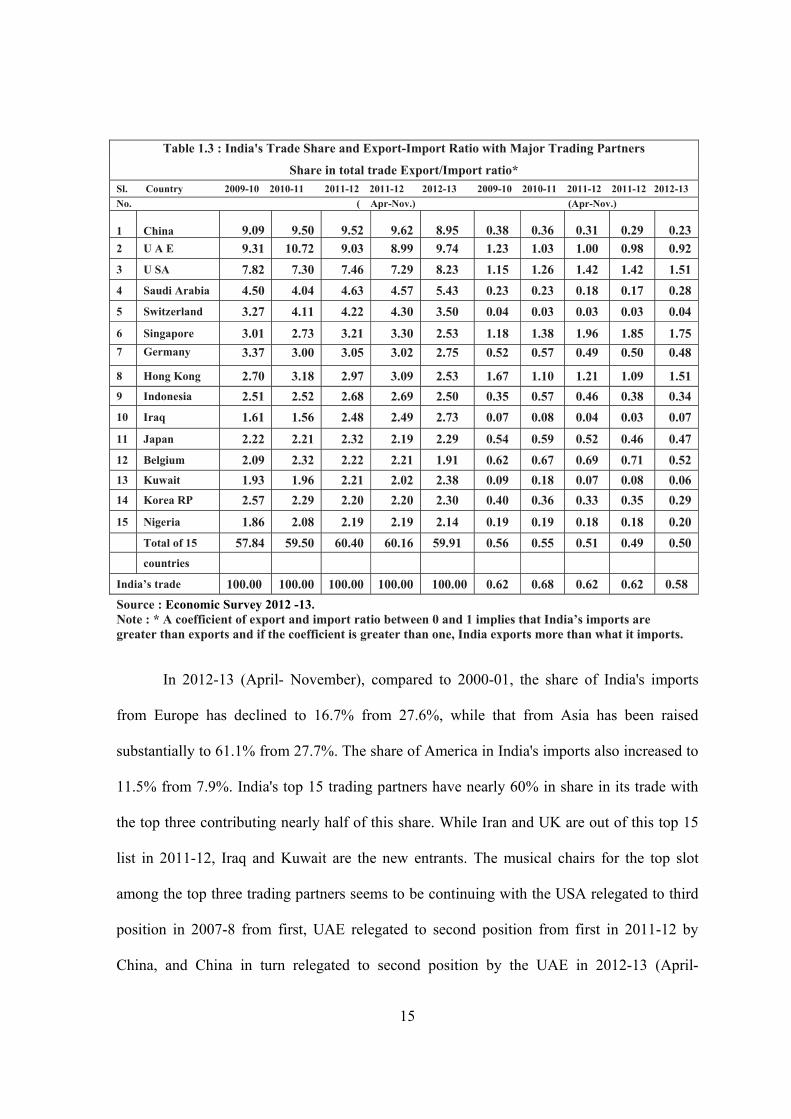
Table 1.3 : India's Trade Share and Export-Import Ratio with Major Trading Partners
Share in total trade Export/Import ratio* Sl. Country 2009-10 2010-11 2011-12 2011-12 2012-13 2009-10 2010-11 2011-12 2011-12 2012-13 No. ( Apr-Nov.) (Apr-Nov.)
1 China 9.09 9.50 9.52 9.62 8.95 0.38 0.36 0.31 0.29 0.23 2 U A E 9.31 10.72 9.03 8.99 9.74 1.23 1.03 1.00 0.98 0.92 3 U SA 7.82 7.30 7.46 7.29 8.23 1.15 1.26 1.42 1.42 1.51 4 Saudi Arabia 4.50 4.04 4.63 4.57 5.43 0.23 0.23 0.18 0.17 0.28 5 Switzerland 3.27 4.11 4.22 4.30 3.50 0.04 0.03 0.03 0.03 0.04
6 Singapore 3.01 2.73 3.21 3.30 2.53 1.18 1.38 1.96 1.85 1.75 7 Germany 3.37 3.00 3.05 3.02 2.75 0.52 0.57 0.49 0.50 0.48
8 Hong Kong 2.70 3.18 2.97 3.09 2.53 1.67 1.10 1.21 1.09 1.51 9 Indonesia 2.51 2.52 2.68 2.69 2.50 0.35 0.57 0.46 0.38 0.34 10 Iraq 1.61 1.56 2.48 2.49 2.73 0.07 0.08 0.04 0.03 0.07
11 Japan 2.22 2.21 2.32 2.19 2.29 0.54 0.59 0.52 0.46 0.47 12 Belgium 2.09 2.32 2.22 2.21 1.91 0.62 0.67 0.69 0.71 0.52 13 Kuwait 1.93 1.96 2.21 2.02 2.38 0.09 0.18 0.07 0.08 0.06 14 Korea RP 2.57 2.29 2.20 2.20 2.30 0.40 0.36 0.33 0.35 0.29
15 Nigeria 1.86 2.08 2.19 2.19 2.14 0.19 0.19 0.18 0.18 0.20
Total of 15 57.84 59.50 60.40 60.16 59.91 0.56 0.55 0.51 0.49 0.50 countries
India’s trade 100.00 100.00 100.00 100.00 100.00 0.62 0.68 0.62 0.62 0.58 Source : Economic Survey 2012 -13. Note : * A coefficient of export and import ratio between 0 and 1 implies that India’s imports are greater than exports and if the coefficient is greater than one, India exports more than what it imports.
In 2012-13 (April- November), compared to 2000-01, the share of India's imports
from Europe has declined to 16.7% from 27.6%, while that from Asia has been raised
substantially to 61.1% from 27.7%. The share of America in India's imports also increased to
11.5% from 7.9%. India's top 15 trading partners have nearly 60% in share in its trade with
the top three contributing nearly half of this share. While Iran and UK are out of this top 15
list in 2011-12, Iraq and Kuwait are the new entrants. The musical chairs for the top slot
among the top three trading partners seems to be continuing with the USA relegated to third
position in 2007-8 from first, UAE relegated to second position from first in 2011-12 by
China, and China in turn relegated to second position by the UAE in 2012-13 (April-
16
November). The final word for 2012-13 is not yet out as the USA is inching closer to China
with its share rising by around one percentage point and that of China falling.
At 10% in 2011-12 India's trade deficit as a per cent of GDP is one of the highest in
the world. Export-import ratios reflecting the bilateral trade balance (Table 1.3) show that
among its top 15 trading partners, India had bilateral trade surplus with four countries in
2011-12, viz. the UAE, USA, Singapore, and Hong Kong. In 2012-13 (April- November),
India's trade balance with the UAE has turned slightly negative while it has improved further
with the USA and Hong Kong. Another important trend is the growing trade deficit of India
with China and Switzerland, increasing from US$ 28 billion and US$24.1 billion in 2010-11
to US$ 39.4 billion and US$ 31.3 billion respectively in 2011-12. In 2012-13 (April-
November), the export-import ratio with China worsened further to 0.23 from 0.31 in 2011-
12.
1.6 TRADE CREDIT
Trade credit is a critical component of global trade. Internationally active firms rely
extensively on trade credits. As per a recent WTO study using quarterly country-level data of
export credit insurers from the Berne Union for the period 2005 to 2011, a 1 % increase in
trade credit granted to a country leads to a 0.4 % boost in real imports of that country. This
effect does not vary between crisis and non-crisis periods. Thus both availability and cost of
trade credit are important in the current environment of financial uncertainties when the
banking system is likely to be tempted to reduce exposure to cross-border banking.
1.6.1 Impact of the crisis on trade credit
The global economic crisis also impacted trade credit. A number of banks, global
buyers and firms surveyed independently by the World Bank, International Monetary Fund
(IMF) and Bankers Association for Finance and Trade (BAFT), have felt that lack of trade

17
credit and other forms of finance, such as working capital and pre-export financing, has
affected growth in world trade. In addition, the costs of trade credit have substantially gone
up and are higher than they were in the pre-crisis period, raising the challenge of affordability
of credit for exporters. Higher funding costs and increased risk continue to put upward
pressure on the price of trade credit. In 2008, as the financial crisis intensified, the spreads on
trade finance increased by a factor of three to five in major emerging markets, like China,
Brazil, India, Indonesia, Mexico, and Turkey. For example, the spread (over the six-month
LIBOR) for Turkey jumped to 200 basis points in November 2008 from 70 basis points in the
third quarter(Q3), while Brazil's spread almost trebled in 2008 (from 60 bps to 175 bps);
India's spread increased from 50 bps to 150 bps during the same year. Similarly, spreads for
several Sub-Saharan countries jumped from 100 basis points to 400 basis points.
Small and Medium Enterprises (SMEs) and exporters in emerging markets appear to
have faced the greatest difficulties in accessing affordable credit. Increased uncertainty
initially led exporters and importers to switch from less secure forms of trade finance to more
formal arrangements. Exporters increasingly asked their banks for export credit insurance
(ECI) or asked importers to provide Letters of Credit (LCs). Importers were asked to pay for
goods before shipment and exporters sought more liquidity to smooth their cash flow.
Further, the realization of export proceeds was not taking place on the due date. This led
firms to trim down inventories, and direct the funds so generated to meet their working
capital requirements.
1.6.2 Trade Credit: Indian scenario
Reflecting improved global financial conditions, the gross inflow of short-term trade
credit (up to 1 year) to India reached Rs. 392,526 crore during end September 2012, which
18
represented a year-on-year increase of 24.6 % (but a quarter-on-quarter decline of 1.1 % in
Q2 of 2012-13). Inflow of trade credit in H1 of 2012-13 at US$ 57.6 billion was 14 % higher
than in 2011-12 and growth in outflow of trade credit was lower at 7.7 %. As a result, net
trade credit grew by 60.1 % in H1 of 2012-13 and stood at US$ 9.5 billion as compared to
the decline of 14.4 % in H1 of 2011-12.
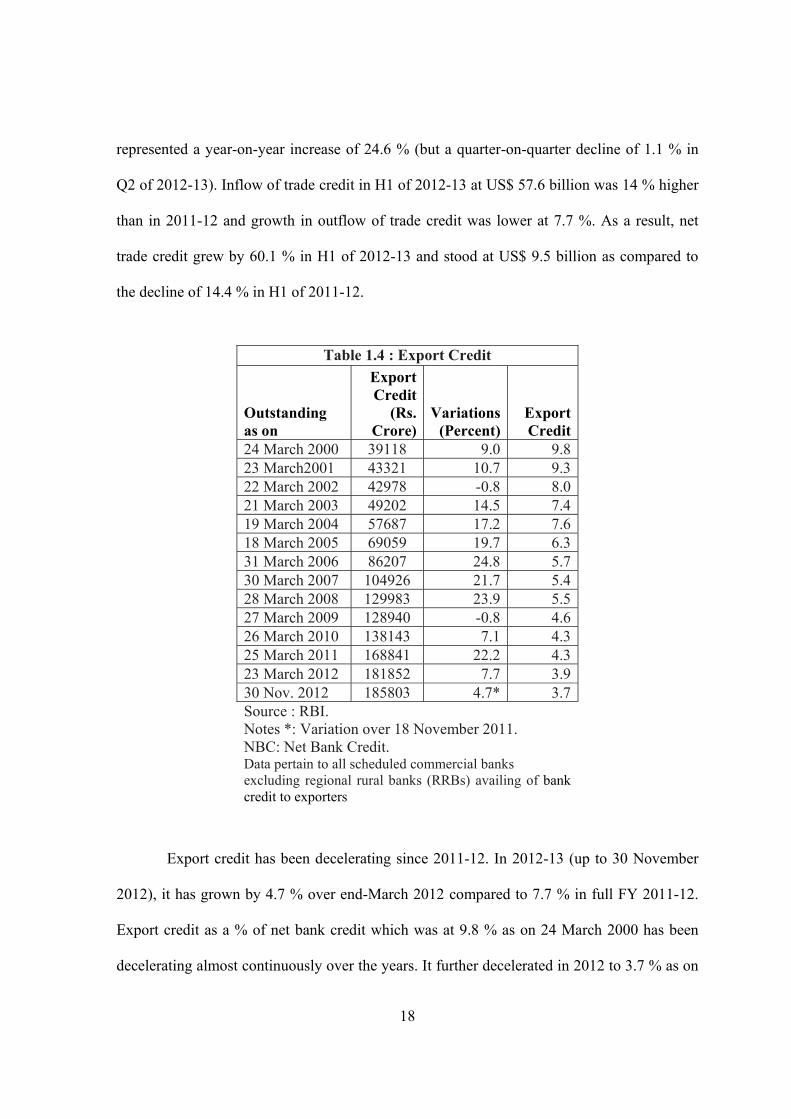
Table 1.4 : Export Credit
Outstanding as on
Export Credit
(Rs. Crore)
Variations(Percent)
Export Credit
24 March 2000 39118 9.0 9.8 23 March2001 43321 10.7 9.3 22 March 2002 42978 -0.8 8.0 21 March 2003 49202 14.5 7.4 19 March 2004 57687 17.2 7.6 18 March 2005 69059 19.7 6.3 31 March 2006 86207 24.8 5.7 30 March 2007 104926 21.7 5.4 28 March 2008 129983 23.9 5.5 27 March 2009 128940 -0.8 4.6 26 March 2010 138143 7.1 4.3 25 March 2011 168841 22.2 4.3 23 March 2012 181852 7.7 3.9 30 Nov. 2012 185803 4.7* 3.7 Source : RBI. Notes *: Variation over 18 November 2011. NBC: Net Bank Credit. Data pertain to all scheduled commercial banks excluding regional rural banks (RRBs) availing of bank credit to exporters
Export credit has been decelerating since 2011-12. In 2012-13 (up to 30 November
2012), it has grown by 4.7 % over end-March 2012 compared to 7.7 % in full FY 2011-12.
Export credit as a % of net bank credit which was at 9.8 % as on 24 March 2000 has been
decelerating almost continuously over the years. It further decelerated in 2012 to 3.7 % as on

19
30 November 2012 (Table 7.9). Taking note of the global slowdown and the worsening
global conditions for exports, the RBI has taken several measures to facilitate availability of
bank credit to exporters.
1.7 EXIM POLICY
1.7.1 Recent Trade policy measures
The government has announced many trade policy measures in the Annual
Supplement to Foreign Trade Policy (FTP) released on 5 June 2012. Many measures were
also taken by the government in Union Budget 2012-13 and the RBI in its monetary and
credit policies during the course of the year to help exports.
1.7.2 Policy for Promoting State-wise Exports
The top five states in India's exports in 2011- 12 were Maharashtra, Gujarat, Tamil
Nadu, Andhra Pradesh, and Karnataka, accounting for 63.4 % of India's exports. While in
2011-12, these five states had high robust growth (except Gujarat with 5.5 % growth) in
2012-13 (April-November) all of them had negative growth. In fact all the other states in the
top 15 except Odisha had positive growth in 2012-13 (April-November) with Kerala,
Rajasthan, and Punjab having high export growth in 2012-13 on top of robust growth in
2011-12. Export growth of Haryana was also relatively high in 2012- 13 (April-November)
though it was low in 2011-12.
The Assistance to States for Developing Export Infrastructure and Allied Activities
(ASIDE) Scheme provides assistance to state governments / union territory (UT)
administrations for creating appropriate infrastructure for development and growth of
exports. The budget outlay for financial year 2012-13(R.E.) under the ASIDE scheme is Rs.
655.5 crore of which Rs. 573.22 crore has been sanctioned/ released till the end of January

20
2013. The outlay has two components: state (80 % of the total outlay) and central (20 % of
the total outlay). Statewise allocation under the state component of ASIDE shows that the top
five states in terms of allocation in 2012-13 are Gujarat, Maharashtra, Tamil Nadu,
Karnataka, and Andhra Pradesh which are also the top five states in India's exports. Among
the northeastern states, those with significant allocation are Assam, Meghalaya, and Tripura.
1.8 INSTITUTIONAL SUPPORT FOR EXPORT PROMOTION
The need for our country to step up exports and sustain their growth is too well
known to need a mention. Realization of this genuine need is reflected in the numerous
institutions functioning in our country either directly or indirectly connected with the export
promotion. A number of institution and agencies are endeavouring to lend a helping hand to
the exporter in different aspect involved in his export efforts. Institution striving towards
export promotion in India can be classified into three categories:
• Advisory Bodies
• Promotional Organisation
• Service Institutions
Advisory Bodies
Advisory Bodies render assistance to the Government in the formulation and
implementation of policies relating to foreign trade.
Board of Trade
It is consultative and deliberate body to provide the Government with the views of
different sections of the society that may be taken into account in formulating and
implementing export import policies.

21
Export Promotion Council
It is a non-profit organization establishes under companies Act with a view to
promoting export of specific commodity their main function is to look after the interest of the
member exporter, be a link between the Government and the trade and takes steps for
promotion of exports of particular commodity which they represent.
Commodity Board
Commodity Board had been set up for principle commodity to guide their production
and exports of the particular commodity which they represent.
Indian Institute of Foreign Trade
It is a deemed university. The functions of the institute mainly cover two areas one
development of export management and undertaking research relating to foreign trade.
Indian Institute of Packaging
It aims at stimulating consciousness among the exporters of the need for good
packaging it undertakes research on raw material used in packaging with a view to effecting
improvement in packaging standards.
India Trade Promotion Organisation
It is a nodal agency of the Government of India for promoting countries external
trade. Its promotional tools include organizing the fairs and exhibition in India and abroad.
Buyer – Seller meets, contact promotion programs, product promotion programs, promotions
through overseas department stores, market survey and information dissemination.
Federation of Indian Exporters Organisation
It is the apex body is serving as a common and cording forum for various export
promotion council commodity board service institution and organization.
22
1.9 EXPORT FINANCE
Export means any goods which are to be taken out of a country to a place outside the
country. The exports are classified into the following categories:
a. Merchandise Exports;
b. Services Exports;
c. Project Exports;
d. Deemed Exports.
Export finance mechanism and institutional support are vital for the promotion of
exports. Today, a number of financial institutions exist that provide financial assistance for
export. The various institutions involved in the provisions of finance in India are:
• Reserve Bank of India,
• Export – Import Bank of India,
• Commercial Bank,
• Export Credit and Guarantee Corporation and
• Industrial Development Bank of India.
The RBI formulates the lending policies and guidelines and all the nationalized banks,
private and foreign banks are required to operate within the policies and guidelines laid down
by the former. It provides re-financing facilities of the short term credit sanctioned by various
commercial banks and thereby it facilitates the lending operation of the latter.
The Exim bank is the main source of long term export finance to the exporters of India. It
either solely or in participation with other commercial banks constitutes the primary source
of export finance. Generally, funds given by these banks are in the form of both pre –
shipment and post – shipment finance.

23
Next to commercial banks, the fourth financial institution involved in export financing is
ECGC. Their main functions are: providing insurance cover to Indian exporters; extending
financial guarantees to banks that extends credit to exporters etc.
Finally, IDBI has been operating several schemes for providing credit to Indian exporters.
Further, refinancing facilities are also provided by IDBI to commercial banks against the
medium term export credit given to exporters.
The EXIM Bank of India came into existence on 1st January 1982, and started
functioning from March 1st 1982. It has its headquarters’ in Mumbai and its branch offices
in important centre in India and abroad. Exim Bank is a wholly government – owned
financial institution, set up for the purpose of financing, facilitating and promoting India’s
foreign trade. The main focus of the Exim bank of India is export finance related to export of
capital goods and other manufactured goods, consultancy and technology services involving
deferred payment terms. The bank also provides Pre – shipment finance where the production
process exceeds months. In addition to extending non fund based assistance by way of
guarantees on behalf of Indian exporters for construction, turnkey and consultancy projects
abroad, the Exim bank provides various financial assistance for the export of Indian goods
under its various schemes of assistance such as direct assistance to exporters includes post –
shipment term finance; pre – shipment credit; term loans for export – oriented units; overseas
investment finance; finance for export marketing, loans to foreign government, importers and
financial institutions include overseas buyers’ credit; lines of credit; re-lending facility to
banks abroad, re- finance facility for banks in India include rediscounting of export bills;
small- scale industry export bills; refinance of export credit; bulk import finance.

24
1.10 SIGNIFICANCE OF THE STUDY
Export constitute the edifice of citadel of a sound economy more particularly for a
developing nation like India, which has been suffering from a persistent balance of payment
(BOP) problem from more than a decade, reaching to a crisis proportion in 19917. Therefore,
thrust towards development of Indian economy has been promotion of exports. One of the
major contributory factors for promotion of export trade is the availability of ‘Special
Finance’ both at pre and post shipment stages. An exporter has not only to procure the raw
material either at indigenous or imported for processing the same in finished goods and
boarding then on ship or air, but also has often allow credit terms to an overseas buyer.
Delivery period in international trade transactions is normally longer compared to the
domestic counterpart and correspondingly, the lead time for getting payment from overseas
buyer is more. The exporter has thus to be extra cautious to ensure to the overseas buyer is
reliable one and payment for goods and services so rendered will be realized expeditiously.
Therefore, the issues involved in export finance are:
Availability of adequate and timely finance;
Provision of concessional credit in order to make the export internationally
competitive;
Institutional support to protect the losses on account of deferred risk of overseas
buyers; and
Availability of special deferred credit promotion of project exports including turnkey
assignments.
7 Refer to Economic Survey 1992-93 for the discussion on BPO crisis faced by India in 1991.

25
1.11 SCOPE OF THE STUDY
Despite the existence of massive network of institutional support for the promotion of
exports the problems persist and complaints are often heard from exporters, regarding
rigidity of financial institutions credit mechanism along with delays in decision making
process.
In order to address the issues and challenges, as a apex body Exim Bank has
to revitalise its operations by effectively coordinating the functions of various institutions and
facilitate foreign trade requires a complete introspection of the role of Exim Bank. It will
give new impetus in extending their role in the competitive environment across the globe.
Hence this study aims to analyse efficacy of Exim Bank of India.
1.12 STATEMENT OF THE PROBLEM
The issue taken for research work was “Efficacy of Export - Import Bank of India
(EXIM Bank)”. There has been a substantial transformation of India‘s Export structure in the
recent years.
Fostering international competitiveness and thereby sustaining long run growth is an
important agenda of many of the international players. This assumes significance in the
context of the crying need of diversifying export basket, sustaining higher rates of export
growth over the time, upgrading the technological skill content of export activities and
expanding the base of domestic firms, which are able to compete globally.
Hence this study aims to find out the Operational & Financial Efficacy of Exim Bank.
26
1.13 OBJECTIVES OF THE STUDY
The specific objectives of the study are:
1. To give an Overview about the trend of Indian export in general and export financing
procedure in particular
2. To analyse the operational efficacy of EXIM Bank of India in terms of schemes of
assistance, no. of units assisted, purpose wise assistance & country wise assistance.
3. To evaluate the financial efficacy of EXIM Bank of India in terms of liquidity,
profitability, solvency, and CAMEL metrics.
4. To assess the impact of the existence of Exim Bank through the assistance under
various schemes toward the economic growth
1.14 HYPOTHESES OF THE STUDY
H01: There is no significant difference between I decade and II decade of the reforms
period under various schemes of assistance extended by the EXIM Bank of India.
H02: There is no significant difference between the various schemes of financial
assistance extended by the Exim Bank of India.
H03: There is no significant contribution to select macro economic variables under
various schemes of assistance extended by the Exim Bank of India
1.15 METHODOLOGY OF THE STUDY
It is an evaluatory type of research based upon secondary data. Case study method
has been adopted and the case being EXIM Bank of India. The secondary data have been
collected from various Annual Reports of Export – Import bank of India, CMIE-Prowess,
27
Report on Currency & Finance, RBI Bulletin, Newspapers and Internet sources etc. The
official of the EXIM bank and few exporters were also been contacted to elicit first hand
information.
1.15.1 TOOLS USED IN THE STUDY
The researcher has analysed export performance and the recent trends in exports
financing and various financial assistances provided to Indian exporters by EXIM Bank of
India. The following tools have been applied to derive the results in accordance with the
objectives.
Financial ratios: To measure the Liquidity, Solvency & Profitability. Percentage,
graphical representations and other relevant sophisticated tools has been used for deducing
meaningful and practical findings.
Trend analysis and Regression: To Find out the growth pattern in the performance
of exports financing in India.
Linear and compound Growth rates: To find out the growth pattern between
sanction and disbursement
Correlation: To find out the relationship between the various schemes of financial
assistance provided by the Exim Bank and macro economic variables like GDP, BOT, BOP,
Export, Import, Total Credit Exporter .
ANOVA: To know the significance of exports in different regions and also to
measure the differences in the categories of exports.
CAMEL Ratings: To measure the financial performance.
Altman’s Multiple Discriminate Analysis: To predict Bankruptcy through the
variables like Liquidity, working capital, profitability etc.,

28
1.15.2 PERIOD OF THE STUDY:
The study covers a period of 20 years from 1st April 1992 to 31st March 2012. This
helped to ascertain the efficacy of EXIM bank of India in the post liberalization period of
comparative analysis of performance has also been done during 1st decade and 2nd decade of
the reform period.
1.16 LIMITATION OF THE STUDY
Time constraint is considered to be the important limitations of the study. The study
is purely based on secondary data; hence the limitations of the secondary data are applicable
to this study also.
1.17 CHAPTER SCHEME
The chapter arrangement has been done in the following manner:
Chapter I gives the introduction and design of the study.
Chapter II deals with the review of literature.
Chapter III gives an overview of export financing procedures and various schemes of
assistance provided by EXIM Bank of India.
Chapter IV describes in detail the operational efficacy of EXIM bank.
Chapter V depicts the financial efficacy of EXIM bank.
Chapter VI elicits the contributions of EXIM Bank to the Economic growth of India.
Chapter VII gives the summary of findings, suggestions and conclusion of the study.
CHAPTER II
REVIEW OF LITRATURE

29
CHAPTER II
REVIEW OF LITERATURE
Review of related literature, a significant and primary component of any
research, enables the investigator to understand the earlier research interests, research
patterns, magnitude of the research output, etc. Considerable amount of literature is
published in the form of articles, books, conference volumes and electronic media.
This chapter concerns with earlier research work conducted on export promotion and
precisely on institutions boosting the exports in general and Exim Bank of India in particular.
The contribution of various research works around the globe on the relevant area is note
worthy and has paved way to find the gaps in this study.
Deepak Nayyar (1975)1has done a pioneering work on Indian exports. In his paper titled
“Indian exports and policies in 1960” found that commodity composition influence export
competitiveness. In case of India, it has been pointed out that it could not possibly increase
its share of world export as the commodity composition of its export was an ‘unfortunate
one’. Even when India started exporting non – traditional products. Such exports were
largely based on slow moving products. He also suggested improvement in the export policy
of India.
H.C. Olson (1975)2 in his work titled “studies in export promotion” studied impact of the
export promotion programme on firm behaviour. According to Olson, Government export
1 Nayyar, Deepak, ‘Indian Exports and Export policies in 1960s’, Cambridge,1975, p340 2 Olson, H.C., “Studies in export Promotion”, ACTA Universities Upsalienis, Stutia Oeconomiae Negotrium to, Stockholm, Alquist and Wiksell International,1975. .
30
promotion programme act as independent variable and actual or future export volume of a
company as a dependent variable. Export promotion programme builds the decision base in
the company, which makes company able to judge the merit of embarking on a related course
of export action, as result of which the firm decides to act accordingly, organizes its
important activities and finally makes export sales.
Henry Simon Bloch (1976)3 opines even though exporters provide the right product, price,
promotion and distribution, non – competitive trade financing can force them to lose the deal.
When they are competing with foreign manufactures, competitive trade financing is an
extremely effective tool in promoting exports, particularly those of small and medium sized
exporters. These exporters are usually reluctant to be evolved in the export business, because
they lack trade finance skills.
P.K. Jain (1984)4 Research work on ‘Export Marketing: Problem, Procedure and Prospect”
throws light on India’s export trade, engineering goods industries, 4Ps of marketing and
market research. The aim of the research was to analyse and examine in detail, the problems
of Indian engineering goods industries especially in the field of exports. The research
revealed the problems faced by engineering exports viz., paucity of export promotion
available to the exporter, high incidence of the freight rate and freight disparities between
regions, pricing constraints, poor steel supply for exports, inadequate supply of infrastructure
facilities, etc. Research work also suggested important measures like regional diversification
of engineering exports, creation of additional capacity, smooth and efficient functioning of
3 Henry Simon Bloch, “Export Financing Emerging as a major Policy Problem”, Columbia, Journal of World Business, 1976, p.85-95. 4 Jain P.K., “Export marketing of Indian Goods – Problems, Procedures and Prospects”, Deep & Deep Publications, New Delhi, 1984, pp.307 -25.

31
economy, co-ordinated efforts needed for promotional work and pragmatism in export
obligation schemes.
H.B. Desai’s(1984)5 research study on ‘Indian shipping perspectives’ took account of
difficulties and problems business firms have to face and how they have to incur extra
expenses on maintenance of special establishments at seaports, undertaking frequent journey
to port cities for sorting out procedural bottlenecks with customs and port authorities and
spending time and money on communication for information and advises through telex,
telegrams and telephone calls. The research study’s focus was on role of Delhi dry port,
technological innovation, container transportation system (for faster and reliable delivery of
goods, to have better protection in cargo handling cost), container freight rates and
establishment of national shipping board. According to the researcher, there is need of a
quantum jump in upgradation and modernization of port infrastructure and methods of
operations. Report of Review Committee on Export promotion council headed by Shri Prabu
V.Mehta (May 1965) came out with important recommendation with the basic idea of
strengthening the EPCs, particularly bearing in mind the export target and the steps that have
to be taken both in the matter of releasing exportable surpluses and for meeting the growing
world competition.
Mathur.B.P (1985)6 in the paper titled “Industrial exports and developing countries – India’s
search for countervailing power” states that an obvious solution of growth for India is to
move into the fields of industrial products. The main focus was on proper segmentation of
5 Desai, H.B., ‘Indian shipping Perspective: (iv), Guide to the Evaluation of Trade Promotion Programmes, International Trade Centre UNCTAD/GAt, Geneva 1987, p.1; 6 Enchancing the effectiveness of Technical Assistance in Export promotion, Joint Advisory group on the International Trade Centre UNCTAD/GATT, Eighth Session, Geneva, 6-17 jan.1975,p.2.

32
international market; use of joint venture strategy to enter into the foreign market; creation of
‘institutional agencies’ in the shape of ‘aid and credit corporation’ and ‘corporation for
promoting Joint venture’
Studies conducted by Joint advisory group at the International Trade centre UNTAD/GATT
(1975) and guide to evaluate the export at macro level, generating promotion programmes.
ITC States the following reasons as underlying their evaluation: to examine activities carried
out under a given programme in offer to ascertain the magnitude of the result achieved and
the effectiveness of progamme, to uncover implementation problems and identify possible
solutions, to accumulate experience from the implementation of particular activities and of
programme as a whole, to measure the impact of programme and ascertain whether the
results justify the implementation of the progamme, to help in defining activities that will
contribute more positive to the effectiveness of programs. The studies also focused on the
matter of impact of trade promotion progamme. According to this research study two broad
goals underlie government efforts in providing export promotion support; first at macro-
level, generating a favourable trade balance or reducing a trade deficit, and second, at the
micro level, enhancing the international competitive competence of domestic industries and
companies.
Garry Pursell (1987)7 in the article titled “How to measure and compare Export Incentive?”
Found that in India, any individual manufactured product which is exported will typically
benefit from a variety of export incentives and hence it is of considerable interest to have a
measure of combined impact of all incentives. The researcher explained the concept of
effective protection and how it can be used to quantify and analyse the Indian export
7 Pursell, Garry, ’How to Measure and compare Export Incentive’? Foreign Trade Review, vol.22, IIFT journal, New Delhi, 1987.

33
incentives. According to his perception, if the government makes export equally profitable as
import subsidation profits, for the same products, it could set the incentives so that the
effective subsidy for exports is equal to effective protection the domestic market.
Rolf Seringhaus ontario (1988)8 in his research paper titled “A Methodological Approach to
the Evaluation of Government Export – Promotion Programs” found that the impact of
government export promotion is seen to occur at several different levels , ranging from the
broadest possible effect on a country’s trade position to the highly specific result an exporter
may realize using a particular export programme. Also gave frame work for evaluation of
government export promotion research focusing on government assistance construct
comprising global measure. This research included in all export marketing assistance services
or program offered by the government. Second were narrow global measures which included
in similar purpose services like providing information for export planning and market entry
and individual measures like individual assistance provided by specific institution viz.
Canadian trade commission Service. Specific measure included specific assistance provided
by specific progamme.
Subrata Banerjee’s (1988)9 research paper on ‘India’s foreign trade and industrial
development’ put emphasis on the then in practice ‘import liberalization’ as basic strategy of
export promotion. The basic principle of imports for industrial development and exports has
to be modified, to ensure that import liberalization meets priority needs of industry, not
indigenously available or likely to be developed within a short time. The paper talks about
8 Seringhaus, R.H.Rolf, ‘A Methodological Approach to the Evaluation of Government Export-Promotion Programs’ , Research Paper series No.1-88,School of Business and Economics, Wilfred Laurier University, Ontario, 1988. 9 Subrata Banerjee’s ‘India’s foreign trade and industrial development’ Foreign Trade Review, vol.22, IIFT journal, New Delhi,1988

34
the need in case of non-traditional goods, to bear in mind comparative advantage and build
up thrust areas as likely to have a continuing and expanding market over a reasonable time-
frame.
Yung-Chul Kwon’s(1988)10 research work on ‘Trade Finance as a competitive Tool: An
overview’ clearly reveals the role of trade finance as an important determinant of
international competitiveness. This paper deals with role of trade finance, sources of trade
financing, counter-trade, trade finance risks, trade credit and collection and trade finance
management and organization. Thus, in the context of marketing, competitiveness depends
on 4Ps. However on international level, at least one other factor is involved with making a
competitive offer, that is, trade financing which often makes the difference in obtaining an
order particularly when the product and price offered are competitive with those of other
industrialized nations. The research paper says that to use trade financing as a competitive
tool, trade financing programmes of the Government and trade financing techniques of the
individual exporters must be effective and efficient.
Bibek Debroy (1989)11 in his research work titled ‘China’s External Trade – A Review”
threw light on reform process started in China how it has helped china’s Foreign trade.
Extended reforms in China have been instituted since 1978 which have been based on three
broad planks of first were the reform in rural economic organisation, Viz. birth control,
changes and reforms in legal policy frame work. Second, there were reforms in urban
economic organisation to make industry more flexible and increase production, and thirdly,
10 Kown Chul Yung, ‘Trade Finance as a Competitive Tool: An Overview’, Foreign Trade Review, IIFT, New Delhi, April-June, 1988. 11 Debroy, Bibek, ‘China’s External Trade- A Review’, Foreign Trade Review, April-June, 1989, No.1, Vol. XXIV.
35
reform in external trade sector focusing on decentralisation and transparency. Reforms in
foreign trade have helped China to gain fast economic growth.
R.K.Pandey’s (1989)12 research paper on “Export promotional system in India—Need for a
New Strategy” puts in proper perspective the role, which export promotion measures should
play to ensure continuing expansion and diversification of India’s export in the context of
highly competitive, complex and fast changing international marketing environment.
According to the author, the entire export promotion measures in India , has to be overhauled
and scientifically oriented to export marketing promotion needs rather than just catering to
cost reduction and increasing profitability objectives, which indeed have some, but very
limited, contribution to export expansion and diversification efforts of the country. A popular
method of appraising benefits from export promotion measures in India has been to compare
the net foreign exchange realistion from exports with the total cost of administering export
promotion measures to national exchequer—‘a fiscalist approach’. The benefit analysis of
export promotion system in any country should however, necessarily be based on a
comparison between ‘Domestic resource Gain’ as well as ‘Net Foreign Exchange Earning’.
Maurice D. Levi (1990)13 in his paper justifies the export promotion, because of the jobs and
incomes that derive from a healthy export sector, it has become standard practice for
governments around the world to help their exporters with contracts by offering export
financing. This financing can be short term, medium term or long term maturity and takes a
number of different forms. A large part of official export financing takes the form of
payments to exporters, with foreign importers than paying the government agency.
12 Pandey R.K., ‘Export Promotional System in India, Need for a New Strategy’, Foreign Trade Review, April-June, 1989. Vol. XXIV, No.1. 13 Maurice. D.Levi,”International finance: The Markets and Financial Management of Multinational Business”, Mc. Graw Hill Publishing co, 1990,P.429

36
V.R. Panchmuki, C.J. Batliwala, C.K. Reddy, V.L. Roa, Philip Thomas and I.R.
Mukharji (1991)14 in their joint research work titled ‘Export financing aspects in India’
studied the following aspects such as, focus on export finance for the growth of exports in
India. The credit requirements of exporters have been estimated using various mathematical
techniques. The existing export promotion policies have been thoroughly analyzed. It also
provided comprehensive information on specific rules/conditions relating the disbursement
of credit. Researchers recommended special credit schemes for small exporters. According to
them, export incentives should be extended to indirect exports and government and exporters
must focus on the quality up gradation.
Kapoor S.N. (1991)15 in his paper has applied constant market share model to access the
performance of Indian export to 21 developed market economies for the period 1960 to 1984.
Export growth was decomposed into two broad components: the structural effect and
competitive effect (price and non –price factor). Result of the study showed that market
distribution effect had been positive suggesting the India’s export were marginally weighted
in favour of fast growing markets. The commodity composition effect was unfavourable. The
high negative commodity composition effect suggested that concentration on slow growing
commodities was primarily responsible for depressing export growth.
Tarun Bandyopadhyay and Indrajit Ray (1991)16 in his paper titled “The role of IDBI in
the regional imbalances in West Bengal: An Empirical Assessment” attempted to assess the
thrust of Industrial Development Bank of India for a balanced regional development in the
14 Panchmukhi, V.R., Batliwala C.J., Reddy, K.C., Rao V.L., Thomas Philip, Mukherji, I.N., ‘Export Financing in India’, Interest Publication, 1991. 15 Kapoor S.N, “The structure and Competitiveness of India’s export”, the Indian Economic Review, Vol. XXVI, No.2, July – December1991, p221 – 239. 16 Tarun Bandyopadhyay and Indrajit Ray, “The role of IDBI in the regional imbalances in West Bengal: An Empirical Assessment”,Prajnan,Vol.XX.No.3,1991.

37
country. This paper delves into: the relative magnitude of its assistance to the depressed
region; and the spatial direction of linkage effects of the IDBI induced development in both
advanced and depressed regions. The flow of linkage effects from advanced region to
depressed region assumes a strategic importance in planning especially in the absence of
minimum infrastructure base in the latter region which compels large scale units to set up in
the former. The study reveals the managerial staff and semi-skilled workers are employed
from outside the state than what they employed from backward region. The policies for
correction of regional imbalances should, therefore, recognize the rationality for an
inducement to the projects having substantial development effects on backward regions,
whatsoever might be their locations.
Charles Cadwell (May 1992)17 (State Export Promotion and Small Business). This study
examined an important avenue of assistance for the small firm looking to expand their
markets aboard; state export promotion programs. Nine case studies of export promotion
programs were conducted to assess the common characteristics, assistance strategies, and
relative effectiveness for small business of the programs in various states of US. The study
made the following recommendations:
1. State legislatures should establish explicit goals for export promotion programs and
should distinguish between the goals of the export programs aimed at increasing the
dollar value of the exports (short-term results) and aimed at increasing the number of
small business exporters (long-term export capability).
2. States should implement fees for services. Seminars and trainings should have
modest participation fees.
17Cadwell, Charles, ‘State Export Promotion and Small Business’, National Small Business United, Washington, D.C. May 1992.

38
3. Program managers should understand the limitations of export assistance and avoid
over ambitious promises of dramatic economic effects from a state export assistance
effort.
4. States should identify specific feedback mechanism for export promotion activity to
evaluate the effectiveness of programs.
5. State should articulate the comparative advantage of various state-supported export
assistance providers and increase co-ordination and joint publicity.
M.R. Narayana (1992)18 research on ‘Export subsidies in India : Need for a strategic
approach’ says that the persisting trade imbalances, mounting external debt and its servicing
burden, depleting foreign exchange reserves have often led to considering export promotion
as a policy alternatives for India. However, our continuing reliance on industrial market
economies for exports underlines the importance of completion in product quality price. This
research’s main focus was on subsidized export financing from EXIM bank and export credit
subsidy schemes of 1968. The analytical results of this research work showed that the
underlying imperfect market structure of India’s export trading is characterized by cournot’s
duopoly, the impact of export subsidies can be favourable in terms of larger market share for
home exporting firms. The results of this work offered strong economic support for the
strategic export policy, yet to be formulated in India, or justification for the current export
policy if only the subsidized exporting domestic firm’s beheviour is strategic. The research
study provided the economic basis for empirical estimation of export earnings by a strategic
export subsidization policy as compared to the existing, non – strategic policy.
18 Narayana, M.R., ‘Export Subsidies in India: Need for a Strategic Approach’, Foreign Trade Review, April-June, 1992, vol. XXVII, No.1, pp. 35-51.
39
O.P. Sharma (1992)19 work on “Export Competitiveness—Some conceptual issues’ threw
light on the word ‘competitiveness’. The concept of competitiveness has been dealt
differently at the different times in the empirical work on international trade flow. There is no
single measure of competitiveness. At the best it is a composite concept because different
measures (price, export shares, profitability and unit cost etc.) give different results. The
research identified several measures of competitiveness which were quantifiable, which
included—export market shares, specialization of industrial structure of industrial labour
force. This research made a modest attempt at elucidating some of the relevant issues
involved in understanding the concept.
Vijaya Katti’s (1992)20 study on “Construction Industry and Consultancy Services and
Exports : Problems & Prospects” dealt with the details of consultancy exports in agriculture,
engineering, processing and management, etc. and the facilities extended by the exim bank
along with the Government’s policy measures for the development of consultancy services.
The possible areas of co-operation with the developing countries have also been explained in
this paper.
S.P. Agarwal’s (1992)21 research work on “ Role of Consultants in Export of Technologies
and Manufactured Product” emphasized that exports of technologies and technology-
intensive manufacturing products must be encouraged for sustained earnings of foreign
exchange, apart from traditional exports of commodities and low value added manufactured
items. One such measures relates to promoting use of consultancies and professional services 19 Sharma, O.P., ‘Export Competitiveness: Some Conceptual Issues’ Foreign Trade Review, July-Sept. 1992, vol. XXVII, No.2, pp.159-76. 20 Katt, Vijaya, ‘Construction Industry and Consultancy services, Exports: Problems and Prospects’, Foreign Trade Review, July-Sept. 1992, Vol. XXVII, No.2. 21 Agarwal, S.P., ‘Role of Consultants in Export of Technologies and Manufactured Products’, Foreign Trade Review, Oct.-Dec. 1992, Vol. XXVII, No.3.
40
in a large measure by the manufacturers and exporters and the strengthening the consultancy
capabilities in emerging areas of technology. However, the consultants have generally kept
themselves away from export production systems where they can contribute substantially in
enhancing technical and managerial capabilities of exporters, in terms of vital aspects like
quality, cost delivery schedules. Consultants can provide effective and workable linkages
between industry, R&D institutions, academic institutions and the government as well as the
consumer market, besides developing the backup infrastructural facilities conducive for a
concerted export offer.
Dholkia(1992)22 has examined the linkage effects of export growth in different sectors of
Indian economy and import intensity of exports by using input – output table for 1983 – 84.
The study revealed that the primary sector had greater effect on income but lower effect on
gross output and net indirect tax revenue as compared to manufacturing sectors. An inverse
relationship was found between degree of export orientation of a sector and the linkages of
the sector with the rest of economy. The study indicates that import intensity of export
oriented sector was higher than that of the other sectors.
Pitale (1992)23 has analysed the export behavior of 125 large firms identified factors
affecting their exports. The study reveals that large size of firms in terms of their capital and
sales did not necessarily make them more export oriented. Export incentives influenced their
exports positively.
22 Dholkia.H Ravindra, Dholkia.H. Bakul and Kumar, Ganesh, issue in strategy for Export Promotion”, Economic and Political weekly, Vol. XXVII No. 48, 1992 p.149-158. 23 Pitale R. I and Vaidya V.M, “Export performance of Indian firms: A Cross section analysis”, Finance India, Vol. No.2, June 1992, p.283 -97.

41
Sen Gupta. A.K and Keshari P. K. (1994)24 the paper titled “Study of Export Trade
Financing in India with Particular Reference to Commercial Banks: Problems and Prospects”
the paper spell out the role & share of commercial banks in export financing and issues in
export financing i.e. aspirations and requirements of barrowers and discontentment of banks
with the present regulations of export credit. It also suggests for increasing the flow of bank
credit to export sector, restructuring the interest rates. It also calls for a change in attitudes of
banks – conservative and risk averse. The need for coordination between bank and financial
institutions, role of ECGC in timely settlement of claims are impetus for a favourable export
business the stress is on introducing the new innovative services of counter trade, overseas
barrowing, forfeiting, international factoring and bankers acceptance facility for accelerating
promotion of exports. Exports are instrumental in the development of an economy,
particularly developing nation. The Indian financial systems, through commercial banks offer
financial resources for promoting exports by providing both pre and post shipment finances.
LERMS and fully convertibility on trade account of Indian rupee have provided importers to
export financing, so also the new trade Policy, provides a favorable climate for exports.
Navin Chandra Joshi (1995)25 in his view states that good political rapport which India
enjoys today with different countries must take it one of the prime contenders for project
exports and consultancy services. Contracts, even in the face of international competition,
must enjoy certain national priority as the country’s commercial and technological credibility
24 Keshari .P.K. & Gupta sen .K.A., ‘Study of Export trade Financing in India with Particular Reference to Commercial Banks: Problems & Prospects’, Finance India, Vol. VIII No. 1, March 1994, p.27-51. 25 Joshi Chandra Navin , ‘Project Exports and Consultancy Services’ Foreign Trade Review, July-August 1995.
42
is involved. Further we have certain geo-economic advantages and they may be exploited to
the maximum.
C.Paul Hallwood and Ronald Mac Donold (1995)26 indicate several factors have driven the
internationalistion of finance during the last decade or so the main ones are the cheap of
international financing transactions by low cost computer technology; financial deregulation.,
the lifting in virtually all industrial countries controls on foreign exchange transactions and
regulatory constraints on lending and restrictions on composition of institutional investor
portfolio.
Mc Kendrick and Associates (1996)27 of United States did research work on ‘The cost of
Financing Exports for Small Business’. The purpose of this study was to examine the
financing issues faced by small exporters, including availability of trade financing and cost
associated with financing and payment settlement. The study examined the prevalence and
cost of working capital financing among small exporters; payment mechanisms; the cost of
export finance for manufacturer’s versus non-banking and finance sector in export finance
markets. Awareness level of export finance; and use of alternative in export finance including
transaction finance firms. The major findings of this research study were:
1. Drawing on an established line of credit from a commercial bank is the lowest cost
method of external financing. Financing costs are almost twice as high from non-bank
financial firms as from banks, not including points or upfront fees for initiating loans.
2. Payment mechanisms such as letters of credit take a relatively deeper bite out of
smaller transactions.
26 C.Paul Hallwood and Ronald Mac Donald,” International Money and Finance”, Balck well publishers Inc. Oxford ,U.K, 1995,p.2. 27 Kendrick. M.C. and Associates, ‘The Cost of Financing Exports for small Business’, National Technical Information Service, US Department of Commerce, US, 1996,p.199.

43
3. Differences in the capital structures of manufacturing and non-manufacturing firms
affect their relative ability to obtain trade finance. In addition, companies not primarily
in the export business, such as manufacturers, tend to pay more for export finance than
companies directly involved in the exporting business.
4. The banking sector has re-emerged as a trade finance source, and many see
opportunities in the small business trade finance market. The potential expansion could
alleviate the most restrictive and debilitating factor in small business export finance, that
is the lack of systematic access by exporters.
5. The vast majority of companies in the study used traditional banks. There was a
pervasive lack of knowledge of alternate finance mechanisms such as forfeiters, factorers,
transaction finance firms and public sector lending programmers. Public sector
programmes and private financial institutions have not reach the small exporter with
information about their programmes.
6. Small business 0065port finance costs compare favourably with those of
Germany’s small exporters may receive higher levels of service.
Ramu S. Deora (1997)28 in his paper states that domestic problems are severely impending
export effort, the main reason for decline in exports is due to the small and medium exporters
who are contributing 60 percent of direct exports have lost their motivation and suffered
direct financial losses as their working capital is blocked by various Government agencies, at
each and every stage of export transactions. Therefore the solution to overcome this problem
is to computerise the working of export related departments like ports, customs, DGFT,
Banks etc. so as to hasten – up the release of the blocked funds.
28 Ramu. S. Deora, ‘The Export Promotion Board, gives hope and reassurance to Exporters FIEO”, Vol.No.19, Oct. 1997, p 10.

44
T.N. Sindhwani (1997)29 in his article India’s share of world exports is less than fifth of
what is 40 years ego. Globally, India is minor player on the international economic scene. Its
international trade aggregates to less than one percent of the global transactions. Its economic
standing in the comity of nations, so far, does not be fit its size, population or domestic
resource potential. According to him a lot remains to be done if India is to play a meaningful
role on the world economic scene. The alternative before us are institutional framework for
export development.
Jeromi.P. D (1997)30 the paper title “Determinants of India’s Agricultural Exports” that
focus on the context of the post-GATT international trading conditions and liberalization of
India’s hitherto restricted agricultural exports. It also examines the determinants of India’s
agricultural exports during 1970-71 to 1994-95. the study undertakes empirical estimation of
exports demand and supply functions for the agricultural exports as well as for the principal
commodities in a simultaneous equation frame work.
Edger P. Hibbert (1997)31 argues that liaison between finance and marketing. It is clear that
management is having to operate under conditions of increasing uncertainty in overseas
markets, political risk, commercial risk and competition for Newly Industrializing Countries
(NICs). Added to this are financial uncertainties, particularly in the movements of interest
rate and currencies.
29 T.N Sindhwani, “ Indias’s Rolein Globalisation”, published by Capital foundation Society, 1997,p.23. 30 Jeromi,D.P, ‘Determinents of India’s Agricultural Exports’,Reserve Bank of India occational Paper, Vol.18, No.1, March 1997 31 Edger P. Hinnert, “ International Business Stratergy And Operations”, Mac Millan Press Ltd, London,1997 p.197 -198.

45
Sujan Hazra and David L. Sinate (1997)32 in their article “Fifty years of India’s Foreign
trade: Issues and Perspectives” opine that the slow pace of India’s export growth was mainly
due to anti – export bias of import substitution policy coupled with the limited reach of
export promotion measures. According to the authors, through import substitution is
unavoidable the country cannot avoid in a medium to long run perspective.
Charan D Wadhva (1998)33 in the article titled “India’s export Performance and policies:
An Appraisal” provides appraisal of the export performance and policies of India during the
period 1950 – 97 with focus on two sub-periods of 1950-90 and 1991 onwards. He concludes
that the actual record of growth of India’s export through the period 1950-57 can be
explained by the strengths and weaknesses of India export policies identified in this paper
both at the governmental (micro) and industry (micro) levels. He also provides an illustrative
list of major strategic policies and measures to enable India to fulfill national aspirations for
re-merging as a global player of greater consequence in line with India’s potential in this
regard.
S.P. Gupta(1998)34 in his article observes that, world merchandise trade is now showing a
0.6 percent of India’s share. World trade covers a vast number of Items. But, India’s share is
very low. A review of the top 200 items of world trade in 1994, which is accounted for 94
percent of the trade, reveals India’s exports are either nil ore negligible in respect of 71 items.
Also India does not figure in many manufacturing products that are fast growing items in the
world. According to the author, there is an urgent need for India to diversify its export basket
32 Sujan Hazara and David L. Sinate “Fifty years of India’s Foreign trade: Issues and Perspectives”, Bombay RBI, occasional papers. Vol.18 Nos 2&3, June and Sept., 1997. 33 Wadhva Charan D “India’s export Performance and policies: An Appraisal”Vikalpa, Volume 23, No 1, Jan –Mar.1998,p.61 -74. 34 S.P.Gupta, “Analysis by Comodity Composition – Post Reform India, Emerging trend”, allied publishers Ltd, New Delhi,1998, p.108.

46
and shift to high value, high technique value added products and to divert all attention to
increasing India’s penetration in the world market.
D.M. Sinha (1998)35 opines that, an economy is underdeveloped precisely because of greater
part of its productive activity has not proved an attractive investment for private fund;
institutions to channel funds into those sector have therefore failed to evolve from the spur of
ordinary market forces. Hence if the savings available to the community and such other funds
as it may be able to obtain from abroad are to be used so as to attain maximum growth in
economy, institutional frame work to assist and stimulate the flow must be deliberately create
and supported by government. According to the author the terminology called “Institutional
finance” has developed in underdeveloped economies in the recent past and much emphasis
is now being laid on this economic development.
C. Rangarajan (1999)36 opines that building up appropriate financial institution are an
essential strategy to promote savings and investment, agricultural credit, term finance to
industries and credit to export. According to him there is need to have an apex institution to
satisfy the requirements of open economy, to look after servicing of external debts and to
improve the share of our exports in world trade.
A. Diamantopoulos, A. Souchon, G. Durden, C. Axinn, H. Holzmuller, H. Simmet
Bloomberg (1999)37 did research work titled ‘Mapping Export Information use: A five
nation study’. Main focus of this research was on the extent to which and the ways in which
export information is used can play a significant role in a firm’s level of export performance.
The focus of this study was the investigation of export information use ‘practices’ across
35 D.D. Sinha, “Role of Institutional Finance”,sterling publishing (P)Ltd, (1998),p.19 36 C.Rangarajan, “Issues in Monetary management, Indian economy Essays on Money and finance” UBS publishers & distributors limited, 1999 p.3 -7. 37 Diamantopoulos, A., Souchon, A., Durden, G., Arcinn, C., Holgmuller, H., Simmt-Blomberg H., ‘Mapping Export Information Use: A Five Nation Study’, Aston Business School, Aston University, June, 1999

47
different countries. A total sample of 989 exporting companies across Austria, Germany,
Newzealand, the UK and the USA was obtained, and the data analyzed using analysis of
covariance to control for extraneous, firm level, variables. The results indicated that US
exporters were much more ‘political’ in their use of information, than exporters from the
other countries, while Austrian exporters tend not to use information for political purpose.
Similarly, export information gathered informally tends to be used much more ‘rigorously’
than does information gathered from export assistance bodies.
Hadi Salehi Esfahani’s (1999)38 of University of Illinois work on ‘Institutional
Requirements of successful Export Promotion in MENA Countries’ threw light on
institutional environment in MENA countries for international trade. The main objective of
this research work was to identify the institutional arrangements that areconducive to
improves export policies and performance in MENA countries. This projects focus was on
two aspects. The first part developed a theoretical framework that links export promotion
institutions with export policies and performance in the context of a country’s general
economic and institutional characteristics. The second part examined the relevance of the
framework and methodology by applying them to % country case studies and comparing
institutions and outcomes over time and across countries. These case studies were expected
to generate practical policy lessons for improving export promotion arrangements in MENA
countries. This study focus was on the following set of variable – (i) indicators of export
performance, (ii) level and variances of export incentives, (iii) measures of institutional
export orientation, (iv) measures of administration capability, and (v) indicators of macro-
economic instability.
38 Esfahani, hadi salehi, “Institutional Requirements of Successful Export Promotion in MENA Countries”,University of Illinoies, (Time Frame 20 Months), Fourum, Vol. 6, No.1 April 1999

48
Arvind Virmani (2000)39 was one of the key members of Manmohan Singh’s team that put
together the economic reforms package of the early 1990s and followed through with its
implementation. Some of the articles written by him during this period have been collected
in the book titled ‘Accelerating Growth and Poverty Reduction’. The book contains 18
essays on aspects of economic growth and poverty reduction. One of its part has covered
external sector, FDI and policies to mitigate the effect of capital inflow surge. Virmani cited
the myriad of controls inhibiting economic growth and the inability of the old policy regime
to provide higher economic growth as important reasons why the old paradigm needed to ne
abandoned. Virmani formulated a rationale for the new paradigm based on the pillars of
liberalization and enlightened Government policy along with adequate safeguards in the form
of countervailing power and regulatory structures. Beside the above research works, other
research studies taken were:
(a) S.S. Mehta (1988) – ‘India’s Foreign Trade, Performance and policy Options for
90’s to inject an element of realism.
(b) Eric Gonsalves’s work on ‘Some thoughts on India’s Export Strategies’ – July –
Sept. 1986.
(c) An overview of Lina Seminar (with UNCTC 1-4, Feb. 1988) on “Servies and
Development – The role of FDI and Trade’ explaining the complexity of service sector
by taking Brazilian and Andean case study.
(d) Brij Mohan(1990) did research on “Effectiveness of export incentives measured in
India”. According to him, the export sector has remained the holy cow and no country is
there which has not used incentives for export orientation.
39 Jha, Ragbendra, ‘Reforms and Growth’, Economic and political Weekly, July 3, 2004, p.2975

49
(e) M.R. Czinkota; Export Development Strategies; US Promotion Policy(1982) on
strategies used by US to boost exports.
(f) R.K. Bhatia on ‘Exports and Growth: An absorption approach in Indian
case’(1979).
(g) Studies conducted by International Trade Centre.
Dr. Neelam Dhanda (2003)40 in his article in the journal Yojana has highlighted that Project
exports have occupied an important place in India’s export portfolio, particularly after early
seventies when the construction sector in the oil exporting region Middle East underwent a
spurt of activity. The government has initiated several measures to encourage project exports.
Ravindra H Dholakia (2003)41 the article titled “Export of Agri – Products from Gujarat:
Problems and prospects” that focus on the analysis and resolutions of managerial and
academic issues based on analytical and empirical or case research. Like most other states,
Gujarat has also prepared several reports and policy paper papers assessing the potential for
agro – processing, identifying constraints in the developing and exports of agri – products,
suggesting or announcing several important policy measures for removing physical and
financial infrastructural bottlenecks, and promising R&D activities in the sector. However
the exercise is realistic assessment of the potential, important features of agri – exports fro
the state, and Gujarat’s comparative advantage over the rest of the country in specific product
categories.
40 Dhanda Neelam, “Performance of Indian Project Exports”, yojana ,July 2003 41 Rajiv Jha “A Model of Export and Investment in an open Developing Economy”, Economic and political Weekly, March 4, 2006, p.820-825.
50
K. Jayachanderan (2003)42 in the research thesis title “Utilization of Export incentives by
Exporter in Tamil Nadu” has focused on the motivation value of Export incentives by the
exporters. It also deals with the procedural aspects of the utilization of export incentives. The
methodology adopted is secondary and primary data, statistical tools to be used in the study
are percentage analysis, mean, standard deviations, co-efficient of variation, Chi – square
test, Z – test, and t – test. The utilization of the export incentives by the exporters in Tamil
Nadu has improved the export in particular.
Sethurajan (2003)43 in the research thesis titled “A Study on Export Marketing of Cotton
Yarn in Coimbatore District” investigated the direction and pattern of export of cotton yarn
by cotton textile mills in Coimbatore district. It also shows the textile mills relating to export
of cotton yarn. It has also examined the procedure related to the export to the export of cotton
yarn. The methodology adopted is secondary and primary data, period of the study is ten
years. Stratified random sampling technique has been adopted. This study has facilitated to
improve the marketing of cotton yarn in Coimbatore district.
Asherf Illiyan (2004)44 in his research article reflects the increased acceptability of Indian
engineering product in international market, aggressive marketing strategy, entry into new
market, promotional role of Engineering Export Promotional Council and more liberal
policies of the government especially after 1991, etc. Moreover, it is observed that
engineering exports have registered as much as higher annual average growth rate than total
42 Jeyachandran.K, Utilization of Export incentives by Exporter in Tamil Nadu, Ph. D. thesis submitted to Allagappa University, Karaikudi, 2003. 43 Sethurajan, “A Study on Export Marketing of Cotton Yarnin Coimbatore district, Ph.D thesis submitter to Allagappa University, Karaikudi, 2003 44 Asherf Illiyan ,”Progress and Prospects of Indian Engineering Goods Exports”,Foreign Trade Review ,2005, p.64-84.

51
all India exports in all most all decades. The importance of capital goods and management
and consultancy services has gone up.
Rajiv Jha (2006)45 in the paper titled “A Model of Export and Investment in an open
Developing Economy” develops a model that privileges exports as the key element of
demand: not only do export permit the exploitation of scale economies by enlarging the size
of the market served by domestic producers but also lead to the effective use of the relatively
abundant factor, i.e. labor. The development literature has further emphasized the fact that
exports are instrumental in inducing investment because of incentive they provide to
introduce new techniques through additions to the capital stock. The model introduces
somewhat different export and investment equation in an otherwise traditional Keynesian
model. Export lead to investment, which stimulates growth. However the commodity
composition of a developing economy’s exports implies that exports are a function of the real
exchange rate. An increase in the real exchange rate (depreciation) while stimulating exports
and thus growth, however, leads to an erosion of the real wage share because of a price rise
through imports. The steady state can be interpreted as a balance of these two force - an
exchange rate depreciation leads to growth through an increase in exports but simultaneously
causes a cutback in government expenditure to maintain a floor wage share, impeding the
growth process.
Jomo Kwame Sundram (2009)46 in the article titled “Export – Oriented Industrialization,
Female Employment and Gender WAGE Equity in East Asia” investigated if export growth
45 Rajiv Jha “A Model of Export and Investment in an open Developing Economy”, Economic and political Weekly, March 4, 2006, p.820-825. 46 Sundram Kwame Jomo, “Export – Oriented Industrialization, Female Employment and Gender WAGE Equity in East Asia” Economic and political Weekly, Jan. 3, 2009, p.41-48.

52
in manufacturing in East Asia led to a removal of labor market rigidities and institutional
biases of gender – based discrimination as commonly argued. It challenges the orthodox
perspective by looking more closely at industrial employment in the region by gender.
Gender discrimination in the region’s labor market seems to have survived economic
liberalization, with the large gender wage gaps characteristic of the region not closing despite
rapid growth and full employment, sometimes even becoming larger in some of the more
developed economies in the region.
GAP OF THE STUDY
Luminaries like A. John Raven (viz. Streamlining the export process, 1980), Bhagwati
and Srinivasan (Foreign Trade Regime and Economic Development, 1972), Manmohan
Singh (Export Trade Policy and Economic Development), N. Vittal (Free Trade Zones and
export strategy, 1977). Deepak Nayyar (India’s Exports and Export policies in the 1960s,
1976). R.L. Varshney and B. Bhattacharya (International Marketing Management_ an Indian
perspective; 2002), Kelkar and Sharma (Trends and determinants of India’s export
performance, 1976). J.R. Rao (Trends in India’s Export performance and Export and Export
promotion measures, 1980) and P.K. Khurana (Export Management) and Sanjay Lall have
done commendable work on Indian exports. Institutions like Exim Bank, ECGC, IIP, IIFT,
etc. have also conducted researches on related aspect. However, specific focus on
institutional support did not get adequate attention so far. However, specific focus on
efficacy of Exim Bank of India as premier developmental financial institution in all aspects
has not been studied so far. Hence, this study has been taken up to project Exim Bank’s
contribution towards the economic growth of India.

CHAPTER III
PROFILE OF EXPORT – IMPORT BANK OF INDIA
(EXIM BANK)
3.1 GENESIS OF EXIM BANK OF INDIA
3.2 PROJECT AND SERVICESS EXPORTS
3.3 FUND BASED FACILITIES
3.5 NON-FUND BASED FACILITIES
3.6 EXPORT CAPABILITY CREATION PROGRAMMES

53
CHAPTER III
PROFILE OF EXPORT – IMPORT BANK OF INDIA
(EXIM Bank)
This chapter narrates how the international competitiveness alert the financial
institutions to ensure sustenance and a breif out line about the genesis and functioning of
Exim Bank of India
The globalised world economy in the post-WTO era has been increasingly
characterized by dismantling of protective barriers to trade and investment. While
increase in trade opportunities in global markets would necessitate external
competitiveness, opening of economies to global trade would entail reduction in
protective barriers in the domestic trade areas, resulting in the need for countries to
enhance their domestic competitiveness concomitantly. In such a scenario, the ability to
compete in both domestic and world market would depend on a country’s relative
competitive strength vis-à-vis other nations.
In this context, international competitiveness would encompass higher exports,
diversifying the export basket, sustaining higher rates of export growth over time,
upgrading the technological skill content of export activity, and expanding the base of
domestic firm, which are able to compete globally, as well as in the domestic market.
Fostering international competitiveness and there by sustaining long run growth
would entail, inter ail, technological progress, innovation and human skill development.
In today’s world and more so in the years ahead, competitive strength of countries would
increasingly depend on the strategic behavior of firm in adapting to the changing
environment and building up core competencies on the lines of comparative advantage.
54
Meeting the challenges on the policy front also assumes importance in a global
economy, as the competitiveness and efficiency of firms is facilitated by the nature of
policy environment under which firm operate, and whether macroeconomic policies
allow them to achieve the requisite economies of scale and allocate efficiency in
production. Growth strategies of developing economies, therefore, should be based upon
policies which ensure internal and external stability in the economy, through maintaining
sustainable policies and putting in place a proper safeguard system against adverse
international shocks and limiting exposure to risks.
Building up competitiveness is a high priority for both developed and developing
countries. Given the dynamic changes charaterising key industries and the rising
competition among countries, the need for countries to continuously move up the value
chain and improve the attractiveness out of their vocational advantages is a challenging
task for policy makers in developing countries. Competitiveness, both domestic and
international, is important and challenging and should be seen not as an end in itself but
as a means to an end – which is economic development.
3.1 GENESIS OF EXIM BANK OF INDIA
An act of parliament setup the export – import bank of India is September 1981.
It commenced operations in March 1982. The government of India wholly owns this
bank. The bank was set up for the purpose of financing, facilitating and promoting
foreign trade in India. EXIM bank is the principal financial institution in the country for
coordinating working of institutions engaged in financing of exports and imports.
Organization of Exim bank can well be understood as given in below representation.

55
The major functions of the EXIM Bank are grouped as follows:
3.1.1 Export Credits
The bank provides exports of Indian machinery, manufactured goods and consultancy
services on deferred payment terms. It also makes available lines of credit/buyer’s credit
to overseas entities, i.e. governments, central banks, commercial banks, development
finance institutions, regional development banks etc for financing export of goods and
services from India. Export credits include project finance and trade finance.
Procedural flow chart

56
1. Exim Bank signs agreement with Borrower and announces when effective.
2. Exporter checks procedures and Service fee with Exim Bank and negotiates
contract with Importer.
3. Importer consults borrower and signs contract with exporter.
4. Borrower approves contract.
5. Exim Bank approves contract and advises borrower and also exporter and
commercial bank.
6. Exporter ships goods.
7. Commercial bank negotiates shipping documents and pays exporter.
8. Exim Bankreimburses Commercial bank on receipt of claim by debit to
borrower.
9. Borrower repays Exim Bank on due date.
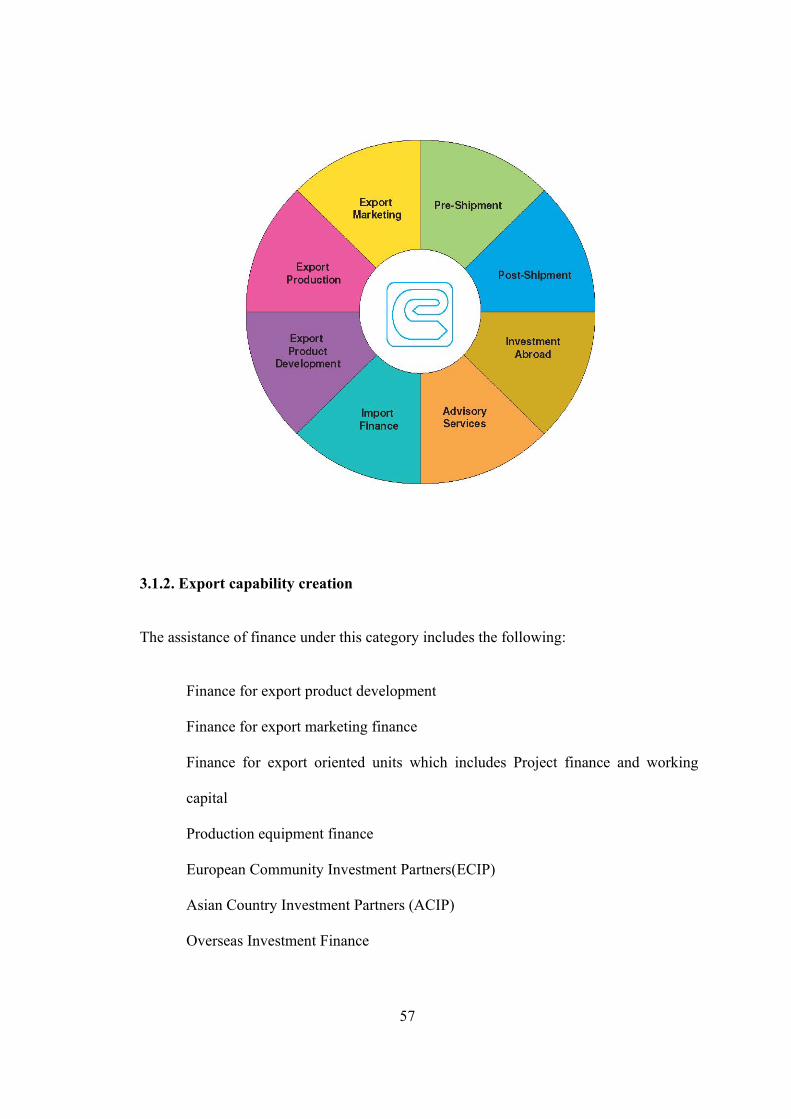
57
3.1.2. Export capability creation
The assistance of finance under this category includes the following:
Finance for export product development
Finance for export marketing finance
Finance for export oriented units which includes Project finance and working
capital
Production equipment finance
European Community Investment Partners(ECIP)
Asian Country Investment Partners (ACIP)
Overseas Investment Finance
58
Export Facilitation Programmes
Software training institutes
Minor Port Development
3.1.3. Export Services
In addition to finance, bank provides a range of information and advisory services to Indian
companies to supplement their efforts aimed at globalization of Indian business.
Supporting Groups
Planning and research
Accounts/MIS?EDP
Legal
Coordination
HRD
Establishment
3.2 PROJECT AND SERVICESS EXPORTS
Under section 47 of foreign Exchange Management Act, 1999, RBI has issued the following
guidelines:
3.2.1 The Types of Exports Covered
a. Export of goods on Deferred Payment Terms
b. Turnkey Projects
c. Construction projects
d. Consultancy & Technical Services
59
In terms of regulation 9 of the foreign exchange management act 199, the amount
representing the full export value goods exported must be realized and repatriated within 6
months from the date of export. Export where there is more than10 percent of the value is
realized beyond the prescribed period, i.e. 6months from the date of shipment are treated as
Deferred Payment Exports.
While dispersing the pre-bid clearance of project export proposals, RBI advises
exports to ensure, in their own interest, that conditions laid down in memorandum PEM for
submission of bids are compiled with. Project exporters, at the time of submission of
bids/offers for execution of projects or export contract overseas, seek in principle
commitment from EXIM Bank and other banks for post award facilities to ensure tie up of
facilities. Exim Bank issues guarantees required for execution of project export contract
through overseas bank or favouring overseas clients.
Exporter submit application in prescribed form along with copies of contract through
its commercial bank for post - award Clearance. Exporters can directly approach EXIM Bank
for proposals of value limit up to Rs 200 crores. On receipt of application and contract copies
from the commercial bank, EXIM Bank approves the proposal if the same falls within the its
delegated powers or convenes Working Group meeting.
In approved cases, Exim bank/working group, final approvals for fund based and non
fund based facilities are granted by concerned institution and export banks.
3.2.2 Clearance of Export Proposals – criteria
These include the following:
a. Exporter’s financial position, track record

60
b. Status of overseas client—Government/private
c. Break-up of contract value—Indian/Third country/Local
d. Risk assessment by of buyer’s country
e. Estimate of cost and profitability
f. Currency of Payment—Convertible Currency/Local currency
g. Security including Letter of Credit, Bank Guarantee, Government
Guarantee, Externalisation undertaking of central bank.
h. Foreign Exchange Outgo, and
i. Facilities required by the exporter.
3.2.3Clearance of Export Proposals—Appraisal factors
a. Payment terms include Advance Payment, Progress/Down Payment, Deferred
Payment, retention Money
b. Security including Letter of Credit, Bank Guarantee, Government Guarantee,
Externalisation undertaking of central bank.
c. Availability of ECGC cover, where necessary
d. Important contractual clauses:
• Pre – shipment Inspection
• Arbitration

61
• Force Majeure
• Status of exporter is prime contractor/sub contractor/consortium member
• Penalty/liquidated Damages for delay in contract execution
• Price escalation
62
A. Funded schemes of financing
EXIM Bank provides the following sources of assistance:
1. Lines of credit
2. Suppliers credit
3. Overseas buyer’s credit
4. Loan under Financing Rupee Expenditure for Project Export contracts
(FREPEC) programme.
5. Pre shipment Credit
6. Refinance of Export Loans
7. Forfaiting
B. Non – Funded schemes of financing
1. Bid Bond
2. Advance Payment Guarantee
3. Performance Guarantee
4. Guarantee for release of Retention Money
5. Guarantee for raising Barrowing overseas
6. Other Guarantees

63
7. Confirmation of letter of credit under the Trade Facilitation Program of the
European Bank for Reconstruction and development.
3.3 FUND BASED FACILITIES
3.3.1 LINES OF CREDIT
a. Adequate security by way of acceptable letter of credit and/or guarantee from a bank
in the country of import or any third country is necessary, as per RBI guidelines.
b. Period of credit is determined for each proposal having regard to the value of
contracts, nature of goods covered, security and competition. Repayment period for
suppliers credit facility is fixed coinciding with the repayment of post-shipment credit
to exim bank as per agreed repayment schedule, irrespective of whether or not the
overseas buyer has paid the Indian exporter.
Utilization of credit : EXIM bank enters into suppliers credit agreement with Indian
exporter as also with exporters commercial bank in the event of the latter’s participation in
the suppliers credit. The agreement covers details of draw down repayment and includes
an affirmation by the Indian exporter that repayment to exim bank would be made on
due date, regardless of whether due payment have or have not been received from overseas
buyer have not been received from overseas buyer. Commercial bank negotiates export
document and seeks reimbursement of suppliers credit amount. Commercial bank seeks
reimbursement of suppliers credit from EXIM.
The exporter repays principal amount of credit to exim bank as per agreed repayment
schedule. Interest amounts are payable to exim bank half-yearly without any moratorium.
RBI has laid down guidelines for project exports and exports of goods from India on deferred

64
payment terms. RBIs guidelines relating to project export contracts are contained in
memorandum PEM published by RBI. It is priced publication and available at any time of the
regional offices of RBI throughout India.
3.3.2 Overseas buyers credit
Under this type of facility credit is offered directly to overseas buyers for a specific
project/contract.
3.3.2.1 FREPEC
This programme Financing Rupee Expenditure For Project Contracts (FREPEC),seeks to
provide for expenses incurred by Indian companies. The purposes of this credit is to enable
Indian project exporters to meet rupees expenditure incurred/required to be incurred for
execution of overseas project export contracts such as for mobilization/purchase/acquisition
of materials and equipment, mobilization of personnel, payments to be made in India to staff,
sub-contractors, consults and to meet project related overheads in India rupees.
Indian project exporters who are to execute project contracts overseas secured on cash
payment terms or those funded by multilateral agencies will be eligible for this type of
facility. The purpose of the new lending programme is to give boost to project export efforts
of companies with goods track record and sound financials.
As to the quantum of assistance extended under this programme, it will be up to 100 percent
of peak deficit as reflected in the rupee cash flow statement prepared for the project. Exim
bank will not normally take up cases involving credit requirement below rs.50 lakhs.
Although, no maximum amount of credit is being proposed., while approving overall credit
limit, credit-worthiness of the export=borrower would be taken into account. Where feasible
credit may be extended in participation with sponsoring commercial banks.
65
Disbursement is made under this programme in rupees through a bank account of the
borrower-company against documentary evidence of expenditure incurred, accompanied by a
certificate from chartered accountant. Repayment of credit would normally be out of project
receipts. Period of repayment would depend upon the project cash flow statement, but will
not exceed 4 years from the effective date of project export contracts. The liability of the
borrower to repay the credit and pay interest and other monies will be absolute, and will not
be liability of the borrowers to repay the credit and pay interest and other monies will be
absolute, and will not be dependent upon actual realization of project bills.
As regards security, hypothecation of project receivable and project moveable are
considered. Where available, personal guarantees of directors of the company is also
considered. The facility is available through collateral security and where cost is not
prohibitive or where the borrower- company is prepared to bear the cost, packing credit
guarantee of ECGC may be obtained.
3.3.2.2 Pre-shipment Rupee Credit
Pre-shipment rupee credit is extended to finance temporary funding requirement of export
contracts. This facility enables provision of rupee mobilization expenses for
construction/turnkey projects. Exporters could also avail of pre-shipment credit in foreign
currencies to finance cost of imported inputs for manufacture of exports products to be
supplied under the projects. Commercial banks also extended this facility for definite periods.
3.3.3 Refinances of Export Credit
Authorized dealers in foreign exchange can be obtain from exim bank, 100 percent refinance
of deferred payment loan extended for export of eligible Indian goods.
66
3.3.4 Forfaiting – An Export Finance Option
Forfaiting is a mechanism of financing exports by discounting export receivables evidenced
by bill of exchanges or promissory notes without recourses to the seller carrying to long term
maturities on a fixed rebate basis up to 100 percent of the contract value.
The word ‘forfait’is derived from French word ‘a forfait’ which means the surrender of
rights. Simply put, forfaiting is the non-recourse to him, his rights to claims for payment on
goods delivered to an importer, in return for immediate cash payment from a forfaiter. As a
result, an exporter in India can convert a credit sale into a cash sale, with no recourse to the
exporter or his banker.
3.3.4.1 OPERATING PROCEDURE OF FORFAIT TRANSACTION
The operating mechanism for a forfait transaction is outlined below:
A negotiation: Indian exporter initiates negotiation with prospective overseas buyer with
regard to order quantity, price, currency of payment, delivery period and credit terms.
b. approaching exim banks : exporter approaches exim banks to obtain an indicative
forfaiting quote from the forfaiting agency. For this purpose, the exporter is required to
provided the abovementioned details.
c. indicative quotas : exim bank obtains indicative quotas of discount, commitment fees and
documentation fees if any, and communicates these to the exporter.
d. contract finalization : exporter finalizes the terms of the contract with the buyer. The final
export offer must be structured in a manner which ensures that the amount received in
foreign exchanges by the exporter after payment of forfaiting discount and other fees is
equivalent to the price which he would obtain if goods were sold on cash payment terms. If

67
the terms are acceptable to the overseas buyer, the Indian exporter informs exim banks
accordingly and requests the banks to obtain a firms quote from the forfaiting agency.
e. firm quotes: exim banks obtains a firm quote from the following agency and conveys this
information to the exporter and his authorized dealer, with a request to the exporter to
confirm acceptance of the forfaiting terms within a specified time limit.
f. confirmation :Indian exporter confirms acceptances of forfaiting terms to exim banks. The
exporter will enter into a commercial contract with the overseas buyer and also execute a
forfaiting contract with the forfaiting agency through exim banks.
g. certificate: on execution of the forfating contract exim bank issues a certificate to the
exporter with a copy to the authorized dealer, regarding the commitment fee to the be paid by
the exporter to the forfaiting agency. This certificate will enable the export to remit
commotment fees to the forfeiting agency, in accordance with the schedule indicated in the
forfating contract. In terms of the reserve bank of India guidelines governing forfeiting
contracts, commitment fees will be regard as being analogous to bank charges , and will not
be required to be mentioned in GR form or shipping bill prepared by the exporter, subject to
the commitment fee not exceeding 1.5 percent of the contract value.
A certificate to the detailing the discount payable to the forfeiting agency to enable the
Indian customs authorities to verify deduction towards forfeiting discounts declared by the
exporter on GR form and hipping bill.
h. shipment : the Indian exporter ships the goods as per the schedule agreed with the overseas
buyer. The forfeiting transaction will be reflected in the following three documents
associated with an export transaction as stated below.
68
Invoice forfaiting discount, commitment fees, etc, need be shown separately; instead,
these could be build into the FOB price, stated on the invoices.
Shipping bill and GR form details of the forfeiting costs will be included along with
the other details such as FOB price, commission, insurance, normally included in the
“analysis of export value” on the shipping bill. The claim for duty drawbacks if any,
will be certified only with references to the FOB value of the exports stated on the
shipping bill.
i . Availed bills and notes the export contract will provide for the overseas buyer to furnish
availed promossiory notes. If the contract note provides for the bills of exchange, the
exporter will withdraw a series of bills of exchange and send them to along with shipping
documents to his banker for presentation to importer, for acceptance through the latter’s
banker will hand over the shipping documents to importer against acceptance of bills of
exchange by the importer and the signature of the avail. Availed and accepted will be
returned to exporter through his banker. Exporter will endorse availed bills of exchange with
the words “without recourse” and forward them through his bank to exim bank, which in turn
will send them to the forfaiting agency.
j. Payment The forfaiting agency effects the payment of the discounted value, in
accordance with EXIM bank’s instruction after verifying the avail’s signature , and other
particular. Normally, exim bank will direct the forfaiter to credit the payment to the nostro
account of the exporters bank in the country where the forfaiter is based. The bank receiving
the discounted proceeds will arrange to remit the funds to India. The exporter will be issued a
certificate for foreign inward remittance. The GR form will also be released. The export
contract, which provides for more than one shipment can also be forfaited under a single

69
forfaiting contract. However, where the export is affected in more than one shipment, availed
promisssory notes/bills of exchange in respect of each shipment could be forfaited, subject tp
the minimum value requirements laid down by the forfaiter.
h. presentation on maturity of the bills of exchange/ promissory notes, the forfaiting agency
presents the instruments to the avail for payment.
3.5 Non-fund based facilities
The non-fund based facilities extended by the Exim bank takes the form of guarantees
provided directly or in participation with other banks, for project export contract following
are the various non-fund based facilities offered by the Exim bank.
a. bid bond bid bond is generally issued for a period of six months.
b. advance payment guarantee exporters to secure a mobilization advance of 10-20 percent
of the contract value, which is normally released against bank guarantee and is generally
recovered on a pro-rata basis from the progress payments during project execution.
c. performance guarantee performance for 5- 10percent of contract is issued, valid up to
completion of maintenance period normally one year after completion of contract period and
or grant of final acceptance certificate (FAC) by the overseas employer. Format of guarantee
is expected to be furnished by exporter, at least four weeks before actual issue, to facilitate
discussions for formal approval.
d. guarantee for release of retention money this enables the exporter to obtain the release of
retention money (normally 10 percent of contract value) before obtaining final acceptance
certificate (FAC) from client.
e. guarantee for raising borrowings overseas bridges finance may be needed at the earlier
phases of the contracts to supplement the mobilization advances. Bridges finance up to 25
70
percent of the contract value may be raised in foreign currency from an overseas bank against
this guarantee issued by a bank in India. Request for overseas borrowings must be supported
by currency wise cash flows, also indicating the outstanding letters of credit and L/C drawl
schedule.
f. other guarantees the Exim bank of India in lieu of customs duty or security deposit for
expatriate labor grants other guarantees. Guarantee commission is charged at rates stipulated
by the Foreign Exchange Dealers Association of India (FEDAI) or as stipulated by guarantee
issuing bank. Banks generally waive margin requirement for issue of guarantee for export
performance guarantee. However, appropriate securities are availed of.
The proposal is to be submitted in the prescribed application form along with
implementation schedule, currency-wise cash flows and write-up with regard to site and
infra-structural condition, and sub-contracting arrangements envisaged. In case of non-
government buyer, status report on the client/prime contractor would first need to be
obtained. The completed application are to be submitted to be submitted to the sponsoring
bank, for consideration, within fifteen days of entering into contract. It would also be
necessary to consult ECGC in advance in cases where corporations insurance cover and or
counter guarantees are required.
3.6 Export capability creation programmes
The Exim banks operate the following programmes for creating export capabilities:
1. Lending Programs for Export Oriented Units
2. Production Equipment Finance Program
3. Overseas Investment Finance Programs

71
4. Equity Investment in Indian Venture Abroad
5. Asian Countries Investment Partners Programs
6. Export Marketing Finance Programs
7. Export Product Development Programs
8. Export Vendor Development Programs
9. Programs For Export Facilitation
10. Foreign Currency Pre-Shipment Credit
11. Working Capital Term Loan Programs For EOU’s
12 Bulk Import Finance
13. Finance for Research and Development for EOU’s
14. Long Term Working Capital
15. Import Finance
3.6.1 Lending Programs for Export Oriented Units
The objective of this lending program is to create and enhance export capabilities of Indian
companies. Eligible companies include units set up/proposed to be set up in export
processing zones, units under the 100 percents Export Oriented Units Scheme, units
importing capital goods under promotion capital goods scheme, units undertaking
expansion/modernization/ up-gradation/diversification programmes of existing export
oriented units with export orientation of minimum 10 percent or sales of Rs.5 crores per
annum whichever is lower.
The lending programs take the form of term loans in Indian rupees/foreign currency. In
addition deferred payment guarantee for import of capital goods also form a part of it. As to
the interest rates, rupees term loan linked to banks minimum lending rates whereas foreign

72
currency term loans is at floating or fixed interest rates based on banks cost of funds. Interest
is payable semi-annually on reducing balances. Interest tax is as applicable. Services fee of
one per cent of loan payable upfront. Repayment period is up to ten years, based on projected
cash flows inclusive of suitable moratorium.
As regards security, appropriate charge on fixed assets of the company’s/ project plus any
other security acceptable to Exim banks is applicable. Finance can be accessed by way of the
bank having preliminary discussions with the promoters to determine scope for Exim banks
finance. To facilitate discussions, project profile identifying financial requirement needs to
be sent to the bank. Exim bank offers comprehensive package to externally oriented
companies by way of finance, information, and value added services.
3.6.2Production equipment finance program (PEFP)
Under the production equipment finance program, exim banks seeks to finance non-project
related capital expenditure of export-oriented units. PEFP is structured as an arrangement
under which various equipment, imported and indigenous, can be financed thus obviating the
need to arrange finance for every such procurement. It is not necessary to identify specific
equipment sought to be financed at the time of application; this could be done at the time of
disbursement. PEFP is a fast-disbursing window available to export oriented units.
Companies with good track record and financially sound are eligible for assistance.
Existing export oriented units with minimum export orientation (present or targeted) of 10
percent of total sales or Rs.5 crores in values whichever is lower are eligible. The facility is
granted by way of term loan in Indian rupees/foreign currency. As regards interest rates,
rupees term loan linked to banks minimum lending rates and foreign currency term loan at
floating rates or fixed interest rates based on banks cost of funds. Interest is payable semi-

73
annually on reducing balances. Interest tax is payable as applicable. Services fee of one
percent of loan amount payable upfront. The facility is available up to one year from the date
of sanction. Ten percent margin is maintained.
As regards security, hypothecation of equipment, plant and machinery financed by the bank
is the popular mode of security. Additional security by way of personal guarantee, any other
assets of borrowers company, corporate guarantee of group company/parent company and
appropriate charge on any other security on a case to case basis is also in vogue. Finance can
be accessed with preliminary discussions with the promoters to determine scope for exim
banks term finance under PEFP.
3.6.3 Overseas investment finance
This includes lending programs for overseas joint ventures/wholly owned subsidiaries by
Indian companies. The objective to finance by way of equity loan to Indian companies for
settings up of overseas joint ventures wholly owned subsidiaries. Any Indian promoter
making equity investment in an existing company or a new project overseas with the
requisite approval for such investment from the Reserve Bank Of India(RBI) / government of
India as also from the government and other concerned authorities in the host country is
eligible for this financing.
Government guidelines following are the guidelines issued by the government of India is
regard to this type of financing:
a. proposals for setting up JV/WOS abroad require approval of the RBI in accordance with
the guidelines for Indian direct investment in JVs, abroad notified by the government of
India, Ministry of commerce.
74
b. proposals for direct investment in a JV/WOS abroad form a company will be eligible for
automatic approvals by RBI provided the total value of the investment by the Indian
company does not exceed U.S.$15 million in respect of Indian investment in SAARC
countries and total value of investment does not exceed U.S.$ 30 million in Myanmar; in
respect of Indian rupees investment in Nepal and Bhutan, total value of investment does not
exceeds Rs.120 crores. The amount of investment is up to 25 percent of annual average
export earning of the company in the preceding three years. The amount of investment is
repatriated in full by way of dividends, royalty, technical service fee, etc within a period of
five years
c. proposals involving investments beyond U.S.$ 4 million but not exceeding U.S.$15
millions or those not qualifying on the basis of the applicable criteria outlined above will be
processed in the RBI through a special committee appointed by RBI. A technical appraisal
could preferably accompany such proposal by any one of the designated agencies (including
exim banks). Large investments proposals for overseas investment in exceeds of U.S.$15
millions will be considered if the required resources beyond U.S.$ 15 million are raised
through the GDR route. Up to 50 percent of the GDR resources require may be invested as
equity in overseas JV/WOS subject to specific approval of the government. Application for
investment beyond U.S.$ 15 million would be received in the RBI and transmitted to the
ministry of finance for examination with the recommendation of the special committee. For
investment out of EEFC, Authorized dealers would grant permission balances up to a
maximum of U.S.$ 15 million.
As to the mode of overseas investment, Indian companies are allowed to invest equity
in overseas joint ventures/wholly, owned subsidiaries by way of capitalization of export

75
proceeds of plant and machinery, technical knowhow, fee, royalty, and forex remittance of
equity contribution. The assistance is available in the form of rupee term loan to Indian
companies for financing their equity investment overseas, rupees term loan for lending
further to their overseas joint venture/wholly subsidiaries, guarantee for raising finance
overseas for equity investment and for working capital requirement for overseas joint
venture/wholly subsidiaries. As regards interest rate rupee term loan is linked to bank
minimum lending rate and foreign currency term loan is floating or fixed rates based on
banks cost of funds. Interest is payable on reducing balances at half yearly rates. Additionally
interest tax as applicable will be payable.
As regards margin, it is 80 percent of the Indian company’s equity contribution in
overseas JV/WOS. Exim banks finance will be secured by an appropriate charge on the
borrowers assets in India and/ or any other security acceptable to exim bank, pledge of
borrower’s shares of Indian promoter companies. In addition, an overseas investment
insurance policy can also be obtained by the company from ECGC/MIGA and assigned in
favor of exim bank. In case of assistance by way of guarantee, counter guarantee from India
promoter company will serve as security.
Refinance to commercial banks exim banks provide 100 percent refinance to
commercial banks in respect of rupees term loans extended by them to Indian promoter
company for equity contribution in overseas JV/WOS. As per prevailing RBI guidelines,
commercial banks can consider loan for equity investment only under exim banks refinance
scheme. Finance can be accessed on preliminary discussions with the promoters to determine
scope for exim banks finance. To facilitate discussions details on project profile identifying
financial requirement should be sent.

76
3.6.4 Equity Investment in Indian Ventures Abroad
The objective of this program is to catalyze overseas investment by the Indian companies
to enhance visibility of Indian overseas ventures. Quantum of exim banks equity
participation will be up to 25 percent of equity capital of the JVs involving Indian companies.
This is subject to a ceiling U.S.$ 5 million per proposal. As weightage will be giving to the
following factors:
• Background and track record of Indian and foreign promoters
• Synergy of overseas operations with business in index
• Financial viability and technical feasibility
• Return on exim banks investment
• Benefits to India in terms of trade enhancement, technology transfer, foreign
exchange earnings, etc.
• Spin-off benefits such as brand marketing and penetration of new markets
• ‘EXIT ROUTE’ for exim banks equity investment (which could take place within 5
years from the date of investment. exim banks equity may be offloaded to Indian
promoter, other interested Indian companies, stock exchange in host country etc.)
• Buyback arrangement between exim banks and Indian company
• Exim bank welcomes discussions with Indian Promoter Company seeking exim
banks equity participation in their overseas joint venture.
77
3.6.5 Asian countries investment partners programme (ACIP)
The objective of this lending program is to promote joint venture in India between India
companies from Asian countries through four facilities that address stages of the project
cycle. ACIP seeks to catalyze investment flows into India by creation of joint venture in
India between Indian companies and companies from East Asian countries. ACIP is proposed
to be a funding instrument providing finance at various stages of a joint venture project cycle
viz. sector study, project identification, feasibility study, prototype development, set up , and
technical and managerial assistance. Finance is available for identification of potential joint
venture project and partners, and operations prior to launching a joint venture like pilot plant-
feasibility study. Project expenditure covers human resources development, training and
management assistance. The beneficiaries of this program are chambers of commerce,
industrial/investment promotion agencies and other eligible bodies. Indian companies
seeking joint venture companies set up under ACIP and joint venture companies set up under
ACIP. The instruments of assistance include grant, soft loan and term loan. Assistance could
be accessed through preliminary discussions with the promoters to determine scope for exim
banks finance.
3.6.6Export marketing finance programme
The objective of this program is to create and enhance export capabilities and
international competitiveness of Indian companies. Under the lending programme for export
marketing finance, the bank addresses the term finance requirement for a structural and
strategic export marketing and development effort of Indian companies. Eligible companies
include companies who have a strategic international marketing plan. Further, companies
should have established presence in the domestic market and satisfactory financials. The

78
activities eligible for assistance are activities associated with export marketing and export
capability creation. Typically activities eligible for finance under this programme are
desk/field research, minor product adaptation, overseas travel, training quality certification,
product launch, investment in machinery and equipment, testing/quality control equipment,
and factory premises.
Assistances takes the form of term loan in Indian rupees/ U.S Dollar. As regards, interest
rates, rupees term loans are linked to exim banks minimum lending rate and foreign currency
term loan are linked floating or fixed interest rate. Additionally interest tax applicable will be
payable. Services fee of one percent of loan amount sanctioned, is payable upfront and is
non-refundable. Repayment period up to five years inclusive of moratorium is allowed. The
margin is 20 percent. The security includes hypothecation of moveable fixed assets of the
company, mortgage of immovable fixed assets of the company or any other security
acceptable to exim banks. Banks welcomes preliminary discussions with the promoters to
determine scope for exim banks financing arrangement.
3.6.7Export product development programs
The objective of this program is to support systematic export product development plans
with focus on industrialized markets. Eligible companies include established export
enterprises with product development programme dedicate to export. The company must
also have an established track record and satisfactory financials. The activates eligible for
assistance include product design and development activities, research and development
activates including cost of manufacturing of prototypes and development, pilot plants,
product testing , development of tooling’s, jigs and fixtures, process development cost, and
product launch. Assistance is granted in the form of rupees term loans on soft term basis.

79
Interest rates will be decided on case- to case by way of first charge on the fixed assets of the
borrower and any other security as may be considered appropriate on the merits of the case.
Banks welcomes preliminary discussions with the promoters to determine scope for exim
banks finance; to facilitate discussions, details about the project identifying financial
requirement should be sent to the exim bank.
3.6.8 Programme For Financing Export Vendor Development (EVD)
The objective of the program is to finance export strategic vendor development plans for
export companies with a view to enhancing exports through creation and strengthening of
backwards with vendors. Eligible companies are export companies and trading houses,
manufacturer-exporters with satisfactory track record and financial. In addition, companies
with strategic plans for vendor development for exports are eligible to seek finance under this
programmes. Companies purchasing finished, semi-finished or intermediate products from
vendors with the exporters adding value to the product in the form of further processing or
marketing them are also eligible for assistance.
The eligible activities are those undertaken by exporters to develop and upgrade vendors
that will lead to export additionally are eligible for finance under EVD. Example of such
activities includes acquisition of production machinery, purchase of tooling, moulds, jigs,
dies and ancillary equipment, core working capital assistance extended by exporter to
vendors ’soft ’ expenditure on vendor development such as vendor training, technical
assistance to vendor, etc. assistance is available in the form of rupees term loans including
soft loan component. As regards interest rates, they are linked to banks minimum lending
rate. As regards soft loans the rate applicable is 7.5 percent p.a(subject to change) subject to
maximum of Rs.50 lakhs. Repayment period is up to 7 years with a margin of 20 percent.

80
Security for the loan is first charged on the borrower company’s assets. Bank welcomes
preliminary discussions with the promoters to determine scope for exim banks term finance.
3.6.9 Programme for Export Facilitation
Exim bank offers term finance and non-funded facilities to Indian corporate to create
infrastructure facilities to promote India’s international trade and thereby enhance their
export capability. The various infrastructural facilities covered under the programme are
software and post development or any other infrastructural facility for promoting India
international trade are as follows:
a. Financing Port Development:
The objective of this program is to finance development of minor ports with related
infrastructural activities, which would facilitate India’s international trade. Eligible
companies include Indian companies undertaking minor port projects and suppliers of
equipments to minor port development projects. Eligible activities are construction of
port/jetties, acquisition of fixed assets for individual activities such as stevedoring, cargo
handling, storage and related activities like dry docks, ship wreaking.
Interest rates are linked to banks minimum lending rate. As regards term loans in
foreign currency interest rates are at floating or fixed rate. In the case of non-funded
facilities, applicable rate of commission is charged. Repayment period is 7 to 10 years
inclusive of moratorium. Security for this type of financing includes first charge on fixed
assets pertaining to the project/company being financed. Additional security by way of assets
or corporate guarantee of promoter company/personal guarantees may also be stipulated.
Bank welcomes preliminary discussions with the promoters to determine scope for EXIM
bank’s finance.

81
b. Lending Programme For Software Training Institutes:
The objective of this program is to address the perceived constraint in availability of
trained high-end software professionals to support the fast growing exports. The programme
aims at financing the establishment/expansion of software .Eligible borrowers are established
software exporting company with good export track record and sound financials, and reputed
software training institutes engaged in high end software training. Activities eligible for
assistance are acquisition of fixed assets Including land, building , hardware, software and
related equipment, extending loans towards tuition fees and other charges, and any other
activity connected with training that may be agreed by exim banks.
The assistance is granted in the form of term loans in Indian rupees/foreign
currency. As regards interest rates, rupees term loan is linked to bank’s minimum lending
rate and foreign currency term loans is at floating or fixed interest rates based on banks cost
of funds.
Interest is payable semi-annually on reducing balances. Interest tax is as applicable.
Service fee of 1 percent of loan amount is payable upfront. The repayment period is up 5
years, based on projected cash flows inclusive of suitable moratorium. The security is
appropriately charged on fixed assets of the company/project plus any other security
acceptable to EXIM bank.
3.6.10 Foreign Currency Pre-Shipment Credit (FCPC)
Under this programme, short-term foreign currency finance is available to eligible
exporters for financing inputs for export production such as raw materials, components and
consumable. The finance is repayable in foreign currency from proceeds of the relative
exports.

82
FCPC programme represents another funding source to the exporter for expanding
export volumes, particularly of manufactured and value added goods. It eliminates two ways
exchanges conversion costs and exchange risks, thus enhancing export competitiveness.
FCPC can be a cost effective funding source as compared to rupee export credit as well as
overseas suppliers credit depending on market conditions for loans under FCPC. As far as
commercial banks are concerned, loans availed from exim banks are exempt from cash
reserve ratio, statutory liquidity ratio and incremental credit deposit ratio requirements.
Eligible borrowers are exporting companies and commercial banks for lending further
to exporting customers. Interest rates are not to be exceeds 2 percent over London Inter Bank
Offer Rate(LIBOR). In case FCPC is extended through commercial banks, which does not
have foreign branches, the interest rate should not exceeds 2.5 percent over LIBIOR or any
other rate as specified by reserve bank of India from time to time.
Interest on refinance to commercial banks will be mutually agreed. The assistances is
granted in the form of short term foreign currency loans and the repayment period is a
maximum of 180 days from the date of disbursement. As regards security, exim banks has
pari passu charges on current assets in case of direct loans.
3.6.11 Working Capital Term Loan Programme For Export Oriented Units(WCTL)
WCTL programme seeks to create, enhance export capabilities of Indian companies. Under
the programme, the banks address the working capital requirement of export oriented units.
Eligible companies are units set up proposed to be set up in export processing zones, units
under the 100 percent export oriented units scheme, units importing capital goods under
export promotions capital goods scheme and units undertaking expansion/modernization

83
/upgradation/ diversification programmes of existing export oriented units with export
orientation of 10 percent of sales or export sales rs.5 crores per annum whichever is lower.
Working capital terms loans in Indian rupees or in foreign currency up to 80 percent of the
demand loan component of working capital with a minimum 20 percent margin are granted.
Interest rates for rupee term loan are linked to banks minimum lending rate and foreign
currency term loans attract floating or fixed rates based on banks cost of funds. Interest is
payable semi annually on reducing balances. Interest tax as applicable is payable. As regards
security, appropriate charges on the fixed and or current assets, personal guarantees of
promoter/director, corporate guarantee of group concern if considered necessary. Bank
welcomes preliminary discussions with the promoters to determine scope for exim banks
finance. To facilitate discussions, details of the project identifying financial requirement are
to be sent to exim banks.
3.6.12 Bulk Import Finance Programme (BIF)
The objective of this program is to provide short term working capital finance to
manufacturing companies to import consumable inputs. Under the programme, BIF is offered
for import of eligible items with a minimum order size of rs.1 crore. This is granted as short
term loans in Indian rupees and foreign currency. As regards interest rates, 1 percent is
charged on cash credit facility in rupees loans charged by the commercial banker subject to a
minimum interest rate fixed by exim banks. The interest rate on foreign currency loans
depends on costs of funds to exim bank with a maximum of 0.75 percent over LIBOR. The
loan are to be repaid within 1 year, the security being pari passu charge on current assets.
84
3.6.13 Programme for Financing Research And Development
The objective of the purpose is to provide integrated financing for research and
development activities by export oriented companies. Exims banks finance is available to
financially sound companies with a minimum export oriented of 20 percent of their net sales
for the following eligible activities and eligible expenditure.
Eligible R & D activities for the purpose of assistance, the following are the eligible
activities:
development and commercialization of a new product/process/application
significant improvements in existing product/process/application/design
development of technology or design to satisfy domestic or international
environment, technical requirements/standards, specifications
setting up, expansion of pilot plants
research studies necessary for obtaining regulatory approvals, product registrations,
cost of Filing and maintaining international patents and R & D centers
Eligible R&D expenditure the eligible expenditure for the purpose of assistance are as
follows:
acquisition of technology at the ;proof of concept’ or design stage which will be used
to develop new product/process
land and building , civil works for housing eligible R&D activities
dies, tools, laboratory and other R&D equipment, mould, computer hardware,
software,

85
Miscellaneous
salaries of R&D personnel, support staff during the R&D project phase including
training costs
costs of regulatory approvals, filing and maintenance of patent registration
expenditure on external consultants for outsourcing a component of R&D project
product documentation and allied costs during the R&D project phase
costs of materials, surveys, technology demonstration studies, fields trails
Basic research with no identified application, academic research and normal process
control, quality control, inspection, repairs and maintenance, contract research will not be
eligible under the programme, term loan in Indian rupees subject to a maximum of rs.15
crores per company is granted. As regards interest rate, concessional interest rate at 50
percent of the normal interest that the borrower company would be eligible for subject to a
minimum of 8 percent p.a payable with quarterly rests. Defaults in loan servicing will attract
liquidated damages/penal charges @ 2 percent over the normal interest rate. Service fee of
one percent of loan percent of loan amount is payable upfront. Repayment is generally not to
exceed 7 years, with appropriate moratorium. As regards security one or more of the
following is applicable:
appropriate charge on the assets of borrower company
assignment of intellectual property rights(IPR) and mandate assigning all IPR
related Receivable

86
any other acceptable security
Bank welcomes preliminary discussions with the company officials to determine scope for
exim banks finance, exported benefits from proposed R&D expenditure, fit with company’s
corporate business plans. In particular, export plans mutual business possibility with exim in
other areas and financial information on the company.
3.6.14 Long-Term Working Capital Programme for Export Oriented Units
The objective of the program is to provide finance for long term working capital.
The exim banks finance is available to financially sound companies with a minimum
export orientation of 10 percent of their net sales or export sales of Rs.5 crores, whichever is
lower. Loans are made available in the form of term loan in Indian rupees, and term loans in
foreign currency. As regards interest rate, the rupees term loan linked to banks minimum
lending rate and the foreign currency term loan is linked to floating or fixed interest rates
based on banks cost of funds. Interest is payable on reducing balances at half-yearly rates.
Additionally interest tax as applicable will be payable.
Service fee will be to the extent of 1 percent of loans amount payable upfront. Loans are
repayable in 1-5 years, determined on the basis of projected cash flows with suitable
moratorium. Security will be one or more of the following:
an appropriate charge on part/whole of the fixed assets of the company, present and
future
personal guarantees of promoter director/corporate guarantee of group company

87
pledge of marketable securities with appropriate margin based on average of high
and low of market quotations during the preceding 6 months(this will not be
accepted as exclusive security)
any other acceptable security
3.6.15 Import Finance
Under this program, finance is provided for import of capital goods/plant and machinery,
technology/know-how. Exim banks finance is available to Indian manufacturing companies.
Finance is available by way of term loans in Indian rupees/foreign currency. Interest rate is
based on prevailing market rates. Rupees term loan is linked to banks minimum lending rate
and the foreign currency term loan at floating or fixed interest rates based on banks cost of
funds. Interest is payable on reducing balances at half yearly rates. Interest tax is payable as
applicable. Services fee of one percent of loan amount is payable upfront.
Repayment is over a period upto 7 years, determined on the basis of projected cash flow
with suitable moratorium. Security is in the form of appropriate charge on the asset acquired
out of the loan. In addition, the following additionally security is also required:
a first pari passu charge on part/whole of the fixed assets of the company, present
and future
personal guarantees of promoter director/corporate guarantee of group company
pledge of marketable securities with appropriate margin based on average of high
and low of market quotations during the preceding 6 months(this will not be
accepted as exclusive security)
any other acceptable security

88
This chapter exhibits the profile of the Exim Bank of India. It has been provided with
elaborate operating functions of the various schemes of assistance extended by the Exim
Bank of India for Indian exporters, commercial Banks and overseas entities to facilitate
support and encourage the needs of them.

CHAPTER IV
OPERATIONAL EFFICACY OF EXIM BANK OF INDIA - AN EVALUVATION
4.1 OVERALL OPERATIONAL EFFICACY
4.2 ASSISTANCE UNDER VARIOUS SCHEMES OF EXIM BANK
4.3 ANALYSIS OF VARIANCE UNDER VARIOUS SCHEMES OF ASSISTANCE

89
CHAPTER IV
OPERATIONAL EFFICACY OF EXIM BANK OF INDIA - AN EVALUVATION
The effectiveness of exports largely depends upon the efficiency of institutions
engaged to promote the exports, it becomes important to study the institutional network
supporting the exports. So as to achieve export target, the competitiveness of institutional
network is altogether essential, as institutions engaged in finance, insurance, testing, quality
assurance, initiating research, information dissemination and export promotion provides the
competitiveness is growing as a result of increasingly stringent quality, precision, tolerance
other standards and competition in international market.
This chapter aims at highlighting the role of institutional support in India’s export
promotion measures. The main aim is to analyze whether, Export Import Bank of India is
really working on effective lines or not. This study becomes important to understand
whether, trade promotion organization can stay relevant and competitive in turbulent times or
not? This study tries to give an insight as how the competitiveness and strengths of Export
Import Bank of India can be enhanced. The need of hour is to evaluate the strength of such
institutions and to create the capacity to adapt the changing trade opportunities, so as to
ensure that trade development strategies contribute to overall economic development and
particularly poverty reduction to explain more clearly to the general public the role of exports
as engine of growth.
Export promotion in the developing world was reviewed against the backdrop of the
particular economic and trade situation of these countries. It is apparent that these countries
have made substantial progress towards both export development and diversification of their
exports into more sophisticated manufactured products. At the same time, the ongoing

90
challenge of narrowing the expectation and reality gap between developed and developing
countries suggests that tremendous efforts lie ahead, in economic development, export
development and, in particular export promotion and so the question arises how? One way
could be to strengthen the organizational network engaged in export promotion.
Hence this chapter intends to analyse the operating performance of Export Import
Bank of India, which is the crux of this research study, in terms of overall assistance
sanctioned, disbursed and collections made, scheme wise assistance extended and regression
analysis of exim banks assistance in line with specific macroeconomic variables viz, GDP,
BOP, BOT, Export, Import and total credit exposure.
4.1 OVERALL OPERATIONAL EFFICACY
The efficacy of overall operations of EXIM Bank has been derived in terms of total
sanctions and disbursement made, loan outstanding and collections made are discussed
below. The approval refers to the Exim Bank’s approval under the various schemes of
financial assistance. The disbursement states the financial assistance extended by the Exim
Bank of India has been disbursed under the various schemes. The loan assets elicit the
outstanding of the Exim Bank of India under the various schemes.
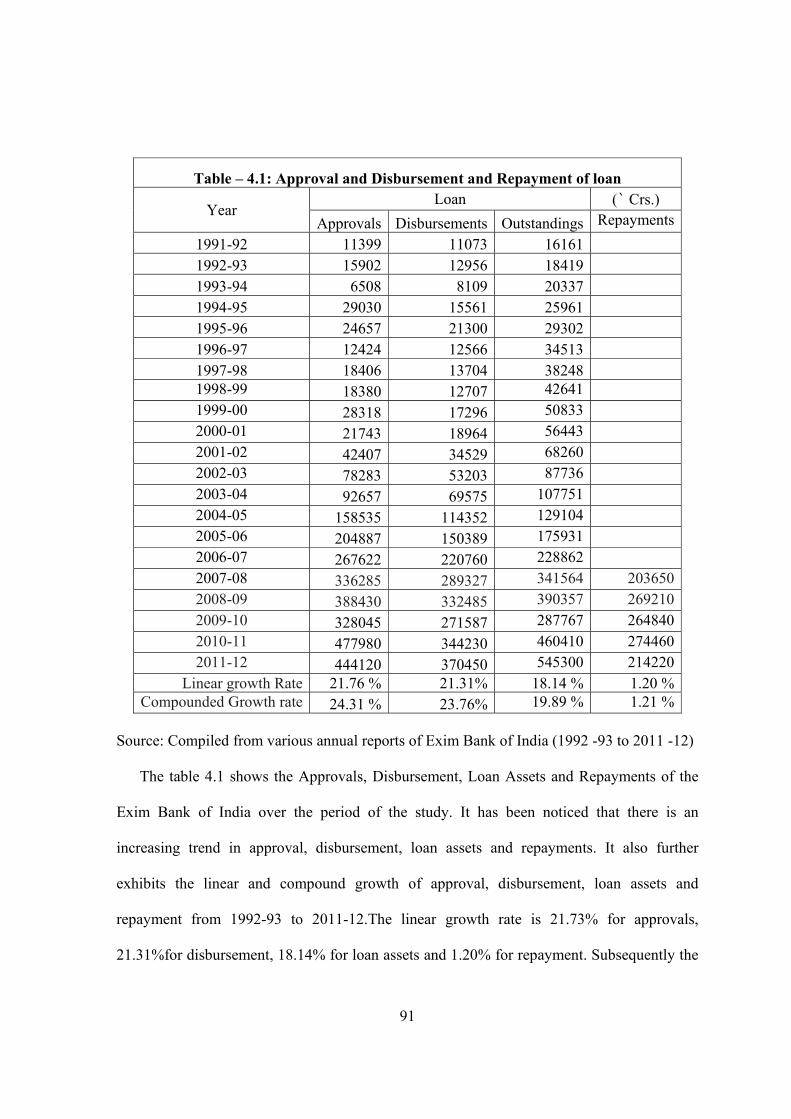
91
Table – 4.1: Approval and Disbursement and Repayment of loan
Year Loan (` Crs.)
Approvals Disbursements Outstandings Repayments1991-92 11399 11073 16161 1992-93 15902 12956 18419 1993-94 6508 8109 20337 1994-95 29030 15561 25961 1995-96 24657 21300 29302 1996-97 12424 12566 34513 1997-98 18406 13704 38248 1998-99 18380 12707 42641 1999-00 28318 17296 50833 2000-01 21743 18964 56443 2001-02 42407 34529 68260 2002-03 78283 53203 87736 2003-04 92657 69575 107751 2004-05 158535 114352 129104 2005-06 204887 150389 175931 2006-07 267622 220760 228862 2007-08 336285 289327 341564 2036502008-09 388430 332485 390357 2692102009-10 328045 271587 287767 2648402010-11 477980 344230 460410 2744602011-12 444120 370450 545300 214220
Linear growth Rate 21.76 % 21.31% 18.14 % 1.20 %Compounded Growth rate 24.31 % 23.76% 19.89 % 1.21 %
Source: Compiled from various annual reports of Exim Bank of India (1992 -93 to 2011 -12) The table 4.1 shows the Approvals, Disbursement, Loan Assets and Repayments of the
Exim Bank of India over the period of the study. It has been noticed that there is an
increasing trend in approval, disbursement, loan assets and repayments. It also further
exhibits the linear and compound growth of approval, disbursement, loan assets and
repayment from 1992-93 to 2011-12.The linear growth rate is 21.73% for approvals,
21.31%for disbursement, 18.14% for loan assets and 1.20% for repayment. Subsequently the
92
compounded annual growth rate over the same period of time is 24.31% for approvals,
23.76%for disbursement, 19.89% for loan assets and 1.21% for repayment.
1.2 ASSISTANCE UNDER VARIOUS SCHEMES OF EXIM BANK
EXIM Bank is operating 38 varied lending and service programs. These programs are
tailored to meet the needs of different customer groups, viz. thirty one Programs for the
Indian Exporter, five Programs for the Commercial Bank and two Programs for the overseas
entities. An attempt has been made by the researcher to study the efficacy of EXIM Bank in
line with some of the important schemes of assistance based on the availability of data.
Further it has been attempted to analyse with paired sample t test to assess the significant
difference is persist among the various schemes of assistance extended by the EXIM Bank
during the both the decade of the reform period.
4.2.1 ASSISTANCE UNDER LINE OF CREDITS SCHEME
The Bank extends Lines of Credit (LOCs) too overseas financial institutions, regional
development banks, sovereign governments and other entities overseas, to enable them to
import developmental and infrastructure projects, equipments, goods and services from India,
on deferred credit terms. Indian exporters can obtain payment of eligible value from EXIM
Bank, without recourse to them, against negotiation of shipping documents. LOC is a safe,
nonrecourse financing option for Indian exporters, especially to small and medium
enterprises and serves as an effective market entry tool for the latter. Being in an increasingly
competitive environment, EXIM Bank is proactively seeking to expand its geographical
reach and volumes under the LOC Programme. Under Exim Bank's LOCs, the Indian
exporters can obtain payment of eligible value from Exim Bank, without recourse to them,
against negotiation of shipping documents. The Indian exporter does not carry any credit risk

93
either on the importer or the importer's country, whilst the overseas importer enjoys deferred
credit facility. Thus, LOC is a safe mode of non-recourse financing option to the Indian
exporter and serves as a market entry tool for India's exports. The Indian exporter can also
increase his export volumes by offering deferred credit, where required.
Source: Compiled from various annual reports of Exim Bank of India (1992 -93 to 2011 -12)
The table 4.2.1 depicts the region wise disbursement of Line of Credits (LOCs) with
support of Government of India to countries of the developing world. During the year 2011–
12 the Exim Bank has disbursed Rs.8160 Crores and Rs 197 Crores during the year 1992–93.
Table – 4.2.1: Region wise Disbursement of Line of credits (USD $ Million)
Region South Asia
South-East Asia Far East & Pacific
West Asia
North Africa
Sub-Saharan Africa
Europe and Americas
Total
1992-93 14 52 89 8 25 9 197 1993-94 17 87 111 - 31 13 259 1994-95 20 211 272 - 32 17 552 1995-96 2 34 99 5 81 86 308 1996-97 10 - 5 - 7 95 116 1997-98 74 45 293 - 50 94 557 1998-99 46 - 56 - 26 86 214 1999-00 59 49 44 1 77 224 454 2000-01 60 156 49 23 79 146 513 2001-02 66 - 229 - 190 399 884 2002-03 50 219 1174 79 409 403 2334 2003-04 89 101 226 319 291 419 1445 2004-05 218 75 103 49 255 253 953 2005-06 218 99 250 442 552 178 1739 2006-07 155 183 265 10 1430 218 2261 2007-08 498 178 265 542 1252 75 2810 2008-09 702 228 310 567 1706 233 3746 2009-10 770 243 390 30 2708 359 4500 2010-11 1934 558 325 567 2939 334 6657 2011-12 2606 578 325 567 3746 338 8160
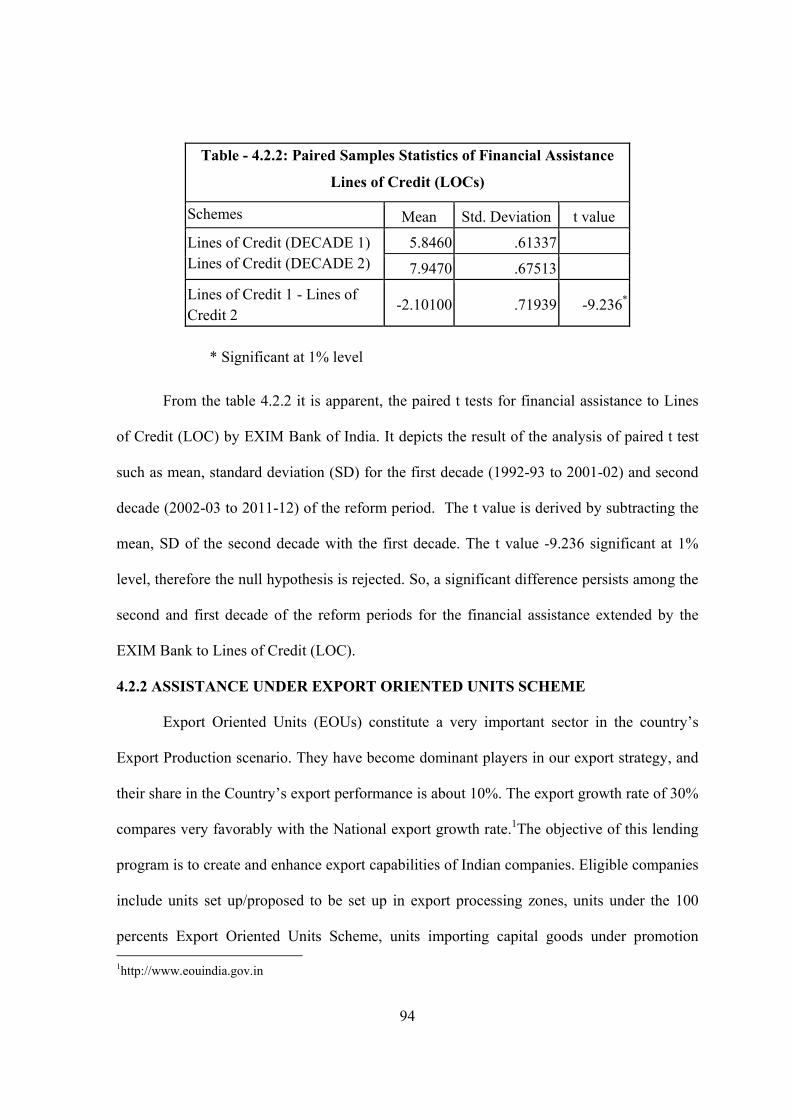
94
* Significant at 1% level
From the table 4.2.2 it is apparent, the paired t tests for financial assistance to Lines
of Credit (LOC) by EXIM Bank of India. It depicts the result of the analysis of paired t test
such as mean, standard deviation (SD) for the first decade (1992-93 to 2001-02) and second
decade (2002-03 to 2011-12) of the reform period. The t value is derived by subtracting the
mean, SD of the second decade with the first decade. The t value -9.236 significant at 1%
level, therefore the null hypothesis is rejected. So, a significant difference persists among the
second and first decade of the reform periods for the financial assistance extended by the
EXIM Bank to Lines of Credit (LOC).
4.2.2 ASSISTANCE UNDER EXPORT ORIENTED UNITS SCHEME
Export Oriented Units (EOUs) constitute a very important sector in the country’s
Export Production scenario. They have become dominant players in our export strategy, and
their share in the Country’s export performance is about 10%. The export growth rate of 30%
compares very favorably with the National export growth rate.1The objective of this lending
program is to create and enhance export capabilities of Indian companies. Eligible companies
include units set up/proposed to be set up in export processing zones, units under the 100
percents Export Oriented Units Scheme, units importing capital goods under promotion 1http://www.eouindia.gov.in
Table - 4.2.2: Paired Samples Statistics of Financial Assistance
Lines of Credit (LOCs)
Schemes Mean Std. Deviation t value
Lines of Credit (DECADE 1) Lines of Credit (DECADE 2)
5.8460 .61337
7.9470 .67513
Lines of Credit 1 - Lines of Credit 2
-2.10100 .71939 -9.236*

95
capital goods scheme, units undertaking expansion/modernization/upgradation/diversification
programme of existing export oriented units with export orientation of minimum 10 percent
or sales of ` 5 crores per annum whichever is lower. Interest is payable semi-annually on
reducing balances. Interest tax is as applicable. Services fee of one % of loan payable
upfront. Repayment period is up to ten years, based on projected cash flows inclusive of
suitable moratorium.
Table: 4.3.1 ASSISTANCE UNDER EXPORT ORIENTED UNITS SCHEME
Year No of EOUs Approval(` Crs.) Disbursement (` Crs.) 1992-93 52 168.2 107.85 1993-94 34 79.97 118 1994-95 92 347 91.17 1995-96 37 546 347 1996-97 35 637 548 1997-98 51 665 506 1998-99 47 694 447 1999-00 43 846 460 2000-01 33 487 482 2001- 02 31 478 424 2002- 03 67 2398 2037 2003 - 04 51 903 175 2004 - 05 69 2114 1631 2005-06 39 1669 1206 2006 -07 69 1908 1269 2007 -08 62 2747 1381 2008 - 09 39 1669 1206 2009 - 10 48 3793 1245 2010 - 11 54 3884 2029 2011 - 12 96 5412 3234 Linear Growth 17.58% Compound Growth 19.22%
Source: Annual Reports of Exim Bank of India (1992-93 to2011 – 12)
The table 4.3.1 shows the assistance extended by the Exim bank under Export
Oriented Units (EOUs) during the period of the study. It has been noticed during the year
2011-12, 96 EOUs amount approved and disbursed are Rs5412 Crores and Rs.3234 Crores
respectively. During the year 1992 -93, Rs168.2 and Rs. 107.85 has been sanctioned and
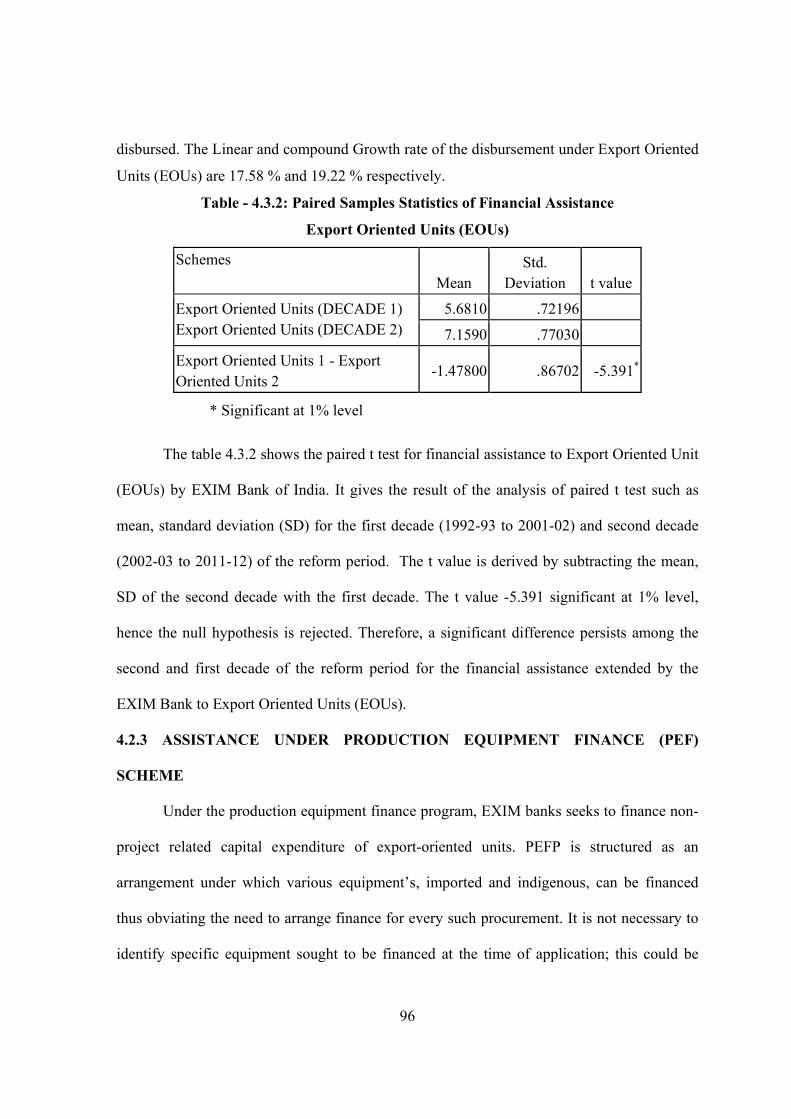
96
disbursed. The Linear and compound Growth rate of the disbursement under Export Oriented
Units (EOUs) are 17.58 % and 19.22 % respectively.
Table - 4.3.2: Paired Samples Statistics of Financial Assistance
Export Oriented Units (EOUs)
Schemes Mean
Std. Deviation t value
Export Oriented Units (DECADE 1) Export Oriented Units (DECADE 2)
5.6810 .72196
7.1590 .77030
Export Oriented Units 1 - Export Oriented Units 2
-1.47800 .86702 -5.391*
* Significant at 1% level
The table 4.3.2 shows the paired t test for financial assistance to Export Oriented Unit
(EOUs) by EXIM Bank of India. It gives the result of the analysis of paired t test such as
mean, standard deviation (SD) for the first decade (1992-93 to 2001-02) and second decade
(2002-03 to 2011-12) of the reform period. The t value is derived by subtracting the mean,
SD of the second decade with the first decade. The t value -5.391 significant at 1% level,
hence the null hypothesis is rejected. Therefore, a significant difference persists among the
second and first decade of the reform period for the financial assistance extended by the
EXIM Bank to Export Oriented Units (EOUs).
4.2.3 ASSISTANCE UNDER PRODUCTION EQUIPMENT FINANCE (PEF)
SCHEME
Under the production equipment finance program, EXIM banks seeks to finance non-
project related capital expenditure of export-oriented units. PEFP is structured as an
arrangement under which various equipment’s, imported and indigenous, can be financed
thus obviating the need to arrange finance for every such procurement. It is not necessary to
identify specific equipment sought to be financed at the time of application; this could be
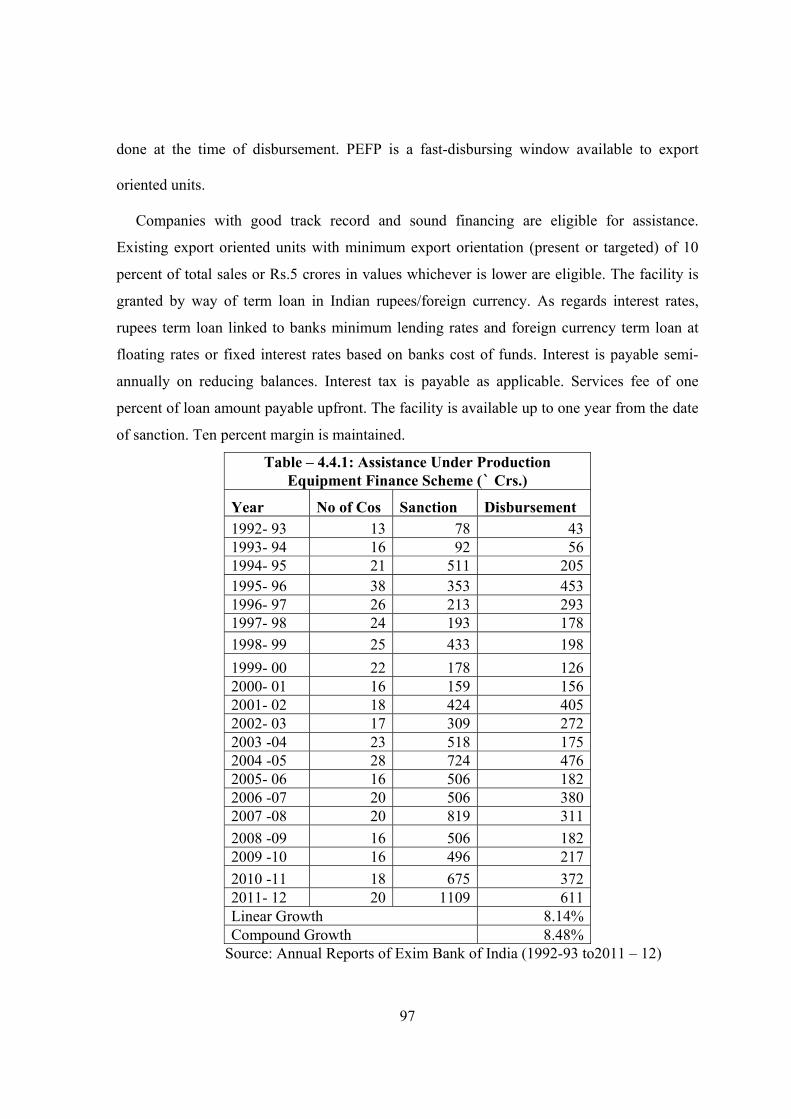
97
done at the time of disbursement. PEFP is a fast-disbursing window available to export
oriented units.
Companies with good track record and sound financing are eligible for assistance.
Existing export oriented units with minimum export orientation (present or targeted) of 10
percent of total sales or Rs.5 crores in values whichever is lower are eligible. The facility is
granted by way of term loan in Indian rupees/foreign currency. As regards interest rates,
rupees term loan linked to banks minimum lending rates and foreign currency term loan at
floating rates or fixed interest rates based on banks cost of funds. Interest is payable semi-
annually on reducing balances. Interest tax is payable as applicable. Services fee of one
percent of loan amount payable upfront. The facility is available up to one year from the date
of sanction. Ten percent margin is maintained.
Table – 4.4.1: Assistance Under Production Equipment Finance Scheme (` Crs.)
Year No of Cos Sanction Disbursement 1992- 93 13 78 43 1993- 94 16 92 56 1994- 95 21 511 205 1995- 96 38 353 453 1996- 97 26 213 293 1997- 98 24 193 178 1998- 99 25 433 198 1999- 00 22 178 126 2000- 01 16 159 156 2001- 02 18 424 405 2002- 03 17 309 272 2003 -04 23 518 175 2004 -05 28 724 476 2005- 06 16 506 182 2006 -07 20 506 380 2007 -08 20 819 311 2008 -09 16 506 182 2009 -10 16 496 217 2010 -11 18 675 372 2011- 12 20 1109 611 Linear Growth 8.14% Compound Growth 8.48%
Source: Annual Reports of Exim Bank of India (1992-93 to2011 – 12)
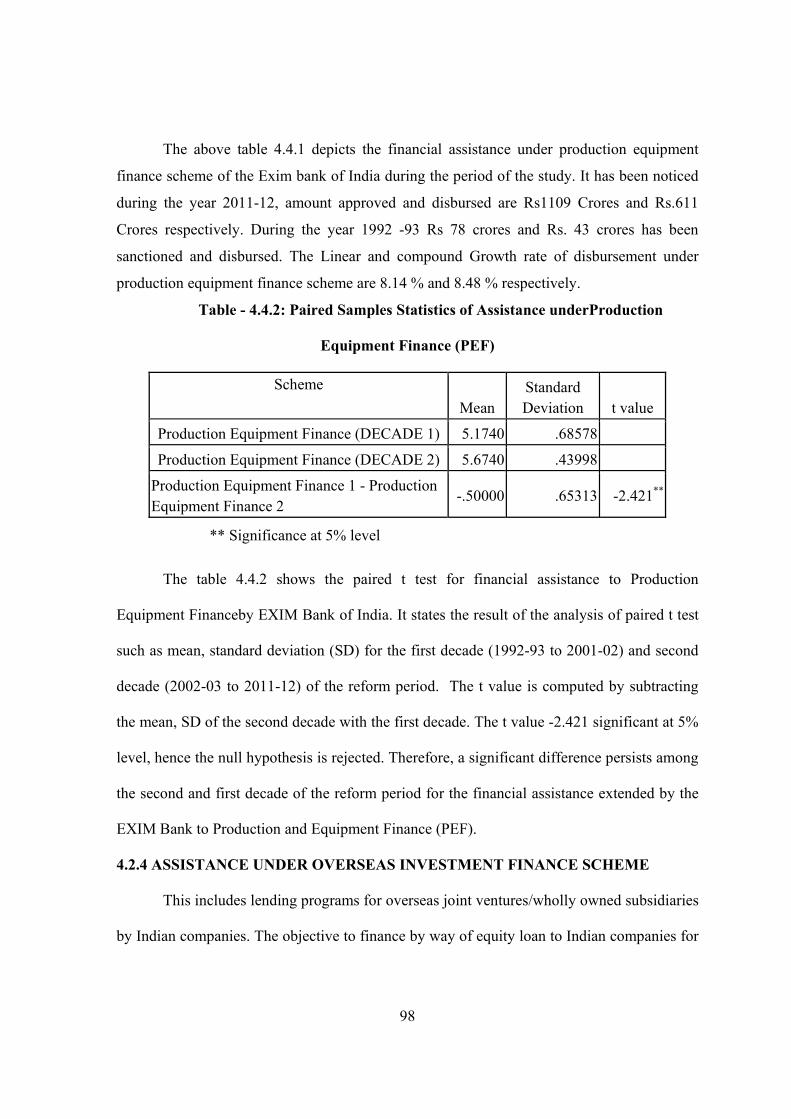
98
The above table 4.4.1 depicts the financial assistance under production equipment
finance scheme of the Exim bank of India during the period of the study. It has been noticed
during the year 2011-12, amount approved and disbursed are Rs1109 Crores and Rs.611
Crores respectively. During the year 1992 -93 Rs 78 crores and Rs. 43 crores has been
sanctioned and disbursed. The Linear and compound Growth rate of disbursement under
production equipment finance scheme are 8.14 % and 8.48 % respectively.
Table - 4.4.2: Paired Samples Statistics of Assistance underProduction
Equipment Finance (PEF)
Scheme Mean
Standard Deviation t value
Production Equipment Finance (DECADE 1) 5.1740 .68578
Production Equipment Finance (DECADE 2) 5.6740 .43998
Production Equipment Finance 1 - Production Equipment Finance 2
-.50000 .65313 -2.421**
** Significance at 5% level
The table 4.4.2 shows the paired t test for financial assistance to Production
Equipment Financeby EXIM Bank of India. It states the result of the analysis of paired t test
such as mean, standard deviation (SD) for the first decade (1992-93 to 2001-02) and second
decade (2002-03 to 2011-12) of the reform period. The t value is computed by subtracting
the mean, SD of the second decade with the first decade. The t value -2.421 significant at 5%
level, hence the null hypothesis is rejected. Therefore, a significant difference persists among
the second and first decade of the reform period for the financial assistance extended by the
EXIM Bank to Production and Equipment Finance (PEF).
4.2.4 ASSISTANCE UNDER OVERSEAS INVESTMENT FINANCE SCHEME
This includes lending programs for overseas joint ventures/wholly owned subsidiaries
by Indian companies. The objective to finance by way of equity loan to Indian companies for
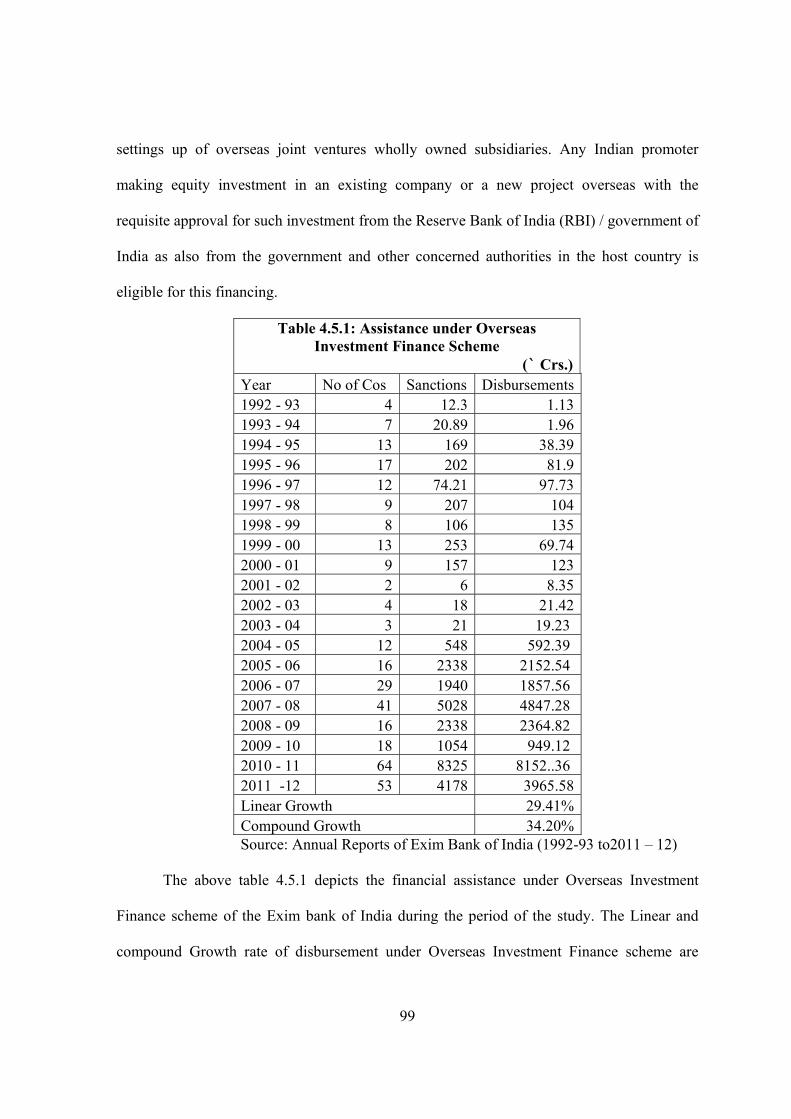
99
settings up of overseas joint ventures wholly owned subsidiaries. Any Indian promoter
making equity investment in an existing company or a new project overseas with the
requisite approval for such investment from the Reserve Bank of India (RBI) / government of
India as also from the government and other concerned authorities in the host country is
eligible for this financing.
Table 4.5.1: Assistance under Overseas Investment Finance Scheme
(` Crs.) Year No of Cos Sanctions Disbursements 1992 - 93 4 12.3 1.13 1993 - 94 7 20.89 1.96 1994 - 95 13 169 38.39 1995 - 96 17 202 81.9 1996 - 97 12 74.21 97.73 1997 - 98 9 207 104 1998 - 99 8 106 135 1999 - 00 13 253 69.74 2000 - 01 9 157 123 2001 - 02 2 6 8.35 2002 - 03 4 18 21.42 2003 - 04 3 21 19.23 2004 - 05 12 548 592.39 2005 - 06 16 2338 2152.54 2006 - 07 29 1940 1857.56 2007 - 08 41 5028 4847.28 2008 - 09 16 2338 2364.82 2009 - 10 18 1054 949.12 2010 - 11 64 8325 8152..36 2011 -12 53 4178 3965.58 Linear Growth 29.41% Compound Growth 34.20%
Source: Annual Reports of Exim Bank of India (1992-93 to2011 – 12)
The above table 4.5.1 depicts the financial assistance under Overseas Investment
Finance scheme of the Exim bank of India during the period of the study. The Linear and
compound Growth rate of disbursement under Overseas Investment Finance scheme are

100
29.41% and 34.20% respectively. It has been noticed during the year 2011-12, amount
approved and disbursed are Rs. 4178 Crores and Rs.3965.58 Crores respectively. During the
year 1992 -93, Rs12.3 Crores and Rs. 1.13 Crores has been sanctioned and disbursed.
Table – 4.5.2: Paired Samples Statistics of Financial Assistance
Overseas Investment Finance
Scheme Mean
Std. Deviation t value
Overseas Investment Finance (Decade1)
Overseas Investment Finance (Decade 2) 3.7620 1.36640
6.8590 2.06826
Overseas Investment Finance 1 - Overseas Investment Finance 2
-3.09700
1.65379 -5.922*
* Significance at 1% level
The above table 4.5.2 shows the paired t test for financial assistance to Overseas
Investment Finance by EXIM Bank of India. It reveals the result of the analysis of paired t
test such as mean, standard deviation (SD) for the first decade (1992-93 to 2001-02) and
second decade (2002-03 to 2011-12) of the reform period. The t value is arrived by
subtracting the mean, SD of the second decade with the first decade. The t value -5.992
significant at 1% level, hence the null hypothesis is rejected. Therefore, a significant
difference exists among the second and first decade of the reform period for the financial
assistance extended by the EXIM Bank to Overseas Investment Finance.
4.2.5 ASSISTANCE UNDER WORKING CAPITAL SCHEME
Financial Assistance for Working Capital Scheme seeks to create, enhance export
capabilities of Indian companies. Under the Scheme, the bank addresses the working capital
requirement of export oriented units. Eligible companies are units set up proposed to be set
up in export processing zones, units under the 100 percent export oriented units scheme, units
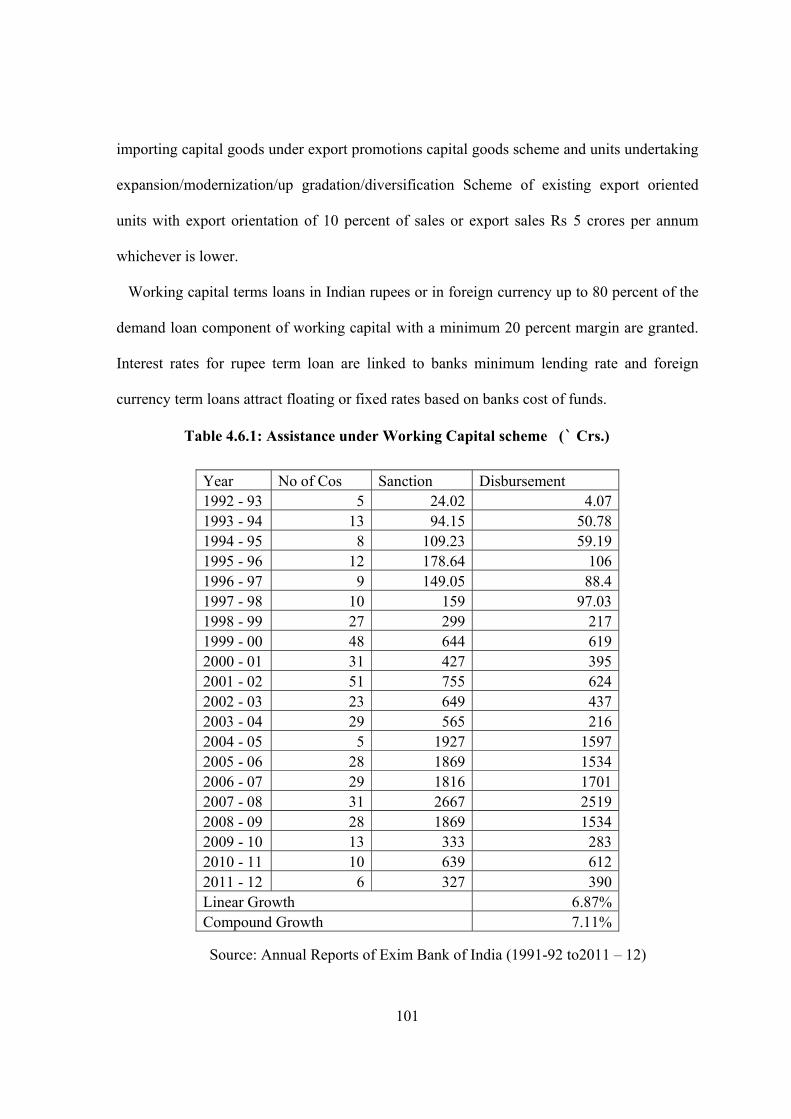
101
importing capital goods under export promotions capital goods scheme and units undertaking
expansion/modernization/up gradation/diversification Scheme of existing export oriented
units with export orientation of 10 percent of sales or export sales Rs 5 crores per annum
whichever is lower.
Working capital terms loans in Indian rupees or in foreign currency up to 80 percent of the
demand loan component of working capital with a minimum 20 percent margin are granted.
Interest rates for rupee term loan are linked to banks minimum lending rate and foreign
currency term loans attract floating or fixed rates based on banks cost of funds.
Source: Annual Reports of Exim Bank of India (1991-92 to2011 – 12)
Table 4.6.1: Assistance under Working Capital scheme (` Crs.)
Year No of Cos Sanction Disbursement 1992 - 93 5 24.02 4.07 1993 - 94 13 94.15 50.78 1994 - 95 8 109.23 59.19 1995 - 96 12 178.64 106 1996 - 97 9 149.05 88.4 1997 - 98 10 159 97.03 1998 - 99 27 299 217 1999 - 00 48 644 619 2000 - 01 31 427 395 2001 - 02 51 755 624 2002 - 03 23 649 437 2003 - 04 29 565 216 2004 - 05 5 1927 1597 2005 - 06 28 1869 1534 2006 - 07 29 1816 1701 2007 - 08 31 2667 2519 2008 - 09 28 1869 1534 2009 - 10 13 333 283 2010 - 11 10 639 612 2011 - 12 6 327 390 Linear Growth 6.87% Compound Growth 7.11%

102
The table 4.6.1 shows the assistance extended by the Exim bank assistance under
during the period of the study. It has been noticed during the year 2011-12, amount approved
and disbursed are Rs 327 Crores and Rs.390 Crores respectively. During the year 1992 -93,
Rs 24.02 and Rs. 4.07 has been sanctioned and disbursed. The Linear and compound Growth
rate of disbursement under Working capital Finance scheme are 6.87% and 7.11%
respectively.
Table – 4.6.2: Paired Samples Statistics of Financial Assistance to Working Capital Finance
Scheme Mean Std. Deviation t value Working Capital Finance (DECADE 1) 5.1230 .86396 Working Capital Finance (DECADE 2) 6.6830 .87837
Working Capital Finance 1 - Working Capital Finance 2
-1.56000 1.47087 -3.354*
* Significance at 1% level The above table 4.6.2 shows the paired t test for financial assistance to Working
capital terms loan by EXIM Bank of India. It gives the result of the analysis of paired t test
such as mean, standard deviation (SD) for the first decade (1992-93 to 2001-02) and second
decade (2002-03 to 2011-12) of the reform period. The t value is derived by subtracting the
mean, SD of the second decade with the first decade. The t value -3.354 significant at 1%
level, hence the null hypothesis is rejected. Therefore, a significant difference persists among
the second and first decade of the reform period for the financial assistance extended by the
EXIM Bank to Working capital terms loan.

103
4.2.6 ASSISTANCE UNDER TECHNOLOGY UP-GRADATION FUND (TUF) SCHEME EXIM Bank is one of the nodal agencies appointed by GOI, Ministry of Textiles, to
establish and approve the eligibility of projects under Technology up-gradation Fundand
release subsidies directly to the approved projects. The Bank’s assistance under TUFS to the
textile industry is spread across various segments in textile manufacturing and covers several
states in India.
Table 4.7.1: Assistance under Technology Up-gradation Fund Scheme (` Crs.)
Year No. of Projects Sanction Disbursements
1992 - 93 76 13.89 4.07 1993 - 94 41 46.6 50.78 1994 - 95 13 99.33 59.19 1995 - 96 21 156 106 1996 - 97 18 129 88.4 1997 - 98 10 61.64 58.14 1998 - 99 16 4.05 29.59 1999 - 00 9 159 47.45 2000 - 01 14 87.72 81.14 2001 - 02 21 88 81 2002 - 03 17 132 122 2003 - 04 32 202 98 2004 - 05 67 669 228 2005 - 06 156 3202 2419 2006 - 07 138 2536 1611 2007 - 08 148 2780 1866 2008 - 09 156 3202 2419 2009 - 10 161 3152 2504 2010 - 11 164 3205 2554 2011 - 12 187 4108 2888 Linear Growth 29.41 % Compound Growth 34.20 %
Source: Annual Reports of Exim Bank of India (1992-93 to2011 – 12)

104
The above table 4.7.1 depicts the financial Assistance under Technology Up-
gradation Fund Scheme of the Exim bank of India during the period of the study. The Linear
and compound Growth rate of disbursement under Technology Up-gradation Fund Scheme
are 29.41% and 34.20 % respectively. It has been noticed during the year 2011-12, amount
approved and disbursed are Rs. 4108 Crores and Rs.2888 Crores respectively. During the
year 1992 -93 amounts of Rs13.89 and Rs. 4.07 has been sanctioned and disbursed.
Table – 4.7.2: Paired Samples Statistics of Financial Assistance to Technology up gradation Fund
Scheme Mean
Std. Deviation t value
Technology up gradation Fund (DECADE 1) 3.8650 .94059 Technology up gradation Fund (DECADE 2) 6.8950 1.37747 Technology up gradation Fund 1 - Technology up gradation Fund 2 -3.03000 1.15872 -8.269*
* Significance at 1% level
The above table 4.7.2 shows the paired t test for financial assistance to Technology
up-gradation Fund by EXIM Bank of India. It gives the result of the analysis of paired t test
such as mean, standard deviation (SD) for the first decade (1992-93 to 2001-02) and second
decade (2002-03 to 2011-12) of the reform period. The t value is derived by subtracting the
mean, SD of the second decade with the first decade. The t value -8.269 significant at 1%
level, hence the null hypothesis is rejected. Therefore, a significant difference persists among
the second and first decade of the reform period for the financial assistance extended by the
EXIM Bank to Technology up-gradation Fund.
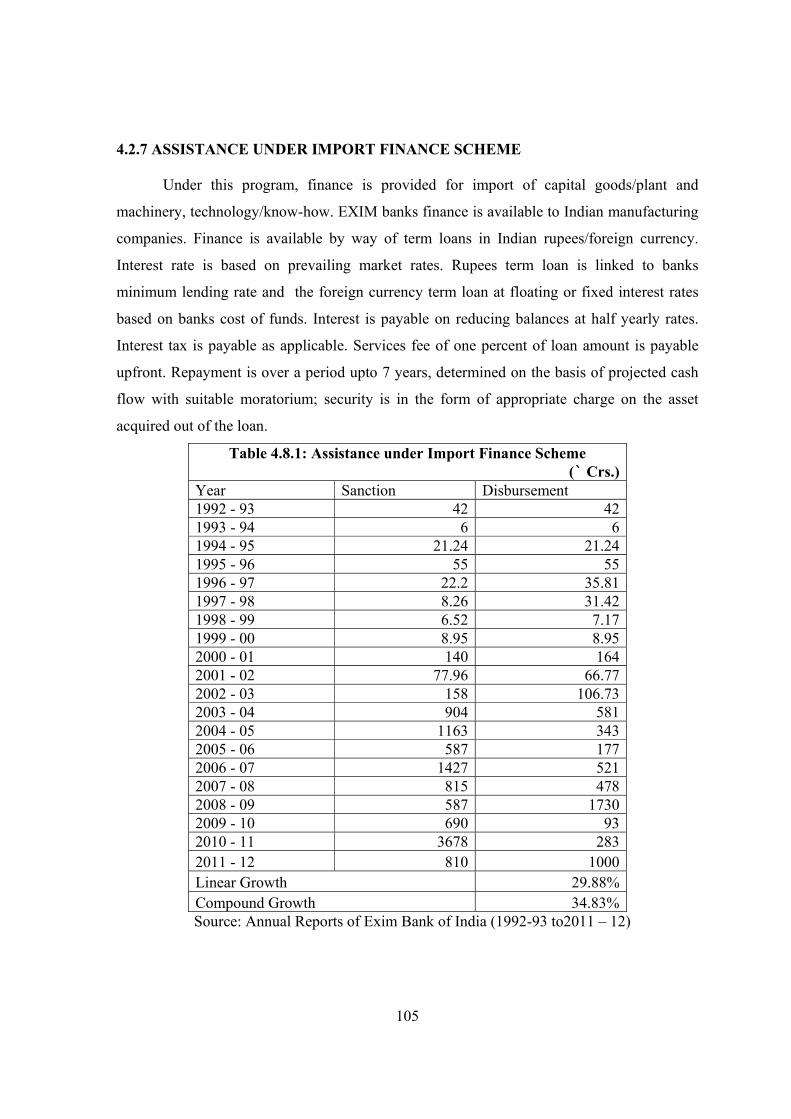
105
4.2.7 ASSISTANCE UNDER IMPORT FINANCE SCHEME
Under this program, finance is provided for import of capital goods/plant and
machinery, technology/know-how. EXIM banks finance is available to Indian manufacturing
companies. Finance is available by way of term loans in Indian rupees/foreign currency.
Interest rate is based on prevailing market rates. Rupees term loan is linked to banks
minimum lending rate and the foreign currency term loan at floating or fixed interest rates
based on banks cost of funds. Interest is payable on reducing balances at half yearly rates.
Interest tax is payable as applicable. Services fee of one percent of loan amount is payable
upfront. Repayment is over a period upto 7 years, determined on the basis of projected cash
flow with suitable moratorium; security is in the form of appropriate charge on the asset
acquired out of the loan.
Table 4.8.1: Assistance under Import Finance Scheme (` Crs.)
Year Sanction Disbursement 1992 - 93 42 42 1993 - 94 6 6 1994 - 95 21.24 21.24 1995 - 96 55 55 1996 - 97 22.2 35.81 1997 - 98 8.26 31.42 1998 - 99 6.52 7.17 1999 - 00 8.95 8.95 2000 - 01 140 164 2001 - 02 77.96 66.77 2002 - 03 158 106.73 2003 - 04 904 581 2004 - 05 1163 343 2005 - 06 587 177 2006 - 07 1427 521 2007 - 08 815 478 2008 - 09 587 1730 2009 - 10 690 93 2010 - 11 3678 283 2011 - 12 810 1000 Linear Growth 29.88% Compound Growth 34.83%
Source: Annual Reports of Exim Bank of India (1992-93 to2011 – 12)

106
The above table 4.8.1 depicts the financial assistance under Import Finance Scheme
of the Exim bank of India during the period of the study. It has been noticed during the year
2011-12, amount approved and disbursed are Rs.1109 Crores and Rs.611 Crores
respectively. During the year 1992 -93 Rs. 42 and Rs. 42 has been sanctioned and disbursed.
The Linear and compound Growth rate of disbursement under Import Finance Scheme are
29.88% and 34.83% respectively.
Table – 4.8.2: Paired Samples Statistics of Financial Assistance to Import Finance
Scheme Mean Std. Deviation t value
Import Finance (DECADE 1) 3.3090 1.06388
Import Finance (DECADE 2) 6.0400 .82683
Import Finance 1 - Import Finance 2 -2.73100 1.43495 -6.018*
* Significance at 1% level
The table 4.8.2 shows the paired t test for financial assistance to Import Finance by
EXIM Bank of India. It gives the result of the analysis of paired t test such as mean, standard
deviation (SD) for the first decade (1992-93 to 2001-02) and second decade (2002-03 to
2011-12) of the reform period. The t value is derived by subtracting the mean, SD of the
second decade with the first decade. The t value -6.018 significant at 1% level, hence the null
hypothesis is rejected. Therefore, a significant difference persists among the second and first
decade of the reform period for the financial assistance extended by the EXIM Bank to
Import Finance.
4.2.8 ASSISTANCE UNDER BULK IMPORT FINANCE SCHEME (BIF)
The objective of this program is to provide short term working capital finance to
manufacturing companies to import consumable inputs. Under the programme, BIF is offered
for import of eligible items with a minimum order size of `.1 crore. This is granted as short

107
term loans in Indian rupees and foreign currency. As regards interest rates, 1 percent is
charged on cash credit facility in rupees loans charged by the commercial banker subject to a
minimum interest rate fixed by EXIM banks. The interest rate on foreign currency loans
depends on costs of funds to EXIM bank with a maximum of 0.75 percent over LIBOR. The
loans are to be repaid within 1 year, the security being pari-passu charge on current assets.
Bank conducts preliminary discussions with the promoters to determine scope for EXIM
banks finance.
Table 4.9.1: Assistance Under Bulk Import Scheme (` Crs.) Year Sanction Disbursement 1992-93 74 58 1993-94 186 126 1994-95 190 110 1995-96 84.45 37.9 1996-97 81.47 80.53 1997-98 40 40 1998-99 78 73.5 1999-00 95 89.27 2000-01 139.9 139.9 2001- 02 156.4 146 2002- 03 25 30 2003 - 04 127 102 2004 - 05 1237 739 2005-06 1715 1730 2006 -07 1988 1884 2007 -08 811 940 2008 - 09 1715 1730 2009 - 10 3850 5399 2010 - 11 1875 3985 2011-12 2925 2055 Linear Growth 24.52% Compound Growth 27.79%
Source: Annual Reports of Exim Bank of India (1992-93 to2011 – 12)
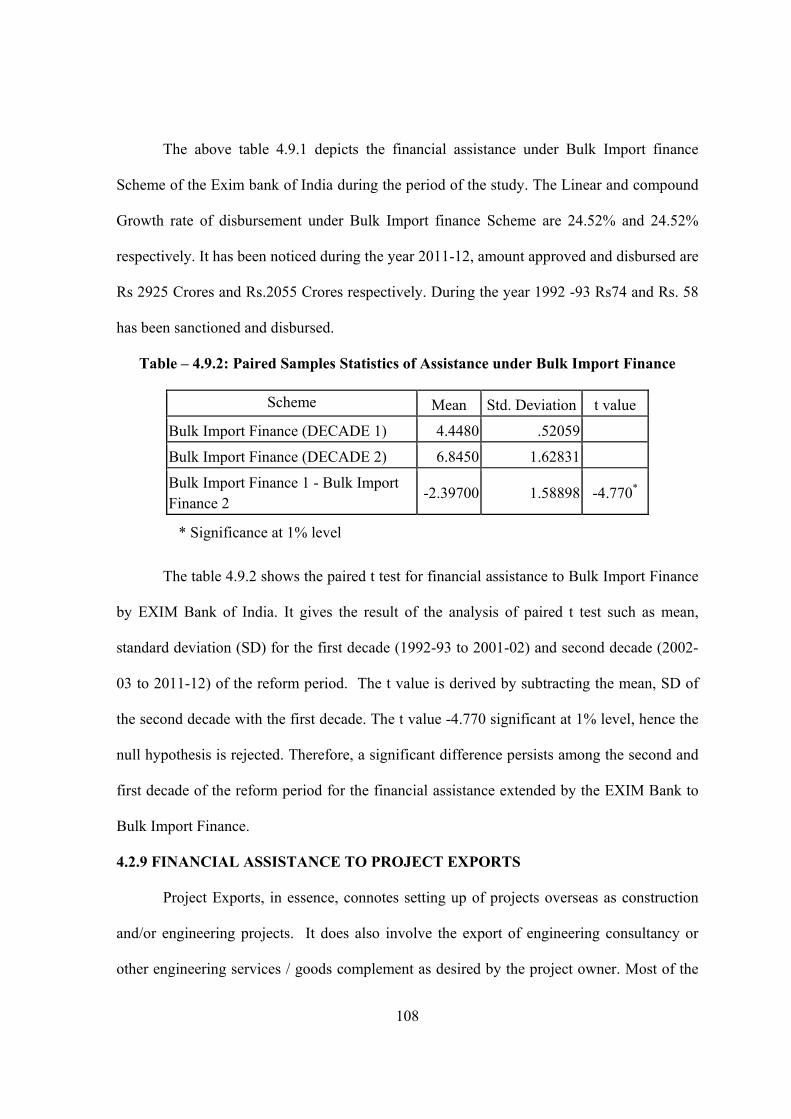
108
The above table 4.9.1 depicts the financial assistance under Bulk Import finance
Scheme of the Exim bank of India during the period of the study. The Linear and compound
Growth rate of disbursement under Bulk Import finance Scheme are 24.52% and 24.52%
respectively. It has been noticed during the year 2011-12, amount approved and disbursed are
Rs 2925 Crores and Rs.2055 Crores respectively. During the year 1992 -93 Rs74 and Rs. 58
has been sanctioned and disbursed.
Table – 4.9.2: Paired Samples Statistics of Assistance under Bulk Import Finance
Scheme Mean Std. Deviation t value
Bulk Import Finance (DECADE 1) 4.4480 .52059
Bulk Import Finance (DECADE 2) 6.8450 1.62831
Bulk Import Finance 1 - Bulk Import Finance 2
-2.39700 1.58898 -4.770*
* Significance at 1% level
The table 4.9.2 shows the paired t test for financial assistance to Bulk Import Finance
by EXIM Bank of India. It gives the result of the analysis of paired t test such as mean,
standard deviation (SD) for the first decade (1992-93 to 2001-02) and second decade (2002-
03 to 2011-12) of the reform period. The t value is derived by subtracting the mean, SD of
the second decade with the first decade. The t value -4.770 significant at 1% level, hence the
null hypothesis is rejected. Therefore, a significant difference persists among the second and
first decade of the reform period for the financial assistance extended by the EXIM Bank to
Bulk Import Finance.
4.2.9 FINANCIAL ASSISTANCE TO PROJECT EXPORTS
Project Exports, in essence, connotes setting up of projects overseas as construction
and/or engineering projects. It does also involve the export of engineering consultancy or
other engineering services / goods complement as desired by the project owner. Most of the

109
overseas projects are contracted, in dollars, and large engineering contractors who have been
operating overseas for quite some time have learnt the mechanism of necessary safeguards
against fluctuations in dollars. A decade in the history of Indian Project Exports has just gone
by - in which Indian engineering contractors and consultants have not only established an
impressive array of clientele in diverse fields of operation across the globe but have also
covered almost all sectors of civil engineering and industrial projects, most multilaterally
funded and involved international competitive bidding procedure.
Source: Annual Reports of Exim Bank of India (1992-93 to2011 – 12)
Table – 4.10.1: Assistance under Project Export Scheme( ` Crs.) No of Contracts Sanction
No of Country Covered
No of Exporters
1992 – 93 69 1270 10 - 1993 – 94 67 1677 28 - 1994 – 95 56 1703 25 - 1995 – 96 74 1603 24 381996 – 97 63 2320 20 341997 – 98 60 1895 21 321998 – 99 63 3307 24 281999 – 00 53 3444 19 272000 – 01 83 1833 23 212001 – 02 59 4162 26 342002 – 03 59 6531 45 1102003 – 04 164 7543 48 962004 – 05 570 7945 64 892005- 06 568 13530 64 1742006 – 07 820 18490 93 1722007 – 08 977 32683 92 1472008 – 09 1325 33527 105 1522009 – 10 1201 18378 95 1292010 – 11 1145 28348 96 1872011 – 12 1,146 31915 84 226Linear Growth 18.82%Compound Growth 20.71%

110
The above table 4.10.1 depicts the assistance under Project Export Finance Scheme,
with No. of contracts secured, No of country covered and the No of exporters of the Exim
bank of India during the period of the study. It has been noticed during the year 2011-12,
amount approved and disbursed are Rs31915. During the year 1992 -93, Rs1090 has been
sanctioned and disbursed. The Linear and compound Growth rate of disbursement under
Project Export Finance Scheme are 18.82% and 20.71% respectively.
Table – 4.10.2: Paired Samples Statistics of Financial Assistance under
Project Export Finance (PEF)
Schemes Mean Std. Deviation t value
Project Export Finance (DECADE 1) Project Export Finance (DECADE 2)
4.8210 .80709
9.2860 1.06498
Project Export Finance1 - Project Export Finance2
-4.46500 1.67386 -8.435*
* Significance at 1% level
The table 4.10 shows the paired t test for financial assistance to Project Export
Finance by EXIM Bank of India. It gives the result of the analysis of paired t test such as
mean, standard deviation (SD) for the first decade (1992-93 to 2001-02) and second decade
(2002-03 to 2011-12) of the reform period. The t value is derived by subtracting the mean,
SD of the second decade with the first decade. The t value -8.435 significant at 1% level,
hence the null hypothesis is rejected. Therefore, a significant difference persists among the
second and first decade of the reform period for the financial assistance extended by the
EXIM Bank to Project Export Finance.
111
4.3 ANALYSIS OF VARIANCE UNDER VARIOUS SCHEMES OF ASSISTANCE
An attempt has been made by the researcher, to find out whether there is significant
difference in the operational efficacy of Exim Bank of India between schemes, within the
scheme, between first and second decade of the post reform period and overall period of the
study. ANOVA has been applied for the same purpose.
Analysis of Variance is used to compare the means of more than two populations. It
uncovers the main and interaction effects of classification or independent variables on one or
more dependent variable. The F statistics calculates the ratio between the variance due to
difference between groups and the error variance.
F = Variance due to difference between groups / Error variance
Ho1: There is no significant difference among the various schemes of assistance during the
first decade of the reform period
The descriptive statistics during the first decade, towards various schemes of financial
assistance has been extended by the Exim Bank of India. The mean and the standard
deviation for the first decade of the reform period has been assessed and exhibited in the
table given below, to compute ANOVA for various schemes.
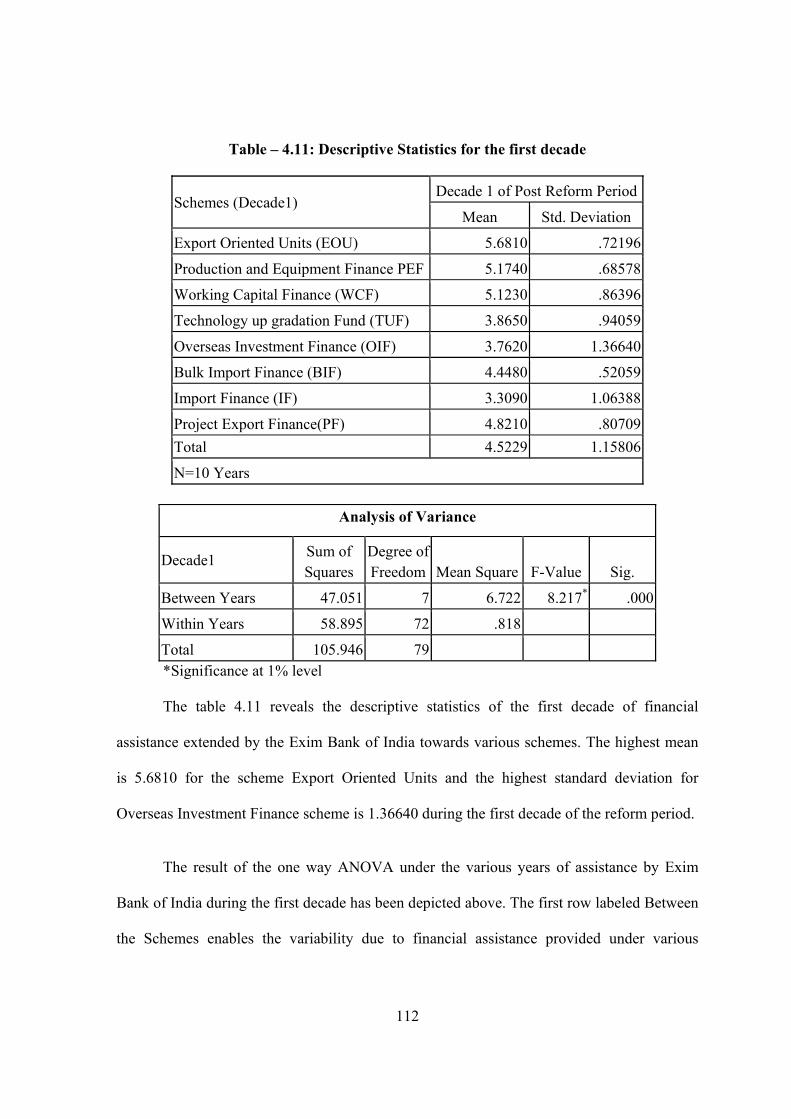
112
Table – 4.11: Descriptive Statistics for the first decade
Schemes (Decade1) Decade 1 of Post Reform Period
Mean Std. Deviation
Export Oriented Units (EOU) 5.6810 .72196
Production and Equipment Finance PEF 5.1740 .68578
Working Capital Finance (WCF) 5.1230 .86396
Technology up gradation Fund (TUF) 3.8650 .94059
Overseas Investment Finance (OIF) 3.7620 1.36640
Bulk Import Finance (BIF) 4.4480 .52059
Import Finance (IF) 3.3090 1.06388
Project Export Finance(PF) 4.8210 .80709 Total 4.5229 1.15806
N=10 Years
Analysis of Variance
Decade1 Sum of Squares
Degree of Freedom Mean Square F-Value Sig.
Between Years 47.051 7 6.722 8.217* .000
Within Years 58.895 72 .818
Total 105.946 79 *Significance at 1% level
The table 4.11 reveals the descriptive statistics of the first decade of financial
assistance extended by the Exim Bank of India towards various schemes. The highest mean
is 5.6810 for the scheme Export Oriented Units and the highest standard deviation for
Overseas Investment Finance scheme is 1.36640 during the first decade of the reform period.
The result of the one way ANOVA under the various years of assistance by Exim
Bank of India during the first decade has been depicted above. The first row labeled Between
the Schemes enables the variability due to financial assistance provided under various

113
schemes. The second row labeled within groups gives variability due to random error, and
the third row gives the total variability. The F value is 8.217and the corresponding p-value is
given as <0.000. Therefore the null hypothesis is rejected and concludes that the average
Schemes provided by the EXIM Bank of India is not the same in all the years of the First
Decade.
Ho2: There is no significant difference among the various schemes of assistance during the
Second decade of the reform period
The descriptive statistics during the second decade, towards various schemes of
financial assistance has been extended by the Exim Bank of India. The mean and the standard
deviation for the Second decade of the reform period has been assessed and exhibited in the
table given below, to compute ANOVA for various schemes.
Table – 4.12: Descriptive Statistics for the Second decade
Scheme (Decade 2) Decade 1 of Post Reform Period
Mean Std. Deviation
Export Oriented Units (EOU 2) 7.1590 .77030
Production and Equipment Finance (PEF 2) 5.6740 .43998
Working Capital Finance (WCF 2) 6.6830 .87837
Technology up gradation Fund (TUF 2) 6.8950 1.37747
Overseas Investment Finance (OIF 2) 6.8590 2.06826
Bulk Import Finance (BIF 2) 6.8450 1.62831
Import Finance (IF 2) 6.0400 .82683
Project Export Finance(PF 2) 9.2860 1.06498
Total 6.9301 1.55205
N= 10 Years

114
Analysis of Variance
Decade 2 Sum of Squares Df Mean Square F Sig.
Between Years 80.473 7 11.496 7.537* .000
Within Years 109.826 72 1.525
Total 190.299 79 *Significance at 1% level
From the table 4.12 it is apparent that descriptive statistics of various schemes of
financial assistance extended by the Exim Bank of India. It also shows the highest mean as
9.28 for the scheme Project Export Finance and the highest standard deviation as 2.068 for
Overseas Investment Finance scheme during second decade of the reform period.
The result of the one way ANOVA under the various years of assistance by Exim
Bank of India during the second decade has been exhibited above. The first row labeled
between the years enables the variability due to financial assistance provided under various
schemes. The second row labeled within years gives variability due to random error, and the
third row gives the total variability. The F value is 7.537and the corresponding p-value is
given as <0.000. Hence the null hypothesis is rejected. The average financial assistance to
various Schemes provided by the EXIM Bank of India is not the same in all the years of the
Second Decade.
Ho3: There is no significant difference between the years and the various schemes of
assistance during the first decade of the reform period
The descriptive statistics over the years of assistance under various schemes has been
extended by the Exim Bank of India. It also exhibits the mean and the standard deviation for
the various years in first decade of the reform period, so as to compute ANOVA, over the
years of assistance for various schemes.

115
Table – 4.13: Descriptive Statistics for various Schemes
Years Mean Std. Deviation
1992-93 3.8938 1.12844
1993-94 3.7525 1.66110
1994-95 4.4487 .83533
1995-96 4.6712 .87089
1996-97 4.6262 .96279
1997-98 4.6175 .90426
1998-99 4.5162 1.30283
1999-00 4.5500 1.36616
2000-01 5.1375 .62602
2001-02 5.0150 1.43252
Total 4.5229 1.15806
N= 8 Schemes
Analysis of Variance
Schemes (Decade-1) Sum of Squares Df Mean Square F Sig.
Between schemes 13.257 9 1.473 5.112* .046
Within Schemes 92.689 70 1.324
Total 105.946 79
The table 4.13 shows the descriptive statistics over the years of assistance for various
schemes extended by the Exim Bank of India. It also exhibits the highest mean as 5.13 during
2000–01 and the standard deviation as1.661 during 1993-94 among the various years in first
decade of the reform period.

116
The result of the one way ANOVA under the various schemes of assistance of Exim
Bank of India has been exhibited above. The first row labeled between the schemes enables
the variability due to financial assistance provided over the period. The second row labeled
within years gives variability due to random error, and the third row gives the total
variability. The F value is 7.537and the corresponding p-value is given as <0.000. Hence the
null hypothesis is rejected. The average financial assistance over the period under various
Schemes provided by the EXIM Bank of India is not the same in all the schemes of the
Second Decade.
Ho4: There is no significant difference between the years and the various schemes of
assistance during the Second decade of the reform period
The descriptive statistics over the years of assistance under various schemes has been
extended by the Exim Bank of India are exhibited. It also exhibits the mean and the standard
deviation for the various years in second decade of the reform period, so as to compute
ANOVA, over the years of assistance for various schemes.
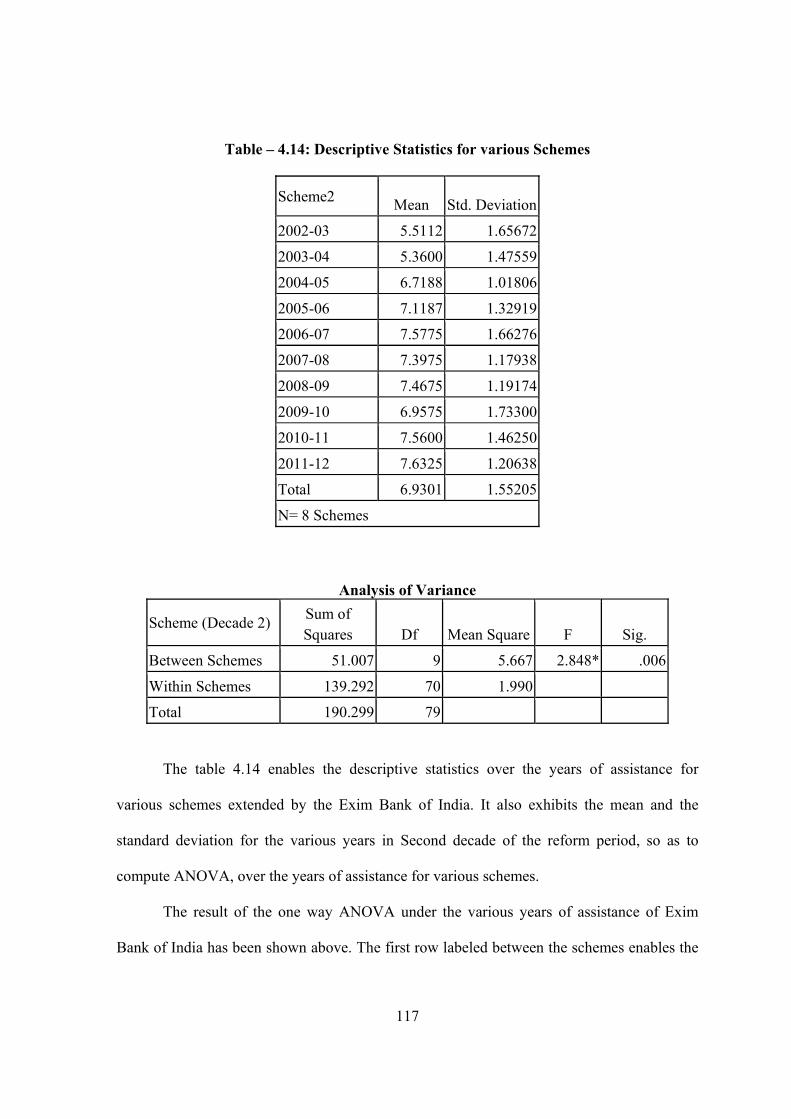
117
Table – 4.14: Descriptive Statistics for various Schemes
Scheme2 Mean Std. Deviation
2002-03 5.5112 1.65672
2003-04 5.3600 1.47559
2004-05 6.7188 1.01806
2005-06 7.1187 1.32919
2006-07 7.5775 1.66276
2007-08 7.3975 1.17938
2008-09 7.4675 1.19174
2009-10 6.9575 1.73300
2010-11 7.5600 1.46250
2011-12 7.6325 1.20638
Total 6.9301 1.55205
N= 8 Schemes
Analysis of Variance
Scheme (Decade 2) Sum of Squares Df Mean Square F Sig.
Between Schemes 51.007 9 5.667 2.848* .006
Within Schemes 139.292 70 1.990
Total 190.299 79
The table 4.14 enables the descriptive statistics over the years of assistance for
various schemes extended by the Exim Bank of India. It also exhibits the mean and the
standard deviation for the various years in Second decade of the reform period, so as to
compute ANOVA, over the years of assistance for various schemes.
The result of the one way ANOVA under the various years of assistance of Exim
Bank of India has been shown above. The first row labeled between the schemes enables the

118
variability due to financial assistance provided over the period. The second row labeled
within years gives variability due to random error, and the third row gives the total
variability. The F value is 2.848 and the corresponding p-value is given as <0.000. Hence the
null hypothesis is rejected. The average financial assistance under various Schemes provided
by the EXIM Bank of India is not the same in all the schemes of the Second Decade.
Ho5: There is no significant difference among the various schemes of assistance during the
reform period
Given below is the descriptive statistics over the years of assistance for various
schemes extended by the Exim Bank of India. It also shows the mean and the standard
deviation for the various years in first decade of the reform period, so as to compute
ANOVA, over the years of assistance for various schemes.
Table – 4.15: Descriptive Statistics for the reform period (1992-93 to 2011-12)
Schemes Mean Std. Deviation
EOU 6.4200 1.05016
PEF 5.4240 .61665
WC 5.9030 1.16596
TUF 5.3800 1.93233
OIF 5.3105 2.33125
BIF 5.6465 1.70185
FFI 4.6745 1.68009
PF 7.0535 2.46823
Total 5.7265 1.82236
N= 20 Years

119
Analysis of Variance
Reform Period Sum of Squares Df Mean Square F Sig.
Between Years 75.415 7 10.774 3.618 .001
Within Years 452.624 152 2.978
Total 528.039 159
The table 4.15 shows the descriptive statistics over the years of assistance for various
schemes extended by the Exim Bank of India. It also exhibits the highest mean as 7.05 for
Project export finance and the high standard deviation as 2.46 for the various years in first
decade of the reform period, so as to compute ANOVA, over the years of assistance for
various schemes.
The result of the one way ANOVA under the various schemes of assistance of Exim
Bank of India has been exhibited above. The first row labeled between the schemes enables
the variability due to financial assistance provided over the period. The second row labeled
within years gives variability due to random error, and the third row gives the total
variability. The F value is 5.112and the corresponding p-value is given as <0.000. Hence the
null hypothesis is rejected. The average financial assistance over the period under various
Schemes provided by the EXIM Bank of India is not the same in all the years over the period
of the study.
Ho6: There is no significant difference between the years and the various schemes of
assistance during the Second decade of the reform period
The descriptive statistics over the years of assistance under various schemes has been
extended by the Exim Bank of India are exhibited. It also exhibits the mean and the standard

120
deviation for the various years of the study period, so as to compute ANOVA, over the years
of assistance for various schemes.
Table – 4.16: Descriptive Statistics for various Schemes of assistance
Reform Period Mean Std. Deviation
1992-93 3.8938 1.12844
1993-94 3.7525 1.66110
1994-95 4.4487 .83533
1995-96 4.6712 .87089
1996-97 4.6262 .96279
1997-98 4.6175 .90426
1998-99 4.5162 1.30283
1999-00 4.5500 1.36616
2000-01 5.1375 .62602
2001-02 5.0150 1.43252
2002-03 5.5112 1.65672
2003-04 5.3600 1.47559
2004-05 6.7188 1.01806
2005-06 7.1187 1.32919
2006-07 7.5775 1.66276
2007-08 7.3975 1.17938
2008-09 7.4675 1.19174
2009-10 6.9575 1.73300
2010-11 7.5600 1.46250
2011-12 7.6325 1.20638
Total 5.7265 1.82236
N= 8 Schemes

121
Analysis of Variance
Schemes Sum of Squares Df Mean Square F Sig.
Between Schemes 296.058 19 15.582 9.404 .000
Within Schemes 231.981 140 1.657
Total 528.039 159
The table 4.16 shows the descriptive statistics over the years of assistance for various
schemes extended by the Exim Bank of India. It also exhibits the highest mean as 7.63 and
the standard deviation as1.82 during the year 2011 – 12 for the various years of the study
period, so as to compute ANOVA, over the years of assistance for various schemes.
The result of the one way ANOVA under the various schemes of assistance of Exim
Bank of India has been exhibited above. The first row labeled between the schemes enables
the variability due to financial assistance provided over the period. The second row labeled
within years gives variability due to random error, and the third row gives the total
variability. The F value is 9.404and the corresponding p-value is given as <0.000. Hence the
null hypothesis is rejected. The average financial assistance over the period under various
Schemes provided by the EXIM Bank of India is not the same in all the schemes of the
Second Decade.
In this chapter, scheme wise analysis of sanctions and disbursement of loan extended
by the exim bank of India were discussed and analysed for the I decade and II decade of the
financial sector reform period. Further overall analysis for the entire period of the study has
also been carried out. The analysis was based on the classification of major schemes namely
Export Oriented Units (EOUs), Production Equipment Finance(PEP),Working Capital
Finance (WCF), Technology Up gradation Fund (TUF), Overseas Investment Finance (OIF),

122
Import Finance (IF), Project Export Finance(PF). The assistance provided towards the
various schemes was in an increasing trend during both the decade of reform period. Among
the schemes Project Export finance has been identified as a major contributor towards the
business of the Export Import Bank. In case of the overall financial assistance under the
various schemes extended by the Export Import Bank of India is in an ascending trend. The
Gap between the sanction and disbursement of financial assistance by the Exim Bank is also
gradually declining during the period of study. To conclude, the analysis of the operating
efficacy of Export Import Bank of India exhibits a better lending performance during study
period.

CHAPTER V
FINANCIAL EFFICACY OF EXIM BANK OF INDIA – AN EVALUATION
5.1 SOLVENCY RATIOS
5.1.1CURRENT RATIO
5.1.2 DEBT EQUITY RATIO
5.1.3 FIXED ASSET RATIO
5.1.4 PROPRIETARY RATIO
5.1.5 CAPITAL TO ASSET RATIO
5.2 PROFITABILITY RATIOS
5.2.1 PBT TO CAPITAL RATIO
5.2.2 PBT TO NET WORTH RATIO
5.2.3 RETURN ON CAPITAL EMPLOYED
5.2.4 INTEREST SPREAD
5.3 ACTIVITY RATIOS
5.4 CAMEL RATINGS OF EXIM BANK OF INDIA
5.5 ALTMAN’S MULTIPLE DISCRIMINATE ANALYSIS OF EXIM BANK

123
CHAPTER V
FINANCIAL EFFICACY OF EXIM BANK OF INDIA – AN EVALUATION
Financial statements are indicators of two significant factors such as profitability and
financial soundness. Analysis and interpretation of financial statement therefore refers to
such a treatment of information contained in the financial reports so as to afford full
diagnosis of the profitability and financial soundness of the financial institutions. A
distinction can be made between analysis and interpretation. The analysis means methodical
classification of data given in financial statements in a simplified form. The interpretation
means explaining the meaning and significance of the data so simplified. However both
analysis and interpretation are complement to each other. Financial statement analysis is
largely a study of relationship among various financial factors in a financial institution as
disclosed by a set of financial reports and a study of these factors as shown in a series of
statements.
Financial performance analysis is the process of identifying the financial strengths
and weaknesses of the firm by properly establishing the relationship between the items of
balance sheet and profit and loss account. It also helps in short term and long term
forecasting and growth can be identified with the help of financial performance analysis. The
dictionary meaning of ‘analysis’ is to resolve or separate a thing into its element or
components parts for tracing their relation to the things as whole and to each other. The
analysis of financial statement is a process of evaluating the relationship between the
component parts of financial statement to obtain a better understanding of the firm’s position
and performance. A financial statement is an organised collection of data according to
124
logical and consistent accounting procedure. Its purpose is to convey an understanding of
some financial aspects of financial institutions.
Financial ratios indicate about the financial position of the institutions. An institution
is deemed to be financially sound if it is in a position to carry on its business activities
smoothly and meets its obligations, both short term as well as long term without strain. It is a
sound principle of finance that the short term requirement of funds should me met out of
short term funds and long term requirement should be met out by long term funds.
In this chapter the researcher has made an attempt to analyse liquidity, solvency and
profitability of EXIM Bank of India with the aid of its financial statement information.
5.1 SOLVENCY RATIOS
5.1.1CURRENT RATIO
A current ratio is an index of the institutions financial stability. Since it shows the
extent of working capital which is the amount by which current asset exceeds current
liabilities. It also exhibits the short term solvency of an institution. Higher the solvency ratio
states a strong financial position. Lesser the solvency ratio indicates weaker financial
position. It is an indicator of the EXIM Bank‘s commitment to meet the short term liabilities.
It establishes the relationship between two variables that is current assets and current
liabilities.

125
Table: 5.1 Current Ratio
Year
Current assets
(`. Millions)
Current liabilities
(`.Millions)
Current Ratio
(in times) 1991-92 4257.7 3750.2 1.14 1992-93 5529.3 5510.8 1.00 1993-94 3901.7 4264.6 0.91 1994-95 3127.3 6068.3 0.52 1995-96 5098.4 7099 0.72 1996-97 8345.8 8708.1 0.96 1997-98 6450.8 8706.4 0.74 1998-99 7611.4 9082 0.84 1999-00 9766.4 11289.4 0.87 2000-01 9688.7 11878.4 0.82 2001-02 6488.7 11053.2 0.59 2002-03 18817.3 13064.3 1.44 2003-04 32532.5 14594 2.23 2004-05 36106.8 17136.7 2.11 2005-06 10513.4 12824.7 0.82 2006-07 13943.5 16798.7 0.83 2007-08 54705.8 23640.7 2.31 2008-09 66524.4 31397.9 2.12 2009-10 52947.3 20406.4 2.59 2010-11 58069.2 23392.4 2.48 2011-12 59026.3 30299.3 1.95
Source: Compiled from various annual reports of Exim Bank of India1991 -92 to 2011 -12
The table 5.1 depicts Current ratio of the EXIM Bank of India. The financial soundness
of EXIM Bank was high during the second decade of the reform period, in 2009-10 was
2.59 as compared with that of the first decade of the reform period very low, in 1994 -95was
0.52.The current ratio states the the banks short term solvency is in a better position.

126
5.1.2 DEBT EQUITY RATIO
Long term solvency enables the financial institution like EXIM Bank of India to
ascertain the soundness of the financial policies of the institution or Bank. It states the
relationship between long term borrowing and the shareholders fund. The ratio indicates the
proportion of owner stake in business. Excessive liabilities tend to cause insolvency. The
ratio indicates the extent to which the firm depends upon outsiders for its existence. The ratio
provides a margin of safety to the creditors it also tells the owners the extent to which they
can gain the benefits or maintain control within a limited investments.
Source: Compiled from various annual reports of Exim Bank of India 1991 - 92 to 2011-12
Table:5.2 Debt - Equity Ratio
Year
Long term borrowings
(`. Millions)
Shareholder's funds
(`. Millions)
Ratio in
times 1991-92 15737.6 5468.8 2.88 1992-93 16273.3 5462.1 2.98 1993-94 17324.9 6150.3 2.82 1994-95 20870.3 7860.3 2.66 1995-96 22207.3 9375 2.37 1996-97 29517.1 10625.9 2.78 1997-98 30075.1 12256.2 2.45 1998-99 34135.9 13564 2.52 1999-00 41298.2 15310.9 2.70 2000-01 43169.5 16405.5 2.63 2001-02 53193.2 18784.6 2.83 2002-03 90489.8 19944.6 4.54 2003-04 119205.4 21721.4 5.49 2004-05 142058.8 25424.2 5.59 2005-06 160090 28382.5 5.64 2006-07 216616.2 29068.7 7.45 2007-08 317163.2 32410.5 9.79 2008-09 372022.9 39060.4 9.52 2009-10 405087.3 45714.4 8.86 2010-11 471917.4 52719.5 8.95 2011-12 546545.8 60449.5 9.04

127
The table 5.2 reveals the Debt Equity ratio of Exim Bank of India. The ratio
indicates the proportion of owner stake in business. During the second decade of the reform
period which is very high in 2007–08 as 9.79, when compared to the first decade of the
financial sector reform period, the debt equity ratio was low in 1997–98 as 2.45 times which
establishes the financial instability in the long run because of its huge borrowing in both the
decades of the reform period.
5.1.3 FIXED ASSET RATIO The ratio explains whether the firm has raised adequate long term funds to meet its
fixed asset requirements. The purpose of calculating this ratio is to ascertain the proportion of
long term funds invested in fixed assets. The ratio should be less than 1. If the ratio is less
than one it indicates that portion of working capital has been financed by long term funds.

128
Table 5.3 Fixed Asset Ratio
Year
Net fixed assets
(`. Millions)
Long term borrowings
(`. Millions) Ratio in
times 1991-92 103.8 15737.6 0.006596 1992-93 89 16273.3 0.005469 1993-94 75.1 17324.9 0.004335 1994-95 98.7 20870.3 0.004729 1995-96 109.5 22207.3 0.004931 1996-97 267.4 29517.1 0.009059 1997-98 250.1 30075.1 0.008316 1998-99 258 34135.9 0.007558 1999-00 317.7 41298.2 0.007693 2000-01 355.1 43169.5 0.008226 2001-02 504.7 53193.2 0.009488 2002-03 503 90489.8 0.005559 2003-04 630.1 119205.4 0.005286 2004-05 587.9 142058.8 0.004138 2005-06 575.7 160090 0.003596 2006-07 812.1 216616.2 0.003749 2007-08 753.4 317163.2 0.002375 2008-09 884.5 372022.9 0.002378 2009-10 907.7 405087.3 0.002241 2010-11 859.9 471917.4 0.001822 2011-12 909.9 546545.8 0.001665
Source: Compiled from various annual reports of Exim Bank of India1991 -92 to 2011 -12.
The table5.3 reveals the relationship between the net fixed assets and long term
borrowings of Exim Bank of India. The Exim Bank has not raised long term funds to meet its
fixed asset requirements. The ratio also indicates during the first and second decade of the
reform period it is less than one, and explains the same.
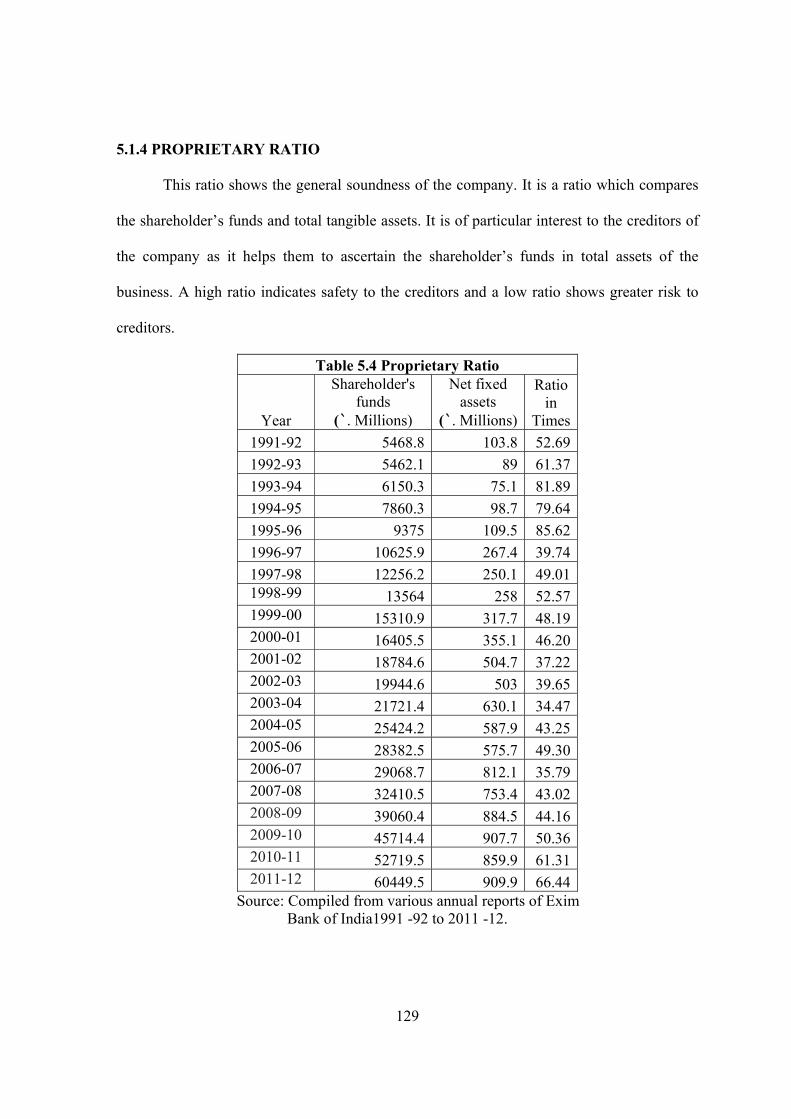
129
5.1.4 PROPRIETARY RATIO
This ratio shows the general soundness of the company. It is a ratio which compares
the shareholder’s funds and total tangible assets. It is of particular interest to the creditors of
the company as it helps them to ascertain the shareholder’s funds in total assets of the
business. A high ratio indicates safety to the creditors and a low ratio shows greater risk to
creditors.
Table 5.4 Proprietary Ratio
Year
Shareholder's funds
(`. Millions)
Net fixed assets
(`. Millions)
Ratio in
Times 1991-92 5468.8 103.8 52.69 1992-93 5462.1 89 61.37 1993-94 6150.3 75.1 81.89 1994-95 7860.3 98.7 79.64 1995-96 9375 109.5 85.62 1996-97 10625.9 267.4 39.74 1997-98 12256.2 250.1 49.01 1998-99 13564 258 52.57 1999-00 15310.9 317.7 48.19 2000-01 16405.5 355.1 46.20 2001-02 18784.6 504.7 37.22 2002-03 19944.6 503 39.65 2003-04 21721.4 630.1 34.47 2004-05 25424.2 587.9 43.25 2005-06 28382.5 575.7 49.30 2006-07 29068.7 812.1 35.79 2007-08 32410.5 753.4 43.02 2008-09 39060.4 884.5 44.16 2009-10 45714.4 907.7 50.36 2010-11 52719.5 859.9 61.31 2011-12 60449.5 909.9 66.44
Source: Compiled from various annual reports of Exim Bank of India1991 -92 to 2011 -12.

130
The table5.4 reveals the Proprietary ratio of Exim Bank of India. It further elicits that
the is very high proprietary ratio which states the greater soundness of the Exim bank of
India during the first and second decade of reform period.
5.1.5 CAPITAL TO ASSET RATIO
This ratio is compared with capital with total asset of Exim bank of India . It explain
the relationship between the capital and assets.
Table 5.5 Capital to Asset Ratio
Year Total capital (`. Millions)
Total assets (`. Millions) Ratio in %
1991-92 2961.5 24956.6 11.87 1992-93 3355.8 27246.2 12.32 1993-94 3574.2 29244.2 12.22 1994-95 4403.3 36418.7 12.09 1995-96 4999.9 40085.6 12.47 1996-97 4999.9 49510.7 10.10 1997-98 4999.9 51408.8 9.73 1998-99 4999.9 56885.8 8.79 1999-00 5499.9 70515.7 7.80 2000-01 5499.9 74250.6 7.41 2001-02 6499.9 83031 7.83 2002-03 6499.9 123499 5.26 2003-04 6499.9 155521 4.18 2004-05 8499.9 184640 4.60 2005-06 9499.9 202114 4.70 2006-07 9999.9 263205 3.80 2007-08 10999.9 374384 2.94 2008-09 13999.9 443879 3.15 2009-10 16999.9 472752 3.60 2010-11 19999.9 548029 3.65 2011-12 22999.9 637295 3.61
Source: Compiled from various annual reports of Bank of India1991 -92 to 2011 -12.

131
The table 5.5 exhibits the ratio between the capital to total assets of Exim bank of
India. It also explains that there is low ratio of 2.94 % during the year 2007 – 08 in the
second decade of reform when compared to the first decade it records a high ratio of 12.47 %
in 1995 – 96.
5.2 PROFITABILITY RATIOS
5.2.1 PBT TO CAPITAL RATIO
This is ratio between profit before tax and Capital. It explains the relationship
between the variables profit before tax with capital. It states the return that a firm has earned.
Higher the ratio, higher the profitability of the firm and vice versa
Table 5.6 PBT to Capital Ratio
Year PBT
(`.Millions)Total capital (`. Millions)
Ratio in percentage
1991-92 562 2961.5 18.98 1992-93 498.8 3355.8 14.86 1993-94 606.8 3574.2 16.98 1994-95 811.6 4403.3 18.43 1995-96 1140.7 4999.9 22.81 1996-97 1569.1 4999.9 31.38 1997-98 2034.7 4999.9 40.69 1998-99 2418.8 4999.9 48.38 1999-00 2297.5 5499.9 41.77 2000-01 2071.9 5499.9 37.67 2001-02 2237.1 6499.9 34.42 2002-03 2708.6 6499.9 41.67 2003-04 3063.3 6499.9 47.13 2004-05 3160.6 8499.9 37.18 2005-06 3788 9499.9 39.87 2006-07 2932.4 9999.9 29.32 2007-08 5362.5 10999.9 48.75 2008-09 6897.6 13999.9 49.27 2009-10 7753.2 16999.9 45.61 2010-11 8705.4 19999.9 43.53
132
2011-12 10169.3 22999.9 44.21 Source: Compiled from various annual reports of Exim Bank of India1991 -92 to 2011 -12. The table 5.6 elicits the ratio between the profit before tax and capital of Exim bank
of India. It also further state about the profitability of the Exim Bank of India. It has been
recorded that a higher profitability of 49.27 % during the year 2008 – 09 in the second
decade of financial sector reform when compared with the first decade of the reform it has
been recorded a lower profitability of 14.86 % during the year 1992 – 93.
5.2.2 PBT TO NET WORTH RATIO
This ratio compares the relationship between profits before tax to net worth. It
explains return on net worth. It also further states more the ratio more is the return on net
worth of the firm and vice versa. It is a measure of profit before tax and net worth.

133
Table 5.7 PBT to Net worth Ratio
Year PBT (`.Millions)
Net worth (`. Millions) Ratio %
1990-91 461.7 4618.1 10.00 1991-92 562 5468.8 10.28 1992-93 498.8 5462.1 9.13 1993-94 606.8 6150.3 9.87 1994-95 811.6 7860.3 10.33 1995-96 1140.7 9375 12.17 1996-97 1569.1 10625.9 14.77 1997-98 2034.7 12256.2 16.60 1998-99 2418.8 13564 17.83 1999-00 2297.5 15310.9 15.01 2000-01 2071.9 16405.5 12.63 2001-02 2237.1 18784.6 11.91 2002-03 2708.6 19944.6 13.58 2003-04 3063.3 21721.4 14.10 2004-05 3160.6 25424.2 12.43 2005-06 3788 28382.5 13.35 2006-07 2932.4 29068.7 10.09 2007-08 5362.5 32410.5 16.55 2008-09 6897.6 39060.4 17.66 2009-10 7753.2 45714.4 16.96 2010-11 8705.4 52719.5 16.51 2011-12 10169.3 60449.5 16.82
Source: Compiled from various annual reports of Exim Bank of India1991 -92 to 2011 -12 The table 5.7 elicits the ratio between the profits before tax to net worth of Exim
bank of India. It also further state about the profitability of the Exim Bank of India. It has
been recorded that a higher profitability of 17.66 % during the year 2008 – 09 in the second
decade of financial sector reform when compared with the first decade of the reform it has
been recorded a lower profitability of 9.13% during the year 1992 – 93.

134
5.2.3 RETURN ON CAPITAL EMPLOYED
Return on Capital Employed is a ratio that indicates the efficiency and profitability of
a company’s capital investments. It is a measure of business performance. The amount of
capital employed is calculated by subtracting current liabilities from total assets. It is a
measure of pre- tax earnings belonging to all sources of finance and represents total
financing.
Table5.8 Return on Capital Employed
Year PBT
(`.Millions)
Capital Employed
(`.Millions) Ratio % 1990-91 461.7 17998 2.57% 1991-92 562 21206.4 2.65% 1992-93 498.8 21735.4 2.29% 1993-94 606.8 23475.2 2.58% 1994-95 811.6 28730.6 2.82% 1995-96 1140.7 31582.3 3.61% 1996-97 1569.1 40143 3.91% 1997-98 2034.7 42331.3 4.81% 1998-99 2418.8 47699.9 5.07% 1999-00 2297.5 56609.1 4.06% 2000-01 2071.9 59575 3.48% 2001-02 2237.1 71977.8 3.11% 2002-03 2708.6 110434.4 2.45% 2003-04 3063.3 140926.8 2.17% 2004-05 3160.6 167483 1.89% 2005-06 3788 188472.5 2.01% 2006-07 2932.4 245684.9 1.19% 2007-08 5362.5 349573.7 1.53% 2008-09 6897.6 411083.3 1.68% 2009-10 7753.2 450801.7 1.72% 2010-11 8705.4 524636.9 1.66% 2011-12 10169.3 606995.3 1.68%
Source: Compiled from various annual reports of Exim Bank of India1991 -92 to 2011 -12
135
The table 5.8 elicits the ratio between the profits before tax to Capital Employed of
Exim bank of India. It also further state about the profitability of the Exim Bank of India. It
has been recorded a lower return of 1.19 % during the year 2006 – 07 in the second decade of
financial sector reform when compared with the first decade of the reform it has been
recorded a higher return of 5.07% during the year 1998 – 99.
5.2.4 INTEREST SPREAD
Interest Spread is the difference between the interest income earned and interest
expended. It explains the spread of the interest income over the interest expenditure. The
spread between the interest income and interest income is useful for Banks and Development
Financial Institutions.

136
Source: Compiled from various annual reports of Exim Bank of India1991 -92 to 2011 -12
The table 5.9 reveals the interest spread of the Exim Bank of India. It also further
states there is an increasing trend in the both the decades of the financial sector reform
period. During the second decade of the reform period the Exim bank records a highest
spread is `.12691.2 crores in the year 2011–12 as compared with the first decade of the
reform period lowest spread is `. 596.5 in 1992–93.
Table5.9 Interest spread of Exim Bank of India (`.Millions)
Year (1) Interest
Income (2) Interest Paid
(3) Spread
(4)=(2)-(3) 1991-92 1792.2 1132.2 660.0 1992-93 1871.6 1275.1 596.5 1993-94 2170.9 1459.4 711.5 1994-95 2557.5 1691.4 866.1 1995-96 3294.0 2132.3 1161.7 1996-97 4266.9 2620.6 1646.3 1997-98 4864.3 2809.4 2054.9 1998-99 5378.1 2901.1 2477.0 1999-00 6044.6 3644.9 2399.7 2000-01 6764.4 4519.8 2244.6 2001-02 6034.0 4257.1 1776.9 2002-03 6953.1 4903.1 2050.0 2003-04 8663.1 6207.0 2456.1 2004-05 10281.7 7384.4 2897.3 2005-06 13595.4 10252.5 3342.9 2006-07 18452.3 15119.8 3332.5 2007-08 24367.5 20040.0 4327.5 2008-09 31299.8 24138.3 7161.5 2009-10 28589.9 20713.2 7876.7 2010-11 33209.6 23247.4 9962.2 2011 -12 42062.0 29370.8 12691.2

137
5.3 ACTIVITY RATIO
Management of financial institution is generally evaluated in terms of capital
adequacy, asset quality, earnings and profitability, liquidity and risk sensitivity ratings. In
addition, performance evaluation includes compliance with set norms, ability to plan and
react to changing circumstances, technical competence, leadership and administrative ability
of the bank. Sound management is one of the most important factors behind financial
institutions‘performance. Indicators of quality of management, however, are primarily
applicable to individual institutions, and cannot be easily aggregated across the sector.
Management efficacy of a bank could be measured by parameter like: (i) Compensation per
employee, (ii) business per employee, (iii) Profit per employee etc.

138
Table: 5.10 Activity Ratios of Exim Bank of India
Year
Compensation
per
employee
Rs Millon
Business
per
employee
Rs Millon
PBT
per
employee
Rs.
Millon
PAT
per
employee
Rs.Millon
1991-92 149.24 122618.94 4257.58 4257.58
1992-93 171.43 146380.16 3958.73 3958.73
1993-94 194.26 179228.69 4973.77 4973.77
1994-95 219.67 226273.77 6652.46 6652.46
1995-96 309.49 224316.79 8326.28 8326.28
1996-97 220.13 236123.49 10530.87 10530.87
1997-98 246.36 255817.22 13474.83 13474.83
1998-99 261.73 263911.11 14930.86 10260.49
1999-00 363.33 356393.33 15316.67 11103.33
2000-01 476.62 384731.82 13453.90 10107.14
2001-02 330.67 418824.54 13724.54 10601.23
2002-03 403.59 525418.56 16219.16 12464.07
2003-04 360.00 567155.26 16122.63 12142.11
2004-05 490.16 694883.42 16376.17 13419.17
2005-06 571.50 879697.00 18940.00 13600.50
2006-07 586.32 1079579.72 13832.08 9480.19
2007-08 453.15 1296284.23 24155.41 15088.29
2008-09 530.17 1472296.98 29731.03 20719.40
2009-10 767.67 1682609.05 33418.97 22216.38
2010-11 1089.75 1871174.59 35677.87 23995.90
2011 -12 938.34 2130064.43 40194.86 26798.81
Source: Compiled from various Annual Reports of Exim Bank of India1991 -92 to 2011 -12. The table 5.10 shows the activity ratio of Exim Bank of India. It also depicts the
various activities such as compensation per employee, business per employee, profit before

139
tax per employee, profit after tax per employee. It states during the second decade of the
reform period compensation per employee is highest during 2010-11 is Rs.1089.75 business
per employee is highest during 2011-12 is Rs.2130064.43 Million, profit before tax is highest
in 2011 -12, is Rs. 40194.86 Million, profit after tax is highest in 2011-12, is Rs. 26798.81
Million when compared with the first decade of the reform period compensation per
employee is lowest during 1991-92 is Rs. 149.24 Million, business per employee is lowest
during 1991-92 is Rs. 122618.94 Million, profit before tax is highest in 1991-92, is 4257.58
Million, profit after tax is highest in 1991-92, is Rs. 4257.58 Million.
5.4 CAMEL RATINGS OF EXIM BANK OF INDIA
"CAMEL" as acronym CAMEL refers to the five components of a bank's financial
condition Viz., Capital adequacy, Asset quality, Management, Earnings, and Liquidity
characters of a commercial bank. CAMEL is basically a ratio-based model for evaluating the
performance of the banks periodically. Various ratios forming this model have been
explained individually and collectively.
C- CAPITAL ADEQUACY Capital base of financial institutions facilitates depositors in
forming their risk perception about the institutions. The most widely used indicator of capital
adequacy is capital to risk-weighted assets ratio (CRWA). According to Bank Supervision
Regulation Committee (The Basle Committee) of Bank for International Settlements, a
minimum 9 percent CRWA is required. Capital adequacy determines how well financial
institutions can cope with shocks to their balance sheets. Thus, it is useful to track capital-
adequacy ratios that take into account the most important financial risks—foreign exchange,
credit, and interest rate risks—by assigning risk weightings to the institution‘s assets.
A – ASSET QUALITY Asset quality determines the healthiness of financial institutions
against loss of value in the assets. The weakening value of assets, being prime source of

140
banking problems, directly pour into other areas, as losses are eventually written-off against
capital, which ultimately expose the earning capacity of the institution. The asset quality is
gauged in relation to the level and severity of non-performing assets, adequacy of provisions,
recoveries, distribution of assets etc. Popular indicators include nonperforming loans to
advances, loan default to total advances, and recoveries to loan default ratios.
M – MANAGEMENT EFFICACY Management of financial institution is generally
evaluated in terms of capital adequacy, asset quality, earnings and profitability, liquidity and
risk sensitivity ratings. In addition, performance evaluation includes compliance with set
norms, ability to plan and react to changing circumstances, technical competence, leadership
and administrative ability of the bank. Sound management is one of the most important
factors behind financial institutions‘ performance. Indicators of quality of management,
however, are primarily applicable to individual institutions, and cannot be easily aggregated
across the sector.
E –EARNING ABILITY Earnings and profitability, the prime source of increase in capital
base, is related with regards to interest rate policies and adequacy of provisioning. Further, it
also helps to support present and future operations of the institutions. The single best
measure used to earning is the Return on Assets (ROA), which is net income after taxes to
total asset ratio. Good earnings and profitability of banks reflects the ability to support
present and future operations. Specifically, this determines the capacity to absorb losses,
finance its expansion, pay dividends to its shareholders, and build up an adequate level of
capital.
L – LIQUIDITY An adequate liquidity position refers to a situation, where institution can
obtain sufficient funds, either by increasing liabilities or by converting its assets quickly at a
141
reasonable cost. It is, therefore, generally assessed in terms of overall assets and liability
management, as mismatching gives rise to liquidity risk. The term liquidity is used in various
ways, all relating to availability of, access to, or convertibility into cash. An institution is said
to have liquidity if it can easily meet its needs for cash either because it has cash on hand or
can otherwise raise or borrow cash.
RATIO TAKEN FOR THE STUDY
C Capital Adequacy ratio
A Non-performing assets (NPAs)
M Business per employee, Profit per employee, Return on equity, Return on
advances
E Interest Income ratio, Net Interest Margin ratio, Return on Assets ratio
L Current Ratio
CAPITAL ADEQUACY OF EXIM BANK OF INDIA
Maintaining adequate capital fund is the mandatory norms for all the Finacial
institutions. It helps to impose confidence in the minds of stake holders. The capital adequacy
affects the financial position of the finacial institutions. The international banking regulators,
BCBS (Basel Committee for Banking Supervision) have stipulated a minimum Capital
Adequacy Ratio (CAR) of 8 percent. In India, the minimum CAR is stipulated as 9 percent
by the Reserve Bank of India. To assess the capital adequacy of the Exim bank parameter
under CAMEL framework Capital Adequacy Ratio has been used in this Chapter.
142
ASSET QUALITY OF EXIM BANK OF INDIA
Asset quality of commercial banks helps to diagnose the efficacy viability of the
assets held by the banks. It could be measured by the ratio of non-performing assets (NPAs)
in the total advances of Exim Bank of India.
MANAGEMENT EFFICACY OF EXIM BANK OF INDIA
Management efficacy of a bank could be measured by parameter like: (i) business per
employee, (ii) Profit per employee (iii) RoE (iv) Return on advances. The management
efficacy of the Exim Bank of India has been derived with the help of these ratios
EARNING ABILITY OF EXIM BANK OF INDIA
To survive in the competitive financial environments, banks have to generate
adequate earnings to meet out all the non operating expense and to maintain adequate spread
by avoiding burden. Earning ability of Exim Bank could be ascertained by computing the
various ratios like Net Interest Margin ratio, Operating Profit ratio, Return on Assets.
LIQUIDITY OF EXIM BANK OF INDIA
An adequate liquidity position refers to a situation, where institution can obtain
sufficient funds, either by increasing liabilities or by converting its assets quickly at a
reasonable cost. The liquidity of the Exim Bank is measured by Liquidity Ratio.
5.4.1 OVERALL CAMEL RATINGS OF EXIM BANK OF INDIA
The performance of Exim Bank’s overall assessment has been diagnosed by
evaluating the various parameters of the CAMEL rating mechanism.
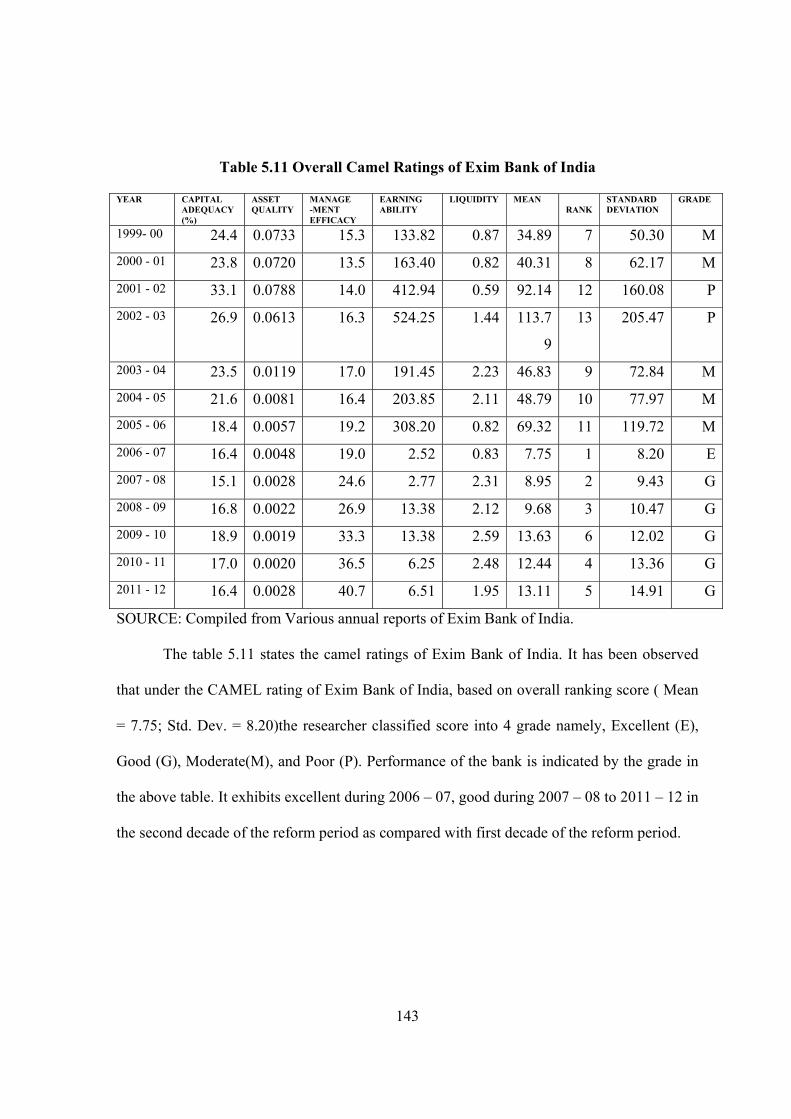
143
Table 5.11 Overall Camel Ratings of Exim Bank of India
YEAR CAPITAL
ADEQUACY (%)
ASSET QUALITY
MANAGE -MENT EFFICACY
EARNING ABILITY
LIQUIDITY MEAN RANK
STANDARD DEVIATION
GRADE
1999- 00 24.4 0.0733 15.3 133.82 0.87 34.89 7 50.30 M2000 - 01 23.8 0.0720 13.5 163.40 0.82 40.31 8 62.17 M2001 - 02 33.1 0.0788 14.0 412.94 0.59 92.14 12 160.08 P2002 - 03 26.9 0.0613 16.3 524.25 1.44 113.7
9
13 205.47 P
2003 - 04 23.5 0.0119 17.0 191.45 2.23 46.83 9 72.84 M2004 - 05 21.6 0.0081 16.4 203.85 2.11 48.79 10 77.97 M2005 - 06 18.4 0.0057 19.2 308.20 0.82 69.32 11 119.72 M2006 - 07 16.4 0.0048 19.0 2.52 0.83 7.75 1 8.20 E2007 - 08 15.1 0.0028 24.6 2.77 2.31 8.95 2 9.43 G2008 - 09 16.8 0.0022 26.9 13.38 2.12 9.68 3 10.47 G2009 - 10 18.9 0.0019 33.3 13.38 2.59 13.63 6 12.02 G2010 - 11 17.0 0.0020 36.5 6.25 2.48 12.44 4 13.36 G2011 - 12 16.4 0.0028 40.7 6.51 1.95 13.11 5 14.91 G
SOURCE: Compiled from Various annual reports of Exim Bank of India. The table 5.11 states the camel ratings of Exim Bank of India. It has been observed
that under the CAMEL rating of Exim Bank of India, based on overall ranking score ( Mean
= 7.75; Std. Dev. = 8.20)the researcher classified score into 4 grade namely, Excellent (E),
Good (G), Moderate(M), and Poor (P). Performance of the bank is indicated by the grade in
the above table. It exhibits excellent during 2006 – 07, good during 2007 – 08 to 2011 – 12 in
the second decade of the reform period as compared with first decade of the reform period.
144
5.5 ALTMAN’S MULTIPLE DISCRIMINATE ANALYSIS OF EXIM BANK The Multiple Discriminate Analysis (MDA) is a multivariate techniques used by
altman to predict corporate failure. Under this technique, a single discriminant score, called
Z, is calculated for each year by using five financial ratios variable as follows
Z = 0.012X1 + 0.014X2 + 0.33X3 + 0.006X4 + 0.999X5
Where,
X1 = Working Capital / Total Assets (a measure of liquidity)
X2 = Retained Earnings/Total Assets (a measure of reinvested earnings and past profitability)
X3 = EBIT / Total Assets (a measure of profitability)1
X4 = 1 (a measure of financial structure or leverage)
X5 = Loans and Advance /Total Assets ( a measure of asset efficiency)
1 Exim Bank of India is wholly owned institution of government of India there is no market price per share, hence it was assumed as 1 for financial structure or leverage in lieu of market price.
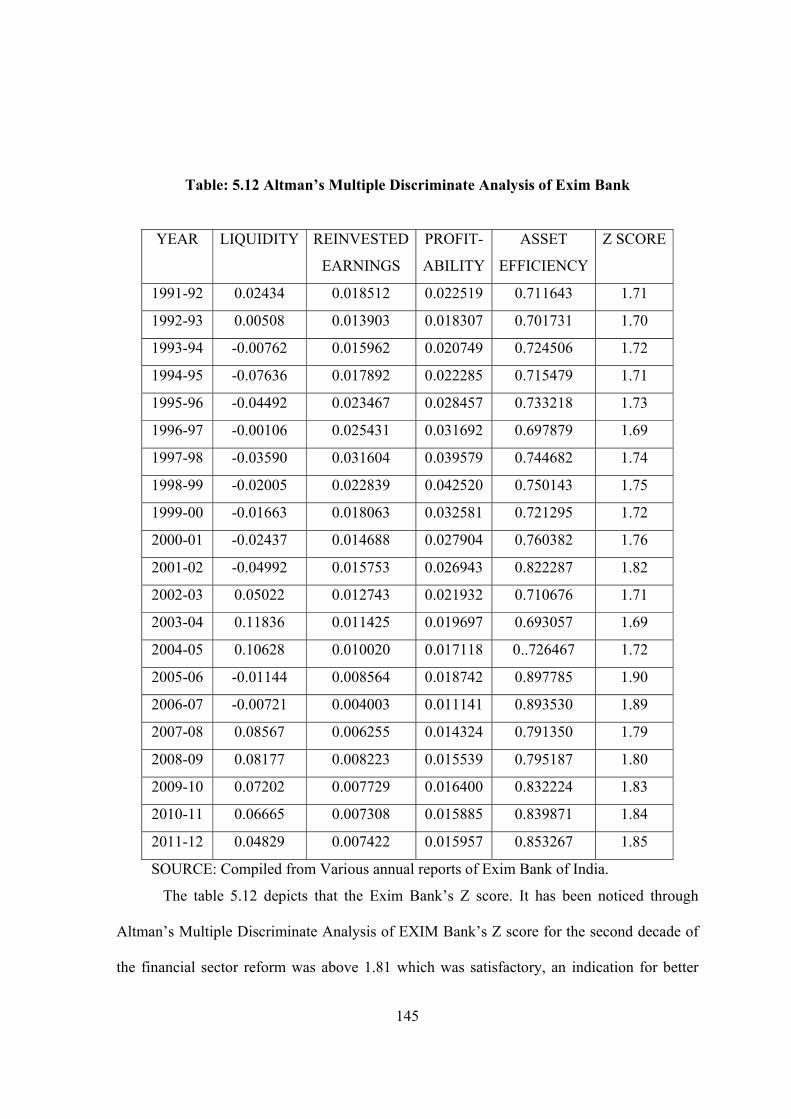
145
Table: 5.12 Altman’s Multiple Discriminate Analysis of Exim Bank
YEAR LIQUIDITY REINVESTED
EARNINGS
PROFIT-
ABILITY
ASSET
EFFICIENCY
Z SCORE
1991-92 0.02434 0.018512 0.022519 0.711643 1.71
1992-93 0.00508 0.013903 0.018307 0.701731 1.70
1993-94 -0.00762 0.015962 0.020749 0.724506 1.72
1994-95 -0.07636 0.017892 0.022285 0.715479 1.71
1995-96 -0.04492 0.023467 0.028457 0.733218 1.73
1996-97 -0.00106 0.025431 0.031692 0.697879 1.69
1997-98 -0.03590 0.031604 0.039579 0.744682 1.74
1998-99 -0.02005 0.022839 0.042520 0.750143 1.75
1999-00 -0.01663 0.018063 0.032581 0.721295 1.72
2000-01 -0.02437 0.014688 0.027904 0.760382 1.76
2001-02 -0.04992 0.015753 0.026943 0.822287 1.82
2002-03 0.05022 0.012743 0.021932 0.710676 1.71
2003-04 0.11836 0.011425 0.019697 0.693057 1.69
2004-05 0.10628 0.010020 0.017118 0..726467 1.72
2005-06 -0.01144 0.008564 0.018742 0.897785 1.90
2006-07 -0.00721 0.004003 0.011141 0.893530 1.89
2007-08 0.08567 0.006255 0.014324 0.791350 1.79
2008-09 0.08177 0.008223 0.015539 0.795187 1.80
2009-10 0.07202 0.007729 0.016400 0.832224 1.83
2010-11 0.06665 0.007308 0.015885 0.839871 1.84
2011-12 0.04829 0.007422 0.015957 0.853267 1.85
SOURCE: Compiled from Various annual reports of Exim Bank of India.
The table 5.12 depicts that the Exim Bank’s Z score. It has been noticed through
Altman’s Multiple Discriminate Analysis of EXIM Bank’s Z score for the second decade of
the financial sector reform was above 1.81 which was satisfactory, an indication for better
146
solvency position when compared with that of first decade of the financial sector reform were
below 1.81 was a sign of financial unsoundness of the EXIM Bank of India.
To conclude, financial statements are indicators of two significant factors such as
profitability and financial soundness. Analysis and interpretation of financial statement
therefore refers to such a treatment of information contained in the financial reports so as to
afford full diagnosis of the profitability and financial soundness of the financial institutions.
The financial efficacy of EXIM Bank of India has been measured in terms of liquidity,
profitability, solvency, activity, CAMEL metrics and Altman’s multiple discriminate
analysis.
It is clear from the analysis of financial ratios of the Export Import Bank of India, the
liquidity position during the period of study is good. The solvency position of EXIM exhibits
a declining trend during the entire period of the study. The CAMEL metrics reveals the
financial soundness of EXIM Bank is better during the study period.
CHAPTER VI
EXIM BANK AND ECONOMIC GROWTH
6.1 SCHEMEWISE ASSISTANCE AND GDP
6.2 SCHEMEWISE ASSISTANCE AND EXPORT
6.3 SCHEMEWISE ASSISTANCE AND IMPORT
6.4 SCHEMEWISE ASSISTANCE AND BALANCE OF PAYMENT
6.5 SCHEMEWISE ASSISTANCE AND BALANCE OF TRADE
6.6 SCHEMEWISE ASSISTANCE AND TOTAL CREDIT EXPOSURE

147
CHAPTER VI
EXIM BANK AND ECONOMIC GROWTH
International trade plays a major role in deciding the economic and financial strength
of a country. Countries can exploit their natural resources and gain competitive advantage
through trade. They can export anything they have in surplus and at the same time the import
what they lack. International trade enables a country to obtain the benefits of specialization.
It result in an increase in the rate of economic growth of both the countries involved in trade
as both can use the resources more productively.
In some countries a majority of people have enough money to meet their needs,
comforts and even luxuries, while in others major part of the population is unable to meet
even its basic needs such as food. Based on the average income levels of various economies,
the World Bank classifies countries into groups such as low income economies, lower
middle-income economies, upper middle – income economies, and high – income
economies.
Economic growth represents the expansion of a country’s potential GDP or national
output. It is measured in terms of increase in the Gross Domestic Product (GDP) or Gross
National Product (GNP) where as economic development represents the change in the real
living conditions of people in the country. Economic growth can be measured as an increase
in the economy’s output.
There is lot of misconception about the role of Development Finance Institutions
(DFIs) not only in India but also across the globe, especially in the post reform period. In
fact, there is a feeling among the public that in the post reform period, regulators and
policymakers are not encouraging the role of financial institutions as developmental agents
148
and have oriented their policies towards a market led economy by sacrificing the
developmental role, whereas, the fact is that policymakers and regulators in India continue to
have a firm belief that the role of finance is to encourage development and that the financial
institutions must promote this basic role. The objective of developmental finance, thus,
continues to remain the same and only the outer cover in the form of the institutional
structure needs to undergo a change from time to time1. Though there is little doubt that
DFIs, in general and Exim Bank, in particular, have made immense contribution in the
economic growth of the country, especially in the post-reform period , they have lost their
relevance due to certain structural changes that have taken place in the banking and financial
system in the country
An attempt has been made in this chapter to analyse the contribution of the EXIM
Bank of India towards the economic growth. In order to assess the economic growth the
macro economic variables like GDP, Export, Import, Balance of Payment, Balance of Trade,
Total Credit Exposure as given in table 6.1 are compared with the various schemes of
assistance such as Technology Up gradation Fund, Export Oriented Units, Project Exports,
Overseas Investment Finance, Working capital Finance, Production & Equipment finance,
Bulk Import Finance.

149
TABLE: 6.1 MACROECONOMIC VARIABLES
YEAR GDP EXPORT IMPORT BOP BOT TOTAL Cr. EXPOSURE
1991-92 613528 44041.8 47840.8 -2237 -3799 12418 1992-93 703723 53688.3 63374.5 -12764 -9686.3 13484 1993-94 817961 69748.9 73177.4 -3636 -3428.5 16307 1994-95 955386 82673.4 89970.7 -10583 -7297.3 20876 1995-96 1118586 106352 122678 -19645 -16326 18432 1996-97 1301788 118817 138920 -16281 -20103 21044 1997-98 1447613 130101 154176 -20883 -24076 25783 1998-99 1668739 139752 178332 -16789 -38580 28812 1999-00 1847273 159095 215529 -20331 -56433 29564 2000-01 1991982 201356 228307 -11598 -26950 27625 2001-02 2167745 209018 245200 16426 -36182 26110 2002-03 2338200 255137 297206 30660 -42069 23750 2003-04 2622216 293367 359108 63983 -65741 20553 2004-05 2971464 375340 501065 -12174 -125725 21976 2005-06 3390503 456418 660409 -43737 -203991 24175 2006-07 3953276 571779 838048 -44383 -266269 31237 2007-08 4582086 655864 1005159 -63479 -349296 41296 2008-09 5303567 840755 1374436 -127631 -533681 73772 2009-10 6108903 845534 1363736 -179700 -518202 76011 2010-11 7266967 1142922 1683467 -219700 -540545 83123 2011-12 8353495 1459281 2345973 -376000 -886692 97150
Source: www.rbi.org.in
Multiple linear regression model has been fitted in to assess the contributions of Exim
Bank toward the economic growth of India.
The Multiple regression analysis may be presented mathematically as
Y = a + b1 X1 +b2X2 + U
Where,
y = Gross Domestic Product (GDP)
a ,b1,b2= Constant
x1 = Financial assistance to Technology Up gradation Fund
x2 = Financial assistance to Export Oriented Units
and U = Error term

150
6.1 SCHEMEWISE ASSISTANCE AND GDP
GDP refer to economic activity is ultimately aimed at providing the desired and
necessary goods and services to the population. The GDP is the most comprehensive measure
of the value of economic activity in an economy. It is the measure of the market value of all
goods & services produced by factors – labour and property – located within the boundaries
of a country, during a specific period of time; in general, annually. There are two variants of
GDP – nominal and real. Nominal GDP, when adjusted for Price changes (i.e. inflation)
gives the real GDP. Estimates of GDP are considered as the best indicators of the economic
performance of a country, both in the short run and the long run. Hence, the macroeconomic
variable GDP has been used to assess the contributions of EXIM Bank towards the
economic growth of India.
Ho1: There is no significant contribution to India’s Gross Domestic Product By various
schemes of Assistance extended by the Exim Bank.
TABLE: 6.2.1 CORRELATION BETWEEN EXIM BANK’S SCHEMEWISE
ASSISTANCE AND GDP
GDP EOU PEF WC TUF OIF BIF FFI Proj.ExGDP 1.000 EOU .783** 1.000 PEF .561* .659** 1.000 WC .717** .690** 0.392 1.000 TUF .903** .780** .519* .686** 1.000 OIF .817** .759** .510* .636** .829** 1.000 BIF .847** .634** 0.329 .661** .882** .811** 1.000 FFI .745** .653** .525* .623** .687** .623** .543* 1.000 Proj.Ex .832** .643** 0.394 .685** .837** .705** .828** .783** 1.000
Source: Computed from data of various annual reports of exim Bank & www.rbi.org.in **. Correlation is significant at the 0.01 level (2-tailed). *. Correlation is significant at the 0.05 level (2-tailed).

151
The above table 6.2.1 reveals the correlation between GDP and the varios schemes of
assistance extended by the exim Bank of India. It can also be noted that technology
upgradation fund shows a high positive correlation of 0.903 significant at 1% level.
TABLE: 6.2.2 REGRESSION COEFFICIENT BETWEEN EXIM BANK’S SCHEME- WISE ASSISTANCE AND GDP
Explanatory Variable GDP
Constant 11.794 (26.35)*
Technology Upgradation Fund 0.233 (4.38)*
Export Oriented Units 0.255 (2.60)*
R2 0.868 F – Value 55.86*
Source: Computed from data of various annual reports of exim Bank &
www.rbi.org.in
t value is indicated within parenthesis * Significant at 1% Level.
The regression coefficient of exim bank under various schemes of assistance and its
impact on GDP has been shown in table 6.1.2. Rs. 1Crore increase in the Technology
upgradation Fund (TUF) has a positive impact on GDP at Rs. 0.23Crores. Rs. 1Crore
increase in financial assistance to Export Oriented Units (EOUs) has a positive impact on
GDP at Rs. 0.25 Crore. R2 explains 86.8 % of variations in the Gross Domestic Product
explained by the explanatory variables (i.e Schemes of Financial Assistance) like Technology
upgradation Fund (TUF), Export Oriented Units (EOUs).

152
6.2 SCHEMEWISE ASSISTANCE AND EXPORT
Exports of goods and services represent one of the most important sources of foreign
exchange income that ease the pressure on the balance of payments and create employment
opportunities. An export led growth strategy aims to provide producers with incentives to
export their goods through various economic and governmental policies. It also aims to
increase the capability of producing goods and services that are able to compete in the world
market, to use advanced technology, and to provide foreign exchange needed to import
capital goods. Exports can increase intra-industry trade, help the country to integrate in the
world economy and reduce the impact of external shocks on the domestic economy.
Experiences of Asian and Latin American economies provide good examples of the
importance of the export sector to economic growth and development, which led economists
to stress the vital role of exports as the engine of economic growth. Hence the researcher has
made an attempt to assess the efficacy of the Exim Bank through exports as a variable
contribute towards economic growth.
Ho2: There is no significant contribution to India’s Export under various schemes of
assistance extended by the Exim Bank.
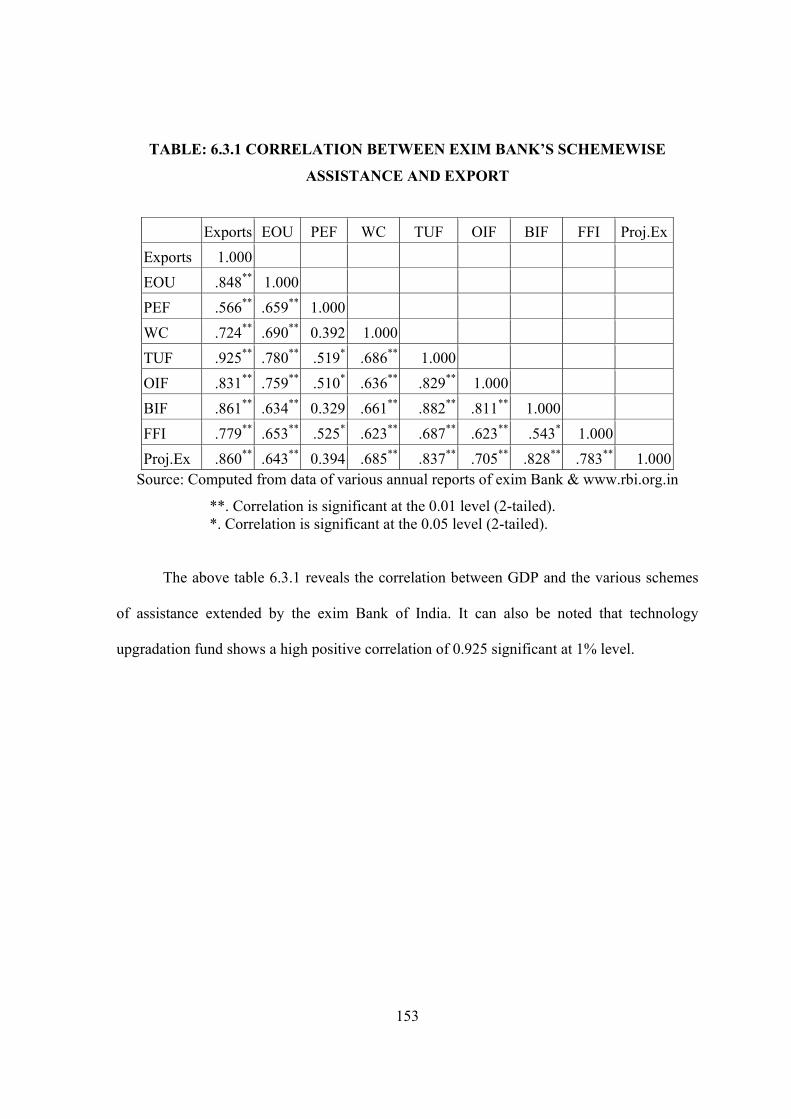
153
TABLE: 6.3.1 CORRELATION BETWEEN EXIM BANK’S SCHEMEWISE
ASSISTANCE AND EXPORT
Source: Computed from data of various annual reports of exim Bank & www.rbi.org.in
**. Correlation is significant at the 0.01 level (2-tailed). *. Correlation is significant at the 0.05 level (2-tailed). The above table 6.3.1 reveals the correlation between GDP and the various schemes
of assistance extended by the exim Bank of India. It can also be noted that technology
upgradation fund shows a high positive correlation of 0.925 significant at 1% level.
Exports EOU PEF WC TUF OIF BIF FFI Proj.ExExports 1.000 EOU .848** 1.000 PEF .566** .659** 1.000 WC .724** .690** 0.392 1.000 TUF .925** .780** .519* .686** 1.000 OIF .831** .759** .510* .636** .829** 1.000 BIF .861** .634** 0.329 .661** .882** .811** 1.000 FFI .779** .653** .525* .623** .687** .623** .543* 1.000 Proj.Ex .860** .643** 0.394 .685** .837** .705** .828** .783** 1.000
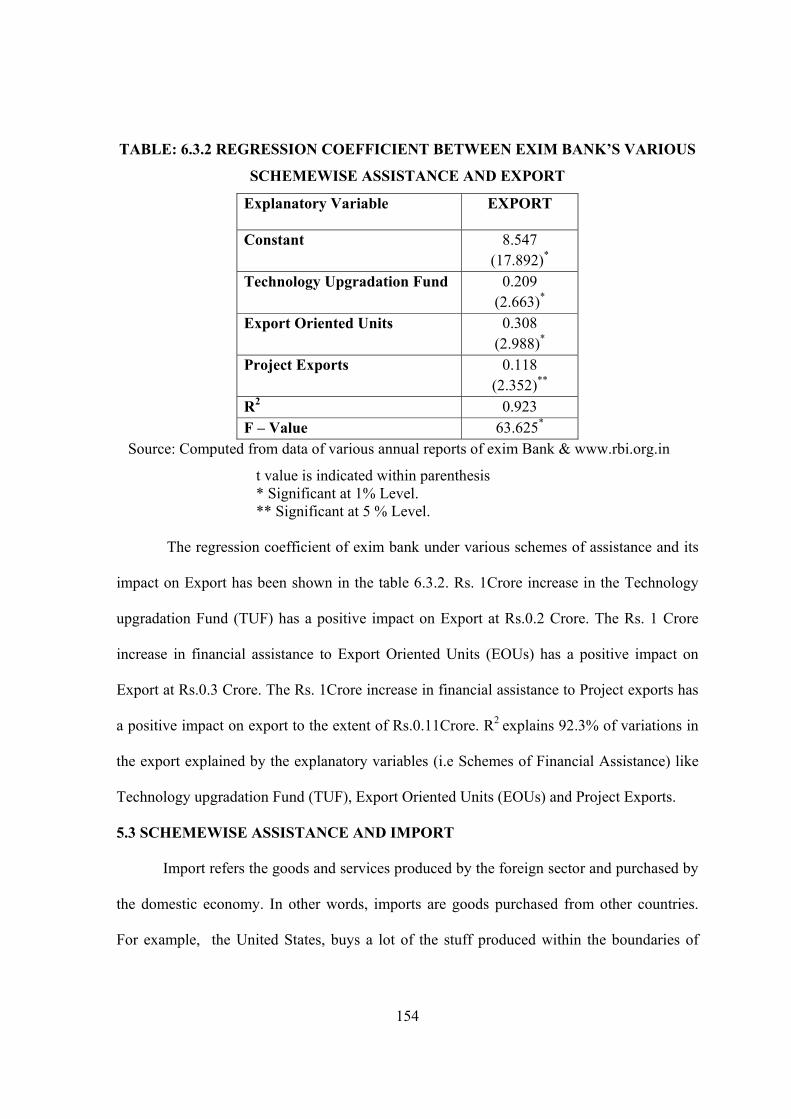
154
TABLE: 6.3.2 REGRESSION COEFFICIENT BETWEEN EXIM BANK’S VARIOUS
SCHEMEWISE ASSISTANCE AND EXPORT
Explanatory Variable EXPORT
Constant 8.547 (17.892)*
Technology Upgradation Fund 0.209 (2.663)*
Export Oriented Units 0.308 (2.988)*
Project Exports 0.118 (2.352)**
R2 0.923 F – Value 63.625*
Source: Computed from data of various annual reports of exim Bank & www.rbi.org.in
t value is indicated within parenthesis * Significant at 1% Level. ** Significant at 5 % Level. The regression coefficient of exim bank under various schemes of assistance and its
impact on Export has been shown in the table 6.3.2. Rs. 1Crore increase in the Technology
upgradation Fund (TUF) has a positive impact on Export at Rs.0.2 Crore. The Rs. 1 Crore
increase in financial assistance to Export Oriented Units (EOUs) has a positive impact on
Export at Rs.0.3 Crore. The Rs. 1Crore increase in financial assistance to Project exports has
a positive impact on export to the extent of Rs.0.11Crore. R2 explains 92.3% of variations in
the export explained by the explanatory variables (i.e Schemes of Financial Assistance) like
Technology upgradation Fund (TUF), Export Oriented Units (EOUs) and Project Exports.
5.3 SCHEMEWISE ASSISTANCE AND IMPORT
Import refers the goods and services produced by the foreign sector and purchased by
the domestic economy. In other words, imports are goods purchased from other countries.
For example, the United States, buys a lot of the stuff produced within the boundaries of

155
other countries, including bananas, coffee, cars, chocolate, computers, and, well, a lot of
other products. Imports, together with exports, are the essence of foreign trade--goods and
services that are traded among the citizens of different nations.
Ho3: There is no significant contribution to India’s Import Under various schemes of
assistance extended by the Exim bank.
TABLE: 6.4.1 CORRELATION BETWEEN EXIM BANK’S SCHEMEWISE
ASSISTANCE AND IMPORT
Source: Computed from data of various annual reports of exim Bank & www.rbi.org.in
**. Correlation is significant at the 0.01 level (2-tailed). *. Correlation is significant at the 0.05 level (2-tailed).
The above table 6.4.1 reveals the correlation between GDP and the various schemes
of assistance extended by the exim Bank of India. It can also be noted that technology
upgradation fund shows a high positive correlation of 0.925 significant at 1% level.
Imports EOU PEF WC TUF OIF BIF FFI Proj.ExImports 1.000 EOU .845** 1.000 PEF .550* .659** 1.000 WC .726** .690** 0.392 1.000 TUF .925** .780** .519* .686** 1.000 OIF .848** .759** .510* .636** .829** 1.000 BIF .873** .634** 0.329 .661** .882** .811** 1.000 FFI .766** .653** .525* .623** .687** .623** .543* 1.000 Proj.Ex .860** .643** 0.394 .685** .837** .705** .828** .783** 1.000

156
TABLE: 6.4.2
REGRESSION COEFFICIENT BETWEEN EXIM BANK’S SCHEME – WISE
ASSISTANCE AND IMPORT
Explanatory Variable IMPORT
Constant 8.340 (15.238)*
Technology Upgradation Fund 0.243 (2.705)*
Export Oriented Units 0.338 (2.856)*
R2 0.921 F – Value 61.834*
Source: Computed from data of various annual reports of exim Bank & www.rbi.org.in
t value is indicated within parenthesis * Significant at 1% Level.
The regression coefficient of exim bank under various schemes of assistance and its
impact on import table has been stated 6.4.2. Rs. 1Crore increase in the technology
upgradation fund (TUF) has a positive impact on Import at Rs. 0.24 Crore. The Rs. 1Crore
increase in financial assistance to Export Oriented Units (EOUs) has a positive impact on
import at Rs. 0.33 Crore. R2 explains 92.1 % of variations in the import explained by the
explanatory variables (i.e Schemes of Financial Assistance) like Technology up gradation
Fund (TUF), Export Oriented Units (EOUs).
6.4 SCHEME – WISE ASSISTANCE AND BALANCE OF PAYMENTS
The Balance of payment is a record of the value of all transactions between residents
of a country with outsiders. Balance of payment is the systematic summary of the economic
transactions of the residents of a country with the rest of the world during a specific period of
time period, normally a year. Balance of payment is of great significance as it reflects the
economic policies of the country and the exchange rate of its currency. Therefore, an attempt

157
has been made to analyse the operating efficacy of the Exim Bank to the economic variable
Balance of Payment.
Ho4: There is no significant contribution to India’s Balance of Payment under various
schemes of assistance extended by the Exim Bank.
TABLE: 6.5.1 CORRELATION BETWEEN EXIM BANK’S SCHEMEWISE
ASSISTANCE AND BALANCE OF PAYMENT
Source: Computed from data of various annual reports of exim Bank & www.rbi.org.in **. Correlation is significant at the 0.01 level (2-tailed). *. Correlation is significant at the 0.05 level (2-tailed).
The above table 6.5.1 reveals the correlation between GDP and the various schemes
of assistance extended by the exim Bank of India. It can also be noted that overseas
Investment finance shows a high positive correlation of 0.793 significant at 1% level.
BOP EOU PEF WC TUF OIF BIF FFI Proj.ExBOP 1.000 EOU .690** 1.000 PEF .484* .659** 1.000 WC 0.415 .690** 0.392 1.000 TUF .793** .780** .519* .686** 1.000 OIF .767** .759** .510* .636** .829** 1.000 BIF .715** .634** 0.329 .661** .882** .811** 1.000 FFI .688** .653** .525* .623** .687** .623** .543* 1.000 Proj.Ex .729** .643** 0.394 .685** .837** .705** .828** .783** 1.000

158
TABLE: 6.5.2 REGRESSION COEFFICIENT EXIM BANK’S SCHEME – WISE
ASSISTANCE AND BALANCE OF PAYMENTS
Explanatory Variable BALANCE OF PAYMENT
Constant 7.761 (15.515)*
Technology Upgradation Fund 0.485 (5.529)*
R2 0.629 F – Value 30.569*
Source: Computed from data of various annual reports of exim Bank &
www.rbi.org.in
t value is indicated within parenthesis * Significant at 1% Level.
The regression coefficient of exim bank under various schemes of assistance and its
impact on Balance of Payments has been shown in the table 6.5.2. Rs. 1Crore increase in the
technology upgradation fund (TUF) has a positive impact on Balance of Payments at Rs.
0.48Crore. R2 explains 62.9 % of variations in the Balance of Payments explained by the
explanatory variables (i.e Schemes of Financial Assistance) like Technology up gradation
Fund (TUF).
6.5 SCHEME – WISE ASSISTANCE AND BALANCE OF TRADE
The difference between the value of goods and services exported out of a country and
the value of goods and services imported into the country. The balance of trade is the official
term for net exports that makes up the balance of payments. The balance of trade can be a
"favorable" surplus (exports exceed imports) or an "unfavorable" deficit (imports exceed
exports). The official balance of trade is separated into the balance of merchandise trade for
tangible goods and the balance of services. A balance of trade surplus is most favorable to

159
domestic producers responsible for the exports. However, this is also likely to be unfavorable
to domestic consumers of the exports who pay higher prices. Alternatively, a balance of trade
deficit is most unfavorable to domestic producers in competition with the imports, but it can
also be favorable to domestic consumers of the exports who pay lower prices. Hence, to
check there is a significant contribution to India’s Balance of Trade by various schemes of
financial assistance extended by the Exim bank.
Ho5: There is no significant contribution to India’s Balance of Trade under various schemes
of assistance extended by the Exim Bank.
TABLE: 6.6.1 CORRELATION BETWEEN EXIM BANK’S SCHEMEWISE
ASSISTANCE AND BALANCE OF TRADE
Source: Computed from data of various annual reports of exim Bank & www.rbi.org.in
**. Correlation is significant at the 0.01 level (2-tailed). *. Correlation is significant at the 0.05 level (2-tailed).
The above table 6.6.1 reveals the correlation between GDP and the various schemes
of assistance extended by the exim Bank of India. It can also be noted that technology
upgradation fund shows a high positive correlation of 0.793 significant at 1% level.
BOT EOU PEF WC TUF OIF BIF FFI Proj.ExBOT 1.000 EOU .843** 1.000 PEF .545* .659** 1.000 WC .735** .690** 0.392 1.000 TUF .884** .780** .519* .686** 1.000 OIF .882** .759** .510* .636** .829** 1.000 BIF .854** .634** 0.329 .661** .882** .811** 1.000 FFI .735** .653** .525* .623** .687** .623** .543* 1.000 Proj.Ex .825** .643** 0.394 .685** .837** .705** .828** .783** 1.000

160
TABLE: 6.6.2 REGRESSION COEFFICIENT EXIM BANK’S SCHEME – WISE
ASSISTANCE AND BALANCE OF TRADE
Explanatory Variable BALANCE OF TRADE
Constant 7.167 (16.145)*
Technology Upgradation Fund 0.408 (2.929)*
OIF 0.331 (2.870)*
R2 0.852 F – Value 49.071*
Source: Computed from of data various annual reports of exim Bank & www.rbi.org.in
t value is indicated within parenthesis * Significant at 1% Level.
The regression coefficient of exim bank under various schemes of assistance and its
impact on Balance of Trade has been exhibited in table 6.6.2. Rs. 1Crore increase in the
technology upgradation fund (TUF) has a positive impact on Balance of Trade at Rs.0.4
Crore. The Rs. 1Crore increase in financial assistance to Export Oriented Units (EOUs) has a
positive impact on Balance of Trade at Rs. 0.33 Crore. R2 explains 85.2% of variations in the
Balance of Trade explained by the explanatory variables (i.e Schemes of Financial
Assistance) like Technology up gradation Fund (TUF), Export Oriented Units (EOUs).
5.6 SCHEME – WISE ASSISTANCE AND TOTAL CREDIT EXPOSURE
The total amount of credit extended to a borrower by a lender. The magnitude of
credit exposure indicates the extent to which the lender is exposed to the risk of loss in the
event of the borrower's default. Credit exposure can be minimized through purchasing credit
default swaps or other types of financial instruments. Banks are required to fix limits on their
exposure as a prudential measure aimed at better risk management and avoidance of

161
concentration of credit risks as also to observe certain statutory and regulatory exposure
limits in respect advances against some securities.
Ho6: There is no significant contribution to India’s total credit exposure under various
schemes of assistance extended by the Exim Bank.
TABLE: 6.7.1 CORRELATION BETWEEN EXIM BANK’S SCHEMEWISE
ASSISTANCE AND TOTAL CREDIT EXPOSURE
Source: Computed from dataof various annual reports of exim Bank & www.rbi.org.in
**. Correlation is significant at the 0.01 level (2-tailed). *. Correlation is significant at the 0.05 level (2-tailed).
The above table 6.7.1 reveals the correlation between GDP and the various schemes
of assistance extended by the exim Bank of India. It can also be noted that technology
upgradation fund shows a high positive correlation of 0.789 significant at 1% level.
CR.EXP EOU PEF WC TUF OIF BIF FFI Proj.Ex CR.EXP 1.000 EOU .708** 1.000 PEF 0.426 .659** 1.000 WC .453* .690** 0.392 1.000 TUF .789** .780** .519* .686** 1.000 OIF .743** .759** .510* .636** .829** 1.000 BIF .771** .634** 0.329 .661** .882** .811** 1.000 FFI .513* .653** .525* .623** .687** .623** .543* 1.000 Proj.Ex .620** .643** 0.394 .685** .837** .705** .828** .783** 1.000

162
TABLE: 6.7.2 REGRESSION COEFFICIENT EXIM BANK’S SCHEME – WISE
ASSISTANCE AND TOTAL CREDIT EXPOSURE
Explanatory Variable CREDIT
EXPOSURE
Constant 9.076 (37.509)*
Technology Upgradation Fund .231 (5.444)*
R2 0.622 F – Value 29.638*
Source: Computed from data various annual reports of exim Bank & www.rbi.org.in
t value is indicated within parenthesis * Significant at 1% Level.
The regression coefficient of exim bank under various schemes of assistance and its
impact on total credit exposure has been states in table 6.7.2. Rs. 1 Crore increase in the
technology upgradation fund (TUF) has a positive impact on total credit exposure at Rs.0.23
Crore. R2 explains 62.2% of variations in the total credit exposure explained by the
explanatory variables (i.e. Schemes of Assistance) like Technology up gradation Fund
(TUF).
Thus, this chapter describes the multiple regression coefficients between the various
schemes of assistance and the select macroeconomic variables intents the subsistence of
Exim bank toward the economic growth. It vividly shows that, the operational efficacy of
EXIM Bank has its relevance on macro economic variables. Hence the null hypotheses have
been rejected. It also reveals that there is a significant contribution by Exim bank towards the
economic growth under the various schemes of assistance during the period of the study.
CHAPTER VII
SUMMARY OF FINDINGS,
SUGGESTION AND
CONCLUSIONS
163
CHAPTER VII
SUMMARY OF FINDINGS, SUGGESTION AND CONCLUSIONS
EXIM Bank is operating varied lending and service programs. These
programs are tailored to meet the needs of different customer groups, viz. Programs for the
Indian Exporter, Programs for the Commercial Bank and Programs for the overseas entities.
A brief account of the efficacy of EXIM Bank made in important programs are as under.
1. The Approvals, Disbursement, Loan assets and repayment of Exim Bank of India. It
has been noticed that there is an increasing trend in approval, disbursement, loan
assets and repayments. The linear and compound growth of approval, disbursement,
loan assets and Repayment from 1992-93 to 2011-12.The linear growth rate is
21.73% for approvals, 21.31%for disbursement, 18.14% for loan assets and 1.20% for
repayment. Subsequently the compounded annual growth rate over the same period of
time is 24.31% for approvals, 23.76%for disbursement, 19.89% for loan assets and
1.21% for repayments.
2. The paired t-test for financial assistance to Lines of Credit (LOC) by EXIM Bank of
India depicts the t value -9.236 is significant at 1% level, therefore the null hypothesis
is rejected. So, a significant difference persists among the second and first decade of
the reform periods for the financial assistance extended by the EXIM Bank to Lines
of Credit (LOC).
3. The paired t-test for financial assistance to Export Oriented Unit (EOUs) by EXIM
Bank of India shows the t value -5.391 is significant at 1% level, hence the null
hypothesis is rejected. Therefore, a significant difference exists among the second and

164
first decade of the reform period for the financial assistance extended by the EXIM
Bank to Export Oriented Units (EOUs).
4. The paired t-test for financial assistance to Production Equipment Financeby EXIM
Bank of India depicts the t value -2.421 is significant at 5% level; hence the null
hypothesis is rejected. Therefore, a significant difference persists among the second
and first decade of the reform period for the financial assistance extended by the
EXIM Bank to Production Equipment Finance (PEF).
5. The paired t-test for financial assistance to Working capital terms loan by EXIM
Bank of India shows the t value -3.354 is significant at 1% level, hence the null
hypothesis is rejected. Therefore, a significant difference exists among the second and
first decade of the reform period for the financial assistance extended by the EXIM
Bank to Working capital terms loan.
6. The paired t-test for financial assistance to Technology Up-gradation Fund by EXIM
Bank of India shows t value -8.269 is significant at 1% level; hence the null
hypothesis is rejected. Therefore, a significant difference has been there among the
second and the first decade of the reform period for the financial assistance extended
by the EXIM Bank to Technology up-gradation Fund.
7. The paired t-test for financial assistance to Overseas Investment Finance by EXIM
Bank of India exhibits the t value -5.992 is significant at 1% level; hence the null
hypothesis is rejected. Therefore, a significant difference exists among the second and
the first decade of the reform period for the financial assistance extended by the
EXIM Bank to Overseas Investment Finance.
165
8. The t value -4.770 is significant at 1% level, hence the null hypothesis is rejected.
Therefore, a significant difference persists among the second and the first decade of
the reform period for the financial assistance extended by the EXIM Bank to Bulk
Import Finance.
9. The t value -6.018 is significant at 1% level; hence the null hypothesis is rejected.
Therefore, a significant difference persists among the second and the first decade of
the reform period for the financial assistance extended by the EXIM Bank to Import
Finance
10. Project exports offered by EXIM Bank plays a significant role in securing export
contracts for 1146 project export contracts which were under execution in 84
countries by 226 Indian companies involving a value of Rs. 31915Crs during 2011-
2012 as against 84 project export contract which were executed in 7 countries
involving a value of Rs. 1090 Crores. The t value -8.435 is significant at 1% level;
hence the null hypothesis is rejected. Therefore, a significant difference persists
among the second and the first decade of the reform period for the financial assistance
extended by the EXIM Bank to Project Export Finance.
11. The result of one way ANOVA for the various schemes of financial assistance of
Exim Bank of India depicts the F value is 8.217and the corresponding p-value is
given as <0.000. Therefore the null hypothesis is rejected and concludes that the
average schemes provided by the EXIM Bank of India are not the same in all the
years of the First Decade.
12. The result of one way ANOVA for the various schemes of financial assistance of
Exim Bank of India exhibits, the F value is 7.537 and the corresponding p-value is

166
given as <0.000. Hence the null hypothesis is rejected. The average financial
assistance between and within years to various schemes provided by the EXIM Bank
of India is not the same for all the years of the second decade.
13. The result of one way ANOVA for the various schemes of financial assistance of
Exim Bank of India shows the F value is 5.112 and the corresponding p-value is
given as <0.000. Hence the null hypothesis is rejected. The average financial
assistance between the various Schemes provided by the EXIM Bank of India is not
the same for all the schemes of the first decade.
14. The result of one way ANOVA for the various schemes of financial assistance of
Exim Bank of India depicts the F value is 2.848 and the corresponding p-value is
given as <0.000. Hence the null hypothesis is rejected. The average financial
assistance under various schemes provided by the EXIM Bank of India is not the
same in all the schemes of the second decade.
15. The result of one way ANOVA for the various schemes of financial assistance of
Exim Bank of India. Exhibits the F value is 5.112 and the corresponding p-value is
given as <0.000. Hence the null hypothesis is rejected. The average financial
assistance over the period under various Schemes provided by the EXIM Bank of
India is not the same in all the years over the period of the study.
16. The result of one way ANOVA for the various schemes of financial assistance of
Exim Bank of India shows the F value is 9.404 and the corresponding p-value is
given as <0.000. Hence the null hypothesis is rejected. The average financial
assistance over the period under various schemes provided by the EXIM Bank of
India is not the same in all the schemes over the period of the study.

167
The assistance provided towards the various schemes of assistance was in an
increasing trend during both the decade of the reform period. Among the schemes Project
Export Finance has been identified as a major contributor towards the business of the Export
Import Bank. In case of the overall financial assistance under the various schemes extended
by the Export Import Bank of India is in an increasing trend. The Gap between the sanction
and disbursement of financial assistance by the Exim Bank is also gradually declining during
the period of study. To conclude, the analysis of the operating efficacy of Export Import
Bank of India exhibits a better lending performance during study period.
Financial Efficacy
Financial efficacy analysis is the process of identifying the financial strengths and
weaknesses of the EXIM Bank by properly establishing the relationship between the items of
balance sheet and profit and loss account. It also helps in short term and long term
forecasting and growth can be identified with the help of financial performance analysis. The
analysis of financial statement is a process of evaluating the relationship between the
component parts of financial statement to obtain a better understanding of the EXIM Bank’s
financial position and performance.
1. The Current ratio of the EXIM Bank of India depicts the financial soundness of
EXIM Bank was high during the second decade of the reform period. In 2009-10
was 2.59 as compared with that of the first decade of the reform period which was
very low in 1994 -95 was 0.52.
2. The Debt Equity Ratio of Exim Bank of India reveals during the second decade of
the reform period which is very high in 2007-08 as 9.79, when compared to the
first decade of the financial sector reform period, the debt equity ratio was low in

168
1997-98 as 2.45, which establishes the financial instability in the long run because
of its huge borrowing in both the decade of the reform Exim Bank.
3. The Fixed Assets Ratio of Exim Bank of India indicates during the first and the
second decade of the reform period. It is less than one, and explains the Exim
Bank has not raised long term funds to meet its fixed asset requirements.
4. The Proprietary Ratio of Exim Bank of India elicits very high proprietary ratio
which states the greater soundness of the Exim Bank of India during the first and
the second decade of the reform period.
5. The Capital to Total Assets of Exim bank of India explains low ratio of 2.94%
during the year 2007-08 in the second decade of reform when compared to the
first decade as it records a high ratio of 12.47% in 1995-96.
6. The ratio between the profit before tax and capital of Exim bank of India,
recorded that a higher profitability of 49.27% during the year 2008-09 in the
second decade of financial sector reform when compared with the first decade of
the reform it has been recorded a lower profitability of 14.86% during the year
1992-93.
7. The profits before tax to net worth of Exim bank of India stated higher
profitability of 17.66% during the year 2008-09 in the second decade of financial
sector reform when compared with the first decade of the reform, it has been
recorded a lower profitability of 9.13% during the year 1992-93.
8. The ratio between the profits before tax to Capital Employed of Exim Bank of
India, recorded a lower return of 1.19% during the year 2006-07 in the second

169
decade of financial sector reform when compared with the first decade of the
reform it has been recorded a higher return of 5.07% during the year 1998-99.
9. The Interest Spread of the Exim Bank of India, states there is an increasing trend
in the both the decades of the financial sector reform period. During the second
decade of the reform period the exim bank records a highest spread is ` 12691.2
crores in the year 2011-12 as compared with the first decade of the reform period
lowest spread is ` 596.5 in 1992-93.
10. The Activity Ratio of Exim Bank of India depicts the various activities such as
Compensation per Employee, Business per Employee, Profit Before Tax per
Employee, Profit After Tax per Employee. It states during the second decade of
the reform period Compensation per Employee is highest during 2010-11 is
Rs.1089.75 Business per Employee is highest during 2011-12 is Rs.2130064.43,
Profit Before Tax is highest in 2011-12, is Rs. 40194.86, Profit After Tax is
highest in 2011-12, is Rs.26798.81 when compared with the first decade of the
reform period Compensation per Employee is lowest during 1991-92is Rs.
149.24, Business per Employee is lowest during 1991-92 is Rs.122618.94, Profit
Before Tax is the highest in 1991-92, is Rs.4257.58, Profit After Tax is highest in
1991-92, is Rs. 4257.58.
11. It has been observed that under the CAMEL rating of Exim Bank of India, based
on overall ranking score ( Mean = 7.75; Std. Dev. = 8.20)the researcher classified
score into 4 grade namely, Excellent (E), Good (G), Moderate(M), and Poor (P).
Performance of the bank is indicated by the grade in the above table. It exhibits

170
excellent during 2006-07, good during 2007-08 to 2011-12 in the second decade
of the reform period as compared with first decade of the reform period.
12. It was noticed through Altman’s Multiple Discriminate Analysis of EXIM Bank’s
Z score for the second decade of the financial sector reform was above 1.81 which
was satisfactory, an indication for better solvency position when compared with
that of first decade of the financial sector reform were below 1.81 was a sign of
financial unsoundness of the EXIM Bank of India.
Exim Bank and Economic Growth
1. The analysis of regression co-efficient of Exim Bank’s under various schemes
of assistance and GDP exhibits Rs1Crore increase in the Technology Up-
gradation Fund (TUF) has a positive impact on GDP at Rs. 0.23Crore. Rs. 1
Crore increase in financial assistance to Export Oriented Units (EOUs) has a
positive impact on GDP at Rs. 0.25Crore.
2. The analysis of regression co-efficient of Exim Bank’s under various schemes
of assistance and Export shows the Rs.1Crore increase in the Technology Up
gradation Fund (TUF) has a positive impact on Export at Rs. 0.209 Crore. The
Rs.1Crore increase in financial assistance to Export Oriented Units (EOUs)
has a positive impact on Export at Rs. 0.308Crore. The Rs.1Crore increase in
financial assistance to Project exports has a positive impact on export to the
extent of Rs 0.118Crore.
3. The analysis of regression co-efficient of Exim Bank’s under various schemes
of assistance and import exhibits the Rs.1Crore increase in the Technology
Up-gradation Fund (TUF) has a positive impact on Import at Rs. 0.243 Crore.
171
The Rs.1Crore increase in financial assistance to Export Oriented Units
(EOUs) has a positive impact on import at Rs. 0.338Crore.
4. The analysis of regression co-efficient of Exim Bank under various schemes
of assistance and Balance of Payments exhibits the Rs.1Crore increase in the
technology Up gradation fund (TUF) has a positive impact on Balance of
Payments at Rs. 0.485Crore.
5. The analysis of regression co-efficient of Exim Bank’s under various schemes
of assistance and Balance of Trade elicit, the Rs.1Crore increase in the
technology Up-gradation fund (TUF) has a positive impact on Balance of
Trade at 0.408 Crore. The Rs.1Crore increase in financial assistance to
overseas investment finance (OIF) has a positive impact on Balance of Trade
at Rs.0.331Crore.
6. The analysis of regression co-efficient of exim banks under various schemes
of assistance and total credit exposure exhibits, the Rs.1Crore increase in the
technology Up-gradation fund (TUF) has a positive impact on total credit
exposure at Rs.0.231Crore.
The impact of Exim Bank’s contribution towards the economic growth under the
scheme-wise assistance extended during the period of the study, a multiple regression model
has been fitted. The result of the multiple regression coefficient proved the existence of the
Exim Bank has been contributed towards the economic growth under various scheme – wise
assistance during the study period. Hence, the operational efficacy of EXIM Bank has its
relevance on macro economic variables, which explains the Exim Bank has significant

172
contribution towards the economic growth of India through its assistance under various
schemes.
Suggestions
1. The EXIM Bank has to be made as an institution to provide assistance for medium
scale and small scale industries.
2. The EXIM Bank has to participate directly with all exporters rather than refinancing
through commercial banks.
3. The EXIM Bank should plan to have annual target for each of the schemes so as to
improve its competitiveness in increasing India’s exports considerably.
4. The Exim Bank should organise exporter’s meet once in year to know their
requirements of the exporters to enhance global competitiveness.
5. Exim Bank can set up escort cell to address the grievances of the exporters.
6. Being a developmental bank Exim Bank can take initiatives to create awareness at
grass root level.
7. The Exim Bank should put in place Export Marketing Services (EMS) Programme, to
assist in the creation and enhancement of export capabilities of Indian companies.
8. The Exim Bank can also assist in identification of opportunities for setting up plants
or projects or for acquisition of companies overseas under Export Marketing Services
(EMS) Programme.
9. Exim Bank can supplements its financing programmes with a wide range of
valuadded information, advisory and support services, which enable exporters to
evaluate international risks, to exploit global opportunities for export and to improve
export competitiveness

173
CONCLUSION
The past three decades of existence, provide a strong foundation to EXIM Bank from
where it will continue to catalyse India’s international trade and investment. The Bank is
committed to go beyond traditional financing and facilitate exports of a variety of products
and services which have the potential to go overseas, by creating a niche for them in the
international market. From this study it is inferred that EXIM Bank consistently performing
well since the decade of reform period i.e. 2001-02 onwards. The liquidity & profitability
position of the bank are also consistently good. The select macroeconomic variables are
significantly associated with Exim Bank’s assistance under the various schemes in
contributing towards India’s foreign trade which in turn enhances the economic growth of
India.
SCOPE FOR FURTHER RESEARCH
1. A study can be conducted to ascertain the quality of services offered by the EXIM
Bank of India through a structured interview schedule.
2. A comparative study on the EXIM Banks in Asian Continent.
3. A study can be made in relation to the EXIM Bank’s contribution towards India’s
foreign trade.
4. A comparison on trade finance between commercial banks and EXIM Bank of India.

BIBILOGRAPHY
174
BIBILOGRAPHY
ADB (1990), Export Finance, Some Asia Example, Asian Development Bank, Manila, 1990.
Edward, B. (1989), The Range of Risks: Handbook of International Credit Management, in
Clarke, W.B. (ed.), Gower Publishing Company Limited, England, 1989.
Harris S. (1989), Counter trade, Handbook of International Credit Management, in Clarke,
W.B. (ed.) Gower Publishing Company Limited, England 1989.
Keshari, P. K. (1992), Comparative Export Behaviour of the Foreign Controlled and
Domestic Firms in the Indian Engineering Industry, NIBM Working Paper, April.
Keshari P. K. and Saggar, M. K. (1991), “A Firm-Level Study of Export Performance in
the Machinery and Transport Equipment Industry of India”, Indian Economic Journal , Vol.
36 No.3, 1989.
Panchamukhi, V. R. et al. (1991), Export Financing in India, Interest Publications, New
Delhi 1991.
Sarkar P. (1992), “Rupee Depreciation and India's External Trade and Payments Since
1971”, Economic and Political Weekly, Vol.27, Nos. 24 & 25, June 13-20.
Rao N. (1990), International Trade and Balance of Payments, in Adisheshiah M.(ed) Eighth
Plan Perspectives, Lancer International, New Delhi.
Rhee Y.W. (1989), Trade Financing in Developing Countries, The World Bank,
Washington D.C.
Rhee Y.W. Data Appendix to Trade Financing for Developing Economics World Bank,
Washington D.C. 1989.
“Country Rating Firm Puts U.S. on Watch List”, Financial Executive; Oct2001, Vol. 17 Issue
7, p11

175
“Export Credit Guarantee Offer”, Africa Research Bulletin, Economic, Financial &
Technical Series; March 16, 2008, Vol. 45 Issue 3, p17767
Aitken, Hugh T., “Accounting Related to Export Credits Insurance and Finance”,
International Journal of Accounting; Fall 1969, Vol. 5, Issue 1, pp. 71-78
Barrett, Gene R., “Where Small and Midsized Companies Can Find Export Help?”, Journal
of Accountancy; Sep90, Vol. 170 Issue 3, pp. 46-50
Dietrich, Ethel B., “British Export Credit Insurance “, American Economic Review; June
1935, Vol. 25, Issue 2, p236-249
García-Alonso, María Del Carmen, Levine, Paul, and Morga, Antonia, “Export Credit
Guarantees, Moral Hazard and Exports Quality”, Bulletin of Economic Research; Oct 2004,
Vol. 56 Issue 4, pp. 311-327
Mah, Jai S., Milner, Chris, “The Japanese Export Insurance Arrangements: Promotion or
Subsidisation?”.World Economy, February 2005, Vol. 28, Issue 2, pp. 231-241
Moser, Christoph, Nestmann, Thorsten, and Wedow, Michael, “Political Risk and Export
Promotion: Evidence from Germany”, World Economy, June 2008, Vol. 31, Issue 6, pp. 781-
803
Ruff, Andrew, “A sophisticated approach”, International Financial Law Review;
Jul/Aug2010, Vol. 29 Issue 6, pp. 28-29
Scafuro, Francis X., “American Export Trade Guarantees Vs. Credit Risks”, International
Executive; Winter 1960, Vol. 2 Issue 1, pp. 21-22
Schich, Sebastian T., “An option-Pricing Approach to the Cost of Export Credit Insurance”,
Geneva Papers on Risk & Insurance - Theory; June 1997, Vol. 22, Issue 1, pp. 43-58
176
Stephens, Malcolm, “Setting up an export credit insurance agency”, International Trade
Forum; 1996, Issue 3, pp. 4-11
Ahmed, Nasiruddin (2001). Trade liberalization in Bangladesh––An investigation into
trends. Dhaka: The University Press Limited (UPL).
Aslam, Mohamed & Jomo, K.S. (2001). Implications of the GATT Uruguay round for
development: The Malaysian case. In K.S. Jomo & S. Nagaraj (Eds), Globalization versus
development. New York: Palgrave.
Bahmani-Oskooee, M., Economidou, Claire & Goswami, G. Gobinda (2005). Export led
growth hypothesis revisited: A panel cointegration approach. Scientific Journal of
Administrative Development, 3, 40–55.
Bahmani-Oskooee, M. & Nasir, A. (2004). ARDL approach to test the productivity bias
hypothesis. Review of Development Economics, 8(3), 483–488.
Balassa and Associates (1982). Developing strategies in semi-industrial economies.
Baltimore: John Hopkins University Press for the World Bank.
Bannerjee, Anindya, Dolado, Juan J., Galbraith, John W. & Hendry, David F. (1993).
Co-integration, error correction, and the econometric analysis of non-stationary data.
Oxford: Oxford University Press.
Bardsen, G. (1989). Estimation of long-run coefficients in error correction models. Oxford
Bulletin of Economics and Statistics, 51(3), 345–350.
Chee-Keong Choong, Law Siong-Hook, Zulkornain, Yusop & Choo Soo Siew (2005).
Export-led growth hypothesis in Malaysia: A revisit. The ICFAI Journal of Monetary
Economics, III(4), 26–42.
177
Dollar, David (1992). Outward oriented developing economies really do grow more rapidly:
Evidence from 95 LDCs, 1976–1885. Economic Development and Cultural Change,
40(3), 523–544.
Edwards, Sebastian (1993). Openness, trade liberalization, and growth in developing
countries. Journal of Economic Literature, XXXI(September), 1358–1393.
Enders, Walter (1995). Applied econometric time series. Singapore: John Wiley & Sons.
Emran, M.S. & Shilpi, F. (1996). Foreign exchange rationing and the aggregate import
demand function. Economics Letters, 51(3), June, 315–322.
Froyen, Richard T. (1996). Macroeconomics, theories and policies (5th ed.). USA:
Prentice-Hall.
Ghatak, S. & Siddiki, J. (2001), The use of the ARDL approach in estimating virtual
exchange rates in India. Journal of Applied Statistics, 28(5), 573–583.
Goldar, Bishwanath & Kumari, Anita (2003). Import liberalization and productivity
growth in Indian manufacturing industries in the 1990s. The Developing Economics,
XL(1–4), December, 436–460.
Gordon, Robert J. (2000). Macroeconomics (8th ed.). USA: Wesley Longman, Inc.
Greenway, David, Leybourne, Steve & Sapsford, David (1997). Trade liberalization and
growth. In Satya Dev Gupta & Nanda K.C. (Eds), Globalization, growth and sustainability
(Chap. 4, pp. 61–84). Massachusetts, USA: Kluwar Academic Publishers.
Gupta, Satya Dev & Choudhry, Nanda K. (1997). Globalization, growth and
sustainability: An introduction. In Satya Dev Gupta and Nanda K. Choudhry (Eds),
Globalization growth and sustainability (Chap. 1, pp. 1–14). Massachusetts, USA: Kluwer
Academic Publishers.

178
Heien, D.M. (1968). Structural stability and the estimation of international import price
elasticities in world trade. Kyklos, 21(4), 695–711.
Hendry, David F. (1995). Dynamic econometrics. Oxford: Oxford University Press.
Ho, Lok Sang & Wong, Gary (2003, November). The nexus between housing and the
macro economy: Hong Kong as a case study. Retrieved 5 September 2006, from.
http://www.ln.edu
hk/econ/staff/marcohousing2003.pdf
PERIODICALS
IMF Survey, Fortnightly, the Ecomomist, Weekly;
Foreign Trade Review, IIFT, Quaterly.
The Economic & Political Weekly.
NEWS PAPERS
The Economic Times
Business Standard
The Hindu Business Line
WEBILOGRAPHY
www.rbi.org.in
www.eximbankindia.com
www.projectexports.com
www.ecgcindia.com
www.eepcindia.com
www.untad.org
www.fieo.com
www.eouindia.com
www.sezindia.com
http:/ indiabudget.nic.in
http://commerce.nic.in
www.google.com