effects of urbanization on survival rates, anti …
TRANSCRIPT

EFFECTS OF URBANIZATION ON SURVIVAL RATES, ANTI-PREDATOR BEHAVIOR, AND MOVEMENTS OF WOODCHUCKS (MARMOTA MONAX)
BY
ELIZABETH L. WATSON
THESIS
Submitted in partial fulfillment of the requirements for the degree of Master of Science in Natural Resources and Environmental Sciences
in the Graduate College of the University of Illinois at Urbana-Champaign, 2009
Urbana, Illinois
Master’s Committee: Assistant Professor Robert Schooley, Chair Professor Jeffrey Brawn Associate Professional Scientist Edward Heske

ABSTRACT
Urbanization is increasing at a rapid rate and creating novel environmental
conditions for wildlife species, even in already human-altered landscapes. We need a
better understanding of demographic and behavioral responses by mammals to
urbanization including those species that could be urban adapters. Furthermore, past
research has focused on carnivores, but herbivores could respond to additional factors
across urbanization gradients such as variation in real and perceived risk from
predators. I examined survival, cause-specific mortality, anti-predator behavior, and
movements of adult woodchucks (Marmota monax) across an urbanization gradient
within an agricultural landscape in central Illinois from 2007 to 2009. As predicted,
survival rates were related positively to urbanization. Survival rates of woodchucks
were higher, and effects of urbanization were stronger during the inactive season
relative to the active season for this hibernating species. Woodchucks in rural areas
mainly died from predation and probable starvation during hibernation, whereas
major causes of mortality for urban woodchucks were vehicle collisions or unknown
reasons. Three measures of anti-predator behavior—levels of vigilance, foraging
distance from burrows, and flight initiation distance—did not vary with urbanization.
Julian date was related to all components of anti-predator behavior in a consistent
manner, which indicates woodchucks take on more risk later in the active season as
hibernation approaches. Home-range size of woodchucks in urban areas was ~10% of
those in rural areas and urbanization had stronger effects on home-range sizes of
males compared to females. Woodchucks are multiple central-place foragers and their
ii
use of burrows within home ranges also was influenced by urbanization. Number of
burrows per individual decreased with urbanization, but the number of burrows was
not scaled proportionally to home-range size. Distances between burrows increased in
rural areas, and thus risk during inter-burrow movements could be greater for rural
woodchucks. Aggregation of use among burrows increased with urbanization and was
related positively to spatial connectivity of burrows. Urbanization created spatial
variation in real risk for woodchucks and woodchucks responded by demonstrating
substantial plasticity in movement behavior. However, although natural predators are
reduced in urban areas, perceived risk affecting anti-predator behavior remained high
overall for woodchucks in urban areas due to increased levels of human disturbance
and lack of strong habituation to humans. My research demonstrates how combining
demographic and behavioral studies can provide insights into responses to
urbanization, and constraints to those responses, by an urban-adapter species.
iii

ACKNOWLEDGMENTS
I thank my advisor, Bob Schooley, for his patience and guidance throughout
my graduate school experience. Thanks to my committee, Jeff Brawn and Ed Heske
for their helpful comments and advice. I appreciate the invaluable fieldwork
assistance from M. Ulrich, S. Turek, and B. Neese. I also thank K. Byrne, M. Mitchell,
and J. Whittington for their time and veterinary expertise, S. Beckman who shared his
experiences livetrapping woodchucks, and Nohra Mateus-Pinilla for her assistance
with necropsies. I am grateful to the Champaign County Regional Planning
Commission and the City of Monticello for providing digital photographs and GIS
layers, and to the many local businesses and landowners for allowing me to conduct
research on their property. Finally, I thank my wonderful husband, family, and friends
for their love and support throughout this process.
My research was funded by the American Museum of Natural History, the
American Society of Mammalogists, University of Illinois, and USDA Cooperative
State Research, Education and Extension Service (Hatch funds).
iv
TABLE OF CONTENTS
CHAPTER 1: EFFECTS OF URBANIZATION ON SURVIVAL
AND ANTI-PREDATOR BEHAVIOR OF WOODCHUCKS
WITHIN AN AGRICULTURAL LANDSCAPE…………………………………...1
CHAPTER 2: SPACE USE OF WOODCHUCKS ACROSS AN
URBANIZATION GRADIENT WITHIN AN AGRICULTURAL
LANDSCAPE……………………………………………………………………….41
CHAPTER 3: SUMMARY………………………………………………………….72
APPENDIX A: FATES OF MARKED
WOODCHUCKS………………………………...………………………………….76
v

CHAPTER 1:
EFFECTS OF URBANIZATION ON SURVIVAL AND ANTI-PREDATOR
BEHAVIOR OF WOODCHUCKS WITHIN AN AGRICULTURAL
LANDSCAPE
1. Introduction
Urbanization is rapidly increasing and dramatically altering landscapes.
Between 1990 and 2000, urban sprawl, the expansion of urban boundaries into the
rural countryside, grew by as much as 50% in the United States (DeStefano and
DeGraaf, 2003; Heimlich and Anderson, 2001). By 2000, cities and suburbs
contained almost 80% of the human population and represented >5% of the surface
area of the United States (U.S. Census Bureau, 2001). In urban environments, natural
habitat is reduced and fragmented by human-made barriers such as buildings, parking
lots and high-traffic roads; food sources are artificial and concentrated; and
disturbance from humans is high (Ditchkoff et al., 2006; McKinney, 2002). As a
result, urbanization decreases biodiversity, and community structure shifts toward
“urban adapters” that can tolerate and adjust to such dramatic changes (McKinney,
2002). Urban adapters persist in metropolitan areas despite significant human
disturbance, partly due to increased availability of anthropogenic food sources and
reduced number of natural predators (McKinney, 2002; DeStefano and DeGraaf,
2003; Ditchkoff et al., 2006). Urban adapters may modify life-history traits and
behaviors to survive in urban areas; however, the details of these adjustments are
unknown for most species (Dickman and Doncaster, 1987, Ditchkoff et al., 2006). To
1

understand and predict effects of urbanization on wildlife species, we need more
knowledge about mechanistic responses by species to spatial variation in real and
perceived mortality risk created by urbanization gradients.
Studies examining mammalian responses to urbanization primarily have
focused on movements or relative densities of carnivores (e.g., Rosatte, 1991; Riley et
al., 2003; Atwood et al., 2004; Prange and Gehrt, 2004; Riley, 2006), whereas a focus
on survival rates is less common (Prange et al., 2003; Gehrt, 2005; Gosselink et al.,
2007). Estimates of survival rates allow us to evaluate how fitness varies across
urbanizing landscapes and can inform us about potential source-sink dynamics
(Kanda et al., 2009). Existing data indicate survival rates may be similar or higher in
urban areas relative to rural areas, and that disease or vehicle collisions are primary
sources of mortality in urban areas (Prange et al., 2003; Gehrt, 2005; Gosselink et al.,
2007). Prey species may respond to risks similar to those affecting carnivores, but
overall mortality risk of prey also may be affected by variation in predation risk
across urban-rural gradients. However, few studies have quantified variation in
survival rates of a mammalian prey species in relation to urbanization (but see Etter,
2002; McCleery, 2008).
Besides real mortality risk, perceived risk also could vary for prey species
across an urbanization gradient. Natural predators generally are less abundant in
urban areas (Gering and Blair, 1999; McKinney, 2002; Shochat et al., 2006), which
should reduce perceived risk. However, disturbance from humans may replace the
threat of natural predators (Frid and Dill, 2002). Thus, perceived risk in urban areas
partly depends on the degree to which individuals are habituated to humans. In
2
addition, local environmental factors affect the ability of prey to detect and escape
from predators and contribute to perceived risk, such as distance from a refuge while
foraging (Lima, 1987; Dill, 1990; Bonenfant and Kramer, 1996) and presence of
conspecifics (“many eyes hypothesis”; Carey and Moore, 1986; Elgar, 1989; Lima,
1995). Adjustments to anti-predator behavior resulting from changes in perceived risk
across urbanization gradients may translate into variation in survival rates as a result
of trade-offs within activity budgets. Based on foraging theory, if perceived predation
risk is reduced, individuals should spend less time engaged in anti-predator behavior
and more time engaged in other fitness-dependent activities, such as foraging (Lima
and Dill, 1990). Only one study has directly examined vigilance behavior of a
mammalian urban adapter (McCleery, 2009), and investigations that simultaneously
compare demography and behavior of any species in relation to urbanization are rare.
Woodchucks (Marmota monax) are an excellent study species for examining
effects of urbanization on true and perceived risk because they occur in both urban
and rural landscapes and are presumed “urban adapters” (McKinney, 2002). The
species is medium-sized and diurnal, which allows for direct observation to assess
perceived risk, Woodchucks are herbivores and because they hibernate, time
dedicated to foraging is especially consequential for obtaining adequate body
condition for over-winter survival (Davis, 1981). Predators of woodchucks include
coyotes (Canis latrans; Hofmann, 2008) which generally decrease in abundance with
urbanization (Gosselink et al. 2003; Randa and Yunger, 2006), and domestic dogs
(Kwiecinski, 1998; Hofmann, 2008) which are typically leashed by owners in cities.
Therefore, predation risk for woodchucks should be reduced in urban areas.
3

I examined variation in real and perceived risk by comparing survival rates
and anti-predator behavior of woodchucks across an urbanization gradient within a
human-dominated agricultural landscape in central Illinois. I predicted survival rates
would be related positively to urbanization due to reduction of natural predators and
abundant anthropogenic food resources (i.e., managed lawns and gardens) in urban
areas. I also expected causes of mortality to vary across the gradient. To examine
anti-predator behavior, I determined whether woodchucks adjust to changes in
perceived risk by modifying levels of vigilance behavior and the distance at which
they forage from burrows. To understand how woodchucks perceive humans, which
would affect perceived risk, I examined habituation of woodchucks to humans by
comparing flight initiation distance (FID) across the gradient. FID is the distance at
which an animal begins to flee from an approaching predator (Bonenfant and Kramer,
1996) and is often used to examine the effect of human disturbance on wildlife
(Cooke, 1980; Lord et al., 2001; Ikuta and Blumstein, 2003; Griffin, 2007). I
expected woodchucks would habituate to humans in urban areas, and thus have
shorter FIDs than do rural woodchucks. Assuming woodchucks habituate to humans
and natural predators are reduced in urban areas, I expected perceived predation risk
would decrease with urbanization and that urban woodchucks would adjust their
behavior by spending less time vigilant and foraging farther from burrows. I also
predicted perceived predation risk would contribute to overall mortality risk,
specifically over-winter mortality. That is, if woodchucks in rural areas spend more
time engaged in vigilance behavior and less time foraging, their body condition may
be inadequate to survive the winter.
4

2. Methods
2.1. Study species
Woodchucks are herbivores that prefer vegetation common in urban areas
such as grass, clover, and garden crops (Hoffmeister, 2002; Kwiecinski, 1998), and
they are multiple central-place foragers that feed almost exclusively near burrows in
which they escape from predators, rear young, and hibernate. Hibernacula generally
are located in wooded edges, fencerows, steep inclines, or human-made structures,
but woodchucks forage in open fields during the active season (Kwiecinski 1998).
Woodchucks are polygynous, territorial (Maher, 2004), and breed only once per year,
immediately upon emergence from hibernation in the early spring (Hoffmeister,
2002). Litters are born in April - May and juveniles emerge from the burrow once
fully weaned (~44 days; Kwiecinksi, 1998). Timing and degree of philopatry can vary
among populations, but most juveniles disperse within their first year (Kwiecinksi,
1998). Predators of woodchucks include dogs, coyotes (Canis latrans), foxes (Vulpes
vulpes), badgers (Taxidea taxus), bobcats (Lynx rufus), mink (Neovison vison),
weasels (Mustela sp.), hawks, and owls (Kwiecinski, 1999; Hofmann, 2008). Badgers
and bobcats are uncommon in central Illinois, and weights of adult woodchucks range
from 3.4 – 6.7 kg (E. L. Watson, unpublished data), thus, it is unlikely that adult
woodchucks are vulnerable to smaller predators like foxes, mink, weasels, hawks, and
owls. Hence, we assumed the main predators of adult woodchucks in our study area
were coyotes and domestic dogs. Woodchucks exhibit behavioral plasticity in relation
to environmental heterogeneity (Swihart, 1992; Bonenfant and Kramer, 1996; Maher,
2004; Chapter 2).
5

2.2. Study area and urbanization gradient
I conducted my research in a 700-km2 study area located around the twin
cities of Champaign and Urbana in east-central Illinois. The Champaign-Urbana
metropolitan area is a medium-sized community (2007 population estimate =
220,923), which grew 5% from 2000 to 2007 (U.S. Census Bureau, 2009). High
densities of older buildings (~492 buildings/km2); impervious surfaces in the form of
roads (~12.8 km of roads/km2), sidewalks, and parking lots; and established trees
characterize the urban core. Extending out from the urban center, building density
decreases, newer and sprawling residential subdivisions and office parks dominate,
and tree density is reduced. The landscape eventually grades into one of the most
intensive regions of row crop agriculture in the United States (Mankin and Warner,
1997) where corn and soybeans become the dominant land cover resulting in a
landscape nearly devoid of cover between the fall harvest and spring planting
(Warner, 1994). The rural landscape also is characterized by a low diversity of
habitats including sparse forest fragments and fencerows, few homesteads (~9
buildings/km2), minimal traffic, and ~1.1 km of roads/km2.
I sampled woodchucks across an urbanization gradient defined by the
percentage of urban land cover within a specific buffer size. For survival analysis, I
used a 500-m buffer around each individual’s favored burrow as determined from
radiolocations (details to follow). This standard distance was chosen to encompass
variation in home-range size of woodchucks related to sex and gradient position (see
Chapter 2), and to represent potential risk encountered by woodchucks from the
broader landscape. For the behavioral analysis, I used a 300-m buffer around the
6
burrow at which the observation took place. Here, I wanted to examine a spatial
extent that would index potential disturbances at a more local scale. Key results
regarding urbanization and behavior were insensitive to buffer size (from 100 to 500
m). I chose the burrow of observation to center buffers because many observed
woodchucks were not radio-marked, and thus I had no information about their
favored burrow or home-range size.
I classified land cover within buffers using digital orthophotographs
(minimum resolution of 0.5 m) from 2008 (for 84 woodchucks) and from 2005 (3
woodchucks outside of Champaign County). Land cover was classified into 5
categories: “developed” included paved surfaces, buildings, and associated lawns and
gardens; “urban open space” included maintained open areas such as cemeteries,
parks, and golf courses; “urban forest” included forest surrounded by developed land
cover; “urban grassland” included all unmaintained grass surrounded by developed
land cover; and “rural” included all remaining land cover. To differentiate urban
animals with home ranges without any natural habitat from those with home ranges
that included natural habitat surrounded by developed land cover (urban grassland,
urban forest), I considered urban land cover to include the categories of “developed”
and “urban open space”. I ground-truthed photographs during field visits and updated
my classifications when necessary.
2.3. Capture and radiotracking
Woodchucks were captured from May to November 2007 using single-door
collapsible Tomahawk traps (Tomahawk Live Trap Co., Tomahawk, Wisconsin;
7

Model 207). Trapping techniques were approved by the University of Illinois’
Institutional Animal Care and Use Committee and met guidelines of the American
Society of Mammalogists (Gannon et al., 2007). I placed traps baited with apples and
peanut butter near active burrows (Swihart, 1992; Maher, 2004). Traps were set in the
early morning, checked every 2 hours, and closed by mid afternoon.
I transported adult woodchucks (≥1 year old; age determined by weight and
pelage; Kwiecinski, 1998) to the College of Veterinary Medicine at the University of
Illinois where a 32-g radio transmitter (Model #M1240, Advanced Telemetry
Systems, Isanti, Minnesota) was surgically implanted in the peritoneal cavity,
generally within 3 hrs of capture. Standard surgical procedures (Van Vuren, 1989;
Maher, 2009) were followed except medetomidine was used as the anesthetic rather
than a xylazine-ketamine mixture. While woodchucks were anesthetized, I
determined their sex and implanted passive-integrated transponders (PIT; Schooley et
al., 1993) in the interscapular region for long-term identification. Woodchucks were
released at their burrows of capture after full recovery. To monitor survival, I located
woodchucks 2-4 times per week during 2 active seasons (2007 and 2008) and 3 times
per month during 2 hibernation seasons (2007-2008, 2008-2009). Radio-monitoring
was less frequent during the 2009 active season (once every two weeks until July,
once every 3-4 weeks in August and September). Transmitters were equipped with a
mortality sensor that changed pulse rate when an animal had not moved in >8 hrs.
Carcasses were recovered and a cause of death was determined in the field or by
necropsy by the College of Veterinary Medicine at the University of Illinois if the
carcass was not too decomposed. Mortalities were attributed to predation when the
8

transmitter was discovered outside of the woodchuck, either alone or with evidence of
a carcass nearby. Vehicle collision was determined as the cause of death when a
carcass was found in or near a road, or if the necropsy results indicated massive
trauma. If the woodchuck never left the den after the inactive season, the cause of
death was attributed to hibernation.
2.4. Survival estimation
I used known-fate models in program MARK (White and Burnham, 1999) to estimate
survival rates of radio-marked woodchucks across the urbanization gradient. Known-
fate models allow for staggered entry of individuals and evaluation of survival
covariates. Survival rates were estimated for 63 two-week intervals (45 active-season
intervals, 18 inactive-season intervals). Because I did not know when woodchucks
were physiologically hibernating, I defined active and inactive seasons based on
denning dates using radiolocations. The inactive season began with the median date
of settlement at the hibernaculum in autumn (den entry) and ended with the median
date of the first location outside of the hibernaculum in spring (den exit). The median
den entry date was 15 November in 2007 (SE = 12.8, n = 35) and 30 October in 2008
(SE = 4.0, n =20). The median den exit date was 10 March in 2008 (SE = 4.0, n = 33)
and 3 March in 2009 (SE = 3.9, n = 19). Because of considerable variation among
individuals in den entry and exit dates, I applied a censoring procedure to
woodchucks whose denning pattern did not coincide with median dates. If a
woodchuck denned prior to the beginning of the inactive season, it was censored from
the active season until the inactive season began. If a woodchuck denned later than
9
the median entry date, it was censored from the inactive season until the date when it
denned. The same procedure was applied for den exit dates. Individuals also were
censored for any interval for which their fate was unknown due to movement or
transmitter failure.
To test for effects of urbanization and other covariates on survival rates, I
evaluated 8 candidate models using Akaike’s Information Criterion (AICc: corrected
for small sample size; Burnham and Anderson, 2002). AIC allows for simultaneous
comparison of multiple models by ranking them based on goodness of fit and
complexity. Models with a ∆AIC value <2 are considered competitive (Burnham and
Anderson, 2002). The candidate models included combinations of urban land cover
(urban), sex, and season (active = 0, inactive = 1) as predictors plus an interaction
term for urban x season. I also examined parameter estimates (β, on a logit scale)
from competitive models to understand the relationship between survival and
covariates.
2.5. Anti-predator behavior
I examined three aspects of anti-predator behavior for woodchucks that could
vary with urbanization: vigilance behavior, distance from burrow during foraging
bout, and FID. These behaviors also could covary within individuals. My
observations for these components included both radio-marked and unmarked
individuals, and thus I could not examine effects of sex.
10

2.5.1. Vigilance behavior and distance from burrow
I recorded behavior during focal observations (Martin and Batesman, 2007)
of woodchucks from June to October 2008. Each individual was observed only once.
I located foraging woodchucks for observation by waiting at a burrow for an
individual to emerge or by observing an individual already out foraging. In both cases,
I started observations after the woodchuck had resumed foraging if I had disturbed it.
Woodchucks generally do not react to people within vehicles (E. L. Watson, personal
observation), therefore all observations were recorded from a vehicle parked >30 m
from the focal animal. Observations were recorded by one of two observers (trained
for consistency) using a window-mounted digital video camera (minimum 25x zoom)
and a stopwatch. Only woodchucks in low vegetation were observed for ease of
visibility. Observations lasted ≥8 min and were terminated if the woodchuck was
flushed into the burrow or if the observation exceeded 45 min.
During observations, I recorded local environmental covariates known to
affect vigilance behavior by quietly speaking them into the camera’s microphone
every 20s. I recorded number of conspecifics within 10 m (Blumstein et al., 2004)
and distance from the focal woodchuck to the nearest burrow. Distances were visually
estimated according to categories (0-2, 2-4, 4-6, 6-10, 10-20, and >20 m) and
accuracy of observers was tested throughout the season. I also recorded disturbances
within 50 m (i.e., people walking, loud noises, cars, presence of predators) as they
occurred during the observation. The burrow location was recorded with a handheld
Global Positioning System (GPS) unit after the observation was terminated. Videos
were later scored by one observer to estimate activity budgets using the same 20-s
11

intersample interval used to record environmental covariates at the time of the
observation. Behaviors were classified from an ethogram based on one developed for
woodchucks and yellow-bellied marmots (Marmota flaviventris, Armitage et al., 1996;
Maher, 2006; Table 1).
2.5.2. Flight initiation distance
I evaluated the degree to which adult woodchucks were habituated to people
by measuring flight initiation distance (FID) across the urbanization gradient from
August to October 2008. To measure FID, I located a foraging woodchuck and
positioned myself so that the woodchuck was in a straight line between me and the
nearest burrow. I noted my initial location so that I could measure “start distance”
(distance between predator and prey when approach begins; Blumstein, 2003). Once
the individual detected me (as demonstrated by an alert posture), I noted its location
relative to the burrow and began a slow, constant approach. I marked my location
when the woodchuck began to flee, and continued to move toward the woodchuck
with a steady pace until it reached the burrow. FID and start distances were recorded
with a measuring tape and location of the burrow to which the woodchuck fled was
recorded with a handheld GPS unit. I conducted all FID trials and wore similar
clothing for each trial to avoid any biases. Only one trial was conducted for each
individual.
12

2.5.3. Analysis of anti-predator behavior
To test for an effect of urbanization on vigilance behavior, distance from
burrow during foraging bout, and FID, I used generalized linear models in SAS
(PROC GENMOD - SAS Institute Inc., 2009) and evaluated candidate models using
AIC. Vigilance behavior was analyzed as the proportion of sample intervals during
which a woodchuck displayed low vigilance, medium vigilance, or high vigilance
(Table 1). That is, these three behaviors were combined into one variable for analysis
(vigilance). I arcsine transformed vigilance proportions prior to analysis. For
vigilance behavior, I compared 16 models that included combinations of four
predictors: urban land cover (urban), distance of woodchuck from burrow (DFB),
presence of conspecifics (conspecifics), and the Julian date of the observation (date).
DFB was calculated as the average distance for an individual across sample intervals
from the simultaneous behavioral observations (using the center value of the distance
categories). For analyzing DFB as a response variable, I evaluated 8 models that
included combinations of urban, conspecifics, and date as predictors. For FID, I
compared 15 models that included combinations of urban, DFB, the initial distance
between me and the woodchuck (start), and date. I also examined parameter estimates
(β) from competitive models to understand relationships between response variables
and predictors.
I examined whether vigilance behavior varied within distance categories
across the gradient. For each individual, I calculated the proportion of intervals that
woodchucks spent vigilant while foraging at each distance category during behavioral
observations, then averaged those proportions across individuals. I limited my
13
analysis to behavioral observations during which the focal woodchuck was not
disturbed.
Independent of urbanization, I was interested in whether certain individuals
might be risk-aversive, whereas others might be risk-takers. Thus, I examined
covariation of vigilance behavior and FID for the subset of animals for which I had
both types of behavioral data. Correlated behaviors are referred to as “behavioral
syndromes” (Sih et al. 2004) and have been examined in a congener, yellow-bellied
marmots (Marmota flaviventris; Blumstein et al. 2004)
3. Results
3.1. Survival rates
Survival estimates were based on 41 woodchucks (17 males, 24 females)
distributed across the urbanization gradient (Fig. 1). Twenty-six woodchucks died (23
in the active season, 3 in the inactive season) during the 126-week study. Two
individuals were relocated by homeowners and subsequently censored. The signal
from one female, urban woodchuck was lost early in the 2008 active season, despite
extensive searching. Because female woodchucks in urban areas have small home
ranges (<3 ha, Chapter 2), and the missing woodchuck had never moved from her
general capture site, I attributed her disappearance to a premature transmitter failure.
During the last several months of the study, transmitters began to exceed their
expected battery life and the remaining woodchucks (n = 12) also were censored due
to transmitter failure.
14

Survival probability per two-week interval was higher during the inactive
season than during the active season (Sinactive = 0.997, SE = 0.004; Sactive = 0.971, SE =
0.006), and differences in survival rates increased with urbanization (Fig. 2). AIC
rankings revealed three competitive models for explaining variation in survival rates
of woodchucks (Table 2). All competitive models included season as a covariate and
the top-ranked model included only season (Table 2). Another model that included
urbanization, season, and an urban x season interaction was ranked second and close
to the top model (Table 2). Although the second-ranked model was more complex
than the top model (2 additional parameters), the second-ranked model reduced the
deviance substantially. Thus, there was support for an effect of urbanization and an
urbanization x season interaction on survival rates of woodchucks (Fig. 2). Survival
was related positively to urbanization (βurban = 0.16, SE = 0.60), but this effect was
stronger for the inactive season than for the active season ((βinactive = 2.15, SE = 1.09;
βurban x season = 3.37, SE = 2.31). A model which included urbanization and season was
competitive as well (Table 2). There was no support for an effect of sex on survival
rates.
3.2. Causes of mortality
Of 26 woodchucks known to have died during the study (Fig. 3), 7 died from
predation (26.9%), 5 died from vehicle collisions (19.2%), 2 died from conflict with a
landowner (7.6%), 3 died during the inactive season (11.5%), and causes of 9 deaths
were unknown (36%). Patterns in mortality causes were evident along the
urbanization gradient (Fig. 3, Appendix A). Almost all mortalities from predation
15

(86%) occurred in rural and suburban areas with <35% urban land cover. Mortalities
due to collisions with vehicles occurred only in urban and suburban areas. Mortalities
during the inactive season, presumably due to low body condition at the time of
immergence, occurred in more rural areas (<45% urban land cover). Causes of 9
mortalities could not be determined either because the carcass was too decomposed
by the time it was discovered, or because the woodchuck died in an inaccessible
burrow. Seven (78%) of these unknown mortalities occurred in areas with >80%
urban land cover.
3.3. Anti-predator behavior
Analyses of vigilance behavior and distance from burrow during foraging
bouts were based on observations of 41 individuals (14 radio-marked, 27 unmarked;
Fig. 1). On average, woodchucks spent 13.5% (SE = 2.07) of the observation time
engaged in vigilance behavior. There was no support for an overall, linear effect of
urbanization on vigilance behavior (Fig. 4). The only competitive model for
predicting vigilance behavior included date of the observation (R2 = 0.21, Table 3).
Woodchucks were more vigilant in early season relative to late season (βdate = -0.003,
SE = 0.0009). Vigilance levels of 20-50% were common before 30 July, but vigilance
exceeded 10% only once in 15 (6.7%) observations after 30 July (Fig. 4). The second-
ranked model included urbanization, but urbanization did little to increase the log-
likelihood of the model relative to the top model without urbanization (Table 3).
During behavioral observations, woodchucks foraged within 7.5 m (SE = 0.67)
from the burrow on average. There was not strong support for an effect of
16

urbanization on foraging distance from burrows. The top-ranked model for predicting
DFB included date of the observation (Table 3), although the model did not explain a
substantial amount of variation (R2 = 0.06, n = 41). Woodchucks foraged farther from
the burrow in late season relative to early season (βdate = 0.033, SE = 0.021). The
second-ranked model was the intercept-only model; however, the log-likelihood for
this model was considerably lower relative to the top model (Table 3). The third-
ranked model included urban only, but its log-likelihood was barely higher than the
intercept-only model (Table 3).
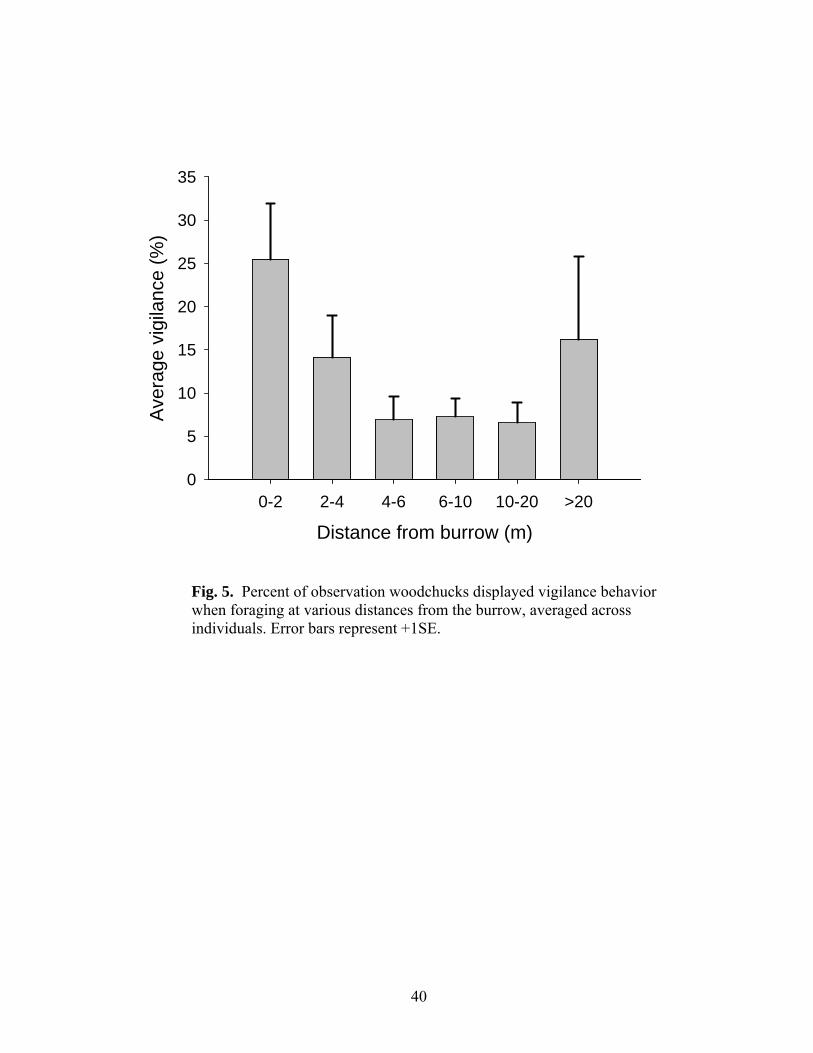
Based on those behavioral observations that were free from human
disturbance (n = 31), average vigilance levels decreased from 25% when woodchucks
foraged <2 m from the burrow to 7% when woodchucks foraged 10-20 m from the
burrow. Vigilance levels increased to an average of 16% when woodchucks foraged
>20m from the burrow (Fig. 5).
I conducted FID trials on 27 individuals (6 radio-marked, 21 unmarked; Fig.
1). The average FID across the gradient was 26.9 m (SE = 2.14). There was little
support for an effect of urbanization on FID. AIC rankings revealed 4 competitive
models that all included start distance as an important factor affecting flight initiation
distance. The top-ranked model included start distance and date (R2 = 0.33, Table 3).
FID was related positively to start distance (βstart = 0.37, SE = 0.13) and negatively to
date (βdate = -0.20, SE = 0.13). Closely ranked with the top model was a model that
included start distance alone (Table 3). A model including distance to burrow in
addition to start and date also was competitive. Distance to burrow had a positive
effect on FID (βDFB = 0.34, SE = 0.36; Table 3). There was support for effects of date
17
and distance to burrow on FID as the addition of each variable increased the model
log-likelihood compared to that of the start-distance-only model (Table 3). The final
competitive model included start distance plus urbanization; however, the small
difference in log-likelihoods between this model and the start-distance-only model
indicated little support for an effect of urbanization on FID (Table 3).
Flight initiation distance and vigilance behavior were correlated positively for
those woodchucks for which I had both types of data (r = 0.83, P = 0.02, n = 7).
Woodchucks that spent more time vigilant during behavioral observations also
flushed earlier when approached.
4. Discussion
As predicted, survival rates were higher for urban woodchucks than for rural
woodchucks. A similar pattern has been documented for several mammalian species
that persist in urban areas including raccoons (Procyon lotor; Prange et al., 2003),
white-tailed deer (Odocoileus virginianus; Etter, 2002), fox squirrels (Sciurus niger;
McCleery, 2008) and Virginia opossums (Didelphis virginiana; Kanda et al. 2009). In
addition, there was a strong effect of season on survival rates (inactive > active) for
woodchucks, a hibernating species, and an interaction between season and
urbanization so that differences in survival rates between urban and rural woodchucks
were greatest during the inactive season.
Results for survival rates paralleled variation in mortality causes across the
urbanization gradient. In rural areas, mortality during the inactive season was second
only to active-season predation as a cause of death. Mortalities during the inactive
18

season probably were due to starvation, as there was no evidence of predation at the
hibernacula. In contrast, no urban woodchucks (>80% urban cover) died during the
inactive season. Collisions with vehicles were a major cause of death for urban and
suburban woodchucks, which is similar to the pattern for urban fox squirrels
(McCleery et al., 2008) and juvenile opossums (Kanda et al. 2009). In contrast,
mortality rates due to collisions with vehicles did not vary between urban and rural
individuals for raccoons (Prange et al., 2003), skunks (Mephitis mephitis; Gehrt,
2005), and red foxes (Gosselink et al., 2007). In urban areas, home ranges of
woodchucks are approximately 90% smaller than those in rural areas, roads often
form home-range boundaries, and individuals generally avoid crossing roads with >2
lanes or those with considerable traffic (Chapter 2). However, distances moved by
woodchucks increase during the early part of the active season (Ferron and Ouellet,
1989). Of the deaths attributed to vehicle collisions, 4 of 5 (80%) occurred in April
and early May. Requirements of breeding might impose mortality risks for
woodchucks in fragmented, urban regions.
Despite frequent radio-tracking, the cause of most (64%) urban woodchuck
mortalities could not be determined because the carcass was either too decomposed,
or the woodchuck had died in a burrow that was inaccessible. In contrast, a cause
could not be determined for only two deaths in suburban and rural areas. Increased
disease prevalence due to higher densities or altered spatial distributions of
individuals has been documented for several urban wildlife species, and was the main
cause of mortality for raccoons and skunks in Chicago (Prange et al., 2003; Gehrt,
2005) and red foxes living in urban areas in central Illinois (Gosselink et al., 2007). In
19

our study area, Toxoplasma gondii antibodies were found in sera from 14% of
woodchucks, but only in areas with >70% urban land cover (Watson et al., in review).
Potential effects of T. gondii include reduced body condition, neurological
impairment, and increased predation risk (Berdoy et al., 2000; Bangari et al., 2007).
Hence, some of the urban mortalities for which a cause could not be identified could
have been disease-related.
Surprisingly, there was no effect of sex on survival rates of woodchucks. In
general, male woodchucks have larger home ranges than females (Chapter 2). Larger
home ranges and increased movements should translate into elevated mortality risk
for male woodchucks either from predators in rural areas or vehicles in urban areas,
but no differences in survival rates between males and females were detected.
There was no evidence of an overall effect of urbanization on vigilance
behavior, distance from burrows during foraging, and flight initiation distance. In
contrast, changes to anti-predator behavior in response to human disturbance have
been documented for Olympic marmots (Marmota olympus; Griffin et al., 2007), gray
squirrels (Sciurus carolinensis; Bowers and Breland, 1996), fox squirrels (McCleery,
2009), and several bird species (Cooke, 1980). This lack of response of anti-predator
behaviors to urbanization suggests woodchucks are not strongly habituated to human
disturbance in urban areas and may perceive humans to be a risk similar to natural
predators. However, habituation to humans may be partial (Frid and Dill, 2002).
Woodchucks living in urban areas must be tolerant of human disturbance to some
degree to persist in such a highly disturbed landscape. Reactions by alpine marmots
(Marmota marmota) to humans are less intense if they remain on predictable paths
20

such as hiking trails (Mainini, 1993). Woodchucks in urban areas likely are tolerant
of humans walking on predictable, established paths such as sidewalks, but I was
unable to capture this tolerance in my tests of flight initiation distance.
Although mean levels of vigilance behavior did not respond to urbanization in
a linear fashion, vigilance levels might respond to urbanization in more complex
ways. Vigilance levels were highly variable at the urban end of the gradient, ranging
from 3% to 48%, whereas levels were constrained to <20% at the rural end (Fig. 4).
Increased variability in vigilance behavior at the urban end of the gradient may reflect
the variable nature of human disturbance levels in such environments. Some of my
marked woodchucks occurred in areas adjacent to busy intersections, surrounded by
high levels of traffic and regular pedestrian disturbance, whereas others were captured
in isolated office parks or abandoned lots, where traffic and human disturbance was
considerably reduced and sidewalks were rare (E. L. Watson, personal observation).
Additionally, my results suggest that some woodchucks are risk-takers, whereas
others are more risk-aversive. Woodchucks that spent more time vigilant during
behavioral observations also fled more quickly from a human when approached,
which implies individual variation in wariness that could reflect different disturbance
levels to which individuals were exposed. This hypothesis that urbanization increases
spatial variation in perceived predation risk for wildlife species deserves further study.
Date was included in the top models of all components of anti-predator
behavior, and all responses showed a similar relationship that was independent of
urbanization. Woodchucks were less vigilant, foraged farther from burrows, and
tolerated closer approaches by humans later in the season. Hibernating sciurids gain
21

considerable weight throughout the active season in preparation for hibernation,
which could inhibit their ability to escape from predators (Trombulak, 1989; but see
Blumstein, 1992). Despite this potential for increased risk related to constraints on
running speeds, my results suggest woodchucks are actually willing to accept more
risk later in the season. As hibernation approaches, it is likely that woodchucks are
under more pressure to increase body condition, and they may reduce time spent
engaged in anti-predator behaviors in favor of increased foraging time.
I predicted that urban woodchucks would exhibit reduced levels of anti-
predator behavior in response to lower perceived risk, and that these behavioral
adjustments would translate into higher over-winter survival rates resulting from
increased foraging time and better body condition. Perceived risk can have strong
effects on fitness (Creel and Christianson, 2007). Although I revealed variation in
over-winter survival rates across the gradient, I found no evidence of variation in
mean levels of anti-predator behavior. Why were over-winter survival rates higher for
urban woodchucks? Food quality may be higher in urban areas than in rural areas.
Although we did not examine resource levels across the urbanization gradient,
resources in urban areas are typically abundant and rich due to artificial food sources
such as managed lawns and gardens, which could lead to better body condition for
urban woodchucks. For instance, a positive relationship between anthropogenic
resources and body condition has been demonstrated for silver gulls (Larus
novaehollandiae); males living in urban areas are heavier and have higher body
condition than those in rural areas (Auman et al., 2008). Another possible explanation
is variation in thermal conditions of the hibernacula across the urbanization gradient.
22

Although there were no obvious differences in the habitat selected for hibernacula, an
increase in impervious surfaces created by urbanization can lead to a heat island
effect, by which air and surface temperatures are warmer (1- 4°C) than those in the
surrounding rural areas (Arnfield, 2003; Shochat et al., 2006). Warmer temperatures
could translate into higher underground temperatures of hibernacula, which may
explain the variation in over-winter survival rates across the urbanization gradient.
Survival rates and cause-specific mortality varied substantially for
woodchucks across an urbanization gradient. Urban areas may act as refuges from
natural predators for woodchucks, and local urban populations may even act as
sources that supply rural populations (Kanda et al. 2009). However, urbanization also
amplifies alternative real and perceived risks such as vehicles, disease, and human
disturbance. My research provides insights into tradeoffs encountered by urban
adapter species across an urbanization gradient, and evidence for lack of strong
habituation to humans by an urban adapter. It is vital that we continue to examine
how wildlife species are responding to urban environments and identify constraints to
behavioral adjustments with consequences for fitness and persistence.
23

Chapter 1 meets the formatting requirements for Biological Conservation.
5. References
Armitage, K.B., Salsbury, C.M., Barthelmess, E.L., Gray, R.C., Kovach, A., 1996.
Population time budget for the yellow-bellied marmot. Ethol. Ecol. Evol. 8,
67-95.
Atwood, T.C., Weeks, H.P., Gehring, T.M., 2004. Spatial ecology of coyotes along a
suburban-to-rural gradient. J. Wildlife Manage. 68, 1000-1009.
Auman, H.J., Meathrel, C.E., Richardson, A., 2009. Supersize me: does
anthropogenic food change the body condition of silver gulls? A comparison
between urbanized and remote, non-urbanized areas. Waterbirds 31, 122-126.
Arnfield, A.J., 2003. Two decades of urban climate research: a review of turbulence,
exchanges of energy and water, and the urban heat island. Int. J. Clim. 23, 1-
26.
Bangari, D.S., Mouser, P., Miller, M.A., Stevenson, M.A., Vemulapalli, R., Thacker,
H. L., 2007. Toxoplasmosis in a woodchuck (Marmota monax) and two
American red squirrels (Tamiasciurus hudsonicus). J. Vet. Diagn. Invest. 19,
705-709.
Berdoy, M., Webster, J.P., Macdonald, D.W. 2000. Fatal attraction in rats infected
with Toxoplasma gondii. Proc. R. Soc. Lond. B 267, 1591-1594.
Blumstein, D.T., 1992. Multivariate analysis of golden marmot maximum running
speed: a new method to study MRS in the field. Ecology 73, 1757-1767.
24

Blumstein, D.T., 2003. Flight-initiation distance in birds is dependent on intruder
starting distance. J. Wildlife Manage. 67, 852-857.
Blumstein, D.T., Runyan, A., Seymour, M., Nicodemus, A., Ozgul, A., Ransler, F.,
Soyeon, I., Stark, T., Zugmeyer, C., Daniel, J.C., 2004. Locomotor ability and
wariness in yellow-bellied marmots. Ethology 110, 615-634.
Bonenfant, M., Kramer, D.L., 1996. The influence of distance to burrow on flight
initiation distance in the woodchuck, Marmota monax. Behav. Ecol. 7, 299-
303.
Bowers, M.A., Breland, B., 1996. Foraging of gray squirrels on an urban-rural
gradient: use of the GUD to assess anthropogenic impact. Ecol. Appl. 6, 1135-
1142.
Burnham, K.P., Anderson, D.R., 2002. Model Selection and Multimodel Inference: A
Practical Information-theoretic Approach, second edition. Springer, New York,
New York.
Bradley, C.A., Altizer, S., 2007. Urbanization and the ecology of wildlife diseases.
Trends in Ecology & Evolution 22, 95-102.
Carey, H.V., Moore, P., 1986. Foraging and predation risk in yellow-bellied marmots.
Amer. Midl. Nat. 116, 267-275.
Cooke, A.S., 1980. Observations of how close certain passerine species will tolerate
an approaching human in rural and suburban areas. Biol. Conserv. 18, 85-88.
25

Creel, S., Christianson, D., 2007. Relationships between direct predation and risk
effects. Trends in Ecology & Evolution 23, 194-201.
Davis, D.E., 1981. Mechanism for decline in a woodchuck population. J. Wildlife
Manage. 45, 658-668.
DeStefano, S., DeGraaf, R.M., 2003. Exploring the ecology of surburban wildlife.
Front. Ecol. Environ. 1, 95-101.
Dickman, C.R., Doncaster, C.P., 1987. The ecology of small mammals in urban
habitats. I. Populations in a patchy environment. J. Anim. Ecol. 56, 629-640.
Ditchkoff, S.S., Saalfeld, S.T., Gibson, C.J., 2006. Animal behavior in urban
ecosystems: modifications due to human-induced stress. Urban Ecosyst. 9, 5-
12.
Dill, L.M., 1990. Distance-to-cover and the escape decisions of an African cichlid
fish, Melanochromis chipokae. Environmental Biology of Fishes 27, 147-152.
Dill, L.M., Houtman, R., 1989. The influence of distance to refuge on flight initiation
distance in the gray squirrel (Sciurus carolinensis). Can. J. Zool. 67, 233-235.
Elgar, M.A., 1989. Predator vigilance and group size in mammals and birds: a critical
review of the empirical evidence. Biol. Rev. 64, 13-33.
Etter, D.R., Hollis, K.M., Deelen, T.R.V., Ludwig, D.R., Chelsvig, J.E., Anchor, C.L.,
Warner, R.E., 2002. Survival and movements of white-tailed deer in suburban
Chicago, Illinois. J. Wildlife Manage. 66, 500-510.
26

Ferron, J., Ouellet, J.P., 1989. Temporal and intersexual variations in the use of space
with regard to social organization in the woodchuck (Marmota monax). Can. J.
Zool. 67, 1642-1649.
Forman, R.T.T., Sperling, D., Bissonette, J.A., Clevenger, A.P., Cutshall, C.D., Dale,
V.H., Fahrig, L., France, R., Goldman, C.R., Heanue, K., Jones, J.A.,
Swanson, F.J., Turrentine, T., Winter, T.C., 2003. Road Ecology: Science and
Solutions. Island Press, Washington, DC, pp. 504.
Frid, A., Dill, L., 2002. Human-caused disturbance stimuli as a form of predation risk.
Conserv. Ecol. 6, [online] URL: http://www.consecol.org/vol6/iss1/art11.
Gannon, W. L., Sikes, R. S., and the Animal Care and Use Committee of the
American Society of Mammalogists, 2007. Guidelines of the American
Society of Mammalogists for the use of wild mammals in research. J.
Mammal. 88, 809-823.
Gehrt, S.D., 2005. Seasonal survival and cause-specific mortality of urban and rural
striped skunks in the absence of rabies. J. Mammal. 86, 1164-1170.
Gering, J.C., Blair, R.B., 1999. Predation on artificial bird nests along an urban
gradient: predation risk or relaxation in urban environments. Ecography 22,
532-541.
Gosselink, T.E., Van Deelen, T.R., Warner, R.E., Joselyn, M.G., 2003. Temporal
habitat partitioning and spatial use of coyotes and red foxes in east-central
Illinois. J. Wildlife Manage. 67, 90-103.
27

Gosselink, T.E., Van Deelen, T.R., Warner, R.E., Mankin, P.C., 2007. Survival and
cause-specific mortality of red foxes in agricultural and urban areas of Illinois.
J. Wildlife Manage. 71, 1862-1873.
Griffin, S.C., Valois, T., Taper, M.L., Scott Mills, L., 2007. Effects of tourists on
behavior and demography of Olympic marmots. Conserv. Biol. 21, 1070-1081.
Heimlich, R.E., Anderson, W.D., 2001. Development at the urban fringe and beyond,
impacts on agriculture and rural land. US Department of Agriculture,
Washington, DC.
Hofmann, J. E., 2008. Field Manual of Illinois Mammals. Illinois Natural History
Survey manual 12, Illinois Natural History Survey, Champaign, Illinois.
Hoffmeister, D.F., 2002. Mammals of Illinois. University of Illinois Press, Urbana,
Illinois.
Ikuta, L.A., Blumstein, D.T., 2003. Do fences protect birds from human disturbance?
Biol. Conserv. 112, 447-452.
Kanda, L.L., Fuller, T.K., Sievert, P.R., Kellogg, R.L., 2009. Seasonal source-sink
dynamics at the edge of a species' range. Ecology 90, 1574-1585.
Kwiecinski, G.G., 1998. Marmota monax. Mamm. Species 591, 1-8.
Lima, S.L., 1987. Distance to cover, visual obstructions, and vigilance in house
sparrows. Behaviour 102, 231-238.
28

Lima, S.L., 1995. Back to the basics of anti-predatory vigilance: the group-size effect.
Anim. Behav. 49, 11-20.
Lima, S.L., Dill, L.M., 1990. Behavioral decisions made under the risk of predation: a
review and prospectus. Can. J. Zool. 68, 619-640.
Lord, A., Waas, J.R., Innes, J., Whittingham, M.J., 2001. Effects of human
approaches to nests of northern New Zealand dotterels. Biol. Conserv. 98,
233-240.
Maher, C.R., 2004. Intrasexual territoriality in woodchucks (Marmota monax). J.
Mammal. 85, 1087-1094.
Maher, C.R., 2006. Social organization in woodchucks (Marmota monax) and its
relationship to growing season. Ethology 112, 313-324.
Maher, C.R., 2009. Genetic relatedness and space use in a behaviorally flexible
species of marmot, the woodchuck (Marmota monax). Behav. Ecol. Sociobiol.
63, 857-868.
Mainini, B., Neuhaus, P., Ingold, P., 1993. Behaviour of marmots Marmota marmota
under the influence of different hiking activities. Biol. Conserv. 64, 161-164.
Mankin, P.C., Warner, R.E., 1997. Mammals of Illinois and the Midwest: ecological
and conservation issues for human-dominated landscapes, in: Schwartz, M.W.
(Ed.), Conservation in Highly Fragmented Landscapes. Chapman & Hall,
New York, pp. 135-153.
29

Martin, P., Bateson, P., 2007. Measuring Behaviour: An Introductory Guide, third
edition. Cambridge University Press, Cambridge, United Kingdom.
McCleery, R.A., 2009. Changes in fox squirrel anti-predator behaviors across the
urban-rural gradient. Landscape Ecol. 24, 483-493.
McCleery, R.A., Lopez, R.R., Silvy, N.J., Gallant, D.L., 2008. Fox squirrel survival
in urban and rural environments. J. Wildlife Manage.72, 133-137.
McKinney, M.L., 2002. Urbanization, biodiversity, and conservation. BioScience 52,
885-890.
Prange, S., Gehrt, S.D., 2004. Changes in mesopredator-community structure in
response to urbanization. Can. J. Zool. 82, 1804-1817.
Prange, S., Gehrt, S.D., Wiggers, E.P., 2003. Demographic factors contributing to
high raccoon densities in urban landscapes. J. Wildlife Manage. 67, 324-333.
Randa, L.A., Yunger, J.A., 2006. Carnivore occurrence along an urban-rural gradient:
a landscape-level analysis. J. Mammal. 87, 1154-1164.
Riley, S.P.D., 2006. Spatial ecology of bobcats and grey foxes in urban and rural
zones of a national park. J. Wildlife Manage. 70, 1425-1435.
Riley, S.P.D., Sauvajot, R.M., Fuller, T.K., York, E.C., Kamradt, D.A., Bromley, C.,
Wayne, R.K., 2003. Effects of urbanization and habitat fragmentation on
bobcats and coyotes in Southern California. Conserv. Biol. 17, 566-576.
30
Rosatte, R.C., Power, M.J., MacInnes, C.D., 1991. Ecology of urban skunks,
raccoons, and foxes in metropolitan Toronto, in: Adams, L.W., Leedy, D.L.
(Eds.), Wildlife Conservation in Metropolitan Habitats. National Institute for
Urban Wildlife Symposium Series 2, Columbia, MD, pp. 31-38.
SAS Institute Inc., 2008. SAS for Windows, Version 9.2. SAS Institute Inc., Cary,
North Carolina.
Schooley, R.L., Van Horne, B., Burnham, K.P., 1993. Passive integrated transponders
for marking free-ranging Townsend's ground squirrels. J. Mammal. 74, 480-
484.
Shochat, E., Warren, P.S., Faeth, S.H., McIntyre, N.E., Hope, D., 2006. From patterns
to emerging processes in mechanistic urban ecology. Trends Ecol. Evol. 21,
186-191.
Sih, A., Bell, A.M., Johnson, J.C., Ziemba, R.E., 2003. Behavioral syndromes: an
integrative overview. Q. Rev. Biol. 79, 241-277.
Swihart, R.K., 1992. Home-range attributes and spatial structure of woodchuck
populations. J. Mammal. 73, 604-618.
Trombulak, S.C., 1989. Running speed and body mass in Belding's ground squirrels.
J. Mammal. 70, 194-197.
U.S. Census Bureau, 2001. Statistical abstract of the United States: 2001. United
States Bureau of the Census, Washington, DC.
31
U. S. Census Bureau, 2009. State and metropolitan areas data book, Table
B-1: metropolitan areas-area and population. United States Bureau of the
Census, Washington, DC.
Van Vuren, D., 1989. Effects of intraperitoneal transmitter implants on yellow-bellied
marmots. J. Wildlife Manage. 53, 320-323.
Warner, R.E., 1994. Agricultural land use and grassland habitat in Illinois: future
shock for midwestern birds? Conserv. Biol. 8, 147-156.
White, G.C., Burnham, K.P., 1999. Program MARK. Survival estimation from
populations of marked animals. Bird Study 46, Supplement 120-138.
32
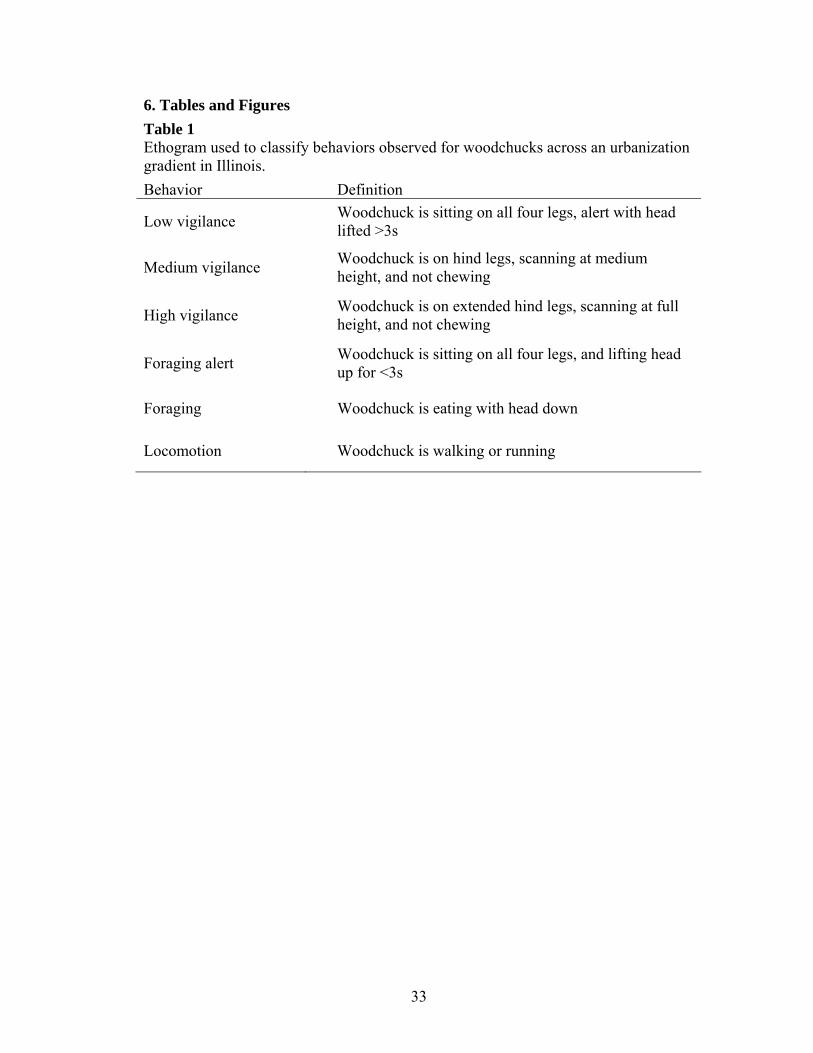
6. Tables and Figures Table 1 Ethogram used to classify behaviors observed for woodchucks across an urbanization gradient in Illinois. Behavior Definition
Low vigilance Woodchuck is sitting on all four legs, alert with head lifted >3s
Medium vigilance Woodchuck is on hind legs, scanning at medium height, and not chewing
High vigilance Woodchuck is on extended hind legs, scanning at full height, and not chewing
Foraging alert Woodchuck is sitting on all four legs, and lifting head up for <3s
Foraging Woodchuck is eating with head down
Locomotion Woodchuck is walking or running
33

Table 2 Ranking of known-fate survival models for woodchucks across an urbanization gradient in Illinois. Main effects included urbanization, sex, and season (active or inactive). K = no. of explanatory variables + 1, ΔAICc = AICc of model – minimum AICc, and ωi = Akaike weight. A 90% confidence set is presented. Model K ΔAICc ωi Deviance
S (season) 2 0 0.343 244.2
S (urban, season, urban x season) 4 0.1 0.321 240.3
S (urban, season) 3 1.1 0.193 243.3
S (urban, season, sex) 4 3.1 0.075 243.2
34

Table 3 Ranking of generalized linear models evaluating factors affecting anti-predator behavior of woodchucks in Illinois. Main effects included urbanization (urban), distance from burrow (DFB), date, presence of conspecifics, and start distance (start). K = no. of explanatory variables + 2, ΔAICc = AICc of model – minimum AICc, and ωi = Akaike weight. A 90% confidence set is presented. Response variable, model K Log-likelihood ΔAICc ωi
Vigilance behavior
Date 3 12.08 0 0.456
Urban, date 4 12.13 2.37 0.139
Date, conspecifics 4 12.10 2.44 0.135
Date, DFB 4 12.10 2.45 0.134
Urban, date, DFB 5 12.14 4.96 0.038 Distance from burrow Date 3 -115.98 0 0.295 Intercept-only 2 -117.24 0.19 0.267 Urban 3 -117.00 2.05 0.106 Date, conspecifics 4 -115.88 2.28 0.094 Conspecifics 3 -117.19 2.42 0.088 Urban, date 4 -115.97 2.45 0.086 Flight initiation distance Start, date 4 -97.46 0 0.260 Start 3 -98.89 0.08 0.250
Start, date, DFB 5 -96.52 1.17 0.145
Urban, start 4 -98.41 1.91 0.101
Start, DFB 4 -98.87 2.82 0.064
Urban, start, date 5 -97.37 2.87 0.062 Urban, start, date, DFB 6 -96.29 4.04 0.035
35

Urban land cover (%)0 20 40 60 80 100
FID
Vigilance and DFB
Survival
Fig. 1. Distribution of woodchucks across an urbanization gradient in Illinois. Distributions are presented for four response variables: survival, vigilance behavior, distance from burrow during foraging bout (DFB), and flight initiation distance (FID).
36

Urban land cover (%)0 20 40 60 80 1
Sur
viva
l pro
babi
lity
00
0.97
0.98
0.99
1.00
Active seasonInactive season
Fig. 2. Two-week survival probabilities for woodchucks during two seasons (active, inactive) across an urbanization gradient in Illinois. Estimates are from a highly supported model (survival = urbanization, season, urbanization x season).
37

Rural Suburban Urban
Mor
talit
ies
(%)
0
20
40
60
80
100 Predation Hibernation Vehicle Conflict Unknown
N = 7 N = 8 N = 11
Fig. 3. Causes of mortalities of woodchucks categorized by location of individuals along the urbanization gradient. For this figure, rural was defined as 0-20% urban cover, suburban was defined as 20-80% urban cover, and urban as 80-100% urban cover.
38

Julian date140 160 180 200 220 240 260 280 300
Vig
ilanc
e (%
)
0
10
20
30
40
50
60 A
Urban land cover (%)0 20 40 60 80 100
0
10
20
30
40
50
60 B
Fig. 4. A) Relationship between vigilance behavior and date for woodchucks across the urbanization gradient. Julian date 160 = 8 June 2008. Julian date 300 = 26 October 2008. B) Relationship between vigilance behavior and urbanization. Vigilance levels were clustered under 20% at the rural end of the gradient, whereas levels were highly variable at the urban end.
39
Distance from burrow (m)0-2 2-4 4-6 6-10 10-20 >20
Aver
age
vigi
lanc
e (%
)
0
5
10
15
20
25
30
35
Fig. 5. Percent of observation woodchucks displayed vigilance behavior when foraging at various distances from the burrow, averaged across individuals. Error bars represent +1SE.
40
CHAPTER 2:
SPACE USE OF WOODCHUCKS ACROSS AN URBANIZATION
GRADIENT WITHIN AN AGRICULTURAL LANDSCAPE
1. Introduction
Urbanization is increasing at an alarming rate and further decreasing the
amount of suitable habitat available to wildlife species. In 2000, urban areas
represented >5% of the surface area of the United States and contained almost 80% of
the human population (U.S. Census Bureau 2001). Between 1990 and 2000,
expansion of urban boundaries into the rural countryside (i.e., urban sprawl) grew by
as much as 50% (DeStefano and DeGraaf 2003; Heimlich and Anderson 2001).
Humans also have dramatically altered the land outside of cities in many regions. For
example, much of the rural landscape in the Midwest has been converted for
agriculture resulting in vast areas of open cropland and few areas of natural habitat
(Gosselink et al. 2003; Mankin and Warner 1997; Warner 1994). Nevertheless,
urbanization still creates a novel footprint in such human-dominated landscapes.
As urbanization increases, remnant natural habitat is separated into patches
that may become isolated by human-made barriers such as roads, buildings, and
parking lots. Crossing high-traffic roads is risky, and collisions with vehicles can be a
major cause of mortality for some species (Forman et al. 2003; Kramer-Schadt et al.
2004; Tigas et al. 2002). Consequently, wildlife movements can be severely restricted
in urban areas thus impeding an individual’s ability to disperse and find mates,
suitable habitat, and food resources (Ditchkoff et al. 2006). Urbanization also can
41

affect the abundance and distribution of food resources, which could then impact
space-use patterns of wildlife (Erlinge 1974; Isbell et al. 1998; Jepsen et al. 2002).
Food is typically abundant in urban areas due to artificial sources such as garbage or
managed vegetation (Ditchkoff et al. 2006; McKinney 2002). Individuals that utilize
these resources can exhibit reduced home ranges and altered spatial distributions
when compared to their rural counterparts (Prange et al. 2004). Concentration of
artificial food sources in urban areas also can increase spatial and temporal overlap of
individuals, which has ramifications for rates of disease transmission (Prange et al.
2003, 2004).
Studies examining movement behavior of mammals in relation to urbanization
have focused primarily on carnivores (Atwood et al. 2004; Prange et al. 2004; Riley
2006; Riley et al. 2003; Rosatte et al. 1991) and have emphasized changes in size or
spatial distribution of home ranges or core areas. Although patterns are emerging
from these studies, we still know relatively little regarding responses to urbanization
by other mammals such as herbivorous prey species. Like carnivores, prey may
respond to factors such as habitat fragmentation and changes in resource levels, but
prey also may be affected by landscape variation in predation risk created by
urbanization. Abundance of natural predators is generally lower in urban areas
(Gering and Blair 1999; McKinney 2002; Shochat et al. 2006), which should reduce
predation risk for prey species. Additionally, many mammalian species are multiple
central-place foragers that focus foraging activity around specific sites scattered
throughout their home ranges. This strategy requires risky movements from one
foraging site to another. Multiple central-place foragers could respond to changes in
42

predation risk across an urbanization gradient by adjusting aspects of space use such
as number of foraging sites or distance between sites. These spatial adjustments may
not be reflected in comparisons of home-range size alone.
Woodchucks (Marmota monax) are an excellent study species for
investigating responses to urbanization because they occur in many environments but
are considered to be “urban-adapters” (McKinney 2002). Woodchucks are diurnal
herbivores that prefer vegetation common in urban areas such as grass, clover, and
garden crops (Hoffmeister 2002; Kwiecinski 1998). Woodchucks are multiple
central-place foragers that feed almost exclusively near burrows in which they
hibernate, rear young, and escape from predators. Predators of woodchucks include
coyotes (Canis latrans; Hofmann 2008; Kwiecinski 1998), which generally decrease
in abundance with urbanization (Gosselink et al. 2003; Randa and Yunger 2006), and
domestic dogs (Hofmann 2008; Kwiecinski 1998), which are typically leashed by
owners in cities. Therefore, predation risk for woodchucks should be reduced in urban
areas. Previous studies on woodchucks have emphasized spatial distribution, social
organization, and habitat selection (Ferron and Ouellet 1989; Henderson and Gilbert
1978; Meier 1992; Merriam 1971), and woodchucks exhibit behavioral plasticity in
relation to environmental heterogeneity (Bonenfant and Kramer 1996; Maher 2004,
2006, 2009; Swihart 1992). Despite the common occurrence of this species in urban
areas, however, no studies have examined how woodchucks adjust to living in such
highly human-altered landscapes.
I compared movements of adult woodchucks across an urbanization gradient
within an agricultural landscape in central Illinois. I examined home-range size and
43

space use within home ranges including number of burrows used, average distance
between burrows, and evenness of use among burrows. I predicted home-range size
would decrease with urbanization because urban areas are fragmented by high-traffic
roads that can be movement barriers for woodchucks (Woodward 1990), and urban
areas provide concentrated food resources. I expected that number of burrows used
would be related positively to home-range size. Hence, I predicted number of burrows
used would decrease with urbanization but distance between burrows would remain
constant across the gradient. That is, rural individuals would have larger home ranges
but would reduce predation risk by establishing more burrows within their ranges.
These predictions depend on the scaling relationship between number of burrows and
home-range size and on how flexible space use is relative to perceived risk. I also
predicted burrow use would be most aggregated for urban woodchucks that would
favor burrows near concentrated food sources (i.e., managed lawns and gardens)
present in urban areas. Alternatively, if aggregation patterns are more related to
predation risk, burrow use would be most aggregated for rural woodchucks that
should preferentially use burrows that are safer to reach. Finally, to gain general
insights about space use by multiple central-place foragers, I also examined whether
intensity of burrow use was related positively to spatial connectivity of burrows.
2. Methods
2.1. Study area and urbanization gradient
My research was conducted in a 700-km2 study area located around the twin cities of
Champaign and Urbana in east-central Illinois. The Champaign-Urbana metropolitan
44

area is a medium-sized, growing community (2007 population estimate: 220,923, a
growth of 5% since 2000 census; U.S. Census Bureau 2009). The urban core is
characterized by high densities of older buildings, impervious surfaces in the form of
roads, sidewalks, and parking lots, and established trees. As distance from the urban
core increases, the landscape becomes less forested, building density decreases in the
form of newer residential subdivisions and office parks, and the landscape eventually
grades into one of the most intensive regions of row crop agriculture in the United
States (Mankin and Warner 1997). Because corn and soybeans are the dominant land
cover outside of the urban centers, the rural landscape is almost completely absent of
cover between the crop harvest in the fall and planting in the spring (Warner 1994).
The rural landscape also is characterized by a low diversity of habitats including
sparse forest fragments and fencerows.
I sampled woodchucks across an urbanization gradient defined by the amount
of urban land cover within a 500-m buffer around the centroids of home ranges for
individuals (details to follow). Digital orthophotographs from 2008 (for 34
woodchucks) and from 2005 (1 woodchuck outside of Champaign County) were used
to manually classify land cover across the gradient (minimum resolution for both sets
was 0.5 m). I delineated 5 main land-cover categories: developed, urban open space,
urban forest, urban grassland, and rural (Table 4). To differentiate urban animals with
home ranges without any natural habitat from those with home ranges that included
natural habitat surrounded by developed land cover (urban grassland, urban forest), I
considered urban land cover to include the categories of “developed” and “urban open
space.” I ground-truthed photographs during field visits and updated our
45

classifications when necessary. The urban endpoint of the gradient was characterized
by high densities of buildings (average = 492.2 buildings/km2), population, traffic and
an average of 12.83 km of roads/km2 whereas the rural endpoint of the gradient
consisted of few homesteads (average = 8.92 buildings/km2), minimal traffic, and an
average of 1.10 km of roads/km2.
2.2. Radiotracking
Woodchucks were livetrapped from May-November 2007 using single-door
collapsible Tomahawk traps (Tomahawk Live Trap Co., Tomahawk, Wisconsin;
Model 207) following procedures approved by the University of Illinois’ Institutional
Animal Care and Use Committee, which met the guidelines approved by the
American Society of Mammalogists (Gannon et al. 2007). I placed traps near active
burrows and baited them with apples and peanut butter (Maher 2004; Swihart 1992).
Traps were set in the early morning, checked every 2 hours, and closed by mid
afternoon.
Each captured adult woodchuck (≥ 1 year old; age determined by weight and
pelage; Kwiecinski 1998) was transported to the College of Veterinary Medicine at
the University of Illinois where a 32-g radio-transmitter (Model #M1240, Advanced
Telemetry Systems, Isanti, Minnesota) was surgically implanted in the peritoneal
cavity, generally within 3 hours of capture. I followed standard surgical procedures
(Maher 2009; Van Vuren 1989) except medetomidine was used as the anesthetic
rather than a xylazine-ketamine mixture. While woodchucks were anesthetized, I
determined their sex and implanted passive-integrated transponders (PIT; Schooley et
46

al. 1993) in the interscapular region for long-term identification. I released
woodchucks at their burrows of capture after they had fully recovered. I tracked
woodchucks 2-4 times per week during 2 active seasons (2007 and 2008), and 3 times
per month during 2 hibernation seasons (2007-2008, 2008-2009). For each individual,
the active season began with the 1st location outside of the hibernaculum during
February-March and ended with the last location prior to settlement at the
hibernaculum in October-November. The average date of den immergence was 31
October in 2007 (SE = 4.96, n = 33) and 28 October in 2008 (SE = 4.20, n = 19). The
average date of den emergence was 10 March in 2007 (SE = 4.51, n = 30) and 11
March in 2008 (SE = 4.18, n = 18).
Radiolocations were obtained during the day by homing with a receiver and
handheld 3-element Yagi antenna. Most radiolocations (89%) were obtained when
woodchucks were in burrows because individuals spent much time underground, or
they often fled underground before they were observed. Each radiolocation was
recorded with a handheld Global Positioning System (GPS) unit.
2.3. Home-range size
For each individual, I estimated home-range size separately for each active
season with a 100% minimum convex polygon (MCP) model using Hawth’s Analysis
Tools for ArcGIS (Beyer 2004) in ArcGIS9 (Environmental Systems Research Inc.
2006). Bootstrapped area-observation curves with 1,000 replications (Animal
Movement Extension to ArcView; Hooge and Eichenlaub 1997) indicated that about
25 locations were required to accurately estimate home-range size using the MCP
47
method. Hence, I excluded individuals from analysis if the number of radiolocations
was <25.
Actual area used by an animal can be difficult to define for a multiple central–
place forager like a woodchuck. Behavioral observations revealed that woodchucks
rarely foraged >20m from a burrow, which suggests much of the area between
burrows is used primarily for inter-burrow movement. Kernel-based home range
estimators are generally favored over MCPs, but kernel methods do not work well if
many radiolocations occur at the same place (Pattishall and Cundall 2008; Row et al.
2006; Seaman and Powell 1996). For my dataset that included multiple locations at
particular burrows, kernel-based estimators substantially overestimated the amount of
area used around burrows. Hence I used 100% MCPs as a means to estimate total
spatial extent of a woodchuck’s range, and then I evaluated space-use within home
ranges in more detail by examining patterns of burrow use by this multiple central-
place forager.
2.4. Space use within home ranges
I measured several aspects of space use within home-range areas including the
number of burrow clusters used, average distance between burrow clusters, and
evenness of use among burrow clusters. I defined a single burrow cluster to include
all burrow entrances within 10 m of another entrance (Henderson and Gilbert 1978;
Swihart 1992). To describe evenness of burrow use by individuals across the gradient,
I used the Morisita Index (Morisita 1962; Veech 2005), defined as
IM = N × jj
jj
xxxxΣ−Σ
Σ−Σ2
2
)( (1)
48

where N = the number of burrow clusters used by an individual, and xj = the number
of radiolocations at a burrow cluster j for each cluster j = 1 to N. Values of IM > 1
indicate a clumped distribution, and values of IM < 1 indicate a regular distribution. I
also measured the average distance between burrow clusters using Hawth’s Analysis
Tools for ArcGIS.
2.5. Analysis of home ranges and space use
Responses by woodchucks to urbanization were examined at 2 scales. The
landscape scale was determined by the amount of urban land cover within a 500-m
buffer centered on the centroid of a MCP for each individual (using data combined
across years). The local scale was determined by the amount of urban land cover
within each individual’s combined-year MCP. I examined the response of home-
range area at the landscape scale, and the responses of all other space-use variables at
the local scale. Although urbanization measures for these 2 scales were correlated (r =
0.64, P < 0.001, n = 35), I thought that the landscape scale was more appropriate for
examining broader constraints to home-range size, whereas urban land cover at the
local scale would be more relevant to how a woodchuck used space within its
established home range.
Because many woodchucks were sampled in 2 years, I used repeated-
measures models and the maximum likelihood method (PROC MIXED - SAS
Institute Inc. 2009) to test for an effect of urbanization on home-range size and each
space-use variable at the appropriate scale. First, I determined the covariance
structure of the data by fitting my global model for each response variable under
49

different covariance structures using the restricted maximum likelihood method. I
identified the 1st-order autoregressive structure as the most appropriate for all
responses by using Akaike’s Information Criterion (AICc: corrected for small sample
size; Burnham and Anderson 2002). AIC allows for simultaneous comparison of
multiple models by ranking them based on goodness of fit and complexity. Models
with a ∆AIC value < 2 are considered competitive (Burnham and Anderson 2002).
Second, I evaluated 17 candidate models using maximum likelihood estimation and
AIC. The candidate models included combinations of urban land cover (urban), sex,
year, and number of locations as predictors plus interaction terms for urban x sex, and
urban x year. I also examined parameter estimates (β) to understand the relationship
between response variables and parameters included in competitive models.
2.6. Scaling of burrows and home-range size
To assess the scaling relationship between number of burrow clusters and
home-range size, I conducted linear regression after transforming both variables
(log10-transform) to estimate the scaling exponent (i.e., slope coefficient). I estimated
scaling exponents separately for woodchucks in 2007 and 2008.
2.7. Burrow use and connectivity
I was interested in whether frequency of use of burrow clusters could be
explained by spatial connectivity of burrow clusters to other clusters within a home
range for these multiple central-place foragers. For each individual, I calculated
connectivity for an individual burrow cluster as the inverse of the average distance
50

between the cluster and all other clusters. I then correlated connectivity of burrow
clusters with the number of active-season locations at clusters. Because I wanted to
make inferences across individuals, I adopted a meta-analysis framework. I
transformed Pearson correlation coefficients (r) for individuals using a Fisher z
transformation and then calculated an unweighted mean z separately for 2007 and
2008 (Hedges and Olkin 1985). I constructed a 95% confidence interval (CI) of the
mean of the distribution for each year (Hedges and Olkin 1985) defined as
CI = x ± 1.96 KN 3
1−
(2)
where N = the total number of pairs in the correlation (total number of burrow
clusters across individuals) and K = the total number of individuals. I then back-
transformed z to get a confidence interval for r.
3. Results
Home-range and space-use analyses were based on data from 35 adult
woodchucks (12 males, 23 females) distributed across the urbanization gradient (Fig.
6). The average number of locations per individual per active season was 50 (SE =
1.98).
3.1. Home-range size
AIC rankings revealed 3 competitive models that all included urbanization,
sex, and the interaction between urbanization and sex as factors affecting home-range
size of woodchucks (Table 5). Two models were tied for the best model: 1 included
51

urbanization, sex, and the urban x sex interaction, whereas the other also included the
locations covariate (Table 5). The model with locations had a lower log-likelihood,
indicating the number of radiolocations obtained for an individual had a positive
effect on home-range size (βlocations = 0.06, SE = 0.04). A 3rd model, which included
year instead of locations, was competitive as well (Table 5). Home-range size was
related negatively to urbanization for both males and females (Fig. 7), but the effect
was stronger for males (βurban = -28.26 for males, βurban = -3.88 for females). During
both years, home-range size was larger for males (2007: X = 13.29 ha, SE = 4.75, n =
8; 2008: X = 17.1 ha, SE = 5.08, n = 9) than for females (2007: 55.2=X ha, SE =
0.66, n = 19; 2008: 74.1=X ha, SE = 0.46, n = 16).
3.2. Number of burrow clusters
Woodchucks used an average of 10 burrow clusters (SE = 0.70), but number
of clusters ranged from 1 to 25 clusters. The best approximating model describing the
number of burrow clusters used by woodchucks included urbanization, sex, and
locations (Table 6). A model including year was competitive as well and had a lower
log-likelihood than the best model (Table 6). Number of burrow clusters was related
negatively to urbanization (βurban = -1.47, SE = 1.94). Males used an average of 12
clusters (SE = 1.35) in 2007 and 15 clusters (SE = 2.04) in 2008, whereas females
used an average of 9 clusters (SE = 1.00) in 2007 and 8 clusters (SE = 0.86) in 2008.
Number of burrow clusters was associated positively with number of locations
(βlocations = 0.118, SE = 0.04).
52

3.3. Scaling of burrows and home-range size
Number of burrow clusters was related positively to home-range size in 2007
(R2 = 0.74, P < 0.001, n = 27) and 2008 (R2 = 0.63, P < 0.001, n = 25). However, the
scaling exponent was not close to 1 in either year. The exponent was 0.26 (SE = 0.03)
in 2007 and 0.25 (SE = 0.03) in 2008. Individuals with larger home ranges had more
central places, but the relationship was not proportional.
3.4. Distance between burrow clusters
The average distance between burrow clusters ranged from 44 to 499 m with a
mean of 190 m (SE = 18.60). The best model predicting distance between burrow
clusters included urbanization and sex (Table 6). A model that also included the
urbanization x sex interaction was competitive and had a lower log-likelihood (Table
6). Average distance between burrow clusters responded negatively to urbanization,
but the effect was stronger for males than for females (βurban = -298.1 for males, βurban
= -141.4 for females). The mean for average distance between burrow clusters was
308 m for males (SE = 32.03) and 131 m for females (SE = 15.45).
3.5. Evenness of burrow use
Woodchuck locations generally were aggregated among burrows within their
home ranges (Fig. 8). The average Morisita index was 1.79 in 2007 (SE = 0.08) and
1.98 (SE = 0.08) in 2008. Variation in Morisita index was best explained by a model
that included urbanization (Table 6). Morisita index increased with urbanization
(βurban = 0.24, SE = 0.24). That is, the aggregation patterns were stronger for more-
53

urban individuals. The intercept-only model was competitive as well, but had the
highest log-likelihood of all of the competitive models (Table 6). Models including
year or locations in addition to urbanization also were competitive but had lower log-
likelihood values than the top model (Table 6) suggesting that these covariates had
secondary effects on estimates of aggregation.
3.6. Burrow use and connectivity
The average correlation coefficient relating intensity of burrow use to
connectivity was 0.18 for both 2007 (n = 27) and 2008 (n = 25). The 95% confidence
interval of the mean correlation coefficient was 0.04 < r < 0.32 in both years. There
was a moderate, positive relationship between spatial connectivity and intensity of
burrow use for these multiple-central place foragers (Fig. 8).
4. Discussion
Urbanization had substantial effects on space use of woodchucks within an
already human-dominated, agricultural landscape. Home-range size of woodchucks in
urban areas was approximately 10% of those in rural areas. This pattern is similar to
that described for mammalian carnivores such as skunks (Mephitis mephitis; Rosatte
et al. 1991), red foxes (Vulpes vulpes; Gosselink et al. 2003), raccoons (Procyon lotor;
Prange et al. 2004), bobcats (Lynx rufus; Riley 2006), and coyotes (Atwood et al.
2004). Home-range size for woodchucks not only decreased with urbanization, home
ranges appeared to be constrained in extremely urbanized areas (>80% urban land
cover; see Fig. 7).
54

Movements of woodchucks likely were impeded by the dense network of
high-traffic roads in urban areas. Roads act as movement barriers and increase
mortality for many wildlife species (Baker et al. 2007; Brody and Pelton 1989;
McGregor et al. 2008; Oxley et al. 1974; Rondinini and Doncaster 2002; Swihart and
Slade 1984). Woodchucks living adjacent to suburban and urban highway
interchanges readily crossed single-lane highway ramps, but attempts at crossing
wider roads were rare and often resulted in mortality (Woodward 1990). In my study,
home ranges of radio-marked urban woodchucks rarely included roads and those
included in home ranges generally had 2 lanes but low levels of traffic. My data on
survival rates indicate vehicle collisions are an important cause of mortality for
woodchucks in urban areas (Chapter 2). The concentration of anthropogenic
resources in urban areas also likely contributed to the decrease in home-range size by
reducing the need for woodchucks to travel extensively in search of food (see also
Prange et al. 2004).
The best model for predicting home-range size included urbanization, sex, and
an urban x sex interaction. The effect of sex on home-range size was not surprising as
home ranges of male woodchucks are known to be larger than those of females
(Maher 2004; Swihart 1992). Male woodchucks had larger home ranges than females
regardless of urbanization; however, urbanization had a much stronger effect on home
ranges of males. Few studies have examined the interaction between urbanization and
sex in relation to home-range size in mammals (but see Riley 2006). Sexual
differences in urbanization effects should be considered, in addition to species-level
responses, as they can have ramifications for key life-history requirements. For
55

example, adult male woodchucks extend their home ranges to find females during the
breeding season (Ferron and Ouellet 1989). Barriers to these movements in urban
areas could impede males from encountering females, which could reduce
reproduction.
My estimates of home-range size generally were larger than averages
previously reported for woodchucks, especially for males (1.6 ha – 4.0 ha for males;
0.6 ha – 1.6 ha for females; Maher 2004; Meier 1992; Swihart 1992). Home ranges at
the urban end of the gradient were closer in size to those reported by other studies
conducted in more natural landscapes (average size for home ranges of males with
>80% urban land cover = 4.0 ha). A possible explanation for the differences in home-
range size across studies is the fragmented nature of the landscape in central Illinois,
even outside of urban areas. Given the dominance of row-crop agriculture in this area,
preferred burrowing habitat such as woodland edges and fencerows (Swihart 1992) is
sparsely distributed. Moreover, males in agricultural areas may be required to have
larger home ranges to find mating opportunities because females are more dispersed
and probably at lower densities.
Although I did not study juvenile woodchucks, habitat fragmentation in urban
areas should have implications for this age class as well. Juvenile dispersal is
common for woodchucks although degree of philopatry, timing of dispersal, and
dispersal distances vary among populations (deVos and Gillespie 1960; Ferron and
Ouellet 1989; Kwiecinski 1998; Maher 2004, 2009; Swihart 1992). High-traffic roads
could reduce dispersal distances for juvenile woodchucks in urban areas and thus alter
gene flow and population genetic structure.
56

I also observed variation across the urban-rural gradient in how adult
woodchucks used space within home ranges, which is especially important for
multiple central-place foragers. As home-range size increased in rural areas,
woodchucks used more burrow clusters, but this relationship was not scaled
proportionally. Hence, rural woodchucks did not compensate adequately and
distances between burrow clusters increased in rural areas. Risk in rural areas should
be relatively high due to a greater abundance of coyotes, and predation was the main
cause of mortality for our radio-marked woodchucks in rural areas. My results
indicate that risk is further elevated for rural woodchucks because they must travel
longer distances to get from one burrow cluster to another. In contrast, urban
woodchucks have fewer natural predators and shorter inter-burrow distances.
Although woodchucks generally favored certain burrows over others across
the urbanization gradient, aggregation of burrow use increased with urbanization. The
presence of concentrated, abundant food sources in urban areas likely contributed to
aggregated spatial distributions of woodchucks. I did not measure resource abundance
or distribution across the gradient, but food sources should be more concentrated in
urban areas due to anthropogenic resources such as managed lawns and vegetation
(Ditchkoff et al. 2006; McKinney 2002; Prange et al. 2004). Burrow use also could be
more aggregated in urban areas if burrows within the home range are separated by
anthropogenic barriers such as parking lots and small roads that impede movement.
Burrows may be visited less frequently if woodchucks are reluctant to cross these
semi-permeable barriers.
57

Within home ranges, frequency of use of a particular burrow was positively
related to spatial connectivity of the burrow. Burrows that were centrally located and
well connected may have been favored because they acted as stepping stones to other
burrows and associated foraging areas and thus reduced predation risk during
movements. Previous research demonstrates that locations of burrow clusters of
woodchucks can be aggregated in space due to environmental characteristics such as
soil type, drainage, slope, or vegetation (Henderson and Gilbert 1978; Merriam 1971;
Swihart 1992). My study demonstrates that aggregation of use across burrows is
related to simple connectivity of burrows independent of surrounding environmental
traits. This result could generalize to other multiple central-place foragers that use
burrows for refuge.
Woodchucks exhibited substantial behavioral plasticity by adjusting their
movements in response to both physical and ecological changes in the landscape
created by urbanization. My research provides novel insights into responses by an
herbivorous mammal to urbanization and to factors affecting space use by multiple
central-place foragers.
58

Chapter 2 meets the formatting requirements for the Journal of Mammalogy.
5. References
ATWOOD, T. C., H. P. WEEKS, AND T. M. GEHRING. 2004. Spatial ecology of coyotes
along a suburban-to-rural gradient. Journal of Wildlife Management 68:1000-1009.
BAKER, P. J., C. V. DOWDING, S. E. MOLONY, P. C. L. WHITE, AND S. HARRIS. 2007.
Activity patterns of urban red foxes (Vulpes vulpes) reduce the risk of traffic-
induced mortality. Behavioral Ecology 18:716-724.
BEYER, H. L. 2004. Hawth's analysis tools for ArcGIS. Available at
http://www.spatialecology.com/htools.
BONENFANT, M., AND D. L. KRAMER. 1996. The influence of distance to burrow on
flight initiation distance in the woodchuck, Marmota monax. Behavioral Ecology
7:299-303.
BRODY, A. J., AND M. R. PELTON. 1989. Effects of roads on black bear movements in
western North Carolina. Wildlife Society Bulletin 17:5-10.
BURNHAM, K. P. AND D. R. ANDERSON. 2002. Model selection and multimodel
inference: a practical information-theoretic approach. 2nd ed. Springer, New York.
DESTEFANO, S., AND R.M. DEGRAAF. 2003. Exploring the ecology of suburban
wildlife. Frontiers in Ecology and the Environment 1:95-101.
DEVOS, A., AND D. I. GILLESPIE. 1960. A study of woodchucks on an Ontario farm.
The Canadian Field-Naturalist 74:130-144.
DITCHKOFF, S. S., S. T. SAALFELD, AND C. J. GIBSON. 2006. Animal behavior in urban
ecosystems: modifications due to human-induced stress. Urban Ecosystems 9:5-12.
59

ENVIRONMENTAL SYSTEMS RESEARCH INC. 2006. ArcGIS 9.2. Environmental
Systems Research, Inc. Redlands, California.
ERLINGE, S. 1974. Distribution, territoriality and numbers of the weasel Mustela
nivalis in relation to prey abundance. Oikos 25:308-314.
FERRON, J., AND J. P. OUELLET. 1989. Temporal and intersexual variations in the use
of space with regard to social organization in the woodchuck (Marmota monax).
Canadian Journal of Zoology 67:1642-1649.
FORMAN, R. T. T., ET AL. 2003. Road ecology: science and solutions. Island Press,
Washington, D.C.
GANNON, W. L., R. S. SIKES, AND THE ANIMAL CARE AND USE COMMITTEE OF THE
AMERICAN SOCIETY OF MAMMALOGISTS. 2007. Guidelines of the American
Society of Mammalogists for the use of wild mammals in research. Journal of
Mammalogy 88:809-823.
GERING, J. C., AND R. B. BLAIR. 1999. Predation on artificial bird nests along an urban
gradient: predation risk or relaxation in urban environments. Ecography 22:532-541.
GOSSELINK, T. E., T. R. VAN DEELEN, R. E. WARNER, AND M. G. JOSELYN. 2003.
Temporal habitat partitioning and spatial use of coyotes and red foxes in east-
central Illinois. Journal of Wildlife Management 67:90-103.
HEDGES, L. V., AND I. OLKIN. 1985. Statistical methods for meta-analysis. Academic
Press, San Diego, California.
HEIMLICH, R. E., AND W. D. ANDERSON. 2001. Development at the urban fringe and
beyond, impacts on agriculture and rural land. Agricultural economic report no. 803,
United States Department of Agriculture, Washington, D.C.
60
HENDERSON, J. A., AND F. F. GILBERT. 1978. Distribution and density of woodchuck
burrow systems in relation to land-use practices. Canadian Field-Naturalist 92:128-
136.
HOFMANN, J. E. 2008. Field manual of Illinois mammals. Illinois Natural History
Survey manual 12. Illinois Natural History Survey, Champaign, Illinois.
HOFFMEISTER, D. F. 2002. Mammals of Illinois. University of Illinois Press, Urbana,
Illinois.
HOOGE, P. N., AND B. EICHENLAUB. 1997. Animal movement extension to ArcView,
version 1.1. Alaska Science Center - Biological Science Office, United States
Geological Survey, Anchorage, Alaska.
ISBELL, L. A., J. D. PRUETZ, AND T. P. YOUNG. 1998. Movements of vervets
(Cercopithecus aethiops) and patas monkeys (Erythrocebus patas) as estimators of
food resource size, density, and distribution. Behavioral Ecology and Sociobiology
42:123-133.
JEPSEN, J. U., N. E. EIDE, P. PRESTRUD, AND L. B. JACOBSEN. 2002. The importance of
prey distribution in habitat use by arctic foxes (Alopex lagopus). Canadian Journal
of Zoology 80:418.
KRAMER-SCHADT, S., E. REVILLA, T. WIEGAND, AND U. BREITENMOSER. 2004.
Fragmented landscapes, road mortality and patch connectivity: modelling
influences on the dispersal of Eurasian lynx. Journal of Applied Ecology 41:711-
723.
KWIECINSKI, G. G. 1998. Marmota monax. Mammalian Species 591:1-8.
61

MAHER, C. R. 2004. Intrasexual territoriality in woodchucks (Marmota monax).
Journal of Mammalogy 85:1087-1094.
MAHER, C. R. 2006. Social organization in woodchucks (Marmota monax) and its
relationship to growing season. Ethology 112:313-324.
MAHER, C. R. 2009. Genetic relatedness and space use in a behaviorally flexible
species of marmot, the woodchuck (Marmota monax). Behavioral Ecology and
Sociobiology 63:857-868.
MANKIN, P. C., AND R. E. WARNER. 1997. Mammals of Illinois and the Midwest:
ecological and conservation issues for human-dominated landscapes. Pp. 135-153 in
Conservation in highly fragmented landscapes (M. W. Schwartz, ed.). Chapman &
Hall, New York.
MCGREGOR, R. L., D. J. BENDER, AND L. FAHRIG. 2008. Do small mammals avoid
roads because of the traffic? Journal of Applied Ecology 45:117-123.
MCKINNEY, M. L. 2002. Urbanization, biodiversity, and conservation. BioScience
52:885-890.
MEIER, P. T. 1992. Social organization of woodchucks (Marmota monax). Behavioral
Ecology and Sociobiology 31:393-400.
MERRIAM, H. G. 1971. Woodchuck burrow distribution and related movement
patterns. Journal of Mammalogy 52:732-746.
MORISITA, M. 1962. Iσ-index, a measure of dispersion of individuals. Population
Ecology 4:1-7.
OXLEY, D. J., M. B. FENTON, AND G. R. CARMODY. 1974. The effects of roads on
populations of small mammals. Journal of Applied Ecology 11:51-59.
62
PATTISHALL, A., AND D. CUNDALL. 2008. Spatial biology of Northern watersnakes
(Nerodia sipedon) living along an urban stream. Copeia 2008:752-762.
PRANGE, S., S. D. GEHRT, AND E. P. WIGGERS. 2003. Demographic factors
contributing to high raccoon densities in urban landscapes. Journal of Wildlife
Management 67:324-333.
PRANGE, S., S. D. GEHRT, AND E. P. WIGGERS. 2004. Influences of anthropogenic
resources on raccoon (Procyon lotor) movements and spatial distribution. Journal of
Mammalogy 85:483-490.
RANDA, L. A., AND J. A. YUNGER. 2006. Carnivore occurrence along an urban-rural
gradient: a landscape-level analysis. Journal of Mammalogy 87:1154-1164.
RILEY, S. P. D. 2006. Spatial ecology of bobcats and grey foxes in urban and rural
zones of a national park. Journal of Wildlife Management 70:1425-1435.
RILEY, S. P. D., ET AL. 2003. Effects of urbanization and habitat fragmentation on
bobcats and coyotes in Southern California. Conservation Biology 17:566-576.
RONDININI, C., AND C. P. DONCASTER. 2002. Roads as barriers to movement for
hedgehogs. Functional Ecology 16:504-509.
ROSATTE, R. C., M. J. POWER, AND C. D. MACINNES. 1991. Ecology of urban skunks,
raccoons, and foxes in metropolitan Toronto. Pp. 31-38 in Wildlife conservation in
metropolitan habitats (L. W. Adams and D. L. Leedy, eds.). National Institute for
Urban Wildlife Symposium Series 2, Columbia, Maryland.
ROW, J. R., G. BLOUIN-DEMERS, AND S. F. FOX. 2006. Kernels are not accurate
estimators of home-range size for herpetofauna. Copeia 2006:797-802.
63

SAS INSTITUTE INC. 2009. SAS for Windows, Version 9.2. SAS Institute Inc., Cary,
North Carolina.
SCHOOLEY, R. L., B. VAN HORNE, AND K. P. BURNHAM. 1993. Passive integrated
transponders for marking free-ranging Townsend's ground squirrels. Journal of
Mammalogy 74:480-484.
SEAMAN, D. E., AND R. A. POWELL. 1996. An evaluation of the accuracy of kernel
density estimators for home range analysis. Ecology 77:2075-2085.
SHOCHAT, E., P. S. WARREN, S. H. FAETH, N. E. MCINTYRE, AND D. HOPE. 2006. From
patterns to emerging processes in mechanistic urban ecology. Trends in Ecology &
Evolution 21:186-191.
SWIHART, R. K. 1992. Home-range attributes and spatial structure of woodchuck
populations. Journal of Mammalogy 73:604-618.
SWIHART, R. K., AND N. A. SLADE. 1984. Road crossing in Sigmodon hispidus and
Microtus ochrogaster. Journal of Mammalogy 65:357-360.
TIGAS, L. A., D. H. VAN VUREN, AND R. M. SAUVAJOT. 2002. Behavioral responses of
bobcats and coyotes to habitat fragmentation and corridors in an urban environment.
Biological Conservation 108:299-306.
UNITED STATES CENSUS BUREAU. 2001. Statistical abstract of the United States: 2001.
United States Bureau of the Census, Washington, D.C.
UNITED STATES CENSUS BUREAU. 2009. State and metropolitan areas data book.
Table B-1: metropolitan areas-area and population. United States Bureau of the
Census, Washington, D.C.
64

VAN VUREN, D. 1989. Effects of intraperitoneal transmitter implants on yellow-
bellied marmots. Journal of Wildlife Management 53:320-323.
VEECH, J. A. 2005. Analyzing patterns of species diversity as departures from random
expectations. Oikos 108:149-155.
WARNER, R. E. 1994. Agricultural land use and grassland habitat in Illinois: future
shock for midwestern birds? Conservation Biology 8:147-156.
WOODWARD, S. M. 1990. Population density and home range characteristics of
woodchucks, Marmota monax, at expressway interchanges. Canadian Field-
Naturalist 104:421-428.
65

6. Tables and Figures Table 4 Definitions of land-cover categories used to digitize urban land cover from digital orthophotographs. Land-cover category Definition
Developed Paved surfaces, buildings, and associated lawns and gardens
Urban open space Maintained open areas (e.g., cemeteries, parks, golf courses)
Urban forest Forest surrounded by developed land cover
Urban grassland Unmaintained grass surrounded by developed land cover
66

Table 5 Ranking of repeated-measures mixed linear models evaluating factors affecting home-range size of woodchucks (Marmota monax) in Champaign-Urbana, Illinois, in 2007 and 2008. Main effects included urbanization, sex, number of locations, and year. K = no. of explanatory variables + 2, ΔAICc = AICc of model – minimum AICc, and ωi = Akaike weight. Models with ΔAICc ≤ 3 are presented. Model K Log-likelihood ΔAICc ωi
Urban, sex, urban*sex 5 -152.95 0 0.318
Urban, sex, urban*sex, locations 6 -151.60 0 0.318
Urban, sex, urban*sex, year 6 -152.00 0.7 0.224
Urban, sex, urban*sex, locations, year 7 -151.35 2.3 0.101
67
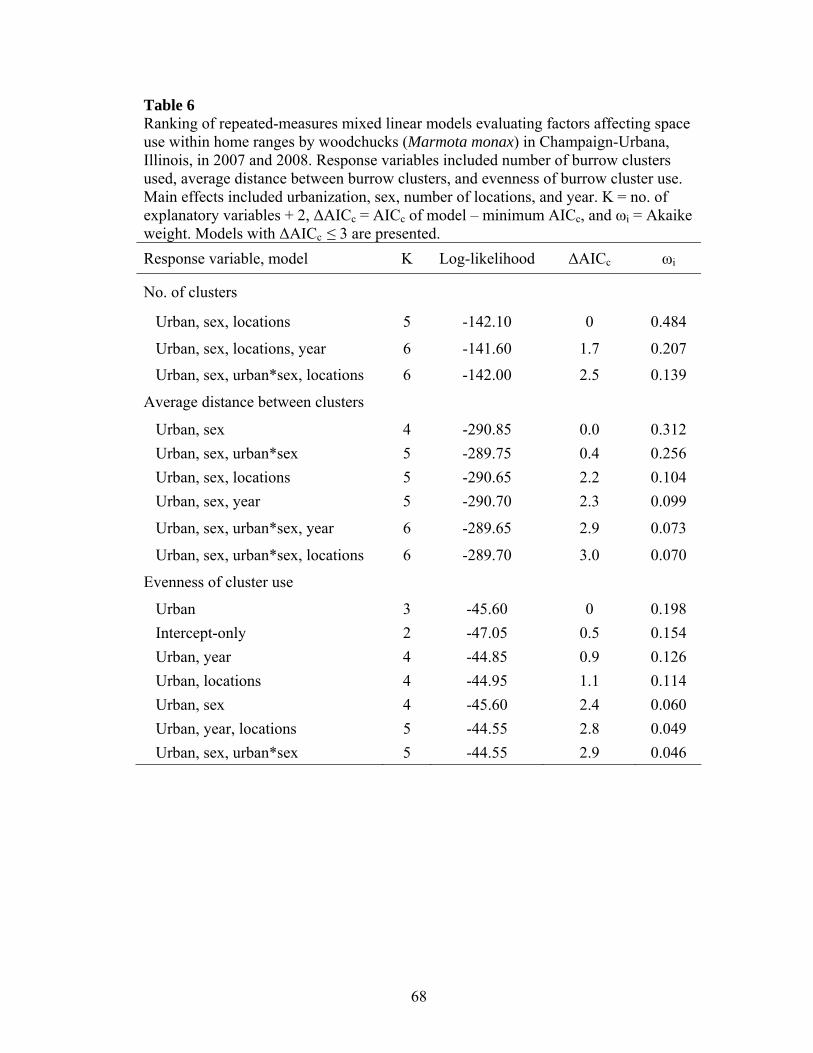
Table 6 Ranking of repeated-measures mixed linear models evaluating factors affecting space use within home ranges by woodchucks (Marmota monax) in Champaign-Urbana, Illinois, in 2007 and 2008. Response variables included number of burrow clusters used, average distance between burrow clusters, and evenness of burrow cluster use. Main effects included urbanization, sex, number of locations, and year. K = no. of explanatory variables + 2, ΔAICc = AICc of model – minimum AICc, and ωi = Akaike weight. Models with ΔAICc ≤ 3 are presented. Response variable, model K Log-likelihood ΔAICc ωi
No. of clusters
Urban, sex, locations 5 -142.10 0 0.484
Urban, sex, locations, year 6 -141.60 1.7 0.207
Urban, sex, urban*sex, locations 6 -142.00 2.5 0.139
Average distance between clusters
Urban, sex 4 -290.85 0.0 0.312 Urban, sex, urban*sex 5 -289.75 0.4 0.256 Urban, sex, locations 5 -290.65 2.2 0.104 Urban, sex, year 5 -290.70 2.3 0.099
Urban, sex, urban*sex, year 6 -289.65 2.9 0.073
Urban, sex, urban*sex, locations 6 -289.70 3.0 0.070
Evenness of cluster use
Urban 3 -45.60 0 0.198 Intercept-only 2 -47.05 0.5 0.154 Urban, year 4 -44.85 0.9 0.126 Urban, locations 4 -44.95 1.1 0.114 Urban, sex 4 -45.60 2.4 0.060 Urban, year, locations 5 -44.55 2.8 0.049 Urban, sex, urban*sex 5 -44.55 2.9 0.046
68
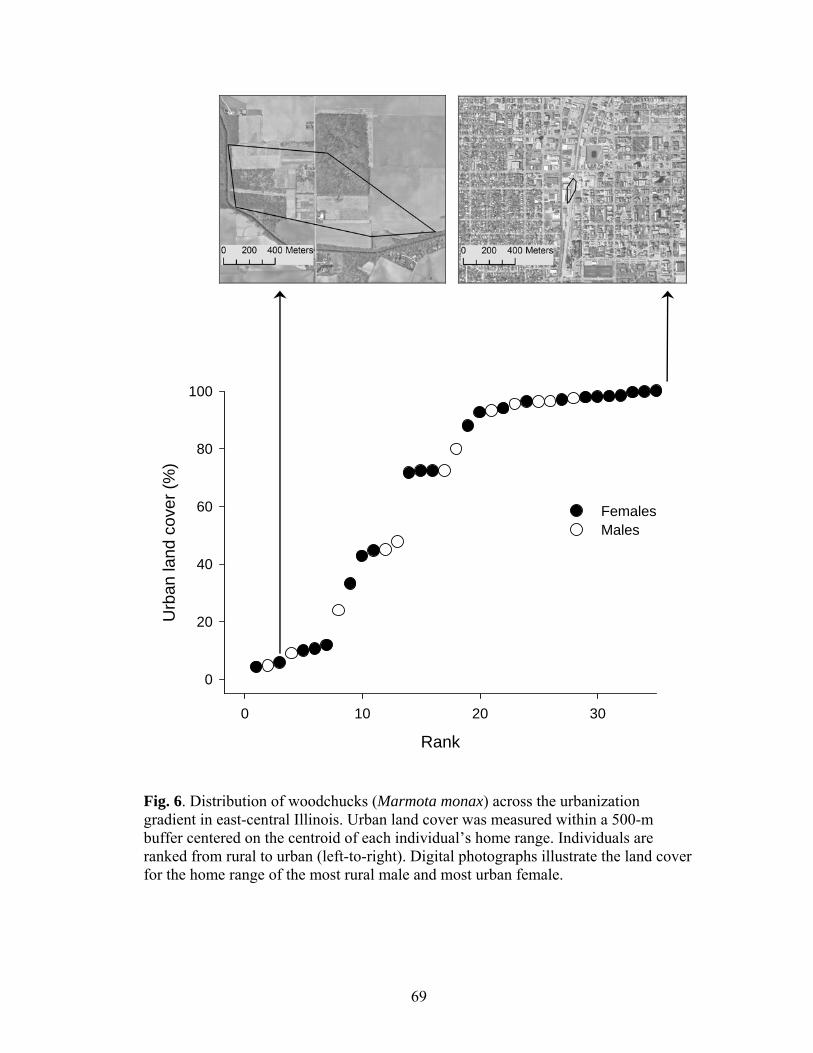
Rank
0 10 20 30
Urb
an la
nd c
over
(%)
0
20
40
60
80
100
FemalesMales
Fig. 6. Distribution of woodchucks (Marmota monax) across the urbanization gradient in east-central Illinois. Urban land cover was measured within a 500-m buffer centered on the centroid of each individual’s home range. Individuals are ranked from rural to urban (left-to-right). Digital photographs illustrate the land cover for the home range of the most rural male and most urban female.
69

0 20 40 60 80 100
0
10
20
30
40
50
60
20072008
A
Urban land cover (%)
0 20 40 60 80 100
0
2
4
6
8
10
12
20072008
B
Hom
e-ra
nge
area
(ha)
Fig. 7. Relationship between home-range area and urbanization for male (A) and female (B) woodchucks (Marmota monax) in 2007 and 2008. Note different scales on Y-axes for the 2 sexes.
70

Fig. 8. Home range in 2008 of an urban, female woodchuck (Marmota monax) estimated using the minimum convex polygon method. Symbols represent burrow clusters. Symbol size indicates the number of locations at each burrow cluster during the active season based on radio-tracking data. The 2 most favored burrow clusters are the most connected to other clusters.
71

CHAPTER 3:
SUMMARY
Urbanization created spatial variation in real risk for woodchucks. Survival
rates were related positively to urbanization and were higher during the inactive
season. Moreover, the effects of urbanization on survival were greatest during the
inactive season relative to the active season. For urban woodchucks, the main causes
of mortality were collisions with vehicles and unknown reasons, whereas for rural
woodchucks, the main mortality causes were predation and costs associated with
hibernation. Anti-predator behavior did not vary with urbanization and woodchucks
were not strongly habituated to people. Home-range size and space-use patterns
varied substantially across the urbanization gradient. Urban woodchucks had smaller
home ranges and used fewer burrows that were spaced closer together than did rural
woodchucks. Aggregation of use among burrows increased with urbanization.
Because predators are reduced and food resources are abundant, urban areas
may act as refuges for woodchucks, especially within an agricultural landscape where
there is little remaining natural habitat. My results demonstrate that urbanization also
can increase alternative real and perceived risks such as vehicles and human
disturbance that could have numerous consequences for population dynamics and
fitness. For example, woodchucks are polygynous, and males increase movements
during the early spring to secure females for breeding (Ferron and Ouellet 1989).
Movements of urban woodchucks were severely restricted by high-traffic roads that
could impede males from finding mates during the breeding season, thus decreasing
72

the reproductive rate or genetic diversity by forcing males to breed with nearby,
closely related females.
One of the main constraints to living in urban areas could be the negative
effects of the altered landscape on juveniles. Juvenile dispersal is common in
woodchucks, although timing, distance, and degree of philopatry can vary between
populations (deVos and Gillespie 1960; Ferron and Ouellet 1989; Swihart 1992;
Maher 2009). Dispersal distances of juveniles in urban areas may be severely
restricted which could reduce gene flow and alter population genetic structure. A
major cause of mortality for adult woodchucks in urban areas was collisions with
vehicles, and juveniles may be even more vulnerable to vehicle mortality due to their
size and inexperience. Juveniles that attempt to cross high-traffic roads during
dispersal may suffer high mortality rates resulting in reduced recruitment.
My results for anti-predator behavior indicated that woodchucks were not
strongly habituated to humans, and perceived risk is still high for urban woodchucks
despite the reduction of natural predators. Disturbance from humans, including traffic
noise and pedestrians, could increase stress levels for urban woodchucks. Deleterious
effects of prolonged stress include impaired reproduction, immune, and brain function
(Sapolsky et al. 2000), and could affect fitness for woodchucks in urban areas.
My research gives valuable insight into responses to urbanization, and
constraints to those responses by an urban-adapter species. Urbanization may buffer
woodchucks from certain mortality risks present in rural areas, but my results suggest
life in urban areas may not be dramatically better as there also may be serious
consequences to living in this landscape. Further examination should be given to
73

juvenile dispersal and survival, stress levels, and reproductive success of woodchucks
across an urbanization gradient, as urbanization could be consequential for these
fitness-dependent factors.
74

Chapter 3 meets the formatting requirements for the Journal of Mammalogy.
1. References
DEVOS, A., AND D. I. GILLESPIE. 1960. A study of woodchucks on an Ontario farm.
The Canadian Field-Naturalist 74:130-144.
FERRON, J., AND J. P. OUELLET. 1989. Temporal and intersexual variations in the use
of space with regard to social organization in the woodchuck (Marmota monax).
Canadian Journal of Zoology 67:1642-1649.
MAHER, C. R. 2009. Genetic relatedness and space use in a behaviorally flexible
species of marmot, the woodchuck (Marmota monax). Behavioral Ecology and
Sociobiology 63:857-868.
SAPOLSKY, R. M., L. M. ROMERO, AND A. U. MUNCK. 2000. How do glucocorticoids
influence stress responses? Integrating permissive, suppressive, stimulatory, and
preparative actions. Endocrine Reviews 21:55-89.
SWIHART, R. K. 1992. Home-range attributes and spatial structure of woodchuck
populations. Journal of Mammalogy 73:604-618.
75
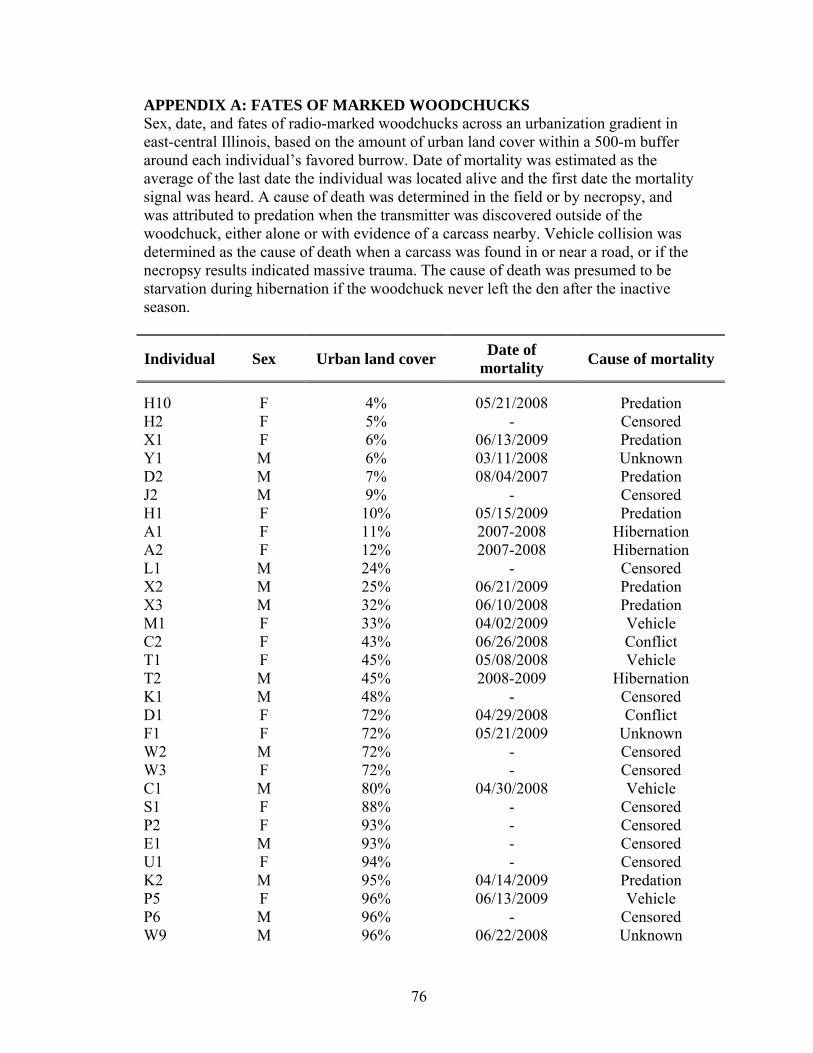
APPENDIX A: FATES OF MARKED WOODCHUCKS Sex, date, and fates of radio-marked woodchucks across an urbanization gradient in east-central Illinois, based on the amount of urban land cover within a 500-m buffer around each individual’s favored burrow. Date of mortality was estimated as the average of the last date the individual was located alive and the first date the mortality signal was heard. A cause of death was determined in the field or by necropsy, and was attributed to predation when the transmitter was discovered outside of the woodchuck, either alone or with evidence of a carcass nearby. Vehicle collision was determined as the cause of death when a carcass was found in or near a road, or if the necropsy results indicated massive trauma. The cause of death was presumed to be starvation during hibernation if the woodchuck never left the den after the inactive season.
Individual Sex Urban land cover Date of mortality Cause of mortality
H10 F 4% 05/21/2008 Predation H2 F 5% - Censored X1 F 6% 06/13/2009 Predation Y1 M 6% 03/11/2008 Unknown D2 M 7% 08/04/2007 Predation J2 M 9% - Censored H1 F 10% 05/15/2009 Predation A1 F 11% 2007-2008 Hibernation A2 F 12% 2007-2008 Hibernation L1 M 24% - Censored X2 M 25% 06/21/2009 Predation X3 M 32% 06/10/2008 Predation M1 F 33% 04/02/2009 Vehicle C2 F 43% 06/26/2008 Conflict T1 F 45% 05/08/2008 Vehicle T2 M 45% 2008-2009 Hibernation K1 M 48% - Censored D1 F 72% 04/29/2008 Conflict F1 F 72% 05/21/2009 Unknown W2 M 72% - Censored W3 F 72% - Censored C1 M 80% 04/30/2008 Vehicle S1 F 88% - Censored P2 F 93% - Censored E1 M 93% - Censored U1 F 94% - Censored K2 M 95% 04/14/2009 Predation P5 F 96% 06/13/2009 Vehicle P6 M 96% - Censored W9 M 96% 06/22/2008 Unknown
76

Appendix A (cont.)
Individual Sex Urban land cover Date of mortality Cause of mortality
S3 F 97% - Censored J3 M 97% 06/22/2008 Unknown V1 F 98% - Censored A4 F 98% 07/30/2008 Unknown V2 F 98% - Censored J4 F 98% 06/11/2008 Unknown J5 M 99% 04/07/2008 Vehicle F5 F 100% - Censored J1 F 100% 08/21/2008 Unknown O1 F 100% 05/31/2009 Unknown R1 F 100% 08/26/2007 Unknown
77