effects of surface coal mining and reclamation on ground ... · face mining control and reclamation...
TRANSCRIPT

EFFECTS OF SURFACE COAL MINING AND RECLAMATION
ON GROUND WATER IN SMALL WATERSHEDS IN THE
ALLEGHENY PLATEAU, OHIO
By Michael Eberle and Allan C. Razem
U.S. GEOLOGICAL SURVEY
Water-Resources Investigations Report 85-4205
Columbus, Ohio
1985

UNITED STATES DEPARTMENT OF THE INTERIOR
DONALD PAUL HODEL, Secretary
GEOLOGICAL SURVEY
Dallas L. Peck, Director
For additional information write to:
District Chief Water Resources Division U.S. Geological Survey 975 West Third Avenue Columbus, Ohio 43212
Copies of this report can be purchased from:
Open-File Services Section Western Distribution Branch U.S. Geological Survey Box 25425, Federal Center Denver, Colorado 80225 (Telephone: (303) 236-7476)

CONTENTS
Abstract - Introduction -
Background Purpose and scope - Hydrogeologic setting of Ohio's coal region- Data coll ection
Ground-water conditions at the study watersheds- Conditions before mining and reclamation
Physical characteristics and hydrology- Ground-water quality
Conditions after mining and reclamation -Physical characteristics and hydrology-Ground-water quality -
Significance of results -Selected references -Glossary
Page
11133566668888
- 12- 13
Figure 1-2
3
4
5.
6.
ILLUSTRATIONS
Maps showing locations of:1. The Eastern Coal Province and the
unglaciated Allegheny Plateau -2. Study watersheds and Ohio's coal
region Generalized stratigraphic column of sedi
mentary rocks between coal beds Conceptual diagram of the ground-water flow
system typically found in Ohio's coal region
Hydrogeologic section showing changes re sulting from surface mining at watershed Jll -
Graphs showing median values for .selected physical properties and chemical constit uents before mining and after reclama tion of the study watersheds -
2
4
6
7
9
11
TABLES
Tables 1. Summary of selected physical characteristics and historical data for watersheds M09 f C06, and Jll
2. Comparison of water quality before and after mining and reclamation at watersheds M09, COG, and Jll
5
10
Hi

CONVERSION FACTORS
For the convenience of readers who prefer to use metric (International System) units, conversion factors for inch-pound units used in this report are listed below:
Multiply Inch-Pound units By To Obtain Metric Units
foot (ft) 0.3048 meter (m) acre 0.4047 square hectometer
(hm 2 )
To convert hardness from milligrams per liter to grains per gallon, multiply by 0.05841.
ABBREVIATIONS
mg/L milligram per liter jug/L microgram per liter juS/cm microsiemen per centimeter
(at 25° C)
iv

EFFECTS OF SURFACE COAL MINING AND RECLAMATION ON GROUND WATER IN SMALL WATERSHEDS IN THE ALLEGHENY PLATEAU, OHIO
By Michael Eberle and Allan C Razem
ABSTRACT
The hydrologic effects of surface coal mining in unmined areas is difficult to predict, partly because of a lack of ade quate data collected before and after min ing and reclamation. In order to help provide data to assess the effects of sur face mining on the hydrology of small ba sins in the coal fields of the eastern United States, the U.S. Bureau of Mines sponsored a comprehensive hydrologic study at three sites in the Ohio part of the Eastern Coal Province. These sites are within the unglaciated part of the Alle gheny Plateau, and are representative of similar coal-producing areas in Kentucky, West Virginia, and Pennsylvania. The U.S. Geological Survey was responsible for the ground-water phase of the study.
The aquifer system at each watershed consisted of two localized perched aquifers (top and middle) above a deeper, more re gional aquifer. The premining top aquifer was destroyed by mining in each case, and was replaced by spoils during reclamation.
The spoils formed new top aquifers that were slowly becoming resaturated at the end of the study period. Water levels
in the middle aquifers were about the same after reclamation as before mining, al though levels rose in a few places. It ap pears that the underclay at the base of the new top aquifers at all three sites pre vents significant downward leakage from the top aquifer to lower aquifers except in places where the layer may have been dam aged during mining.
Water in the new top aquifers is a calcium sulfate type, whereas calcium bi carbonate type water predominated before mining. The median specific conductance of water in the new top aquifers was about 5 times greater than that of the original top aquifers in two of the watersheds, and 1 1/2 times the level of the original top aquifer in the third. Concentrations of dissolved sulfate, iron, and manganese in the top aquifers before mining generally did not exceed U.S. and Ohio Environmental Protection Agency drinking-water limits, but generally exceeded these limits after reclamation. Water-quality changes in the middle aquifers were minor by comparison. Water levels and water quality in the deeper, regional aquifers were unaffected by mining.
INTRODUCTION
Background
The Eastern Coal Province of the United States (fig. 1) has been one of the world's leading coal-producing areas in recent years. In 1981, the amount of coal produced in Ohio, Kentucky, Pennsylvania, an.d West Virginia alone was 47 percent of the total production in the United States and more than 9 percent of the total world production (U.S. Bureau of the Census, 1984). Much of the coal in the Eastern Coal Province is surface mined.
The effects of surface mining on ground water have been a matter of concern ever since surface mining became widespread around the middle of the twentieth century. Ground-water quality is of major concern because it is a primary determinant of the water quality of base flow in streams, and because many rural residents in the eastern
coal province depend on ground water for their domestic water supplies. Moreover, the hydrologic effects of surface mining are of particular concern to mine operators and regulatory officials because the Sur face Mining Control and Reclamation Act of 1977 (Public Law 95-87) requires that every application for a surf.ace-mining permit contain a determination of the "probable hydrologic consequences" of the mining operation both on and off the mine site.
Unfortunately, the relations between surface mining and the impacts on ground water are not understood well enough to be adequately predicted in many cases. An example of this is the lack of data docu menting ground-water quality before and after surface mining and reclamation at specific sites.

'^MARYLAND
NORTH CAROMNA
SOUTH CAROLINA
\ Base from' U.S.GeologJcal Survey
EXPLANATION
I___[Eastern Coal Province
Approximate boundary of the unglaciated Allegheny Plateau (Fenneman. 1938)
0 100 MILES
0 100 KILOMETERS
Figure 1. Location of Eastern Coal Province and the unglaciated Allegheny Plateau.

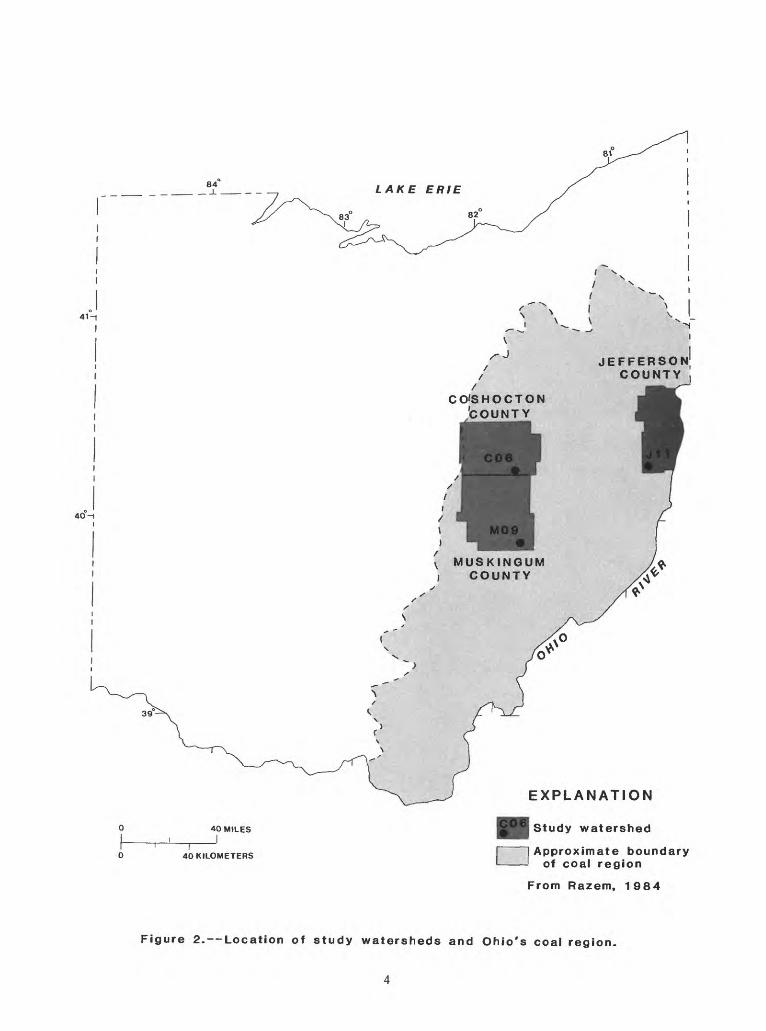
In order to obtain data necessary for understanding relations between surface mining and the effects on hydrologic sys tems, the U.S. Bureau of Mines sponsored a comprehensive study to assess the effects of surface mining and reclamation on the hydrology of small watersheds (30-50 acres) in Muskingum, Coshocton, and Jefferson Counties in Ohio (fig. 2). The geology of the study watersheds (referred to as water sheds M09, C06, and Jll, respectively) is similar to that in the coal-producing areas in much of eastern Ohio, eastern Kentucky, West Virginia, and western Pennsylvania (Brant and DeLong, 1960, p. 21). This re gion is in the unglaciated Allegheny Pla teau section of the Appalachian Plateaus physiographic province (Fenneman, 1938; fig. 1).
Four agencies the U.S. Department of Agriculture, Agricultural Research Service; The Ohio State University, Ohio Agricultur al Research and Development Center; the U.S. Soil Conservation Service; and the U.S. Geological Survey were responsible for the design of the study and for the collection and analysis of data. Topics of study included erosion and sedimentation, surface-water quantity and quality, ground- water quantity and quality, and the econom ics of mining and reclamation. The U.S. Geological Survey was responsible for the ground-water phase of the study.
Purpose and-Scope
The purpose of this report is to pro vide an overview of the effects of surface coal mining and reclamation on ground-water systems of small watersheds in order to il lustrate some typical hydrologic systems in the Eastern Coal Province. The report pre sents background information on geology in Ohio's coal region, and summarizes data on ground-water quantity and quality at three watersheds before and after mining and reclamation.
The three study watersheds were under lain by three major coal seams, one of which was exposed within each watershed. In watersheds C06 and Jll, the coal beds to be mined were associated with sandstone and
Further information on the surface-water, sedimentation, revegetation, and economics phases of the study may be obtained from:
USDA - Agricultural Research Service North Appalachian Experimental Watershed P.O. Box 78 Coshocton, Ohio 43812
or:
Bureau of MinesU.S. Department of the InteriorWashington, D.C. 20241
shale strata. The coal beds in watershed M09 were in limestone and shale strata. The watersheds were mined beginning with C06 in November 1976. Reclamation was com pleted at M09, C06, and Jll in that order (table 1).
This summary, which is not solely for a technical audience, is based primarily on reports by Razem (1983, 1984) and on data from the U.S. Department of Agricul ture, Agricultural Research Service. De tailed information on these watersheds can be found in these and other works listed in tne selected references. The information presented in this report should be useful to .coal-mine operators, government offi cials, residents of the Eastern Coal Prov ince, and others who are interested in issues related to coal production, land reclamation, and ground water.
Hydrogeologic Setting of Ohio's Coal Region
Coal-bearing strata of eastern Ohio (fig. 2) consist of sedimentary rocks that range in age from the Mississippian Period (360-330 million years ago) to the Permian Period (290-240 million years ago). Most of the rocks cropping out in the study area, however, were deposited during the Pennsylvanian Period (330-290 million years ago).
The Pennsylvanian rocks of Ohio con sist of cyclical sequences of shale, sand stone, thin limestone', coal, and clay (fig. 3). Water-bearing characteristics differ considerably among these strata, owing pri marily to differences in tne size and num ber of pores and fractures in the rocks. Clay and shale layers, which commonly un derlie the coal beds, considerably restrict the downward movement of ground water (Norris, 1969, p. 30-1; Ohio Department of Natural Resources, 1978, p. 168-72). Under these conditions ground water generally moves laterally and discharges at hillside springs or seeps, although there is some downward leakage through the underclay to deeper water-bearing zones. The presence of clay and shale layers commonly causes series of perched aquifers to form in some places (fig. 4).
Local geology considerably influences the quality of ground water in Ohio's coal region particularly, concentrations of bi carbonate and sulfate. In eastern Ohio, dissolved bicarbonate in ground water gen erally is derived from limestone (calcium carbonate) and carbonate cements. Sulfate is derived primarily from pyrite an iron sulfide mineral which commonly is associ ated with coal and coal-bearing rocks in the eastern United States.
Technical terms are defined in a glossary at the back of this report.
41-1
40-1
84
v MUSKINGUM I COUNTY
EXPLANATION
40 MILES
I 40 KILOMETERS
Study watershed
Approximate boundary of coal region
From Razem, 1984
Figure 2. Location of study watersheds and Ohio's coal region.

Table 1. Summary of selected physical characteristics and historical data for watersheds M09. CQ6. and Jll
[Data from the U.S. Department of Agriculture, AgriculturalResearch Service]
Location:
Section
M09
Meigs
17
Watersheds
C06
22
T>1 o-i nfi a.1 A
Jll
Jefferson
Mt. Pleasant
34
Area (acres):Before mining- 43
After reclamation 37
- 233Relief (feet):
Before mining
After reclamation----- 146
49
41
265
191
Harrison- ville
29
32
150
126
Date mining began-
Date reclamation was compl eted
Jan. 1977 Nov. 1976 May 1980
Sept. 1978 Oct. 1978 June 1982
Period of data collection June 1976- Jan. 1976-Jan. 1981 Jan. 1981
May 1977- June 1982
U.S. Geological Survey 7.5-minute topographic map.
Data Collection
Ground-water data at the study sites were collected at observation wells that were installed before mining and at wells installed after reclamation to replace those destroyed by mining.3 Each well was cased, sealed, and screened so that it was open to only one water-bearing zone.
Water levels in the wells were mea sured monthly. Selected wells were in strumented to record water levels several times a day. Hydraulic conductivities of the aquifers before and after mining were
The number of wells at each watershed varied throughout the study, and ranged from 8 (after reclamation at C06) to 16 (after reclamation at MO9).
determined by slug tests or by single-well pumping tests.
Samples for water-quality analyses were collected from the observation wells before and after mining and reclamation. Samples were collected with a submersible pump if the well yield permitted, or with a plastic bailer otherwise. The well volumes were discharged several times and allowed to refill before samples were taken.
Data on physical properties and chemi cal constituents in ground water were ob tained; these data have been summarized in terms of water types and in discussions of some of the more common physical properties and chemical constituents. The description of water types in this report is based on the cations (calcium, magnesium, and sodi um) and anions (bicarbonate, chloride, and sulfate) that account for most dissolved constituents in the water.

SECTION LITHOLOGY
1 - Coal
9 - Underclay
8 - Freshwater limestone
7 - Clay shale, calcareous shale, mudstone
6 - Sandy shale
5 - Sandstone and siltstone
4 - Massive shale 3 - Marine limestone 2 - Roof shale 1 - Coal
Figure 3. Generalized stratigraphic column of sedimentary rocks between coal beds (from Brant and DeLong, 1960).
GROUND-WATER CONDITIONS AT THE STUDY WATERSHEDS
Conditions Before Mining and Reclamation
Physical Characteristics and Hydrology
Table 1 presents selected physical characteristics and historical data for the study watersheds. All three watersheds were drained by small streams before min ing. In each watershed, relatively imper meable underclay beneath the major coal seams formed bases for local, perched aqui fers above deeper, regional ground-water systems (fig. 4).
Before mining, the top aquifers were recharged by precipitation falling within the watershed. Water discharged from the top aquifers by evapotranspiration and by downward leakage through the underclay to deeper aquifers or by lateral movement and discharge to springs or seeps at the coal outcrops.
The middle aquifers were recharged by downward leakage through the overlying clay or oy precipitation where the clay was ab sent; discharge was by downward leakage, evapotranspiration f or by flow into the streams.
In watersheds M09 and C06, the deep regional aquifers are recharged and dis charged mainly outside the watershed. The deep regional aquifer under watershed Jll was drained by an underground mine that discharged downgradient from the watershed.
Ground-Water Quality
Ground water in the top and middle aquifers was predominantly calcium bi carbonate in type before mining and recla^ mation, but calcium sulfate and sodium bicarbonate types also were present. The water in these aquifers ranged from moder ately hard to very hard.
Specific conductance a general indi cator of the concentration of dissolved minerals was greater in the middle and deep regional aquifers than in the top aquifers. The increase in specific conduc tance with depth is typical of unmined watersheds in the study area. The deeper the ground water circulates, the older it tends to be; thus, the water generally has more contact time with rocks through which it passes than shallower water, and conse quently has more time to dissolve minerals from the rocks.

Evapotranspiration
Perched aquifer . .
,'.: '-'. <fiow direction may.-differ from that of-local.
EXPLANATION
Infiltration and vertical leakage
Direction of ground-water flow
Unsaturated zone
Saturated zone
Coal bed
Figure 4. Conceptual diagram of the ground-water flow system typically
found in Ohio's coal region.

Conditions After Mining and Reclamation
Physical Characteristics and Hydrology
Surface mining in the watersheds in volved removal of topsoil, blasting (to break up the overburden) f removal of the overburden, and removal of coal. Reclama tion began immediately after removal of coal, and involved replacement and grading of the spoils, replacement of topsoil, and revegetation.
During surface mining, the top aquifer in each study watershed was destroyed. During reclamation, spoils were returned to the mined-out area and graded to the ap proximate shape of the original land sur face. The relief in all of the watersheds was reduced considerably (table 1). Be cause most of the under clay was kept intact during mining, perched aquifers are expec ted to become re-established in the spoils.
Many of the wells reinstalled in the spoils aquifers were dry at first; however, water-level data indicate that the spoils are slowly becoming resaturated. The de struction of the premining top aquifers re moved the primary sources of base flow to the small streams draining the watersheds. As a result, stream base flow significantly decreased at watersheds MO9 and C06, and ceased altogether at watershed Jll.
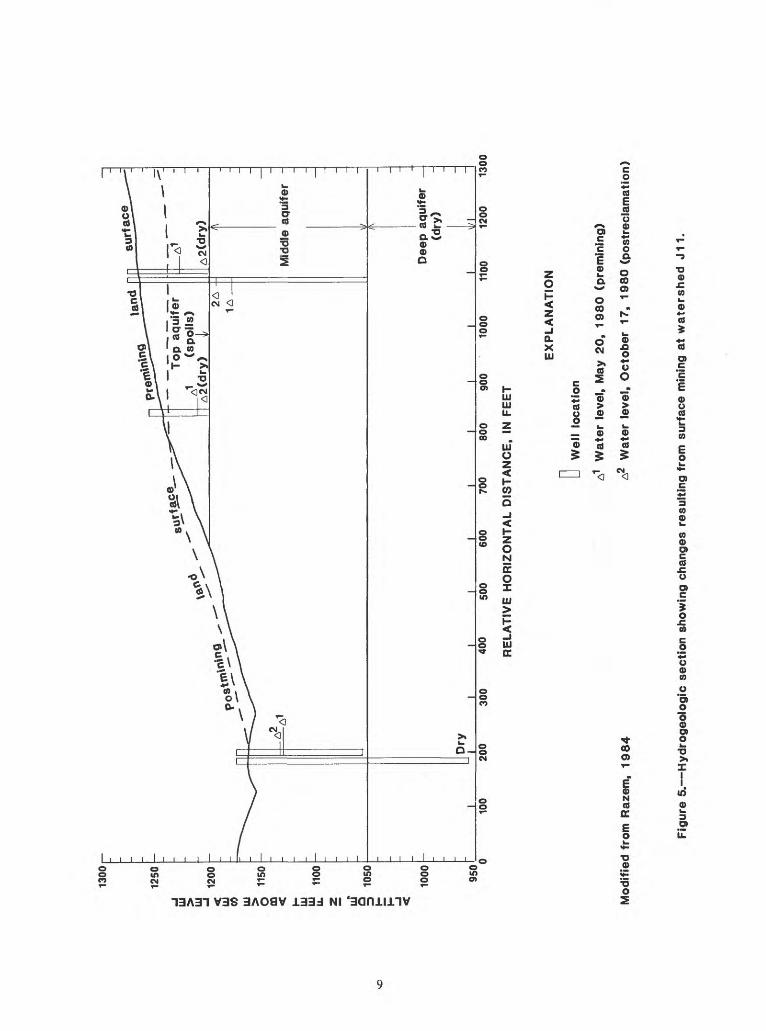
In contrast, water levels in the mid dle aquifers remained the same or rose in places where the under clay below the spoils aquifer may have been inadvertently removed or disturbed (fig. 5). The water levels in the deep regional aquifers were not affect ed by mining activities.
Ground-Water Quality
As mentioned previously, the water in the top aquifers before mining was predomi nantly a calcium bicarbonate type, although some calcium sulfate-type water was present at watershed Jll. Analyses of water from the spoils aquifers, however, indicate that much of the ground water has changed to a calcium sulfate type.
Water quality in the middle aquifers generally did not change, except for one area each in watersheds M09 and Jll where sulfate concentrations increased.
Dissolved minerals in the spoils and middle aquifers increased following mining and reclamation at all three watersheds (table 2, fig. 6). With the exception of the middle aquifer at C06, hardness in creased at all three sites and was in the "very hard" range (greater than 180 milli grams per liter) by the end of data collec tion. The specific conductance of water in the spoils aquifers was about five times
greater than that of the premining top aquifers at M09 and C06, and about 1 1/2 times greater at Jll. In contrast, changes in specific conductance of water in the middle aquifers were slight at M09 and C06. The post re clam at ion specific conductance of water in the middle aquifer at Jll was about twice the premining value.
Concentrations of dissolved sulfate, iron, and manganese in the premining top aquifers generally did not exceed U.S. and Ohio Environmental Protection Agency drinking-water limits. After mining and reclamation, however, the limits generally were exceeded. In the middle aquifers, changes in concentration were less pro nounced, and concentrations generally did not exceed drinking-water limits (table 2-).
No water-quality changes were noted in the deep regional aquifers at watersheds M09 and C06.
SIGNIRCANCE OF RESULTS
The results of this study are signifi cant primarily because they constitute some of the first data from surface-mined water sheds spanning the entire period from be fore mining to after reclamation. These data show how the hydrology and water qual ity of aquifer systems respond to such land-use changes, and provide evidence about subsurface conditions following reclamation.
Much of what has happened to water levels in the aquifers can be explained with reference to the under clay beneath the top aquifers. If the under clay beneath the mined coal bed remains intact, an unsatu- rated zone should continue to separate the aquifer developing in the spoils from the middle aquifer beneath it. The local rises in water levels in the middle aquifers in watersheds M09 and Jll probably are due to removal or damage of the underclay, which may have opened new conduits for downward leakage of ground water. How much of a hydraulic connecton eventually will develop between the spoils aquifers and the middle aquifers in these places is unknown because the postreclamation ground-water system is not yet in equilibrium.
Some of the changes in ground-water quality in the top aquifers are due to structural changes in top-aquifer materi als. Mining and reclamation have converted large chunks of overburden rock to numerous small particles of spoil's material. This results in more fresh surface area of rock being exposed to air and water within the new top aquifer. The weathering of these newly exposed surfaces results in higher concentrations of dissolved constituents in the spoils aquifer than in the premining top aquifer. This weathering also allows pyrite in the vicinity of the coal seam to react with the ground water and liberate sulfate ions, hence the trend toward cal cium sulfate water type in these places.
1300
1-
100
200
300
400
500
600
700
800
900
RE
LA
TIV
E H
OR
IZO
NT
AL
DIS
TA
NC
E.
IN F
EE
T
1000
1100
1200
1300
EX
PL
AN
AT
ION
Mo
dif
ied
fro
m R
azem
, 1984
U W
ell
loca
tio
n
A1
Wa
ter
leve
l, M
ay 2
0,
1980 (
pre
min
ing
)
A2
Wa
ter
leve
l, O
cto
ber
17
, 1
98
0 (
po
stre
clam
atio
n)
Fig
ure
5. H
yd
rog
eo
log
ic s
ecti
on
sho
win
g ch
ang
es r
esu
ltin
g f
rom
su
rfac
e m
inin
g at
wa
ters
he
d
J1
1.

Tab
le 2. C
om
pari
son of
yro
und-w
ator
quali
ty bufo
re
and
flft
f""
min
ing
an
d re
cla
mati
on
at
wate
rsheds
M09
.CO
6 .
and
Jll
[Dri
nkin
g-w
ater
li
mit
s
from
U
.S.
Envir
onm
enta
l P
rote
cti
on
Age
ncy
(19
76
),
unle
ss o
therw
ise
no
ted
. D
ata
from
U
.S.
Geo
logic
al
Surv
ey
(1979-8
3)
and
R
azem
(1
983,
1984)]
Med
ian
1 co
ncen
trati
on
or
oth
er
mea
sure
men
t b
efo
re
min
ing
ft
cD
aauif
i.-r
) an
d aft
er
recla
mati
on
(s
oo
ils
aauif
c-r)
Pro
pert
y
or
const
ituent
Specif
ic
con
du
ctan
ce
(uS
/cm
) --
---
pH
Har
dnes
s (r
ag/L
)
Sulf
ate
, d
isso
lved
(m
g/L
)
So
lid
s,
dis
solv
ed
2 (m
g/L
)
Iron,
dis
solv
ed
(u
g/L
)
Man
gan
ese,
dis
solv
ed
(jig
/L)
Dri
nkin
g-
wat
er
lim
it
-L ,
4£
U U
5.0
-9.0
[none]
£JU
750
230
0 50
MO 9
Bef
ore
545 7
.6
315 40 40
20
Aft
er
2,9
50
6.8
2
,00
0
1,5
00
2,5
80
3,4
00
2,3
00
C06
Bef
ore
288
1 6
.8
115 36
1
130
32
140
1
Med
ian
3 co
ncen
trati
on
or
oth
er
acu
ifo
r befo
re
:r.i
riin
d ar
id
Sp
ecif
ic
con
du
ctan
ce
(jiS
/cm
)
pH
Har
dn
ess
(mg/
L)
Su
lfate
, d
isso
lved
(m
g/L
)
So
lid
s,
dis
solv
ed
2 (m
g/L
)
Iron,
dis
solv
ed
(|ug
/L)
Man
gane
se,
dis
solv
ed
(ug/L
)
-L ,
£.\
)\)
5.0
-9.0
[non
e]25
0*
-~
- V
750
230
0 50
796 7
.8
100 36 40
20
946 7
.6
210 64
62
8 14
0 60
600 7
.2
190 48 930
1 27
0
Jll
Aft
er
,600 6.5
82
0 32
0 ,0
60
,000
,000
Bef
ore
550 7
.0
270 84
33
5 30
30
mea
sure
men
t fo
r aft
er
rfcc
lan
.ati
590 6
.8
180 31
34
0 ,1
00
665
680 7
.5
250 47
40
5 10
10
Aft
er
716 6
.8
335
200
405
150
400
mid
dle
L,
n
1,1
80 7.0
64
0 19
0 770
18
220
" N
umbe
r of
sa
mple
s on
w
hic
h m
edia
ns
are
bas
ed are
as
fo
llow
s.
Bef
ore
m
inin
g:
M09
, 1
2;
C06
, 18;
Jll
, 35.
Aft
er
recla
mati
on:
M09
, 9;
C06
, 5;
Jll
, 1
4.
20
hio
E
nvir
onm
enta
l P
rote
cti
on
Age
ncy
(197
8)
wate
r-quali
ty
stan
dard
s fo
r p
ub
lic w
ater
su
pply
.
3Num
ber
of
sam
ple
s on
wh
ich
m
edia
ns
are
bas
ed are
as
foll
ow
s.
Bef
ore
m
inin
g:
M09
, 1
4;
C06
, 9
; Jll
, 3
0.
Aft
er
recla
mati
on:
M09
, 43;
C06
, 28;
Jll
, 1
0.

COzHI5 UJ
3000
COoQC O 20000 0 _ 10 5 cj
1000
of DC o W
O H=} ZO HIz o
3000
OUJa.CO
2000
v UJ O Q.
1000
TOP AQUIFER
MIDDLE AQUIFER
8.0
7.0
I 6.0 a
8.0
7-0
6.0
TOP AQUIFER
MIDDLE AQUIFER
CO5
QCa_«
2000
1000
O
« £ 2000Q.
V) rt
CO COUJZoQC
1000
TOP AQUIFER
MIDDLE AQUIFER
05 O ID
-I 200OCO<2 100 o
BEFORE AFTER
MINING RECLAMATION
EXPLANATION
WATERSHEDS
CO
QCa
_S DCHI
UJ H
400
300
200
100
QC400 Ula.
300
TOP AQUIFER1500r
MIDDLE AQUIFER
M09 C06
BEFORE AFTER
MINING RECLAMATION
J11
Figure 6. Median values for selected properties and constituents before mining and after reclamation of the study watersheds (data are presented in table 2)

The underclay layers between the top and middle aquifers appear to have an "in sulating" effect on water quality in the middle aquifers. The underclay retards downward leakage of highly mineralized water from the overlying spoils aquifers into the middle aquifers. Thus, water- quality changes in the middle aquifers generally have been less pronounced com pared with changes in the top aquifers.
The hydrologic studies at these water sheds do not provide data that would show the effects of mining and reclamation on drinking-water supplies in the vicinity of the sites. All observation wells used were either within or very close to watershed boundaries.
The studies also do not provide suf ficient information to predict when water levels and ground-water quality will sta bilize. The hydrologic systems at these watersheds took thousands of years to develop; data collected 1 or 2 years after reclamation can only hint at what the final postreclamation water levels and water quality will be. For example, a short- term followup study at watershed Jll was conducted by the U.S. Geological Survey to analyze water samples collected from wells in January and May 1984 (approximately 4 years after mining ended). Results of these analyses indicate that ground water still is becoming more mineralized in the top and middle aquifers. Rates of water- quality change differ considerably through out the aquifers, however. The places in the middle aquifer where more rapid changes in water quality are taking place may be affected by downward leakage from the top aquifer, but data are insufficient to con firm this possibility (Janet Hren, U.S. Geological Survey, oral commun., 1984).
The documentation of hydrologic changes at watersheds M09, C06, and Jll serves as a basis for comparison with other, similar studies in the Eastern Coal Province and in other areas of the United States. The results of these studies also should be useful to hydrologists and regu latory officials for determining the prob able hydrologic consequences of surface mining and reclamation on the ground-water systems of small watersheds.
SElfCTED REFERENCES
Brant, R. A., and DeLong, R. M., 1960, Coal resources of Ohio: Ohio Department of Natural Resources, Division of Geological Survey Bulletin 58, 245 p.
Durfor, C. N., and Becker, Edith, 1964, Public water supplies of the 100 largest cities in the United States, 1962: U.S. Geological Survey Professional Paper 1812, p. 27
Engelke, M. J., Jr., Roth, D. K., and others, 1981, Hydrology of area 7, Eastern Coal Province: U.S. Geological Survey Water-Resources Investigations Open-File Report 81-815, 60 p.
Fenneman, N. M., 1938, Physiography ot eastern United States: New York, McGraw- Hill, 714 p.
Hem, J. D., 1970, Study and interpretation of the chemical characteristics of natur al water, 2d ed.: U.S. Geological Survey Water-Supply Paper 1473, 363 p.
Norris, S. E., 1969, The ground-water situ ation in Ohio: Ground Water, v. 7, no. 5, p. 25-33.
Ohio Department of Natural Resources, 1978, Southeast Ohio water plan: 517 p.
Ohio Environmental Protection Agency, 1978, Water quality standards: chap. 3745.1 of the Ohio administrative code, 117 p.
Razem, A. C., 1983, Ground-water hydrology before, during, and after coal strip mining of a small watershed in Coshocton County, Ohio: U.S. Geological Survey Water-Resources Investigations Report 83-4155, 36 p.
, 1984, Ground-water hydrology and quality before, and after strip mining of a small watershed in Jefferson County, Ohio: U.S. Geological Survey Water- Resources Investigations Report 83-4215, 39 p.
Roth, D. K., Engelke, M. J., Jr., and others, 1981, Hydrology of area 4, Eas tern Coal Province: U.S. Geological Survey Water-Resources Investigations Open-File Report 81-343, 62 p.
U.S. Bureau of Mines, 1978, Research on the hydrology and water quality of watersheds subjected to surface mining; phase 1, premining hydrology and water quality conditions: U.S. Bureau of Mines Open- File Report 88-80, 347 p.
1979, Research on the hydrology and water quality of watersheds subjected to surface mining; phase 1, premining hy drology and water quality conditions Summary report: U.S. Bureau of Mines Open-File Report 31-80, 40 p.
U.S. Bureau of the Census, 1984, Statisti cal abstract of the United States, 105th ed.: Washington, p. 728.
U.S. Geological Survey, 1979, Water re sources data Ohio, water year 1978: v. 1, p. 347-70.
1980, Water resources data Ohio, water year 1979: v. 1, p. 433-83.
1981, Water resources data Ohio, water year 1980: v. 1, p. 509-71.
1982, Water resources data Ohio, water year 1981: - v. 2, p. 179-232.
1983, Water resources data Ohio, water year 1982: v. 2, p. 149-66.
U.S. Environmental Protection Agency, 1976, Quality criteria for water: 256 p.
112

GLOSSARY
Anion is a negatively charged atom or group of atoms.
Ag_u_i.f.e_E is a part of the subsurface envi ronment containing saturated permeable material that will yield water to wells or springs.
Base flow refers to the sustained or "fair weather" flow of streams, as opposed to the high flows associated with storm runoff; base flow is supplied primarily by ground water in most streams.
Cation is a positively charged atom or group of atoms.
Evapotranspiration is the withdrawal of water from the earth's surface by evapo ration from soil and bodies of water, and by transpiration from plants.
fljLE.d.n.e_s_s is a property of water that is at tributed to the presence of calcium, magnesium, and other alkaline-earth metals. The most noticeable characteris tics of hard water are that soap does not lather readily and that scale deposits tend to form in hot-water systems. Durfor and Becker (1964) use the follow ing classifications for hardness:
Hardness range (mg/L as
0-60...........61-120.........121-180........More than 180..
Description
SoftModerately hard Hard Very hard
Hydraulic conductivity is the movement of a volume of ground water (measured at right angles to the direction of flow) under a unit hydraulic gradient through a unit area. It is often expressed in units of feet per day or meters per day.
Median is the middle value in a series of ranked data; that is, there are an equal number of values greater than and less than the median.
Overburden is soil and rock material above a coal seam.
Perched aquifer is an aquifer separated from an underlying body of ground water by an unsaturated zone; its base is a zone of low permeability that retards downward migration of water.
pH is a scale commonly used to express the degree of acidity or alkalinity of a solution; pH of 7 is the point of neu trality at which there is neither acidity nor alkalinity. As acidity increases, the pH value decreases, and as alkalinity increases the pH value increases. In technical terms, it the negative loga rithm (base 10) of the hydrogen-ion acti vity, in moles per liter.
is the addition of water to anaquifer.
Single-well pumping test is a test in which a well is pumped and water-level decline in the well is recorded during and after the pumping period in order to determine the hydraulic characteristics of the aquifer in the well's vicinity.
Slug test is a test in which a measured amount of water is poured into a well and water-level changes in the well are sub sequently measured in order to determine the hydraulic characteristics of the aquifer in the well's vicinity.
Specific conductance, a measure of the ability of water to conduct an electrical current, is an index of dissolved mineral content. Generally, it is reported in units of microsiemens per centimeter at 25° Celsius.
Spoils are soil and broken-up rock material removed from above a coal seam; drasti cally disturbed overburden.
Underclay is clay or other fine material forming the base of a coal bed. Under clay often contains the fossilized roots of the plants forming coal.
13 U.S. GOVERNMENT PRINTING OFFICE: 1986 - 647-320/21715