effects of sea anemones on the flow …effects of sea anemones on the flow forces 89 fig. 1. a large...
TRANSCRIPT

J. exp. Biol. (1977). 69, 87-105 gy
With 13 figures
Printed in Great Britain
EFFECTS OF SEA ANEMONES ON THE FLOWFORCES THEY ENCOUNTER
BY M. A. R. KOEHL*
Department of Zoology, Duke University, Durham, North Carolina 27706
(Received 9 December 1976)
SUMMARY
Two species of sea anemones, Metridium senile and Anthopleura xan-thogrammica, illustrate the sorts of compromises made by sessile organismsbetween maximizing the transport done and minimizing the mechanical forcescaused by flow.
1. M. senile occur in calm areas, but because they are tall, they areexposed to mainstream current velocities. Although A. xanthogrammicaoccur in areas exposed to wave action, they are short and effectively hiddenfrom mainstream velocities.
2. Measurements of drag forces on anemones and models in a flow tankand in the field indicate that the shapes, sizes, flexibilities, and behavioursof anemones affect the flow forces they encounter.
3. Although M. senile and A. xanthogrammica occur in different flowhabitats, the drag force on an individual of either species is about 1 N.
4. The water currents encountered by these anemones and their mechanicalresponses to the currents can be related to the manner in which the anemonesharvest food from flowing water.
INTRODUCTION
Organisms depending on moving fluid to transport them from place to place (suchas various planktonic organisms or wind-dispersed seeds) have morphological featuresthat maximize drag, whereas organisms that locomote through a fluid (such as birdsor fish) tend to have structures that minimize drag. Sessile organisms (such as seaanemones or kelp) risk being dislodged or broken by drag forces, yet they depend onthe fluid moving over them to bring them food and essential substances, to carry awaytheir wastes, and to disperse their gametes or young.
Sessile organisms should therefore exhibit various compromises between mini-mizing and maximizing the effects of flow. I have investigated the ways in which thesizes, shapes and distributions of sessile animals affect the flow forces and feedingcurrents they encounter. There have been a number of studies of the distribution ofbenthic organisms in different types of flow (e.g. Southward & Orton, 1954; Ballan-tine, 1961; Gunjarova, 1968; Lewis, 1968; Hynes, 1970; Riedl, 1971; Schwenke,1971), and a few biologists have actually measured flow velocities in the field (e.g.Charters, Neushul & Barilotti, 1969; Davies & Barham, 1969; Rhoads & Young,
• Present address: Friday Harbor Laboratories, Friday Harbor, Washington 98350.

88 M. A. R. KOEHL
1970; Grigg, 1972; Riedl & Machan, 1972; Terekhove, 1973), but the flow forces andthe ways in which organisms affect them have not been investigated.
On the basis of the principles outlined below, I expected that the flow forcesencountered by sessile animals would be determined by their structure and behaviouras well as by their locations in the environment. I made a comparative study of twospecies of sea anemones exposed to different flow conditions, the intertidal Antho-pleura xmihogrammica (Brandt) (Fig. 1C) which are found in areas exposed to extremewave action (Rigg & Miller, 1949; Hand, 1955 a; Ricketts & Calvin, 1968; Dayton,1971), and the large subtidal individuals of Metridium senile fimbriatum (Verrill) (Fig.1 A, B) which occur in areas exposed to tidal currents (Hand, 19556; Ricketts &Calvin, 1968; Kozloff, 1973).
Some basic principles of the hydrodynamics of oscillatory flow
The flow force on a large organism in a tidal current when acceleration of the wateris low (i.e. flow is essentially steady) can be estimated using the simple equation fordrag at high Reynolds' number (Re),
FD = \{CDp IPS), (1)
where CD is an empirically determined drag coefficient that depends upon the shapeof the object and the Re of the flow situation, p is the density of the fluid, U is thevelocity, and S is the projected area of the body normal to the direction of flow(Rouse, 1961; Shapiro, 1961). Estimation of the flow forces on an organism in waveswhere water speed and direction rapidly change, however, is more complicated.Fortunately, ocean engineers have worked out a body of equations for predictinghorizontal wave forces on pilings (high Re). A more thorough discussion of wave-induced forces can be found in Bascom (1964), Wiegel (1964), Carstens (1968), andNagai (1973).
The water velocity during a wave cycle changes, hence the drag on a body in thewave changes. The drag (FD) at any time (t) can be estimated using equation (1):
Ut) = iC^[C/(0]25, (2)where U(t) is the horizontal component of velocity at time t. Just as a greater force isneeded to accelerate a body through a fluid than is needed to maintain the body at aconstant speed, a greater force is exerted on a body over which fluid is acceleratingthan on the body over which fluid is moving at a constant speed. This extra accelera-tion force or inertial force (Fj), which is proportional to the horizontal componentof the acceleration of the flow (£7) and to the mass of water displaced by the body(p. V), also changes with time (t) during the wave cycle;
W) = i CMVPC(t), (3)where CM is the empirically determined coefficient of mass (dependent in part on theshape of the body) and V is the volume of the body. The CD of an object in steadyflow varies with Re, but the CD and CM of an object in oscillating flow tend to varywith another dimensionless number, the period parameter (Pp),
TI Tp _ ^max-1 / vrp 2) > 141

Effects of sea anemones on the flow forces 89
Fig. 1. A large subtidal Metridhm senile bent over in a tidal current (arrow indicates flowdirection). (A) Side view, (B) view from upstream (after Koehl, 1976); (C) an Anthopleuraxanthogrammca.
where Umax is the maximum horizontal component of velocity attained during awave cycle, T is the period of the wave, and D is the diameter of the object normal tothe direction of flow (Keulegan & Carpenter, 1958). (There is, however, considerablescatter around Keulegan & Carpenter's (1958) curves of CM or CD against Pp ofvalues measured in the field, thus various statistically derived values for CD and CM
have also been suggested (Dean & Harleman, 1966; Agerschou, 1966).) The totalforce (F) on a body in a wave at time (t) is the sum of the drag (FD) and the inertialforce (F2) at that time,
F(t) = F^+Fjit). (5)
Maximum FD occurs when velocity reaches a maximum, but maximum Ft occurs at adifferent point during the wave cycle when acceleration is maximum. The maximumtotal force (-Fmax) o n a n object during a wave cycle can be estimated by
F — FL max ~ ± D max
(6)

90 M . A. R. K O E H L
when o s$ Fj mitJFD „,„ ^ 2, and by
•**nMut = -VT max> (7/
when Fj mtJFD max > 2 (Bretschneider, 1966).Although adequate for estimating flow forces, the above equations do not fully
describe the complicated forces on bodies in waves. For example, they do not considerthat the eddies formed behind a body move over it when flow direction is reversed.Nonetheless, these equations are very useful in that they describe the dependence offlow forces on a few basic measurable features of a body and the fluid moving aroundit.
Notation
CD = drag coefficientCM = mass coefficientD = diameter of a body normal to the flow directionFD = drag forceFt = inertial forceF(t) = total force on a body in a wave at time tPp = period parameterRe = Reynolds' number = (pUL)/fi, where L is a linear dimension of a bodyS = projected area of a body normal to the direction of flowT = period of a waveU = velocityU(t) = horizontal component of velocity of water in a wave at time ttJ(t) = horizontal component of acceleration of water in a wave at time tV = volume of a bodyfi = viscosity of a fluidp = density of a fluid
Wave pressures
Sessile organisms in waves are subjected to pressure changes as well as tohorizontal flow forces. The height of the water column above an organism, andhence the pressure on that organism, changes as a wave passes overhead, althoughsuch pressure changes are small. Larger pressures are exerted on shores bybreaking waves. Large wave pressures ('shock pressures') last only a fewthousandths of a second, are rare and cannot be predicted because their amplitudedepends upon the particular shape and velocity of the wave and configuration ofthe shore at the moment of impact. It has been observed, however, that the pres-sures exerted on a shore by breaking waves are lower when air is entrained in thewater, when the shore is horizontal or of gentle slope, and when the shore is cushionedby a layer of water such as the backwash of the previous wave (Wiegel, 1964: Carstens,1968). I have not found A. xanthogrammica intertidally on exposed vertical rockwalls normal to the direction of wave propagation where shock pressures are mostlikely to occur. Rather, I have found a few of these anemones on vertical walls parallelto the direction of wave propagation and many more on the horizontal bottoms of chan-nels; these A. xanthogrammica are in the low intertidal zone where they are coverec1
by a cushion of water when waves are breaking directly over them. I therefore do nn

Effects of sea anemones on the flow forces 91
expect A. xanthogrammica to encounter large pressures due to breaking waves.Furthermore, an increase in pressure around an anemone filled with incompressiblewater would not subject it to a mechanical load unless it was in the pressure gradientat the edge of a shock pressure zone; such a pressure gradient would tend to pushthe anemone laterally. Because the probability of an A. xanthogrammica encounteringsuch a gradient is low, I have restricted the present study to the horizontal drag andinertial forces that accompany each wave.
MATERIALS AND METHODS
By SCUBA diving and working low tides, I surveyed a number of sites along thecoast of Washington to determine the characteristic habitats of M. senile and A.xanthogrammica and to observe their posturing and feeding behaviour. I assessedthe shapes and dimensions of both species of anemones in the field as described inKoehl (1977).
I measured water velocities in order to characterize quantitatively the flow regimesof localities where the two species occur as well as of their microhabitats within thoselocalities. With a thermistor flowmeter (LaBarbera & Vogel, 1976) capable of 1 mmspatial resolution, I was able to measure water speeds between the columns and ten-tacles of anemones. I used an electromagnetic flowmeter (EPCO Water CurrentMeter, Model 6130) to measure current velocities at exposed coastal sites. Flowprobes were held rigidly in place by metal scaffoldings attached to the rock substratumin positions which did not interfere with the currents being measured. Simultaneoussignals from both channels of either of the flow meters were recorded on CrO2
magnetic tape using a portable stereo tape recorder (Sony TC-1261) and latertranscribed using a chart recorder (Gould Brush 220) or an X-Y recorder (Hewlett-Packard, Model 7004B). The maximum standard error (S.E.) of repeated measure-ments transcribed in this way of the same velocity in a calibration tank was ± 3 % ofthe velocity for the electromagnetic flowmeter and + 8 % for the thermistor flowmeter.
I constructed a force plate (Fig. 2) to make flow force measurements on anemones.Changes in resistance of X and Y strain gauges of the force plate were simultaneouslymonitored using two DC universal bridges (Bean, Model 101) and two strain meter-amplifiers (Bean, Model 502). Simultaneous signals from the two amplifiers wererecorded and transcribed as described above. The force plate was calibrated by hang-ing weights from the specimen attachment point; the maximum standard error ofrepeated measurements of the same force recorded and transcribed as described was± 5 % . Anemones were allowed to attach to circles of plexiglas (J in. thick) whichwere then affixed to the force plate. The force plate could be bolted to the rock sub-stratum in the field as well as to the bottom of a flow tank (Vogel & LaBarbera, inpreparation). Water velocities in the flow tank were measured by timing particles; themaximum standard deviation of repeated measurements of the same velocity was±8%. The flow tank was filled with Instant Ocean (33%,,) and kept at 10 °C.
The contributions to drag of various aspects of the shape, texture and flexibilityof the anemones, was tested by using the force plate to measure the drag on models ofanemones in the field and in the flow tank. The models were made variously from clay,
r, fabric, sheet aluminium, and flexible plastic foam.

M. A. R. KOEHL
Cut-away side view
Top view with cover plate removed
Feeler stock steel beams
l^&l Aluminium frame
Steel flanges for attachment to substratum
Fig. 2. Diagram of force plate. The bending of beam X is proportional to the component offorce along the x axis and the bending of beam Vis proportional to the component of force alongthe y axis. The resultant of the x and y force vectors is the drag. Each of the beams is a \ in.wide strip of 0-012 in. gauge feeler stock steel (Precision Brand). The bending of each of thebeams is measured by a foil strain gauge (Micro-Measurements, EA-06) affixed to the beamwith RTC epoxy (Bean) and waterproofed with nitrile rubber (Bean Gagekote no. a). Tempera-ture-compensating strain gauges were affixed in the same manner to a feeler stock strip attachedto the frame of the force plate with silicone sealant (Dow) so the strip would not be bent.A, points of attachment for cover plate and specimen; C, cover plate; X, strain gauge onbeam X; Y, strain gauge on beam Y; Z, temperature-compensating strain gauges.
RESULTS AND DI8CUSSION
Gross morphology and flow habitat
Along the Pacific coast of the United States, Metridittm senile range from small,shallow-water animals with large tentacles, to large, deeper-water animals withlobed oral discs and numerous small tentacles (Hand, 1955 ̂ )* I found the small M. senilein mussel beds at exposed coastal sites and on docks in Puget Sound, and the lobedlarge M. senile in the greatest abundance on vertical rock walls at depths greaterthan 10 m in Puget Sound. The few large M. senile along the outer coast were

Effects of sea anemones on the flow forces 93
depths such that they did not experience the oscillating flow due to waves. The presentItudy is limited to the lobed large M. senile.
The mean body proportions of expanded M. senile are reported by Koehl (1977).M. senile have long, slim, tapering columns topped by large, flurry lobed oral discs.The most variable aspect of the shape of expanded M. senile is the diameter of the oraldisc. M. senile are tall (mean height above substratum = 38-0 cm, standard deviation.S.D. = 9-0, n = 28). M. senile encounter steady tidal currents of relatively lowvelocity (the maximum velocities attained during the tidal cycles were less than0-2 m.s"1) (Fig. 3 B). The mean ratio of mainstream water velocity to velocity at theoral disc of M. senile was 1-02, to velocity at the upper column, 1-09, and to velocityat the lower column, 1*17; these ratios are not significantly different from each other,however (Fl% a] = 1-15, 0-25 < P < 0-50). Thus, because M. senile are tall, they aresubjected to essentially mainstream current velocities (Fig. 3 C).
M. senile in flowing water are bent over (Figs. 1 A, B): this bending orients their oraldiscs normal to the water current. I have observed these anemones filtering zoo-plankton from the water passing through the meshwork of numerous small tentacleson their lobed oral discs. Gut content analyses confirm that M. senile are zooplankti-vorous (Koehl, in preparation).
Anthopleura xanthogrammica commonly carpet the bottoms of intertidal surgechannels at rocky exposed coastal sites. At high tide they are subjected to the oscillatingbottom flow as waves pass overhead: at low tide they are subjected to the shorewardsurge and seaward backwash of breaking waves. I also found a few solitary A. xantho-grammica at coastal sites where such wave action was attenuated by rock reefs locatedseaward of the anemones. The variance of the heights of A. xanthogrammica in ex-posed channels ((S.D.)B = o-8i) is significantly lower (F[t671i = 7-11, P < 0-002) thanthe variance of the heights of A. xanthogrammica in protected areas ((s.D.)* = 5-76).The oral discs of A. xanthogrammica in groups carpeting exposed channels are allat essentially the same height; even though wider individuals tend to be taller (Fig. 4),wider anemones in exposed channels tend not to stand up taller than their narrowerneighbours.
To assess whether the difference in height between exposed and protected A.xanthogrammica might be due to a structural difference between the two populationsor to a transient difference in posture, I measured and collected individuals from bothprotected and exposed sites, put them in a sea table where flow velocity was < 0-05m.s"1, and measured their heights on the subsequent 8 day3. The mean heights ofexposed (2-1 cm) and protected (5-3 cm) A. xanthogrammica before they were collectedwere significantly different (Flll3) = 20-63, P < o-ooi), whereas after 8 days in thesea table they were not (Ffl lxj = 0-59, P < 0-50). After 8 days in nearly still water,the anemones from protected sites had not changed significantly in height (F(li $ =0-04, P > 0-75), whereas the anemones from exposed channels were significantlytaller (Ftl i 18j = 7-78, P < 0-025). This increase in height from a mean of 2*1 cm to amean of 4-3 cm over a short period of time suggests that the difference in heightbetween A. xanthogrammica from protected and exposed sites is due to posturing.
Current velocities over a shore are greatest during surge and backwash (Carstens,1968). Mainstream flow in exposed surge channels during surge and backwash
ig. 5 A, B) is bidirectional with a mean period of 7-7 s (s.D. = 0-9, n = 37). BecauseEXB 69

M. A. R. KOEHL
in fi
10cm
Edge or bed of M. senile1000 3000 5000 7000
Time (s)9000 11000
n
eI1/5
018
on007
I-
-
-i I r
II-
-i i I
III-
-i i i
IV•
\1 1 1
24 48 72 24 48 72 24 48 72Time (s)
24 48 72
Fig. 3. Water speeds over M. senile measured by the thermistor flowmeter. (A) Diagram of aM. senile and the surrounding area indicating points (I-IV) where water speeds were measured.(B) Plot of water speed against time during part of the tidal cycle. (C) Plots of water speedmeasured at different points within a 15 min period. (Note that the water speed scale islogarithmic.)
A. xanthogrammica in exposed surge channels are so short, flow over these anemones isof lower velocity than mainstream (Figs. 5 C, D). Flow over the anemones is also moreturbulent than mainstream. The mean of the maximum velocities of each wave surge40 cm above the A. xanthogrammica in a surge channel (0-51 m.s"1) is significantlyC t̂i.wi = I74"65> P < o-ooi) faster than the mean of maximum velocities at their oraldiscs (0-21 m.s"1). The variance of the maximum velocities 40 cm above the anemones((s.D.)2 = 0-04) is significantly greater (F^ U1] = 4-0, P < 0-002) than that of maxi-mum velocities at their oral discs ((s.D.)s = o-oi), indicating that the flow microhabitatof the anemones is more constant than is the mainstream flow regime of the areawhere they occur. Mean maximum velocity of surge at different heights above anA. xanthogrammica in a surge channel and the mean velocity of tidal current above aM. senile on a vertical rock wall are plotted in Fig. 6. Unlike the tall M. senile, whichencounter essentially mainstream flow, the short A. xanthogrammica 'hide' from themaximum flow velocities which characterize the areas where they occur.
In contrast, the taller A. xanthogrammica in protected areas stick out into mainstreamcurrents. For example, the mean maximum velocity of surge 40 cm above an A.xanthogrammica at a protected site was 0-37 m.s"1 (s.D. = 0-17, n = 43) and that atthe oral disc of this anemone was also 0-37 m.s"1 (s.D. = 0-17, n = 154); the variance

Effects of sea anemones on the flow forces 95
13
11
I
O * ° • 0
I
6 8 10 12Oral disc diameter (cm)
14 16
Fig. 4. Plot of the oral disc diameters and the heights of A. xanthogrammxca fromprotected ( • ) and exposed (O) sites.
of maximum velocities ((s.D.)2 = 0*3) is the same for mainstream flow and for flowon the anemones. Mean maximum surge velocity 40 cm above the oral discs ofA. xanthogrammica at an exposed site (0-51 m.s"1) was significantly faster (Ftl#U3] =i5'io, P < o-ooi) than that of a protected site (0*37 m.s"1) measured within one houron the same day. However, the mean maximum surge velocity on the oral discs of the'protected* A. xanthogrammica (0-37 m.s"1) is significantly faster (^,201 = 8i-75,P < o-ooi) than that on 'exposed' anemones (0-21 m.s-1) measured within that samehour. This illustrates that a knowledge of mainstream flow conditions does not tellus the flow regime encountered by a particular organism.
A. xanthogrammica feed primarily on mussels which fall on their oral discs afterbeing ripped off the substratum by starfish, logs, and waves (Dayton, 1973). A.xanthogrammica do not visibly deform in flowing waters; they remain upright insurge and catch the large prey items such as mussels which settle out of the slowerwater eddying over the anemones (Koehl, in preparation).
Drag
Although A. xanthogrammica in exposed channels are hidden from mainstreamcurrents and M. senile in calm areas are not, A. xanthogrammica encounters flowvelocities generally two to four times higher than those met by M. senile. I thereforeaxDected the structure of A. xanthogrammica to minimize drag more than that of
4-3

96 M. A. R. KOEHL
20
I 10
i °| -i-o
£ - 2 0
-A,Sea
Shore
- 1 0 0 10Velocity(m.s-1)
Left Right
Shore
20 • 40 60 80
Left
Right
20
10
I2-2-0
-CSea
Shore
- 1 0 0 1-0Velocity(m.s-1)
Left Right
20
10
f 0B -1 -0
0-50
-0-5
- D
Time (s)
20 40 60| I I I i__
80
v *" r̂ lV' 1 * ^ * ' V V "
Sea
Shore
Left
' Right
Fig. s. Flow velocities measured by the EPCO 6130 flowmeter in a surge channel duringsurge and backwash. (A, B) Velocities 115 cm above the substratum. (C, D) Velocities 3 cmabove the oral disc of an A. xanthogrammica surrounded by other A. xanthogrammica on thefloor of the channel. In (A) and (C) velocity into ('shore') and out of ('tea') the channel isindicated on the vertical axis and flow from side to side (' right',' left') in the channel is indicatedon the horizontal axis. In (B) and (D) velocity (vertical axis) into and out of the channel andfrom side to tide in the channel are both plotted against time (horizontal axis).
M. senile. The Re of a M. senile in a tidal current and the Re of an A. xanthogrammicain surge are both of the order of 10*, hence pressure drag accounts for most of thedrag on these anemones. Therefore, any shape, texture, or behaviour which minimizeswake size will minimize drag.
The flow forces on individual anemones were calculated using field measurements oftheir body dimensions and of flow velocities impinging on them. Each anemone wasmodelled as a combination of cylinders of the appropriate dimensions and the flowforces were computed as illustrated in the Appendix.
Effects of sea anemones on the flow forces 97
1-5 r
10
•g
} t 1
A M
0-5 10 1-5 20
Height above substratum (m)
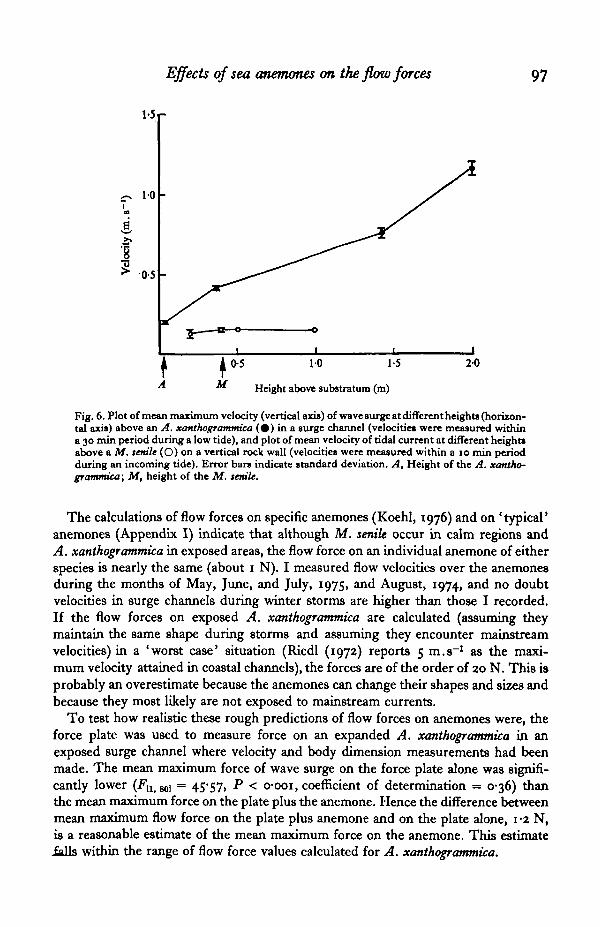
Fig. 6. Plot of mean maximum velocity (vertical axis) of wave surge at different heights (horizon-tal axis) above an A. xanthogramtmca ( • ) in a surge channel (velocitie* were measured withina 30 min period during a low tide), and plot of mean velocity of tidal current at different height*above a Af. tattle (O) on a vertical rock wall (velocities were measured within a 10 min periodduring an incoming tide). Error bars indicate standard deviation. A, Height of the A. xantho-grammica; Af, height of the Af. temle.
The calculations of flow forces on specific anemones (Koehl, 1976) and on 'typical'anemones (Appendix I) indicate that although M. senile occur in calm regions andA. xanthogrammica in exposed areas, the flow force on an individual anemone of eitherspecies is nearly the same (about 1 N). I measured flow velocities over the anemonesduring the months of May, June, and July, 1975, and August, 1974, and no doubtvelocities in surge channels during winter storms are higher than those I recorded.If the flow forces on exposed A. xanthogrammica are calculated (assuming theymaintain the same shape during storms and assuming they encounter mainstreamvelocities) in a 'worst case* situation (Riedl (1972) reports 5 m.s"1 as the maxi-mum velocity attained in coastal channels), the forces are of the order of 20 N. This isprobably an overestimate because the anemones can change their shapes and sizes andbecause they most likely are not exposed to mainstream currents.
To test how realistic these rough predictions of flow forces on anemones were, theforce plate was used to measure force on an expanded A. xanthogrammica in anexposed surge channel where velocity and body dimension measurements had beenmade. The mean maximum force of wave surge on the force plate alone was signifi-cantly lower (F(1 j80] = 45*57, P < o-ooi, coefficient of determination = 0-36) thanthe mean maximum force on the plate plus the anemone. Hence the difference betweenmean maximum flow force on the plate plus anemone and on the plate alone, 1-2 N,is a reasonable estimate of the mean maximum force on the anemone. This estimateialls within the range of flow force values calculated for A. xanthogrammica.

M. A. R. KOEHL
20
1-5
f 10Q
0-5
ep
2-5r
20
1-5
1-0
0-2 0-4 0-6
Velocity2 (m.s" l
Fig. 7
0-8 1-0 0-2 0-4 0-6, 0-8
Velocity1 (m.s-1)1
Fig. 8
1-0
8-0
6-0
4 0
2-0
80
6-0
4-0
20
0-2 0-4 0-6 0-8
Velocity^, s"1)2
Fig. 9
1-0 0-2 04 0-6 0-8Velocity2 (ra.j-1)1
Fig. io
1-0
Figs. 7-ia. Graphs of drag against velocity1. Values for Co were calculated using equation (i).In some cases (e.g. Fig. io) a model with higher drag has a lower Co than a model with lowerdragbecause the former presents more surface area normal to the flow direction (Co K i/5).Fig. 7. A tall ( • ) (Cj> = 0-3) and a short (O) (CD = 0-2) model of an A. xanthogrammica.Fig. 8. A model of an A. xanthogrammica with (O) (CD = 07) and without ( • ) (Co = 0-3)flexible tentacles.Fig. 9. A model of a M. senile with ( • ) (Co = o-6) and without (A) (CD = o-i) flexibletentacles.Fig. 10. A model of an A. xanthogrammica (O) (Co = o-6) with flexible tentacles and of aM. senile ( • ) (CD = o-a) bent over and with a flexible oral disc. The ratio of the projected areanormal to the direction of flow to the projected area parallel to the direction of flow is roughly1 -o for the A. xanthogrammica model and 2-5 for the M. senile model. Both models have a pedaldisc diameter of 01 m.
I measured the drag on models of anemones in the flow tank at Re's between 10*and io5 to test the contributions of various aspects of shape, texture, and flexibilityto drag. Drag was proportional to velocity1 as would be expected for Re's of io^io*.
A tall anemone should experience greater drag forces than a short one of the samediameter for several reasons. As mentioned above, the taller the anemone, the less it ishidden in the slower moving fluid near the substratum. The tall anemone also has alarger projected area normal to the flow than does the short one. Furthermore, thelarger a cylinder's ratio of diameter to length, the smaller the cylinder's CD, becausefluid flowing around the free end of the cylinder reduces the size of the wake behind

Effects of sea anemones on the flow forces 99
140
120
10-0
80
60
40
20
0-2 0-4 0-6
Velocity2 (in.s"
0-8 10
1-5
10
0-5
0-2 0-4 0-6 0-8
Velocity1 (m.s-1)21-Q
Fig n .
Fig. I I . Models of bent M. senile with no oral disc (O) (Co
Fig ia.
0-3), with a lobed flexible oraldisc ( • ) (Co = 0-2), with a lobed rigid oral disc (A) (Co = 0-4), and with an un-lobed rigidoral disc (A) (CD = 0-9). All oral discs have flexible tentacles.Fig. 12. A retracted A. xanihogrammica (0 ) (Co = 0-4), a smooth model of a retractedanemone (O) (Co = 0-4), and a model of a retracted anemone covered with soft verruca-likebumps (A) (CD = 04).
it (Rouse, 1961). The drag on a tall model of an A. xanthogrammica is greater than thedrag on a shorter but otherwise identical model (Fig. 7). The ability of anemones tochange their height thus enables them to modify the drag to which they are subjected.
An expanded anemone is not a plain cylinder, but has tentacles on its free end. Itappears that tentacles make a large contribution to the drag on both A. xanthogrammica(Fig. 8) and M. senile (Fig. 9). Surge force measurements in the field for an A.xanthogrammica and for a model of the same dimensions, but without tentacles, indi-cated that mean maximum force on the anemone was 3-5 times greater than on themodel.
Streamlined shapes minimize wake size, and thuspressure drag. A typical streamlinedshape has a blunt nose and a long tapered tail. The rate of pressure increase along thistail is gradual and the point of boundary layer stall and separation occurs close to therear tip of the body. The typical streamlined shape is effective in reducing drag only ifthe flow is from the blunt to the tapered end. It is therefore not surprising that organ-isms encountering unidirectional flow, such as fish and stream-bottom insect larvae,have the typical streamlined shape (Shapiro, 1961; Carstens, 1968; Hynes, 1970),whereas sessile organisms, such as anemones in tidal currents or waves where flowdirection changes, do not. For a body in an area where flow direction changes, stream-lining (i.e. minimizing the rate of pressure increase along a body in flow) may beaccomplished to some degree by any shape or orientation which presents most of theexposed surface area of the body parallel to the direction of flow (this also reduces theUpjected area of the body normal to the direction of flow). Considered in these terms,

ioo M. A. R. KOEHL
the shape of an A. xanthogrammica appears to be streamlined, whereas that of aM. tenile bent over in flow with its oral disc normal to the direction of flow does nrm(Fig. 10). As expected, most of the drag on models of expanded M. senile is due todrag on the oral disc (Fig. u ) . Drag measurements on models also indicate thatbecause water can flow between the lobes of a M. senile oral disc, drag is lower thanit would be if the oral disc were not lobed (Fig. n ) .
When the flow velocity over a M. senile in the field is artificially increased, the flex-ible oral discs of these anemones collapse like an inside-out umbrella, which probablyreduces drag. Drag measurements on models of M. senile with rigid and with flexibleoral discs illustrate this effect (Fig. n ) . Flexible M. senile in rapid flow are also bentdown closer to the substratum where velocities, and thus drag forces, are lower. Thus,although the shape of a M. senile is far from being streamlined, the flexibility of theseanemones offers a 'safety mechanism' whereby shape becomes more drag-mini-mizing as velocity increases, as has been shown for trees (Fraser, 1962). If the flowover a M. senile is artificially increased too much too abruptly, the anemone deflatesand retracts into a hemisphere-shaped blob: this behaviour significantly reducesdrag (compare Figs. 11 and 12).
Although a rough surface increases skin friction, it can sometimes reduce drag athigh Re's by moving the point of boundary layer separation rearward on a body. Ifa fluid is moving rapidly over a rough surface, turbulence may be created in the boun-dary layer, therefore momentum can be transferred to the slower layers of fluid whichare less likely to stall and cause separation (Shapiro, 1961). The columns of A.xanthogrammica are covered with wart-like bumps (verrucae) which may affect drag.I found, however, that drag on a verruca-covered model of a retracted A. xantho-grammica was nearly the same as the drag on a smooth model of the same dimensions(Fig. 12).
Compliant surfaces and polymer coatings on solid bodies have been found to reducedrag in many instances, although the exact mechanism of this effect is still beinginvestigated (Kramer, 1965; Wells, 1969; Mordvinov, 1972; Cox, Dunlop & North,1974; Virk, 1976). The soft surface and the mucous coating of a sea anemone mayreduce drag. The drag measured on a soft, slimy A. xanthogrammica, however, wasnot noticeably different from that on a hard clean model of the same shape and dimen-sions (Fig. 12).
CONCLUSIONS
The shape, size flexibility, texture, and behaviour of an organism affects the flowforces it encounters, as illustrated by the sea anemones M. senile and A. xantho-grammica. M. senile occur in calm areas, but because they are tall, they are exposed tomainstream current velocities. Although A. xanthogrammica occur in areas exposed towave action, they are short and effectively hidden from mainstream velocities. None-theless, water velocities encountered by A. xanthogrammica are greater than thosemet by M. senile. However, the drag force on an individual of either species is about1 N due to the respective shapes of each species.
I have used the case of these two species of sea anemones to illustrate the sorts ofcompromises made by sessile organisms between maximizing the transport done and.
Effects of sea anemones on the flow forces 101
minimizing the mechanical forces caused by flow. M. senile are distributed in areas^here flow velocities are low, but have an array of morphological features that maxi-mize the effects of the currents they do encounter. In contrast, A. xanthogrammicaare distributed in areas where flow velocities are high, but have morphological fea-tures that minimize the effects of flow. The water currents encountered by theseanemones and their mechanical responses to the currents can be related to the mannerin which the anemones harvest food from flowing water. M. senile bend over in currentsand suspension-feed through their oral discs whereas A. xanthogrammica remainupright in surge and catch mussels which fall on their oral discs.
This work was supported by a Cocos Foundation Training Grant in Morphology,a Graduate Women in Science Grant, a Sigma Xi Grant, and a Theodore RooseveltMemorial Fund of the American Museum of Natural History Grant. I wish to expressmy appreciation to S. A. Wainwright whose support and feedback made this workpossible, and to S. Vogel who introduced me to fluid mechanics and who gave memuch helpful advice. I am grateful to R. Fernald and A. O. D. Willows for theuse of facilities at Friday Harbor Laboratories, University of Washington. I thankthe U.S. Coast Guard and R. T. Paine for making it possible for me to work onTatoosh Island, and M. Denny, M. LaBarbera, K. Sebens, and T. Suchanek fortheir invaluable help in the field. I offer special thanks to M. LaBarbera for all hishelp with instrumentation, and to N. Budnitz for his advice on statistical analyses.
REFERENCES
AOERSCHOU, H. A. (1966). Fifth and first order wave-force coefficients for cylindrical piles. In CoastalEngineering: Santa Barbara Specialty Conference, October 1965, pp. 219-241. New York: AmericanSociety of Civil Engineers.
BALLANTINB, W. (1961). A biologically denned exposure scale for the comparative description of rockyshores. Fd Stud. 1, 1-19.
BASCOM, W. (1964). Waves and Beaches, the Dynamics of the Ocean Surface. Garden City, New York:Doubleday and Co., Inc.
BRETSCHNHIDER, C. L. (1966). The probability distribution of wave force and an introduction to thecorrelation drag coefficient and the correlation inertial coefficient. In Coastal Engineering: SantaBarbara Specialty Conference, October, 1965, pp. 183-217. New York: American Society of CivilEngineers.
CARSTHNS, T. (1968). Wave forces on boundaries and submerged bodies. Sarsia 34, 37-60.CHARTERS, A. C., NEUSHUL, M. & BARILOTTI, C. (1969). The functional morphology of Eisenia arborea.
Int. Seaweed Symp. 6, 89-105.CONNEL, J. H. (1970). A predator-prey system in the marine intertidal region. I. Balanus glandula and
several predatory species of Thais. Ecol. Monogr. 40, 49—78.Cox, L. R., DUNLOP, E. H. & NORTH.'A. M. (1974). Role of molecular aggregates in liquid drag reduc-
tion by polymers. Nature, Lond. 249, 243-5.DAVIS, I. E. & BARHAM, E. G. (1969). An m situ surge-temperature recorder. Lbrmol. Oceanogr. 14,
638-41.DAYTON, P. K. (1971). Competition, disturbance, and community organization: the provision and
subsequent utilization of space in a rocky intertidal community. Ecol. Monogr. 41, 351-89.DAYTON, P. K. (1971). Two cases of resource partitioning in an intertidal community: making the right
prediction for the wrong reason. Am. Nat. 107, 662—70.DEAN, R. G. & HARLEMAN, D. R. F. (1966). Interaction of structures and waves. In Estuary and Coastline
Hydrodynamics (ed. A. T. Ippen), pp. 341-403. New York: McGraw-Hill Book Co., Inc.FRASER, A. I. (1962). Wind tunnel studies of the forces acting on the crowns of small trees. Rep. For.
Res., HM.S.O. Lond. 178-93.GRIOG, R. W. (1972). Orientation and growth of sea fans. Limnol. Oceanogr. 17, 185-92.GUNJAROVA, E. (1968). The influence of water movements upon the species composition and distribution
of the marine fauna and flora throughout the arctic and northern Pacific intertidal zones. Sarsia 34,•"—94-

IO2 M. A. R. KOEHL
HAND, C. (1955 a). The sea anemones of central California. II. The Corallimorpharian and Athenariananemones. WasmaimJ. Biol. ia , 345-75.
HAND, C. (19556). The sea anemones of central California. III. The Acontiarian anemones. WasmamfJ. Biol. 13, 189-351.
HYNES, H. B. N. (1970). The Ecology of Running Waters. Liverpool University Press.KEULEGAN, G. H. & CARPENTER, L. H. (1958). Forces on cylinders and plates in an oscillating fluid.
J. Ret. Natn Bur. Stan. 60, 433-40.KOEHL, M. A. R. (1976). Mechanical design in sea anemones. In Coelenterate Ecology and Behaviour
(ed. G. O. Mackie), pp. 33-31. New York: Plenum Publishing Corp.KOEHL, M. A. R. (1977). Mechanical organization of cantilever-like sessile organisms: sea anemones.
(Submitted to J. exp. Biol.)KOEHL, M. A. R. Mechanisms of prey capture from flowing water by polyps. (In preparation).KOZLOFF, E. N. (1973). Seashore Life in Puget Sound, the Strait of Georgia, and the San Juan Archipelago.
Seattle: University of Washington Press.KRAMER, M. O. (1965). Hydromechanics of the dolphin. Adv. Hydrotcience a, 111-30.LABARBERA, M. & VOGEL, S. (1976). An inexpensive thermistor flowmeter for aquatic biology. Limnol.
Oceanogr. a i , 750-6.LBWI8, J. R. (1968). Water movements and their role in rocky shore ecology. Sartia 34, 13-36.MORDVINOV, Y. Y. (1973). Effects of hair in some species of true seals (family Phocidae) on overall
hydrodynamic drag. Zool Zh. 51, 3-6.NAOAI, S. (1973). Wave forces on structures. Adv. Hydrotcience 9, 354-334.RHOADS, D. C. & YOUNC, D. K. (1970). Influence of deposit-feeding organisms on sediment stability
and community trophic structure. J. mar. Ret. 38, 83-90.RICKBTTS, E. F. & CALVIN, J. (1968). Between Pacific Tidet, 4th edn., revised by J. W. Hedgepeth.
Stanford: Stanford University Press.RIEDL, R. J. (1971). Water movement. In Marine Ecology, vol. I, Pt. 3 (ed. O. Kinne), pp. 1085-8,
1134-56. London: Wiley-Interscience.RIEDL, R. J. & MACHAN, R. (1972). Hydrodynamic patterns in lotic intertidal sands and their bio-
climatological implications. Mar. Biol. 13, 179-209.Rioo, G. B. & MILLER, R. C. (1949). Intertidal plant and animal ronation in the vicinity of Neah Bay,
Washington. Proc. Calif. Acad. Set. a6, 323-51.ROUSE, H. (1961). Fluid Mechanics for Hydraulic Engineers. New York: Dover Publications, Inc.SCHWBNKE, H. (1971). Water movement - Plants. In Marine Ecology, vol. 1, pt. 3 (ed. O. Kinne), pp.
1091-121. London: Wiley-Interccience.SHAPIRO, A. H. (1961). Shape and Flow: The Fluid Dynamict of Drag. Garden City, New York: Double-
day and Co., Inc.SOUTHWARD, A. J. & ORTON, J. H. (1954). The effects of wave action on the distribution and numbers of
the commoner plants and animals living on the Plymouth breakwater. J. mar. biol. Ass. UJC. 33, 1-19.SVERDRUP, H. U., JOHNSON, M. W. & FLEMING, R. H. (1943). The Oceans: Their Physics, Chemistry, and
General Biology. New York: Prentice-Hall, Inc.TEREKHOVE, T. K. (1973). Effect of surf strength and current speed on the development of White Sea
fucoid algae. Hydrobiol. J. 8, 13-18.VIRK, P. S. (1976). Conformation^ effects in drag reduction by polymers. Nature, Lond. 00, 46.VOGEL, S. & LABARBERA, M. A new water tunnel design for biological investigations. (In preparation).WAINWRIOHT, S. A. & KOEHL, M. A. R. (1976). The nature of flow and the reaction of benthic cnidaria
to it. In Coelenterate Ecology and Behaviour (ed. G. O. Mackie), pp. 5-31. New York: Plenum Press.WELLS, C. S. (ed.) (1069). Viscous Drag Reduction. New York: Plenum Press.WIEOBL, R. L. (1064). Oceanographical Engineering. Englewood Cliffs, New Jersey: Prentice-Hall, Inc.ZERBE, W. B. & TAYLOR, C. B. (1953). Sea water density reduction tables. In Coast and Geodetic Survey
Special Publication, no. 298, pp. 18-19. Washington, D.C.: U.S. Department of Commerce.

Effects of sea anemones on the flow forces 103
APPENDIX. SAMPLE CALCULATIONS OF FLOW FORCES ONSEA ANEMONES
Given: density (p) of sea water at 10 °C = 1026 kg.m"8 (Zerbe & Taylor, 1953);viscosity (ji) of sea water at 10 °C = 1-39 x io^N.s .m-* (Sverdrup, Johnson &Fleming, 1942).
(Water temperatures in areas along the coast of Washington where the anemonesare found range from 5 to 16 °C (Connell, 1970).)
(A) Force on a 'typical' M. senileI modelled a M. senile as diagrammed in Fig. 13 A, thus
^D total = ^D oral disc ~^~ **Z> upper column '^D lower column*
The dimensions of this 'typical' M. senile were calculated from the mean heightof M. senile measured in the field {X = 0-38 m, s.D. = 0-09, n = 28) using the bodyproportions for M. senile listed in Table 1 of Koehl (1977). The flow velocities on theanemone were calculated for a mainstream velocity of 0-2 m. s - 1 using the ratios,listed on page 93, of mainstream velocity to velocity at different heights on M. senile.
The Re for this M. senile was calculated using equation (i),_ (iO26kg.m-3)(o*2om.s-1Xo-2i m) .Re = i s A 1\ <• = 3-1 x 10*.
1-39 x io~* N.s.m"*The acceleration of water over M. senile as the tidal current picks up is only of theorder of io~* m.s-1, thus I used equation (3) for the drag on a body in steady flowat high Re to calculate the flow force:
FD = iCoplPS,where CD = o-8 for a cylinder with a free end in steady flow at Re = io* (Rouse,1961), and where S = D.L for a cylinder. Thus,
FD oral duo = (o-5)(o-8Xio26 kg.m-3)^^ m.s-1)8 (0-201 m)(o-iO7 m )= 0-37 N,
FD upper column = (o-sXo-8)(io26 kg.m-»)(o-18 m.s"1)* (0-054 mXo-i37 m)= o-io N,
Slower column = (o-s)(o-8XiO26 kg.nr»)(o-i7 m.s"1)8 (0-084 mXo-137 m)= 0-14 N,
andFD total = 0-61 N.
(B) Force on a 'typical* A. xanthogrammica in an exposed channel
I modelled an 'exposed' A. xanthogrammica as diagrammed in Fig. 13B, thus
•** max total = •** max oral dUc ''"•*' max column-
The dimensions of this 'typical' exposed A. xanthogrammica were calculated from themean height of exposed A. xanthogrammica (x = 0-025 m> 8-D- = 0-009, n = 71)using the body proportions listed in Table 2 of Koehl (1977). The flow velocity usedon the oral disc was the mean maximum velocity (jf = 0-21 m.s"1, s.D. = 0-12, n =111) of surge recorded at the oral discs of exposed A. xanthogrammica during spring•od summer months. The velocity on the column was calculated using the mean
104 M. A. R. KOEHL
A B
T1 S Upper column
iS
i n Jlp; Lowcrcolumn 0-37 m.i-' - ^ > tdb>l»m-}M»0-014m Oraldiic0-24 m.»-. - i
0-084 m 10-057 m column
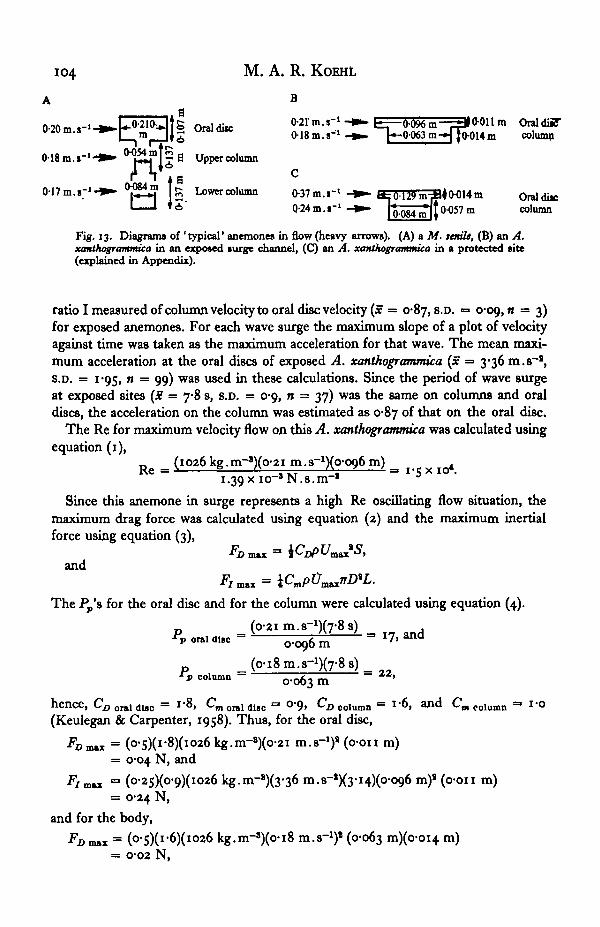
Fig. 13. Diagrams of 'typical' anemones in flow (heavy arrows). (A) a M. temU, (B) an A.xanthogrammka in an exposed surge channel, (C) an A. xanthogrammka in a protected site(explained in Appendix).
ratio I measured of column velocity to oral disc velocity (* = 0-87,8.0. •= 0-09, n = 3)for exposed anemones. For each wave surge the maximum slope of a plot of velocityagainst time was taken as the maximum acceleration for that wave. The mean maxi-mum acceleration at the oral discs of exposed A. xanthogrammka (X = 3-36 m.s-*,S.D. = 1*95, n = 99) was used in these calculations. Since the period of wave surgeat exposed sites (Jf = 7-8 s, S.D. = 0-9, n = 37) was the same on columns and oraldiscs, the acceleration on the column was estimated as 0-87 of that on the oral disc.
The Re for maximum velocity flow on this A. xanthogrammka was calculated usingequation (1),
Re = (1026 kg.m-»)(o-2i m.s^Xo-og^ m) = x IQ41.39 x io~* N.s.m"1
Since this anemone in surge represents a high Re oscillating flow situation, themaximum drag force was calculated using equation (2) and the maximum inertialforce using equation (3),
and^ m a *
The i y s for the oral disc and for the column were calculated using equation (4).
„ (0-21 m . s - ^ f a S )* = * 0-096 m
column - 0 .^3 m
hence, CDoniaiac = i-8, CmonlAltc = 0-9, CD oolumn = i-6, and Cmeolamn <=• i-o(Keulegan & Carpenter, 1958). Thus, for the oral disc,
FDmn = (0-5X1-8X1026 kg.m-8)^*1 m.s-1)8 (O-OII m)= 0-04 N, and
*/m»x = (0-25X0-9X1026 kg-m-^XS^o m - s - ^ - H X 0 ^ 6 m ) J (0<011 m )= 0-24 N,
and for the body,FD mar = (O-S)(I-6)(IO26 kg.m-»)(o-i8 m.s-1)1 (0-063 mXo-oi4 m)
= O-O2 N,

'Effects of sea anemones on the flow forces 105
indFi m»x = (O-25)(I;OXIO26 kg.m-3X2'92 m.s-1)(3-i4)(o-o63 m)» (0-014 m)
= 0-13 N.Thus,
FD m« total = °"°6 and FImsatoU)X «= 0-37.Since
11 max total
"X>maz total= 6-17 > 2, ^max total = °'4 N-
(C) Force on a 'typical' A. xanthogrammica in a protected site.
I modelled a 'protected' A. xanthogrammica as diagrammed in Fig. 13C.The dimensions of this 'typical' protected A. xanthogrammica were calculated from
the mean height of protected A. xanthogrammica. (x = 0-07 m, S.D. = 0-02, n = 25)and using the body proportions listed in Table 2 of Koehl (1977). The flow velocityused on the oral disc was the mean maximum velocity (* = 0-37 m.s"1, S.D. = 0-17,n = 154) of surge recorded at the oral disks of protected A. xanthogrammica duringspring and summer months. The velocity on the column was calculated using themean ratio of column velocity to oral disc velocity (x = o-68, s.p. =• 19, n = 5) forprotected anemones. The mean maximum acceleration at the oral discs of protectedA. xanthogrammica (x = 4-38 m.s~2, S.D. = 2-62, n = 118) was used in these calcula-tions, and the acceleration on the column was estimated to be 2-98 m.8~2. Theperiod of wave surge in protected areas (x = I-IO s, S.D. = i-8, n = 15) was used incalculating Pp.
The Re for maximum velocity flow in this A. xanthogrammica was calculated to be3-5x10*, thus the flow forces were calculated in the same manner as they were for the'exposed' A. xanthogrammica above. The calculated Fm&x total was 2-84 N.
