effects of residency and entertainment events on quality, satisfaction and future intentions: a...
TRANSCRIPT

Effects of Residency and Entertainment Events on Quality, Satisfaction and Future Intentions:
A Regional Visitor Survey in North Carolina
Kakyom Kim, Johnson & Wales University
Ann-Marie Weldon, Johnson & Wales University
Michael Applegate, Charlotte Regional Visitors Authority

Background• The arts and entertainment have been steadily growing
as a highly profitable revenue source for local communities.
• According to the US Census Bureau (2006), approximately 93 million adults attended classical music, opera or live theater performances during 2005, spending an estimated $12.7 billion.
• Americans for the Arts (2007), estimated that in 2006 Mecklenburg County’s nonprofit arts and culture organizations generated a $158 million annual economic impact and that 35% of attendees were non-residents.

Study Purposes
• To explore the significant differences in “show quality”, “service quality”, “quality of staff interaction”, “overall satisfaction” and “future intentions” between local and non-local visitors and across various event types.
• To better understand the extent to which Charlotte’s CRVA-managed public assembly facilities and events influence visitation to and the visitor experience in our destination.
• Evaluate effectiveness of various marketing & communications tools.

Bojangles’ Coliseum Ovens Auditorium

Bojangles’ Coliseum Ovens Auditorium

Methods• Research Instrument
– Captured respondents’ ratings on: quality of show, quality of services & facility areas, and quality of staff treatment/interaction
– Measured these elements using a five-point Likert-type scale (1=Poor to 5=Excellent)
– Respondents also rated Satisfaction using a five-point Likert-type scale (1=completely disagree to 5=completely agree)
– Future intentions were measured by asking respondents the likelihood that they would attend another event at these facilities or would recommend an event at these facilities to family or friends.

Methods
• Data Collection– Survey data came from the Charlotte Regional
Visitors Authority (CRVA) and included a variety of events at two different venues
– The survey covered the July 2006 to June 2007 timeframe (fiscal year 2007) and was administered to patrons who attended at least one event and provided an email address (TicketMaster purchase)
– Each month, event attendees were contacted via email and asked to participate by clicking on the web survey link provided

Methods
• Data Analysis– A total of 8,446 reliable responses were used for
analysis.
– Multivariate Analysis of Variance (MANOVA) was employed using SPSS 15.0 software.

Descriptive Results
Residency N %
Local Residents (NC) 6,430 76.1
Non Local Residents (Non-NC) 2,016 23.9
Show Type
Broadway 557 6.6
Comedy 638 7.6
Concert 3,868 45.8
Family 2,468 29.2
Other (sports, school, play, fine arts) 915 10.8
Information Resources Used
Email 2,184 25.9
Other (non venue) Websites 1,704 20.2
Radio 1,487 17.6
TV 1,191 14.1
Friend 997 11.8
Newspaper 821 9.7
Other 660 7.8
Print Brochure (mail) 389 4.6
Venue Website 315 3.7
Billboard 165 2.0
Posters/Flyers 133 1.6
Ticket Purchase Method
Internet 8,045 95.5
Box Office 337 4.0
Phone 42 0.5

Results: Mean Scores on Dimensions
Constructs/Indicators Mean Standard Deviation
Quality of the Show
Sound 4.39 0.93
Music 4.53 0.84
Lighting 4.36 0.89
Value 4.14 1.20
Overall Quality of the Show 4.27 1.11
Quality of the Services, Facility
Auditorium 4.17 0.95
Restrooms 3.99 0.95
Parking 3.97 1.01
Concessions 3.76 1.02
Ticket Services 4.23 0.85
Security 4.13 0.86
Quality of Staff Interaction
Ticket Takers 4.50 0.69
Ushers 4.43 0.83
Concessions 4.32 0.81
Overall Satisfaction
Overall Satisfaction with Venue Experience 4.38 0.99
Future Intentions
Attend Another Event 4.50 0.90
Recommend an Event to Friends/Relatives 4.44 0.94

Between Subject Effects: Quality Dimensions, Satisfaction & Future Intentions by ResidencyQuality of the Show by Residency Sum of
Squares dfMean
Squares F-Value p-value
Sound 34.705 1 34.705 38.347 0.000
Music 56.517 1 56.517 72.894 0.000
Lighting 44.670 1 44.670 52.749 0.000
Value 132.291 1 132.291 86.652 0.000
Overall Quality of the Show 131.339 1 131.339 96.782 0.000
Quality of the Services, Facility by Residency
Auditorium 17.461 1 17.461 18.612 0.000
Restrooms 20.422 1 20.422 22.182 0.000
Parking 51.045 1 51.045 50.245 0.000
Concessions 27.492 1 27.492 26.329 0.000
Ticket Services 13.770 1 13.770 18.646 0.000
Security 18.277 1 18.277 24.352 0.000
Quality of Staff Interaction by Residency
Ticket Takers 6.306 1 6.306 12.791 0.000
Ushers 1.996 1 1.996 3.005 0.083
Concessions 3.260 1 3.260 4.927 0.026
Overall Satisfaction by Residency
Overall Satisfaction with Venue Experience 32.209 1 32.209 39.234 0.000
Future Intentions by Residency
Attend Another Event 8.745 1 8.745 10.684 0.001
Recommend an Event to Friends/Relatives 10.260 1 10.260 11.255 0.001
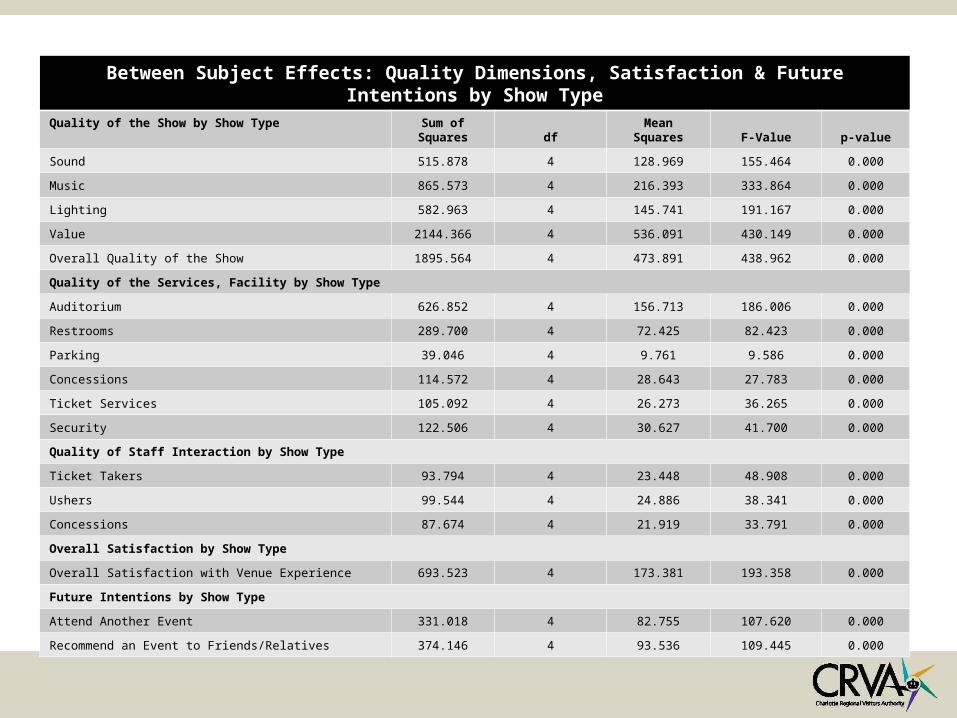
Between Subject Effects: Quality Dimensions, Satisfaction & Future Intentions by Show TypeQuality of the Show by Show Type Sum of
Squares dfMean Squares
F-Value p-value
Sound 515.878 4 128.969 155.464 0.000
Music 865.573 4 216.393 333.864 0.000
Lighting 582.963 4 145.741 191.167 0.000
Value 2144.366 4 536.091 430.149 0.000
Overall Quality of the Show 1895.564 4 473.891 438.962 0.000
Quality of the Services, Facility by Show Type
Auditorium 626.852 4 156.713 186.006 0.000
Restrooms 289.700 4 72.425 82.423 0.000
Parking 39.046 4 9.761 9.586 0.000
Concessions 114.572 4 28.643 27.783 0.000
Ticket Services 105.092 4 26.273 36.265 0.000
Security 122.506 4 30.627 41.700 0.000
Quality of Staff Interaction by Show Type
Ticket Takers 93.794 4 23.448 48.908 0.000
Ushers 99.544 4 24.886 38.341 0.000
Concessions 87.674 4 21.919 33.791 0.000
Overall Satisfaction by Show Type
Overall Satisfaction with Venue Experience 693.523 4 173.381 193.358 0.000
Future Intentions by Show Type
Attend Another Event 331.018 4 82.755 107.620 0.000
Recommend an Event to Friends/Relatives 374.146 4 93.536 109.445 0.000

Mean Scores on Quality Dimensions, Satisfaction & Future Intentions by ResidencyQuality of the Show by Residency Mean
Mean DifferencesNC
(n=4,767)Non-NC
(n=1,581)
Sound 4.33 4.50 -0.17
Music 4.45 4.67 -0.22
Lighting 4.29 4.49 -0.20
Value 4.01 4.34 -0.33
Overall Quality of the Show 4.15 4.48 -0.33
Quality of the Services, Facility by Residency
Auditorium 4.13 4.25 -0.12
Restrooms 3.96 4.09 -0.13
Parking 3.94 4.14 -0.20
Concessions 3.74 3.89 -0.15
Ticket Services 4.20 4.31 -0.11
Security 4.10 4.23 -0.13
Quality of Staff Interaction by Residency
Ticket Takers 4.49 4.55 -0.07
Ushers 4.44 4.48 -0.04
Concessions 4.31 4.37 -0.06
Overall Satisfaction by Residency
Overall Satisfaction with Venue Experience 4.33 4.51 -0.18
Future Intentions by Residency
Attend Another Event 4.47 4.56 -0.09
Recommend an Event to Friends/Relatives 4.41 4.51 -0.10

Mean Scores on Quality Dimensions, Satisfaction & Future Intentions by Show Type
Quality of the Show by Show Type Mean Values
Broadway Comedy Concert Family Others
Sound 4.50 4.66 4.54 3.92 4.55
Music 4.71 4.56 4.81 3.94 4.51
Lighting 4.62 4.52 4.51 3.86 4.54
Value 4.39 4.49 4.47 3.16 4.41
Overall Quality of the Show 4.58 4.60 4.59 3.35 4.48
Quality of the Services, Facility by Show Type
Auditorium 4.30 4.41 4.34 3.66 4.44
Restrooms 4.00 4.30 4.11 3.66 4.15
Parking 3.89 3.80 4.04 3.94 4.08
Concessions 3.82 3.80 3.85 3.57 3.95
Ticket Services 4.26 4.40 4.28 4.03 4.37
Security 4.15 4.26 4.21 3.92 4.28
Quality of Staff Interaction by Show Type
Ticket Takers 4.55 4.59 4.58 4.31 4.58
Ushers 4.51 4.56 4.52 4.25 4.54
Concessions 4.35 4.37 4.41 4.14 4.40
Overall Satisfaction by Show Type
Overall Satisfaction with Venue Experience 4.54 4.60 4.57 3.85 4.62
Future Intentions by Show Type
Attend Another Event 4.64 4.61 4.62 4.13 4.68
Recommend an Event to Friends/Relatives 4.57 4.58 4.57 4.05 4.66

Conclusions
• There are considerable differences in all dimensions between local and non-local visitors and across different types of entertainment events.
• Quality of restrooms, parking and concessions need to be addressed to the extent possible (55 year old venues).
• Quality dimensions of show, service/facility areas, and staff treatment were found to be reliable and
can be used in future tests.

Conclusions
• Email has been an effective marketing device in informing patrons of upcoming events.
• Evaluations show where (local) visitors are least satisfied. Event & facility managers, promoters can improve these areas to maximize (local) attendance.
• Venues hosted patrons from at least 34 different states during FY07, showing they can draw visitors.
• The differences in the quality dimensions, satisfaction and future intentions between local and non-local visitors and across show types can be used to create targeted marketing strategies.

Limitations & Future Study
• Data from surveys does not contain other demographic information aside from residency (address).
• Data from other event centers is needed to generalize visitor, patron behavior.
• Events and ticket sales are often influenced by seasonality. Future study should identify differences in perceptions on a monthly or a quarterly basis.