effects of reduced dietary protein and supplemented rumen
TRANSCRIPT
Effects of reduced dietary protein and supplemented rumen protected amino acids on the
nitrogen efficiency of dairy cows
Ashley Lorraine Bell
Thesis submitted to the faculty of the Virginia Polytechnic Institute and State University
in partial fulfillment of the requirements for the degree of
Master of Science
In
Dairy Science
Mark D. Hanigan, Chair
Jeffery E. Escobar
Michael L. McGilliard
September 30th
, 2011
Blacksburg, Virginia
Keywords: nitrogen efficiency, rumen protected amino acids, milk production, protein synthesis

Effects of reduced dietary protein and supplemented rumen protected amino acids on the
nitrogen efficiency of dairy cows
Ashley Lorraine Bell
ABSTRACT
Dairy cows are extremely inefficient at converting dietary nitrogen (N) to productive N.
Approximately 25-30% of dietary N is used for milk protein while the remaining N is lost to the
environment. According to National Research Council (NRC, 2001) recommendations, dairy
cow rations are formulated in terms of metabolizable protein (MP) which often causes many
amino acids (AA) to be fed in excess. A better understanding of protein and AA requirements
could help to improve the nitrogen efficiency of dairy cows. The objective of this work was to
examine the effects of feeding a low protein diet supplemented with rumen protected (RP) AA
on production and N efficiency of dairy cows. Twenty-four Holstein and 24 Holstein x Jersey
crossbred cows were used in a Youden square design consisting of 3 periods. Cows were
randomly assigned to one of 8 treatments: 1) a standard diet containing 17% crude protein
(+Con), 2) a 15% crude protein diet (-Con), 3) –Con plus RP methionine (+M, 16g/d), 4) –Con
plus RP lysine (+K, 47g/d), 5) –Con plus RP leucine (+L, 181g/d), 6) –Con plus RP methionine
and lysine (+MK), 7) –Con plus RP methionine and leucine (+ML), and 8) –Con plus RP
methionine, lysine, and leucine (+MKL). Cows fed the –Con as well as the +MKL diet
experienced a reduction in milk production and milk protein yield (P < 0.05). Dry matter intake
decreased only for those animals on the +ML diet (P < 0.05). Milk urea N (MUN) decreased for
all diets when compared to the +Con treatment (P < 0.05). In accordance with the decrease in
MUN, N efficiency was numerically increased in the diets supplemented with RP AA, but this
improvement was not significant. Phosphorylation of signaling proteins important for protein
synthesis were also examined. Animals fed the +MK treatment increased phosphorylated and

iii
total forms of eukaryotic elongation factor 2 (eEF2) when compared to the +Con and –Con (P <
0.05), but this increase in abundance did not affect the ratio of phosphorylated to total
abundance. Feeding dairy cows a low protein diet supplemented with RP AA has the ability to
alleviate the loss in milk production associated with feeding a low protein diet as well as to
increase nitrogen efficiency.

iv
ACKNOWLEDGEMENTS
I would like to thank my committee members for their constant guidance during
my research here at Virginia Tech. To my advisor, Dr. Hanigan, thank you for being so
willing to take me on as your first Masters’ student. I am grateful for your patience,
constructive criticism, ability to always make time for me as well as for your other
students, and contagious excitement for research. Thank you for everything. To Dr.
Escobar, thank you for convincing me to go to graduate school. Without your
persuasiveness, I would not have had the opportunity to enjoy this amazing experience.
Dr. McGilliard, thank you for all of your assistance on the statistics for my research. I
greatly appreciate all of the late night e-mails you would send to help me fix my SAS
code. Dr. Akers, thank you for your enthusiastic guidance, which has always kept me
interested in my research.
I also want to thank all of the members of the Dairy Science department faculty
and staff for all of their contributions during my time at Virginia Tech. I especially want
to thank Dr. Gwazdauskas. Your passion for teaching and for your students is such an
inspiration. I have enjoyed every minute of being your teaching assistant for the past two
years.
To Shane, Woody, Curtis and the rest of the VT dairy farm crew, thank you for all
of the fun times you have given me while out at the dairy. I will greatly appreciate your
willingness to always lend a helping hand whether it was to help me take blood samples,
set up the sample bottles before the 3:00 AM milkings, or fix the Data Ranger every time
it broke down.

v
To the Hanigan Lab, without all of you, none of this would have been possible.
Tara, thank you for generously running all of my GC-MS analyses and for your constant
help throughout my research. To Ranga, Joby, and Agustin, thank you for all of the
excitement and knowledge you have given me when it comes to research. To Sebastian,
Deepthi, Sandip, Michelle, and Tyler, thank you for all of your help whether on my
study, helping me out in the lab, or just answering my simple questions. I wish all of you
the best of luck in your future projects. To the undergrads: Katie, Emma, Carenda,
Holley, Niki, and Derek, you were the true backbone to my experiment. Without your
constant willingness to help during my trial, I would never have gotten everything
accomplished.
To Callie, thank you for being on this crazy ride with me. Through the good
times and bad, you have always been right by my side through it all. I greatly appreciate
your friendship over the past two years, and will cherish all the memories we have shared
together. Hayden, thank you for being a wonderful officemate. Your laid-back nature
and up-beat personality are characteristics I have always admired about you. Emily,
Brittany, Kayla, Jamie, Andrea, Jen, Christina, Liying, Partha, Manisha, Becky, and to all
the recent graduates, thanks for all of the laughs, smiles, and words of encouragement I
have received from each of you during my time here. I will miss each and every one of
you.
To Dave McKee, Will Petersen, Tony Marinello, and all of the Marching
Virginians, thank you for being my home away from home. Being a part of such a
wonderful organization has blessed me with a multitude of memories that I will never
forget.

vi
Finally, I would like to thank my family whose endless love and support has
given me the determination to overcome any obstacle that gets in my way as well as the
drive to always do my best. Mom, thank you for always being a phone call away. Your
constant guidance and encouraging words were always heard and appreciated. I greatly
value our relationship, and know that without you I would not be the person I am today.
Dad, thank you for always encouraging me to follow my dreams. I greatly appreciate all
of the care packages you sent on holidays or just when you knew I was feeling
overwhelmed. Aaron, I could never repay you for all of the support and confidence you
have given me over the past year. I hope I have made all of you proud.

vii
TABLE OF CONTENTS
Page
Title ………………………………………………………………………... i
Abstract ……………………………………………………………………. ii
Acknowledgements ………………………………………………... ……....iv
Table of Contents ………………………………………………………….. vii
List of Tables ……………………………………………………………….viii
List of Figures ………………………………………………………............ix
CHAPTER 1: Introduction ………………………………………………... 1
CHAPTER 2: Review of Literature ……………………………………….. 4
Impact of Nitrogen on the Environment …………………………... 4
Improving Nitrogen Efficiency of Dairy Cows …………………… 5
Protein Requirements of Dairy Cattle ……………………………... 6
Amino Acid Supplementation to Dairy Cattle Diets ……………… 7
The mTOR Pathway and Effects of Amino Acids on Regulation … 9
Hypothesis ………………………………………………………… 11
References …………………………………………………………. 12
CHAPTER 3: Effects of reduced dietary protein and supplemented
rumen protected amino acids on the nitrogen efficiency of dairy cows ……18
Abstract ……………………………………………………………. 18
Introduction ………………………………………………………... 19
Materials and Methods …………………………………………….. 21
Results and Discussion ……………………….…………………….25
Conclusions ………………………………………………………... 33
Acknowledgements ………………………………………………... 33
References …………………………………………………………. 33
CHAPTER 4: Conclusions and Implications……………..………………... 48
Appendix: Anova Table for Statistical Model……………………………... 49

viii
LIST OF TABLES
Table 1. Dietary formulas and nutrient compositions, and predicted nutrient
requirements as determined from NRC (2001)…………………………….. 38
Table 2. Observed chemical composition of major feed ingredients used in
experimental diets………………………………………………………….. 39
Table 3. Observed chemical composition of experimental diets (% DM basis)…… 40
Table 4. Least squares means of intakes, milk production and composition, body
weight, and nitrogen efficiency for lactating dairy cows fed experimental
diets………………………………………….……………………………... 41
Table 5. Duodenal flows of digestible essential amino acids as predicted by NRC
2001/CPM Dairy 5.0 from experimental diets………....……………...…… 42
Table 6. Concentrations of free AA in plasma of cows fed experimental diets…. 43
Table 7. Effects of experimental diets on the relative abundance of signaling proteins in
mammary biopsies…………………………………………………………. 44
Table 8. Effect of signaling proteins on milk protein production in dairy cows…... 45

ix
LIST OF FIGURES
Figure 1. Representative Western blot images of the phosphorylated forms (P) of
analyzed signaling proteins from mammary biopsies……………………………… 46
Figure 2. Representative Western blot images of the total forms (T) of analyzed
signaling proteins from mammary biopsies………………………………... 47

1
CHAPTER 1
INTRODUCTION
Ammonia emissions from concentrated animal feeding operations (CAFO) are a
significant source of N pollution to the environment. Excretion of N contaminates
ground and surface water and enters the atmosphere leading to acid rain, climate change,
and human health concerns (Tamminga, 1992; Pope et al., 2002). Dairy cows make large
contributions to this pollution due to poor N utilization. Approximately 30% of dietary N
consumed by dairy cows is converted to milk protein while the remaining 70% is
excreted in the urine and feces (Chase, 1994; Tamminga, 1992). This inefficiency in N
utilization by dairy cows is partially caused by feeding protein above the amount required
by the animal. Overfeeding of protein and the loss of excess N to the environment is a
concern to producers as protein is typically an expensive nutrient in dairy cow rations
(Brown and Arscott, 1960; Clark et al., 1987). An improvement in N efficiency would
reduce dairy contributions to pollution and may decrease feed costs for farmers.
The National Research Council (NRC; 2001) recommendations for protein
requirements are defined in terms of metabolizable protein (MP). Feeding according to
NRC requirements of MP may overestimate the need for many AA to ensure maximum
levels of milk production are achieved. Unlike swine and poultry, there are no defined
AA requirements for dairy cows. Determining AA requirements for dairy cows is
challenging because of the variety of feedstuffs used in rations and the remodeling of
nutrients by rumen microbes (Lapierre et al., 2006). Obtaining accurate AA estimates for
dairy cows would allow the feeding of lower crude protein (CP) diets supplemented with

2
specific AA to support milk production and milk protein synthesis, which is the strategy
used in the swine and poultry industries.
In grass silage diets, histidine appears to be a limiting AA for milk production;
however, corn-based diets, used predominately in the United States, are most limiting in
methionine (Met) and lysine (Lys). Numerous production experiments have been
conducted to determine the effects of adding Met and Lys on milk yield and milk protein
production. Fisher (1972) observed an increase in protein yield with jugular infusion of
Met compared to saline infusions (P < 0.05). Jugular infusion of the combination of Met
and Lys increased protein yield and content compared to a saline infusion (P < 0.05)
(Appuhamy et al., 2011). In addition, supplementing a 16.1% CP diet with 10 g/d of
rumen-protected (RP) Met caused an increase in milk production and improved N
efficiency compared to animals on a 18.6% CP diet with no RP Met supplementation (P
< 0.05) (Broderick et al., 2008). A combination of RP Met and Lys also numerically
increased milk protein and milk fat when compared to a diet without supplementation
(Broderick et al., 2008).
The addition of leucine (Leu) has also been shown to improve production
characteristics. Duodenal infusions of 40 g/d of Leu increased milk protein content and
yield when corn-based diets were sufficient in Lys or Met (P < 0.05) (Rulquin and
Pisulewski, 2006). Determination of limiting AA would help in the creation of an AA
profile that could be used to supplement low protein diets with specific AA for milk
production.
In addition to AA being used as the building blocks for proteins, AA have been
shown to activate protein synthesis through the mammalian target of rapamycin (mTOR)

3
pathway. Amino acid supply has been shown to activate mTOR along with hormones,
growth factors, and energy supply (Wang and Proud, 2006). Activation of mTOR leads
to the subsequent phosphorylation of p70 S6 kinase (S6K1), ribosomal protein S6 (rpS6),
eukaryotic initiation factor 4E binding protein 1 (4EBP1), and the dephosphorylation of
eukaryotic elongation factor 2 (eEF2).
Leucine specifically had significant effects on the stimulation of mTOR when
added to AA deficient media (Kimball, 2001). Leucine has also been shown to activate
mTOR signaling in skeletal muscle cells of neonatal pigs (Escobar et al., 2006).
Therefore, addition of Leu increases protein synthesis rates through the activation of the
mTOR pathway. Based on the above findings, one would expect that the addition of AA
and specifically Leu to dairy cow diets would increase both protein synthesis rates and
milk protein yield.
The objective of this experiment was 1) to determine whether supplementation of
RP Met, Lys, Leu, or combinations of these AA could alleviate the loss in milk
production associated with feeding a low protein diet, and 2) to examine the effects of a
low protein diet and RP AA on cell signaling proteins which regulate protein synthesis.
The overarching goal of this work is to improve the nitrogen efficiency of dairy cows.

4
CHAPTER 2
REVIEW OF LITERATURE
Impact of Nitrogen on the Environment
Nitrogen is a significant source of pollution to the atmosphere as well as
waterways. Nitrate (NO-3) can leech into the soil and contaminate groundwater and
pollute surface waters through runoff (NRC, 2001). Ammonia (NH3) released into the
atmosphere can result in acid rain and eutrophication. In addition, volatilized NH3 in the
atmosphere contributes to the formation of fine particulate matter. These particles can
decrease visibility and air quality, and increase human health problems (Pope et al.,
2002). Graff et al. (2009) determined that fine particulate matter induces pulmonary
inflammation in healthy young adults. There has also been an increased incidence of
wheezing and asthma diagnoses in children attending schools near farms with high levels
of NH3 (Mirabelli et al., 2006; Sigurdarson and Kline, 2006). Radon et al. (2001) also
concluded that farmers exposed to high NH3 production experienced a higher rate of
chronic respiratory diseases such as chronic bronchitis. Animal health and production
can also be affected by high NH3 levels. Beker et al. (2004) observed that poultry
exposed to NH3 exhibit lower performance and increased disease susceptibility.
Therefore, decreasing the amount of nitrogen pollution from NO-3 and NH3 would
improve waterways and air quality as well as animal and human health.
The United States Environmental Protection Agency (EPA) has implicated
concentrated animal feeding operations (CAFO) as a leading contributor of NH3
emissions. Battye (1994) concluded that livestock contribute approximately 80% of the

5
NH3 emissions in the United States, of which cattle are the biggest contributor.
Specifically, dairy cows are responsible annually for 19.9% and 23.1% of the global and
national NH3 emissions, respectively (Ritz et al., 2004). Kebreab et al. (2001)
determined on average dairy cows release approximately 150 g of N in urine per day. In
addition, 40-50% of dairy cow manure N is made up of urea and NH3 (NRC, 2001). Van
Horn et al. (1994) concluded that 50-75% of the N lost to the environment is released as
NH3 before NO-3 can be produced. Improving the N retention of dairy cows is one
potential strategy to control NH3 emissions to the environment.
Improving Nitrogen Efficiency of Dairy Cows
Dairy cows are particularly inefficient at converting dietary N to productive N.
Approximately 30% of N intake is converted to milk N, while the remaining is lost to the
environment in urine and feces (Tamminga et al., 1992; Chase, 1994). Nutritional
strategies should be used to improve the N efficiency of dairy cows.
Decreasing dietary protein has been repeatedly shown to improve N efficiencies
for dairy cows. Ipharraguerre and Clark (2005) reported that increasing dietary crude
protein (CP) from 14.8% to 18.7% decreased N efficiency from 33% to 25%.
Additionally, reducing dietary N from 11% to 9.6% caused a decline in NH3 emissions
from the manure of Holstein heifers (James et al., 1999). Rius et al. (2008) concluded
that reducing CP from 18.7% to 15.5% while maintaining a high energy level of 1.55
Mcal increased N efficiency from 37.1% to 43.0% with only a tendency for a reduction in
milk production.

6
While feeding reduced dietary protein increases N efficiency, it often negatively
impacts milk production. Kalscheur et al. (2006) observed an increase in N efficiency
from 28.2% to 36.5% associated with a decrease in dietary CP from 17.1% to 12.3%;
however, the N reduction also caused a decrease in production. Klusmeyer (1990) also
reported a loss in milk production when CP was lowered from 14.5% to 11%. A better
understanding of the protein requirements of dairy cows would help reduce harmful N
pollution to the environment while still maintaining a high level of production.
Protein Requirements of Dairy Cattle
Dairy cows have requirements for 10 of the 21 amino acids (AA). These 10 AA
are arginine (Arg), histidine (His), isoleucine (Ile), leucine (Leu), lysine (Lys),
methionine (Met), phenylalanine, threonine, tryptophan, and valine (Val) (NRC, 2001).
These AA are classified as essential because they cannot be produced in body at a rate
adequate to support needs for maintenance, growth, and production. While dairy cows
require specific AA, no defined AA requirements have been established. Lapierre et al.
(2006) indicated the usage of a variety of feed products and the remodeling of nutrients in
the rumen by microorganisms as a challenge for determining AA requirements for
ruminants. The current NRC (2001) protein requirements for dairy cows are therefore
defined in terms of metabolizable protein (MP). When cows are fed acceptable levels of
MP for production, many AA are fed in excess. Overfeeding AA is important because
protein has been identified as one of the most expensive nutrients in dairy cow diets
(Brown and Arscott, 1960; and Clark et al., 1987). Feeding excessive protein results in

7
increased production input costs as well as decreases in N efficiency compared to other
production animal species.
Monogastric species, such as swine and poultry, have greater N efficiencies
compared to dairy cows. Rotz (2004) reported that N efficiency of pigs and poultry is
approximately 35% or higher. Bequette et al. (2003) calculated that N efficiency of
growing pigs was about 33%, while growing broilers and egg-laying hens were 45% and
34% efficient, respectively. This improvement in N conversion is associated with precise
AA requirements for monogastric species allowing for more accurate diet formulation.
Swine and poultry producers are able to supply low protein diets supplemented with the
specific AA needed to maintain production (Baker, 1997). Determination of dairy cow
AA requirements would allow for the application of this kind of approach in dairy
nutrition and ration formulation.
Amino Acid Supplementation to Dairy Cattle Diets
Supplementation of individual AA necessary for milk production to low protein
diets would increase N efficiency and reduce N excretions to the environment. Instead of
feeding high protein diets, adding individual AA allows for the feeding of a minimal
amount of N in dairy cow diets. Noftsger and St-Pierre (2003) concluded that providing
absorbed AA similar to the required AA for milk protein synthesis can improve N
utilization.
In corn based diets, typically utilized in the United States, Met and Lys seem to be
the most limiting for milk protein synthesis, while His appears to be limiting in grass
silage diets. Clark (1987) and Schwab et al. (1976) observed the most deficient
8
intestinally available AA to be Met and Lys. Lactating dairy cows infused postruminally
with Met showed linear increases in milk protein yield and content when Met
concentrations increased from 6 g/d to 12 g/d (Pisulewski et al., 1996). Leonardi et al.
(2003) observed that dairy cow diets supplemented with ruminally protected (RP) Met
increased milk protein concentration. Furthermore, the addition of RP Met increased
milk fat and protein content (Misciattelli et al., 2003). A meta-analysis of 129 RP Met
studies determined that supplementation increased milk protein content and yield and
slightly increased milk production (Patton, 2010).
In addition to Met supplementation alone, the addition of Lys in combination with
Met also increases lactational performance in dairy cows. Abomasal infusion of a
combination of Met and Lys improved milk protein synthesis in lactating dairy cows
(Seymour et al., 1990; Weekes et al., 2006). Weekes et al. (2006) also saw that infusion
of Met and Lys caused a 35% reduction in dry matter intake due to an imbalance in AA
supply. The supplementation of Met and Lys increased milk production, protein yield,
milk fat content, and N efficiency in Chinese Holstein cattle above that of the control,
Met, and Lys treatments (Wang, et al., 2010). Also, lactating dairy cows supplemented
with RP Met plus Lys showed increased milk protein and fat production during lactation
(Robinson et al., 1998; Robinson et al., 1995); however, supplementation of Lys alone
resulted in equivalent production to that of the unsupplemented treatment (Robinson et
al., 1998). Socha et al. (2005) observed an increase in milk, milk fat, and milk protein
yields with the supplementation of RP Met and Lys compared to the basal and Met
treatments. The combination of Met and Lys to dairy cattle rations appears to have
additive effects on milk production characteristics.

9
Dairy cattle rations also may be deficient in branched chain AA (BCAA) and in
particular Leu. Rulquin and Pisulewski (2006) observed that duodenal infusion of 40 g/d
of Leu increased milk protein content and yield. However, reports have been inconsistent
with the findings of Rulquin and Pisulewski (2006). Korhonen et al. (2002) concluded
that abomasal infusion of His and BCAA to dairy cows feed grass silage diets did not
increase milk protein yield. Additionally, Appuhamy et al. (2011) saw no differences in
milk protein yield or content between animals infused with Met plus Lys and animals
infused with the combination of Met, Lys, and BCAA. When animals were
supplemented with RP Leu in addition to Met and Lys, there were no differences in DMI,
milk yield, milk protein, milk fat, lactose, and urea (Křižova et al., 2008). Each of these
studies implied that BCAA or Leu provided no additional benefits when supplemented to
lactating dairy cow rations; however, Leu has been shown to increase protein synthesis
rates through cellular signaling activation in cultured cells and in other species (Avruch et
al., 2009).
The mTOR Pathway and Effects of Amino Acids on Regulation
The mammalian target of rapamycin (mTOR) is a multidomain protein with
kinase activity specific to phosphorylation of proteins at serine and threonine residues
(Wang and Proud, 2006). Raptor and rictor bind with mTOR to form the complexes
mTORC1, which is sensitive to the effects of rapamycin, and mTORC2, which is
rapamycin insensitive, respectively (Sarbassov, 2005; Yang et al., 2006). Protein
synthesis is regulated through the mTORC1 signaling cascade. Activation of the mTOR

10
pathway through mTORC1 is caused by a variety of controls including hormones, growth
factors, energy status, and AA supply (Wang and Proud, 2006).
Activation of mTOR causes the phosphorylation of direct downstream substrates,
p70 S6 kinase (S6K1) and eukaryotic initiation factor 4E binding protein 1 (4EBP1)
(Avruch et al., 2009). Phosphorylation of S6K1 and hyperphosphorylation of 4EBP1
increase rates of protein synthesis. Activation of S6K1 causes the phosphorylation of
ribosomal protein S6 which enhances mRNA translation and increases ribosomal
biogenesis, while 4EBP1 phosphorylation allows for the release of eukaryotic initiation
factor (eIF) 4E to form the active eIF4F complex with eIF4G to facilitate the binding of
mRNA to the 40S ribosomal subunit (Bolster et al., 2004; Kimball, 2001). Additionally,
mTOR appears to regulate the phosphorylation of eukaryotic elongation factor 2 (eEF2)
through eEF2 kinase. Phosphorylation of eEF2 kinase by S6K1 causes
dephosphorylation and activation of eEF2 which enhances translation elongation (Proud,
2004). Increased phosphorylation of eIF2α by general non-repressible kinase 2 (GCN2)
appears to be independent of the mTOR pathway, and causes inactivation of eIF2β which
decreases mRNA translation (Kimball, 2001).
Amino acids positively regulate mTOR signaling. Orellana et al. (2007)
determined that increased AA supply to neonatal pigs increased skeletal muscle protein
synthesis and increased phosphorylation of mTOR, 4EBP1, and S6K1. However,
abomasal infusion of casein had no effect on the phosphorylation of rpS6 or mTOR in
bovine mammary tissue (Rius et al., 2010). Hara et al. (1998) observed rapid
deactivation of S6K1 and decreased phosphorylation of 4EBP1 when AA were
withdrawn from CHO-IR cells. In MAC-T cells and mammary tissue slices, addition of

11
essential AA affected translation initiation and elongation through the activation of
mTOR, S6K1, and 4EBP1, and the dephosphorylation of eEF2 and eIF2α (Appuhamy et
al., 2011).
Supplementations of individual AA can also regulate protein synthesis rates.
Avruch et al. (2009) found that withdrawal of Leu or Arg from media deactivates mTOR
as effectively as the removal of all AA. Escobar et al. (2006) observed stimulation of
skeletal and cardiac muscle protein synthesis due to increases in Leu concentrations.
However, Moshel et al. (2006) indicated that phosphorylation of 4EBP1 and S6K1 were
more affected by complete AA withdrawal than by withdrawal of Leu alone. While Leu
has been shown to increase protein synthesis in skeletal muscle, little work has been done
with mammary tissue of lactating dairy cows fed diets with specific AA contents.
Toerien et al. (2010) infused dairy cows with various AA and collected mammary
biopsies. They observed a 71% and 61% increase in phosphorylation of S6K1 with the
infusion of Leu and Met plus Lys, respectively. Additionally, Leu showed a 101%
increase in rpS6 activation and Met plus Lys showed a 95% increase. In our experiment
we looked at these same AA effects in mammary biopsies, but with the feeding of RP AA
rather than intravenous infusion.
Hypothesis
We hypothesized that lactational performance could be maintained following a
reduction in dietary CP if supplemented with individual or combinations of RP Lys, Met,
and Leu. We also hypothesized that diets supplemented with RP AA would also increase
dairy cow N efficiency compared with cows fed a high protein diet. In addition, we
12
hypothesized that supplementation of RP AA would increase the cellular signals
necessary for protein synthesis in mammary epithelial cells.
REFERENCES
Appuhamy, J. A. D. R. N., J. R. Knapp, O. Becvar, J. Escobar, M. D. Hanigan. 2011.
Effects of jugular-infused lysine, methionine, and branched-chain amino acids on
milk protein synthesis in high-producing dairy cows. J. Dairy Sci. 94(4): 1952-
1960.
Appuhamy, J. A. D. R. N., A. L. Bell, W. A. D. Nayananjalie, J. Escobar, and M. D.
Hanigan. 2011. Essential amino acids regulate both initiation and elongation of
mRNA translation independent of insulin in MAC-T cells and bovine mammary
tissue slices. J. Nutr. 141: 1209-1215.
Avruch, J., X. Long, S. Ortiz-Vega, J. Rapley, A. Papageorgiou, and N. Dai. 2009.
Amino acid regulation of TOR complex 1. Am J Physiol Endocrinol Metab
296(4):E592-602.
Battye, R., W. Battye, C. Overcash, and S. Fudge. 1994. Development and Selection of
Ammonia Emissions Factors. in Report No. EPA/600/R-94/190. Washington, DC:
Office of Research and Development, U.S. Environmental Protection Agency.
Beker, A., S. L. Vanhooser, J. H. Swartzlander, and R. G. Teeter. 2004. Atmospheric
ammonia concentration effects on broiler growth and performance. J. Appl. Poult.
Res. 13:5-9.
Bequette, B. J., M. D. Hanigan, and H. Lapierre. 2003. Mammary uptake and metabolism
of amino acids by lactating ruminants. Page 347 in Amino acids in farm animal
nutrition. J. P. F. D'Mello, ed. CABI Publishing, Wallingford, UK.
Bolster, D. R., L. S. Jefferson, and S. R. Kimball. 2004. Regulation of protein synthesis
associated with skeletal muscle hypertrophy by insulin-, amino acid- and
exercise-induced signaling. Proc. Nutr. Soc. 63: 351-356.
Brown, W. G. and G. H. Arscott. 1960. Animal production functions and optimum ration
specifications. J. of Farm Econ. 42: 69-78.
Chase, L.E. 1994. Environmental considerations in developing dairy rations. In: Proc.
Cornell Nutr. Conf. Feed Manuf., Syracuse, NY, USA. Cornell Univ., Ithaca, NY,
USA, pp. 56-62.

13
Clark, J. H., M. R. Murphy, and B. A. Crooker. 1987. Supplying the protein needs of
dairy cattle from by-product feeds. J. Dairy Sci. 70: 1092-1109.
Escobar, J., J. W. Frank, A. Suryawan, H. V. Nguyen, S. R. Kimball, L. S. Jefferson, and
T. A. Davis. 2006. Regulation of cardiac and skeletal muscle protein synthesis by
individual branched-chain amino acids in neonatal pigs. Am J Physiol Endocrinol
Metab 290(4):E612-621.
Graff, D. W., W. E. Cascio, A. Rappold, H. Zhou, Y. T. Huang, and R. B. Devlin. 2009.
Exposure to concentrated course air pollution particles causes mild
cardiopulmonary effects in healthy young adults. Environ. Health Perspect. 117:
1089-1094.
Hanigan, M. D., J. P. Cant, D. C. Weakley, and J. L. Beckett. 1998. An evaluation of
postabsorptive protein and amino acid metabolism in the lactating dairy cow. J.
Dairy Sci. 81(12):3385-3401.
Hara, K., K. Yonezawa, Q. P. Weng, M. T. Kozlowski, C. Belham, and J. Avruch. 1998.
Amino acid sufficiency and mTOR regulate p70 S6 kinase and eIF-4E BP1
through a common effector mechanism. J Biol Chem 273(23):14484-14494.
Ipharraguerre, I. R. and J. H. Clark. 2005. Varying protein and starch in the diet of dairy
cows. II. effects on performance and nitrogen utilization for milk production. J.
Dairy Sci. 88(7): 2556-2570.
James, T., D. Meyer, E. Esparza, E. J. Depeters, and H. Perez-Monti. 1999. Effects of 20
dietary nitrogen manipulation on ammonia volatilization from manure from
Holstein heifers. J. Dairy Sci. 82(11): 2430-2439.
Kalscheur, K. F., R. L. Baldwin, B. P. Glenn, and R. A. Kohn. 2006. Milk production of
dairy cows fed differing concentrations of rumen-degraded protein. J. Dairy Sci.
89(1): 249-259.
Kebreab, E., J. France, D. E. Beever, and A. R. Castillo. 2001. Nitrogen pollution by
dairy cows and its mitigation by dietary manipulation. Nutrient Cycling in
Agroecosystems 60(1):275-285.
Kimball, S. R. 2001. Regulation of translation initiation by amino acids in eukaryotic
cells. Prog Mol Subcell Biol 26:155-184.
Klusmeyer, T. H., R. D. J. McCarthy, J. H. Clark, and D. R. Nelson. 1990. Effects of
source and amount of protein on ruminal fermentation and passage of nutrients to
the small intestine of lactating cows. J. Dairy Sci. 73: 3526-3537.
Korhonen, M., A. Vanhatalo, and P. Huhtanen. 2002. Evaluation of isoleucine, leucine,

14
and valine as a second-limiting amino acid for milk production in dairy cows fed
grass silage diet. J. Dairy Sci. 85(6): 1533-1545.
Křižova, L., J. Třinácty, M. Richter, S. Hadrová, J. Pozdíšek. 2008. Effect of ruminally-
protected leucine supplement on milk yield and plasma amino acids in dairy
cows. J. Agricultural and Food Science. 17: 351-359.
Lapierre, H., D. Pacheco, R. Berthiaume, D. R. Ouellet, C. G. Schwab, P. Dubreuil, G.
Holtrop, and G. E. Lobley. 2006. What is the true supply of amino acids for a
dairy cow? J. Dairy Sci. 89 Suppl 1(1):E1-14.
Leonardi, C., M. Stevenson, and L. E. Armentano. 2003. Effect of two levels of crude
protein and methionine supplementation on performance of dairy cows. J. Dairy
Sci. 86: 4033-4042.
Métayer-Coustard, S., H. Mameri, I. Seiliez, S. Crochet, P. Crépieux, Y. Mercier, P. A.
Geraert, and S. Tesseraud. 2010. Methionine deprivation regulates the S6K1
pathway and protein synthesis in avian QM7 myoblasts without activating the
GCN2/eIF2α Cascade. J. Nutr. 140: 1539-1545.
Mirabelli, M. C., S. Wing, S. W. Marshall, and T. C. Wilcosky. 2006. Asthma symptoms
among adolescents who attend public schools that are located near confined swine
feeding operations. Pediatrics 118: e66-e75.
Misciattelli, L., V. F. Kristensen, M. Vestergaard, M. R. Weisbjerg, K. Sejrsen, and T.
Hvelplund. 2003. Milk production, nutrient utilization, and endocrine responses to
increased postruminal lysine and methionine supply in dairy cows. J. Dairy Sci.
86: 275-286.
Moshel, Y., R. E. Rhoads, and I. Barash. 2006. Role of amino acids in translational
mechanisms governing milk protein synthesis in murine and ruminant mammary
epithelial cells. J Cell Biochem 98(3):685-700.
Nobukuni, T., M. Joaquin, M. Roccio, S. G. Dann, S. Y. Kim, P. Gulati, M. P. Byfield, J.
M. Backer, F. Natt, J. L. Bos, F. J. Zwartkruis, and G. Thomas. 2005. Amino
acids mediate mTOR/raptor signaling through activation of class 3
phosphatidylinositol 3OH-kinase. Proc Natl Acad Sci USA 102(40):14238-14243.
Noftsger, S., and N. R. St-Pierre. 2003. Supplementation of methionine and selection of
highly digestible rumen undegradable protein to improve nitrogen efficiency for
milk production. J. Dairy Sci. 86: 958-969.
NRC. 2001. Nutrient Requirements of Dairy Cattle.
NRC. 2003. Air Emissions from Animal Feeding Operations: Current Knowledge, Future
Needs., Washington, DC: The National Academies Press.

15
Orellana, R. A., A. Jeyapalan, J. Escobar, J. W. Frank, H. V. Nguyen, A. Suryawan, and
T. A. Davis. 2007. Amino acids augment muscle protein synthesis in neonatal
pigs during acute endotoxemia by stimulating mTOR-dependent translation
initiation. Am. J. Physiol. Endocrinol. Metab. 293: E1416-E1425.
Patton, R. A. 2010. Effect of rumen-protected methionine on feed intake, milk
production, true milk protein concentration, and true milk protein yield, and the
factors that influence these effects: A meta-analysis. J. Dairy Sci. 93: 2105-2118.
Pisulewski, P. M., H. Rulquin, J. L. Peyraud, and R. Verite. 1996. Lactational and
systemic responses of dairy cows to postruminal infusions of increasing amounts
of methionine. J. Dairy Sci. 79: 1781-1791.
Pope, C. A., III, R. T. Burnett, M. J. Thun, E. E. Calle, D. Drewski, K. Ito, and G. D.
Thurston. 2002. Lung cancer, cardiopulmonary mortality, and long-term exposure
to fine particulate air pollution. J. Am. Med. Assoc. 287(9): 1132-1141.
Proud, C. G. 2004. mTOR-mediated regulation of translation factors by amino acids.
Biochem. Biophys. Res. Commun. 313(2):429-436.
Radon, K., B. Danuser, M. Iversen, R. Jörres, E. Monso, U. Opravil, C. Weber, K. J.
Donham, D. Nowak. 2001. Respiratory symptoms in European animal farmers.
Eur. Respir. J. 17: 747-754.
Ritz, C. W., B. D. Fairchild, and M. P. Lacy. 2004. Implications of ammonia production
and emissions from commercial poultry facilities: a review. J. Appl. Poult. Res.
13: 684-692.
Rius, A. G., M. L. McGilliard, C. A. Umberger, and M. D. Hanigan. 2010. Interactions of
energy and predicted metabolizable protein in determining nitrogen efficiency in
the lactating dairy cow. J. Dairy Sci. 93: 2034-2043.
Rius, A. G., J. A. D. R. N. Appuhamy, J. Cyriac, D. Kirovski, J. Escobar, M. L.
McGilliard, B. J. Bequette, R. M. Akers, and M. D. Hanigan. 2010. Regulation of
protein synthesis in mammary glands of lactating dairy cows by starch and amino
acids. J. Dairy Sci. 93: 3114-3127.
Robinson, P. H., W. Chalupa, C. J. Sniffen, W. E. Julien, H. Sato, K. Watanabe, T.
Fujieda, and H. Suzuki. 1998. Ruminally protected lysine or lysine and
methionine for lactating dairy cows fed a ration designed to meet requirements for
microbial and postruminal protein. J. Dairy Sci. 81: 1364-1373.
Robinson, P. H., A. H. Fredeen, W. Chalupa, W. E. Julien, H. Sato,T. Fujieda, and H.
Suzuki. 1995. Ruminally protected lysine and methionine for lactating dairy cows

16
fed a diet designed to meet requirements for microbial and postruminal protein. J.
Dairy Sci. 78:582–594.
Rotz, C. A. 2004. Management to reduce nitrogen losses in animal production. J Anim
Sci 82 E-Suppl(137):E119-137.
Rulquin, H. and P. M. Pisulewski. 2006. Effects of graded levels of duodenal infusions of
leucine on mammary uptake and output in lactating dairy cows. J. of Dairy
Research 73(03):328-339.
Sarbassov, D.D., S. M. Ali, and D. M. Sabatini. 2005. Growing roles for the mTOR
pathway. Current Opinion in Cell Biology 17: 596-603.
Schwab C. G., L. D. Satter, B. Clay. 1976. Response to lactating dairy cows to abomasal
infusion of amino acids. J. Dairy Sci. 59:1254–1270
Seymour, W. M., C. E. Polan, and J. H. Herbein. 1990. Effects of dietary protein
degradability and casein or amino acid infusions on production and plasma amino
acids in dairy cows. J. Dairy Sci. 73: 735-748.
Sigurdarson, S. and J. N. Kline. 2006. School proximity to concentrated animal feeding
operations and prevalence of asthma in students. Chest 129: 1486-1491.
Socha, M. T., D. E. Putnam, B. D. Garthwaite, N. L. Whitehouse, N. A. Kierstead, C. G.
Schwab, G. A. Ducharme, and J. C. Robert. 2005. Improving intestinal amino
acid supply of pre- and postpartum dairy cows with rumen-protected methionine
and lysine. J. Dairy Sci. 88(3):1113-1126.
Tamminga, S. 1992. Nutrition management of dairy cows as a contribution to pollution
control. J. Dairy Sci. 75(1):345-357.
Toerien, C. A. and J. P. Cant. 2007. Abundance and phosphorylation state of translation
initiation factors in mammary glands of lactating and nonlactating dairy cows. J
Dairy Sci 90(6): 2726-2734.
Van Horn, H.H., Wilkie, A.C., Powers, W.J. and Nordstedt, R.A. (1994). Components of
dairy manure management systems. J. Dairy Sci. 77: 2008-2030.
Wang, C., H. Y. Liu, Y. M. Wang, Z. Q. Yang, J. X. Liu, Y. M. Wu, T. Yan, and H. W.
Ye. 2010. Effects of dietary supplementation of methionine and lysine on milk
production and nitrogen utilization in dairy cows. J. Dairy Sci. 93: 3661-3670.
Wang, X. and C. G. Proud. 2006. The mTOR pathway in the control of protein synthesis.
Physiology (Bethesda) 21: 362-369.
Weekes, T. L., P. H. Luimes, and J. P. Cant. 2006. Responses to amino acid imbalances

17
and deficiencies in lactating dairy cows. J. Dairy Sci. 89(6): 2177-2187.
Yang, Q., K. Inoki, E. Kim, and K. L. Guan. 2006. TSC1/TSC2 and Rheb have different
effects on TORC1 and TORC2 activity. Proc Natl Acad Sci U S A 103(18):6811-
6816.

18
CHAPTER 3
Effects of reduced dietary protein and supplemented rumen protected
amino acids on the nitrogen efficiency of dairy cows
ABSTRACT
When fed to meet National Research Council (2001) protein recommendations,
dairy cows consume an excess of many amino acids (AA) resulting in approximately
70% of dietary nitrogen (N) being lost to the environment as urine and feces. Reductions
in environmental N release could be attained through an improvement of N efficiency.
The objective of this study was to determine if the typical reduction in milk yield
associated with feeding a low protein diet to lactating dairy cows could be avoided by
dietary supplementation with one or more ruminally protected (RP) AA. Fourteen
multiparous and 10 primiparous Holstein cows and 24 multiparous Holstein x Jersey
crossbred cows were used in a Youden square design consisting of 8 treatments and 3
periods. The 8 dietary treatments were 1) a standard diet containing 17% crude protein
(+Con), 2) a 14% crude protein diet (-Con), 3) –Con plus RP methionine (+M, 16g/d), 4)
–Con plus RP lysine (+K, 47g/d), 5) –Con plus RP leucine (+L, 181g/d), 6) –Con plus RP
methionine and lysine (+MK), 7) –Con plus RP methionine and leucine (+ML), and 8) –
Con plus RP methionine, lysine, and leucine (+MKL). Cows given the –Con and +MKL
diets had lower milk production and milk protein yield than the +Con cows (P < 0.05).
The yield of milk and milk protein for all other AA treatments were not different from
either control diets. Milk fat yield was unchanged across all treatments. Dry matter
intake was unchanged except for a decrease on the +ML diet compared to the +Con.
Milk urea N was less for all diets compared to the +Con suggesting that greater N

19
efficiency can be attained by feeding a low protein diet (P < 0.05). The addition of one
or more RP AA did not positively or negatively affect milk production.
Keywords: nitrogen efficiency, rumen protected amino acids, milk production, dairy
INTRODUCTION
Dairy cows have requirements for specific amino acids (AA) during lactation.
The current National Research Council (NRC; 2001) recommendations for protein
requirements are expressed in terms of metabolizable protein (MP) rather than individual
AA. By feeding in terms of MP, animals are often overfed many AA to ensure high
levels of milk production. Excess nutrients which are not efficiently used for milk
production will be excreted and pollute the environment (Chandler, 1996).
Approximately 30% of the nitrogen (N) consumed by dairy cows is converted into
productive N, while the remaining N is excreted in urine and feces (Chase, 1994;
Tamminga, 1992). Feeding animals low protein diets is one way to improve N efficiency
(Kalscheur et al., 2006), but the practice is typically associated with decreased production
which is economically disadvantageous to producers. Improving N efficiency through
diet manipulation will increase N retention in dairy cows and reduce N pollution to the
environment, but it is important to maintain production.
Delineating AA requirements for dairy cows is especially difficult compared to
pigs and poultry because of the use of a variety of feed products and the remodeling of
nutrients in the rumen by microorganisms (Lapierre et al., 2006). A better understanding
of AA requirements could allow the feeding of less concentrated crude protein (CP) diets
supplemented with AA needed specifically for production, as seen with swine and

20
poultry. Implementation of this type of feeding strategy in dairy cattle would allow for
greater N utilization by tissues allowing supplemented amino acids to be used for milk
production. Lysine (Lys) and methionine (Met) have been generally accepted to be the
main limiting AA for milk protein synthesis on corn-based diets (NRC, 2001; Clark,
1975; Schwab et al., 1976). Extensive research has been performed utilizing rumen
protected (RP) Lys and Met supplementation. Cows fed both RP Met and Lys
experienced increased milk protein and milk fat yield (Robinson et al., 1998).
In addition to Met and Lys, dairy cow rations may also be limiting in leucine
(Leu). Duodenal infusions of 40 g/d of Leu to corn-based diets improved both milk
protein content and yield when diets were not limiting in Lys or Met (Rulquin and
Pisulewski, 2006). Additionally, Leu has been shown to increase protein synthesis in
skeletal muscle of growing pigs (Escobar et al., 2006). Amino acids, in particular Leu,
increase phosphorylation of mammalian target of rapamycin (mTOR) which controls
protein synthesis rates (Wang and Proud, 2006). Therefore, including RP Leu to dairy
cow rations may result in an increase in milk protein synthesis through the activation of
the mTOR pathway.
The objectives of this study were: 1) to determine whether the reduction in milk
production associated with feeding a 15% CP (DM basis) diet could be alleviated by
supplementation of RP Met, Lys, Leu, or combinations of the RP AA, 2) to determine the
effects of feeding RP AA on cell signaling proteins associated with the mTOR pathway,
and 3) to improve N efficiency of dairy cows.

21
MATERIALS AND METHODS
Animals
All experimental procedures were approved by the Virginia Tech Institutional
Animal Care and Use Committee. Fourteen multiparous and 10 primiparous Holstein
cows and 24 multiparous Holstein x Jersey cross-bred cows were utilized in a Youden
square design consisting of 8 treatments and 3 periods. Cows were randomly assigned to
treatment, and treatment sequences were balanced for crossover effects. Experimental
periods lasted 15 d and consisted of 10 d of diet adaptation and 5 d of sample collection.
Cows were housed in a free stall barn with Calan Broadbent individual animal feeders
(American Calan Inc., Northwood, NH) and free access to water. Four cows were
removed from the study (1 low milk production, 1 health issues, 2 theft of feed from
other doors).
Treatments
The eight dietary treatments were 1) a standard diet containing 17% CP (+Con),
2) a 15% CP diet (-Con), 3) –Con diet plus RP Met (+M), 4) –Con diet plus RP Lys (+K),
5) –Con diet plus RP Leu (+L), 6) –Con diet plus RP Met and Lys (+MK), 7) –Con diet
plus RP Met and Leu (+ML), and 8) –Con diet plus RP Met, Lys, and Leu (+MKL).
Diets were formulated to meet NRC (2001) recommendations for a lactating cow
weighing 612 kg, consuming 22 kg of DM, and producing 35 kg/d of milk with 3.0% CP
and 3.5% fat. Final diets contained 45.1% forage and 54.9% concentrate, and three
fourths of the diets contained corn-based ingredients (Table 3-1). Three concentrate
mixes were utilized in the experiment. A moderate fat grain with high protein was used

22
for the +Con, a moderate fat grain with low protein was used for the –Con, and a low fat
grain with low protein was used in conjunction with the moderate fat, low protein mix to
construct the diets supplemented with AA. The moderate fat –Con and the low fat –Con
grains were mixed in varying proportions to construct the +AA diets so that dietary fat
was equalized across treatments. Diets were mixed as a total mixed ration (TMR),
provided in quantities to maintain between 5 and 10% refusals, and delivered to the Calan
gates once daily by 1400 h. Sixteen grams of rumen protected DL-Met (Balchem
Corporation, New Hampton, NY), 47g rumen protected L-Lys (AminoShure™-L;
Balchem Corporation, New Hampton, NY), and 181g rumen protected L-Leu (Ajinomoto
Co,. Inc., Japan; Balchem Corporation, New Hampton, NY) were supplied in diets
containing those AA. These amounts were adequate to achieve predicted absorbed AA
supplies that were equivalent to the +Con diet.
Sample Collection and Analysis
Feed offered and orts were recorded daily to determine dry matter intake. Dry
matter content was determined weekly on the major components of the TMR (grain
mixes, alfalfa haylage, and corn silage) and used to adjust the ration to maintain the
targeted DM inclusion rates. Samples of the TMR, grains, and forage mix were collected
on d 11, 13, and 15 of each period. Feed samples were stored at -20°C for later analysis.
Individual feed samples were thawed and then dried at 55°C in a forced air oven for 48 h
to determine dry matter concentrations. Dried samples were ground on a Wiley mill
through a 1-mm screen (Arthur H. Thomas, Philadelphia, PA), and subsequently

23
composited by diet and period. Composited samples were submitted to Dairyland
Laboratories, Inc. (Arcadia, WI) for nutrient analyses.
Milk weights were recorded at each milking and BW were recorded as cows
exited the milking parlor following milking. Milk samples were taken on d 11, 12, and
13 of each period at the morning and afternoon milkings. Milk samples were analyzed
following each sampling by the Virginia Tech DHIA lab (Blacksburg, VA) for true
protein, fat, non-fat milk solids (SNF), lactose, somatic cell count (SCC), and milk urea
nitrogen (MUN).
Blood samples were taken from the coccygeal vessels following the afternoon
milking on d 13, 14, and 15. Blood samples were collected into 5 mL sodium heparin
vacuutainer tubes, placed on ice, and centrifuged at 3,000 × g for 5 min at 4°C to collect
plasma, which was stored at -20°C until analysis. Plasma samples were pooled by period
for each cow and assessed for AA concentration using gas chromatography-mass
spectrometry as described by El-Kadi et al. (2006).
Mammary biopsies were taken once from a rear quarter of each cow on the +Con,
-Con, and +MK diets after the afternoon milking on either d 16 or 17 of the third period.
Prior to biopsies, cows were restrained in a standing position in a headlock. Cows were
administered an epidural block by injection of 2% lidocaine-HCl at the sacrococcygeal
site. The entry point of the rear quarter was washed sequentially with alcohol, iodine,
and alcohol. Approximately 100 mg of tissue was collected by biopsy from differing
locations through a common entry point using a Magnum® Core Biopsy System (Bard,
Covington, GA) equipped with a 12 gauge needle. A subsample of the tissue (~20 mg)
was immediately homogenized in the presence of protease and phosphatase inhibitors,

24
spun, and the supernatant was boiled in Laemmli SDS sample buffer as described by
Escobar et al. (2006). The remaining tissue was snap frozen in liquid N. Following
collection and processing, samples were transported to the laboratory and stored at -80°C
for later analysis.
Cell Signaling Analysis
An aliquot (20µL) of the biopsy supernate was separated by gel electrophoresis
(Laemmli, 1970) and transferred to a PVDF membrane (Bio-Rad, Hercules, CA).
Membranes were blocked for 1 h with StartingBlock™
(TBS) Blocking Buffer (Thermo
Scientific, Rockford, IL), and probed with primary antibodies against the phosphorylated
and total forms of the signaling proteins of interest. Proteins of interest included α-
tubulin, ribosomal protein S6 (rpS6; Ser235/236), p70 S6 kinase (S6K1; Thr389),
eukaryotic initiation factor 4E binding protein 1 (4EBP1; Thr37/46), eukaryotic initiation
factor 2 (eIF2α; Ser51), and eukaryotic elongation factor 2 (eEF2; Thr56). Primary
antibodies were obtained from Cell Signaling Technology (Danvers, MA) and consisted
of monoclonal rabbit, polycolonal rabbit, or monoclonal mouse antibodies. For rpS6,
S6K1, and eIF2α, primary antibodies for the total and phosphorylated forms were from
different species allowing simultaneous probing for both protein forms using secondary
antibodies (goat anti-mouse and goat anti-rabbit; LI-COR® Biosciences, Lincoln, NE)
with different fluorescing compounds. Proteins were visualized using an Odyssey
Infrared Imaging System (LI-COR® Biosciences, Lincoln, NE). α-Tubulin was used as a
covariate for loading differences. For 4EBP1 and eEF2, the phosphorylated form of the
protein was quantified first followed by stripping for 1 h using Gentle ReView™

25
Stripping Buffer (Amersco, Solon, OH), and re-probed to determine the total form.
Bands were quantified using Odyssey Software (Ver. 3).
Statistics
Data were analyzed using SAS 9.2 (Cary, NC; 2001). The effects of dietary
treatment were assessed using the Mixed models procedure and the statistical model:
Yijk = µ + Ti + Pj + eijk,
where Yijk = the dependent variable, µ = the grand mean of Y, Ti = the effect of treatment,
Pj = the effect of period, and eijk = the residual error. All values were reported as least
squares means and comparisons between treatments were achieved using a Tukey-
Kramer test.
Statistical significance was declared at P < 0.05 and a statistical trend was
declared at P ≤ 0.10.
RESULTS & DISCUSSION
Ingredient Composition of Experimental Diets
Chemical composition of feed ingredients in the experimental diets is presented in
Table 2, and chemical composition of the experimental diets is presented in Table 3.
Acid detergent fiber (ADF), NDF, and CP were lower and NFC was higher for all
treatments than the NRC formulated values. This resulted in NFC and starch
concentrations that were greater than intended which likely contributed to milk fat
content below normal concentrations (Table 4). However, Orskov (1986) indicated that
high levels of corn in diets supply little benefit to the animal because of limited starch

26
digestion in the rumen. Therefore, corn-based diets with low rumen degradability are
less likely to cause the negative side effects normally associated with high rumen
degradability starch sources. Had it not been for the large amount of corn in the
treatment diets, experimental animals in this study could have experienced acidosis or
other metabolic conditions. Diet composition was also considerably affected by dietary
treatment. When compared to +Con, all diets had lower CP, NDF, ADF, ash, ADICP,
NDICP, lignin, and sugar while fat, TDN, NFC, and starch were higher.
Predicted AA supply
Duodenal AA flows for the experimental diets as predicted by the NRC model
(2001) are presented in Table 5. Estimates for duodenal flow of Leu, Lys, and Met for
the +Con treatment were 8.9, 6.1, and 1.8% of MP, respectively, and estimates for the –
Con were 9.3, 6.2, and 2.0% of MP, respectively. Estimates for both Lys and Met
appeared to be limiting for the +Con and –Con as values were less than the suggested
values to obtain maximal milk protein synthesis for Lys (7.2%) and Met (2.5%) (NRC,
2001). Leu did not appear to be limiting in either treatment as the level of Leu required
for optimal milk protein synthesis is 8.9% of MP (Rulquin and Pisulewski, 2006).
Supplementation of RP Leu, Lys, and Met increased digestible AA flow from 214, 144,
and 45 g/d, respectively, to 274, 154, and 51 g/d, respectively, which equates to 11.8, 6.6,
and 2.2% of MP flow, respectively. Thus supplementation of Lys and Met increased
duodenal supply to values that were closer to target values established by the NRC
(2001).

27
DM and nutrient intake
Least squares means of dry matter (DMI), CP, N, ADF, and NDF intakes were all
affected by treatment (Table 4). Intake of CP, N, ADF, and NDF were significantly
reduced for all treatments when compared to the +Con. Cows on the +ML treatment
experienced significantly reduced DMI compared to cows on the +Con diet. Met
supplementation has been shown to cause depressed DMI in dairy cows (Robinson et al.,
2000; Patton, 2010; Satter et al., 1975; Socha et al., 2005); however, because of the lack
of effect on DMI in the other treatment diets supplemented with RP Met, it appears that
RP Leu may have contributed to the decrease as it was in excess in the diets and may
have caused an AA imbalance. Multiple experiments in rats and cockerels have shown
that AA imbalances cause reductions in feed intake (Peng et al., 1972; Sanahuja and
Harper, 1963b; Tobin and Boorman, 1979). Rogers et al. (1967) and Peng et al. (1973)
observed a decrease in feed intake when male rats were offered a diet containing excess
Leu. In contrast, reductions in DMI are not common with Leu supplementation in dairy
cows whether infused (Korhonen et al., 2002; Rulquin and Pisulewski, 2006) or in rumen
protected form (Křižova et al., 2008). According to Table 6, it appears that the decrease
in DMI may have been caused by supplementation of Leu as plasma concentrations of
Leu on the +ML diet were significantly elevated, likely causing an AA imbalance which
resulted in changes in AA concentrations in the brain. An AA imbalance or deficiency is
recognized in the prepyriform cortex of the brain and amygdala and results in an aversion
to the imbalanced diet (Gietzen, 1993). In particular, Leu supply appears to control feed
intake by acting on the central nervous system. Avruch et al. (2009) discussed that

28
increased Leu concentrations in the hypothalamus of rats stimulated hypothalamic mTOR
signaling and caused anorexia.
Milk yield and composition
Cows on the –Con and +MKL treatments had significantly lower milk yield when
compared to +Con (Table 4). All other treatments did not differ from the +Con or –Con.
The decrease in milk associated with the –Con was predicted by the NRC model and is
consistent with the literature (Gardner and Park, 1973; Kalscheur et al., 2006; Klusmeyer,
1990; Rius et al., 2010). The significant reduction in the +MKL treatment indicates that
the addition of all 3 RP AA had no effect on improving milk yield of the –Con diet;
however, previous observations in the literature often report no significant effect on milk
yield associated with AA supplementation (Hopkins et al., 1994; Korhonen et al., 2002;
Robinson et al., 1998, Socha et al., 2005). Appuhamy et al. (2011) observed no effect on
milk yield when high producing dairy cows were infused with Met and Lys or Met, Lys,
and branched-chain AA (BCAA).
Milk protein yields were also significantly reduced on the –Con and +MKL
compared to the +Con. All other treatments were not significantly different from either
the +Con or –Con indicating that the decrease in milk yield could be attributed to the
decrease in milk protein yield. Socha et al. (2005) and Weekes et al. (2006) both
indicated an increase in milk protein yield when lactating dairy cows were fed corn-based
diets supplemented with Met or Lys.
The effect of Leu or BCAA supplementation on milk protein synthesis is
inconsistent. No effect of supplementation has often been reported in the literature

29
(Hopkins et al., 1994; Korhonen et al., 2002; Weekes et al., 2006); however, Rulquin and
Pisulewski (2006) and Appuhamy et al. (2011) both observed a significant increase in
milk protein yield when cows fed corn-based diets were infused with Leu or BCAA,
respectively. However, in both instances, animals were also supplemented with Met and
Lys to ensure that those AA were not limiting for milk protein synthesis which may
explain the significant increase.
Milk lactose production was also significantly reduced with the +MKL treatment
compared to the +Con, but was not different from –Con, again indicating that a
combination of all 3 RP AA cannot make up for the decrease in lactational performance
associated with the feeding of a low protein diet. Robinson et al. (1995) observed a
decrease in milk lactose composition when lactating dairy cows were fed corn-based diets
supplemented with RP Met and Lys. In contrast, much of the literature indicates that
supplementation of Met, Lys, or BCAA does not significantly impact lactose content
(Appuhamy et al., 2011; Broderick et al., 2008; Korhonen et al., 2002; Robinson et al.,
1998).
Milk fat content was not significantly affected by treatment compared to +Con,
but it was significantly elevated for +MKL as compared to the +K treatment. This infers
that Leu or Met supplementation was responsible for increases in milk fat composition
although the effects were not evident when either AA was supplemented alone or when
they were provided in combination in the absence of Lys. Robinson et al. (1995)
observed a significant increase in milk fat composition in cows supplemented with RP
Met and Lys. Socha et al. (2005) also saw a significant increase in milk fat composition
when RP Met was supplemented to an 18.5% CP diet compared to a basal diet and RP

30
Met and Lys treatments. Appuhamy et al. (2011) and Korhonen et al. (2002) both saw no
effect of BCAA or Leu supplementation on milk fat yield or composition, respectively.
However, there was no significant increase in milk fat content or yield for either the +M
or +L treatments in this study.
MUN and Nitrogen Efficiency
Milk urea nitrogen and nitrogen efficiency results are presented in Table 4.
Gooden et al. (2001) indicated that MUN concentrations were useful in determining
nitrogen efficiency of dairy cows. MUN was significantly reduced on all treatments
compared to the +Con. In accordance with Broderick et al. (2008), these results suggest
animals fed the –Con or any of the RP AA supplemented diets exhibited increased
nitrogen efficiency. Nitrogen efficiency values were not different among treatments;
however, there was a numerical increase for all of the RP AA supplemented diets.
Nitrogen efficiency increased from 29.7% on the +Con treatment to an average of 32.7%
for the treatments supplemented with RPAA. There tended to be a significant difference
between the two control diets and those diets with supplemented AA (P = 0.07). This
indicates that the addition of RPAA tended to alleviate the depression in milk protein
yield. Kalscheur et al. (2006) observed a significant increase in N efficiency of dairy
cows from 28.2% to 36.5% when dietary CP was decreased from 17.1% to 12.3%.
Ipharraguerre and Clark (2005) also concluded that a reduction in CP from 18.7% to
14.8% increased N efficiency from 25% to 33%. The increases in nitrogen efficiency
will reduce N losses to the environment and decrease the amount of N pollution to the
atmosphere and waterways.

31
Plasma Concentrations of AA
Plasma concentrations of nonessential AA were not affected by treatment (Table
6). Plasma concentrations of isoleucine and valine were significantly reduced on the –
Con diet indicating that isoleucine and valine may have been limiting in the –Con diet.
Levels of plasma Leu on the +ML treatment were significantly elevated compared to the
–Con and were numerically higher than the +Con. The increased concentration suggests
that the +ML diet was not limited by Leu. Rulquin and Pisulewski (2006) also observed
a rise in plasma Leu of 55% when cows were duodenally infused with 40 g/d of Leu.
This rise in plasma Leu also substantiates the decrease in DMI associated with the +ML
diet due to an excess in Leu rather than Met.
Cell Signaling Proteins
Effects of dietary treatments on signaling proteins from mammary biopsy samples
are given in Table 7. Representative Western immunoblotting images for the
phosphorylated (P) forms of signaling proteins are shown in Figure 3-1, and
representative total (T) images are shown in Figure 3-2. The relative abundance of P-
S6K1 and rpS6 were significantly increased with the +MK compared to the –Con, and
the abundance of the T forms of these proteins were not affected by treatment.
Phosphorylated 4EBP1 values were significantly reduced with the +MK compared to the
+Con, but were not different from the -Con. These results suggest that +MK was unable
to make up for the decreased phosphorylation of 4EBP1 associated with the –Con
treatment. Also, T and P-eEF2 abundances were both significantly higher in the +MK

32
compared with the +Con and –Con. An increase in eEF2 phosphorylation reduces its
ability to initiate elongation. The relative abundance of P-eIF2α was significantly
increased compared to the +Con, but was not different from the –Con.
Phosphorylated to total relative abundance ratios for each of the signaling proteins
was unaffected by treatment. Relative abundance ratios represent the phosphorylation
status of the signaling proteins. 4EBP1 and S6K1 ratios of +MK were equivalent to the
ratio of the +Con. This indicates that supplementation of Met and Lys to low protein
diets can activate the mTOR pathway to the same extent as the high protein diet. Hara et
al. (1998) observed that withdraw of AA from CHO-IR cells in-vitro rapidly deactivates
S6K1 and 4EBP1. The phosphorylation status of rpS6 and eEF2 were relatively similar
across treatments. Activation of downstream proteins was not as strong as the direct
substrates of mTOR. Appuhamy et al. (2011) concluded that the addition of essential AA
to MAC-T cells and mammary tissue slices from dairy cows significantly increased
phosphorylation of mTOR, S6K1, 4EBP1, and decreased phosphorylation of eEF2.
Independent of the mTOR pathway, the abundance ratio of eIF2α was decreased with the
+MK treatment compared to the –Con, but not to the extent of the +Con. Avruch et al.
(2009) discussed that activation of GCN2 increases as AA concentrations decline, and as
a result decreases the rate of translation initiation. Increasing Met and Lys supply to low
protein diets will increase translational initiation; however, the signal will not be as
strong as that seen with a high protein diet.
The effect of signaling proteins on milk protein production is presented in
Table 8. The variation of the phosphorylated proteins represented approximately one-

33
seventh of the total variation and approximately one-tenth of the total variation for the
total forms of the signaling proteins.
CONCLUSIONS
Results from this study show that supplementation of individual RPAA or a
combination of 2 RPAA were able to prevent the significant loss in milk production and
protein yield associated with feeding low dietary protein, but production and protein yield
were numerically lower than a high protein diet. The combination of all 3 RPAA,
however, was not able to alleviate this reduction. All of the supplemented diets also
showed a significant reduction in MUN and numerical increases in nitrogen efficiency
suggesting that feeding a 15% CP (% DM basis) diet supplemented with RPAA would be
able to help in eliminating nitrogen pollution to the environment and decrease feeding
costs while maintaining a high level of production.
ACKNOWLEDGEMENTS
Funding for this study was provided by the Virginia Agricultural Council. The
authors also acknowledge the support of Balchem Corporation for the donation of rumen-
protected lysine and methionine, as well as protecting the leucine product.
REFERENCES
Appuhamy, J. A. D. R. N., J. R. Knapp, O. Becvar, J. Escobar, M. D. Hanigan. 2011.
Effects of jugular-infused lysine, methionine, and branched-chain amino acids on
milk protein synthesis in high-producing dairy cows. J. Dairy Sci. 94(4): 1952-
1960.
Appuhamy, J. A. D. R. N., A. L. Bell, W. A. D. Nayananjalie, J. Escobar, and M. D.

34
Hanigan. 2011. Essential amino acids regulate both initiation and elongation of
mRNA translation independent of insulin in MAC-T cells and bovine mammary
tissue slices. J. Nutr. 141: 1209-1215.
Avruch, J., X. Long, S. Ortiz-Vega, J. Rapley, A. Papageorgiou, and N. Dai. 2009.
Amino acid regulation of TOR complex 1. Am J Physiol Endocrinol Metab
296(4):E592-602.
Broderick, G. A., M. J. Stevenson, R. A. Patton, N. E. Lobos, and J. J. Olmos Colmenero.
2008. Effect of supplementing rumen-protected methionine on production and
nitrogen excretion in lactating dairy cows. J. Dairy Sci. 91(3):1092-1102.
Chandler, P. T. 1996. Environmental challenges as related to agriculture -dairy. In p. 7-
20. E.T.Kornegay (ed.). Nutrient management of food animals to enhance and
protect the environment. CRC Press, Inc., Salem, MA.
Chase, L.E. 1994. Environmental considerations in developing dairy rations. In: Proc.
Cornell Nutr. Conf. Feed Manuf., Syracuse, NY, USA. Cornell Univ., Ithaca, NY,
USA, pp. 56-62.
Clark, J. H., M. R. Murphy, and B. A. Crooker. 1987. Supplying the protein needs of
dairy cattle from by-product feeds. J. Dairy Sci. 70: 1092-1109.
El-Kadi, S. W., R. L. Baldwin VI, N. E. Sunny, S. L. Owens, and B. J. Bequette. 2006.
Intestinal protein supply alters amino acid, but not glucose, metabolism by the
sheep gastrointestinal tract. J. Nutr. 136:1261–1269.
Escobar, J., J. W. Frank, A. Suryawan, H. V. Nguyen, S. R. Kimball, L. S. Jefferson, and
T. A. Davis. 2006. Regulation of cardiac and skeletal muscle protein synthesis by
individual branched-chain amino acids in neonatal pigs. Am. J. Physiol.
Endocrinol. Metab. 290(4):E612-621.
Gardner, R. W. and R. L. Park. 1973. Protein requirements of cows fed high concentrate
rations. J. Dairy Sci. 56(3): 390-394.
Gietzen, D. W. 1993. Neural Mechanisms in the Responses to Amino Acid Deficiency. J.
Nutr. 123: 610-625.
Godden, S. M., K. D. Lissemore, D. F. Kelton, K. E. Leslie, J. S. Walton, and J. H.
Lumsden. 2001. Relationships between milk urea concentrations and nutritional
management, production, and economic variables in Ontario dairy herds. J. Dairy
Sci. 84(5):1128-1139.
Hara, K., K. Yonezawa, Q. P. Weng, M. T. Kozlowski, C. Belham, and J. Avruch. 1998.
Amino acid sufficiency and mTOR regulate p70 S6 kinase and eIF-4E BP1
through a common effector mechanism. J Biol Chem 273(23):14484-14494.

35
Hopkins, B. A., A. H. Rakes, T. E. Daniel, C. A. Zimmerman, and W. J. Croom, Jr. 1994.
Effects of intraperitoneal L-leucine, L-isoleucine, L-valine, and L-arginine on
milk fat depression in early lactation cows. J. Dairy Sci. 77(4): 1084-1092.
Ipharraguerre, I. R. and J. H. Clark. 2005. Varying protein and starch in the diet of dairy
cows. II. effects on performance and nitrogen utilization for milk production. J.
Dairy Sci. 88(7): 2556-2570.
Kalscheur, K. F., R. L. Baldwin, B. P. Glenn, and R. A. Kohn. 2006. Milk production of
dairy cows fed differing concentrations of rumen-degraded protein. J. Dairy Sci.
89(1): 249-259.
Klusmeyer, T. H., R. D. J. McCarthy, J. H. Clark, and D. R. Nelson. 1990. Effects of
source and amount of protein on ruminal fermentation and passage of nutrients to
the small intestine of lactating cows. J. Dairy Sci. 73: 3526-3537.
Korhonen, M., A. Vanhatalo, and P. Huhtanen. 2002. Evaluation of isoleucine, leucine,
and valine as a second-limiting amino acid for milk production in dairy cows fed
grass silage diet. J. Dairy Sci. 85(6): 1533-1545.
Křižova, L., J. Třinácty, M. Richter, S. Hadrová, J. Pozdíšek. 2008. Effect of ruminally-
protected leucine supplement on milk yield and plasma amino acids in dairy
cows. J. Agricultural and Food Science. 17: 351-359.
Laemmli, U. K. 1970. Cleavage of structural proteins during the assembly of the head of
bacteriophage T4. Nature 227: 680-685.
Lapierre, H., D. Pacheco, R. Berthiaume, D. R. Ouellet, C. G. Schwab, P. Dubreuil, G.
Holtrop, and G. E. Lobley. 2006. What is the true supply of amino acids for a
dairy cow? J. Dairy Sci. 89 Suppl 1(1):E1-14.
NRC. 2001. Nutrient Requirements of Dairy Cattle.
Orskov, E. R. 1986. Starch digestion and utilization in ruminants. J. Anim. Sci.
63(5):1624-1633.
Patton, R. A. 2010. Effect of rumen-protected methionine on feed intake, milk
production, true milk protein concentration, and true milk protein yield, and the
factors that influence these effects: A meta-analysis. J. Dairy Sci. 93:2105-2118.
Rius, A. G., M. L. McGilliard, C. A. Umberger, and M. D. Hanigan. 2010. Interactions of
energy and predicted metabolizable protein in determining nitrogen efficiency in
the lactating dairy cow. J. Dairy Sci. 93: 2034-2043.
Robinson, P. H., W. Chalupa, C. J. Sniffen, W. E. Julien, H. Sato, T. Fujieda, T. Ueda,

36
and H. Suzuki. 2000. Influence of abomasal infusion of high levels of lysine or
methionine, or both, on ruminal fermentation, eating behavior, and performance
of lactating dairy cows. J. Anim. Sci. 78(4):1067-1077.
Robinson, P. H., W. Chalupa, C. J. Sniffen, W. E. Julien, H. Sato, K. Watanabe, T.
Fujieda, and H. Suzuki. 1998. Ruminally protected lysine or lysine and
methionine for lactating dairy cows fed a ration designed to meet requirements for
microbial and postruminal protein. J. Dairy Sci. 81: 1364-1373.
Robinson, P. H., A. H. Fredeen, W. Chalupa, W. E. Julien, H. Sato,T. Fujieda, and H.
Suzuki. 1995. Ruminally protected lysine and methionine for lactating dairy cows
fed a diet designed to meet requirements for microbial and postruminal protein. J.
Dairy Sci. 78:582–594.
Rogers, Q. R., Tannous, R. I. & Harper, A. E. (1967) Effect of excess leucine on growth
and food selection. J. Nutr. 91: 561-572.
Rulquin, H. and P. M. Pisulewski. 2006. Effects of graded levels of duodenal infusions of
leucine on mammary uptake and output in lactating dairy cows. J. of Dairy
Research 73(03):328-339.
Patton, R. A. 2010. Effect of rumen-protected methionine on feed intake, milk
production, true milk protein concentration, and true milk protein yield, and the
factors that influence these effects: A meta-analysis. J. Dairy Sci. 93: 2105-2118.
Peng, Y., J. Gubin, A. E. Harper, M. G. Vavich and A. R. Kemmerer. 1973. Food intake
regulation: amino acid toxicity and changes in rat brain and plasma amino acids.
J. Nutr.103: 608.
Peng, Y., J. K. Tews and A. E. Harper. 1972. Amino acid imbalance, protein intake, and
changes in rat brain and plasma amino acids. Amer. J. Physiol. 222: 314.
Sanahuja, J. C. and A. E. Harper. 1963b. Effect of dietary amino acid pattern on plasma
amino acid pattern and food intake. Amer. J. Physiol. 204:686.
Satter, L. D., R. L. Lang, J. W. Van Loo, M. E. Carlson, and R. W. Kepler. 1975.
Adverse effect of excess methionine or methionine hydroxy analog on feed
consumption in cattle. J. Dairy Sci. 58:521-525.
Schwab C. G., L. D. Satter, B. Clay. 1976. Response to lactating dairy cows to abomasal
infusion of amino acids. J. Dairy Sci. 59:1254–1270
Socha, M. T., D. E. Putnam, B. D. Garthwaite, N. L. Whitehouse, N. A. Kierstead, C. G.
Schwab, G. A. Ducharme, and J. C. Robert. 2005. Improving intestinal amino
acid supply of pre- and postpartum dairy cows with rumen-protected methionine
and lysine. J. Dairy Sci. 88(3):1113-1126.

37
Tamminga, S. 1992. Nutrition Management of Dairy Cows as a Contribution to Pollution
Control. J. Dairy Sci. 75(1):345-357.
Tobin G., and K. N. Boorman. 1979. Carotid or jugular amino acid infusions and food
intake in the cockerel. Brit. J. Nutr. 41:157–162.
Weekes, T. L., P. H. Luimes, and J. P. Cant. 2006. Responses to amino acid imbalances
and deficiencies in lactating dairy cows. J. Dairy Sci. 89(6):2177-2187.
Wang, X. and C. G. Proud. 2006. The mTOR pathway in the control of protein synthesis.
Physiology (Bethesda) 21:362-369.

38
Table 1. Dietary formulas and nutrient compositions, and predicted nutrient
requirements as determined from NRC (2001).
Item
+Con
-Con
-Con
Low Fat
---------------- % of DM ----------------
Forage
Corn silage 35.37 35.37 35.37
Mix grass + legume silage 9.73 9.73 9.73
Concentrate
Corn grain, ground, dry 24.11 33.38 34.29
Corn Dry Distiller Grain+sol 8.18 8.18 8.40
Soybean meal, solvent (48% CP) 11.58 3.58 3.68
Protected soybean meal 1.77 0.00 0.00
Soybean hulls 6.41 4.96 5.09
Urea 0.00 0.88 0.90
Tallow 1.77 2.65 0.00
Calcium carbonate 0.49 0.50 0.51
Calcium phosphate (Di-) 0.00 0.18 0.18
Sodium bicarbonate 0.20 0.20 0.20
Salt 0.33 0.33 0.34
0.06% selenium premix 0.03 0.03 0.03
Trace mineral mix 0.01 0.01 0.01
Trace vitamin premix 0.01 0.01 0.01
Vitamin E (60000) 0.01 0.01 0.01
CP, % of DM 17.5 15.5 15.9
NDF, % of DM 30.3 29.0 29.7
ADF, % of DM 18.3 17.3 17.7
RDP, % of DM 10.3 10.3 10.6
RUP, % of DM 7.3 5.1 5.2
NFC, % of DM 44.0 46.2 47.4
Ether Extract, % of DM 5.4 6.5 3.9
NEL Mcal/kg 1.55 1.55 1.55
MP supplied, kg/d 2.75 2.31 2.25
MP allowable milk, kg/d 43.7 33.9 32.8
NEl allowable milk, kg/d 39.9 39.7 36.4

39
Table 2. Observed chemical composition of major feed ingredients used in experimental
diets.
Item Corn silage Haylage
Conc.
A1
Conc.
B2
Conc.
C3 SEM
DM, % 31.49 54.03 89.98 90.36 89.80 1.45
------------------------- % of DM -------------------------
NDF 36.08 43.02 18.49 16.28 17.37 0.25
ADF 20.37 35.41 9.86 7.84 8.51 0.14
CP 7.90 18.78 21.26 19.71 18.75 0.08
Fat 3.52 2.92 6.91 4.95 9.19 0.08
NFC 49.68 25.39 49.16 55.13 51.32 0.23
Lignin 2.92 8.94 1.21 1.19 0.96 0.05
Starch 36.79 1.14 33.74 45.38 45.11 0.31
Sugar 2.13 4.22 6.56 3.67 3.06 0.09
Minerals ------------------------- % of DM -------------------------
Calcium 0.19 1.18 0.64 0.65 0.51 0.01
Phosphorous 0.23 0.32 0.49 0.47 0.48 0.002
Magnesium 0.16 0.32 0.23 0.20 0.19 0.001
Potassium 1.16 2.98 1.10 0.81 0.76 0.01
Sulfur 0.10 0.24 0.27 0.22 0.20 0.002 1Conc. A = High Protein grain mix;
2Conc. B = Low Protein-Low Fat grain mix;
3Conc. C = Low Protein grain mix;
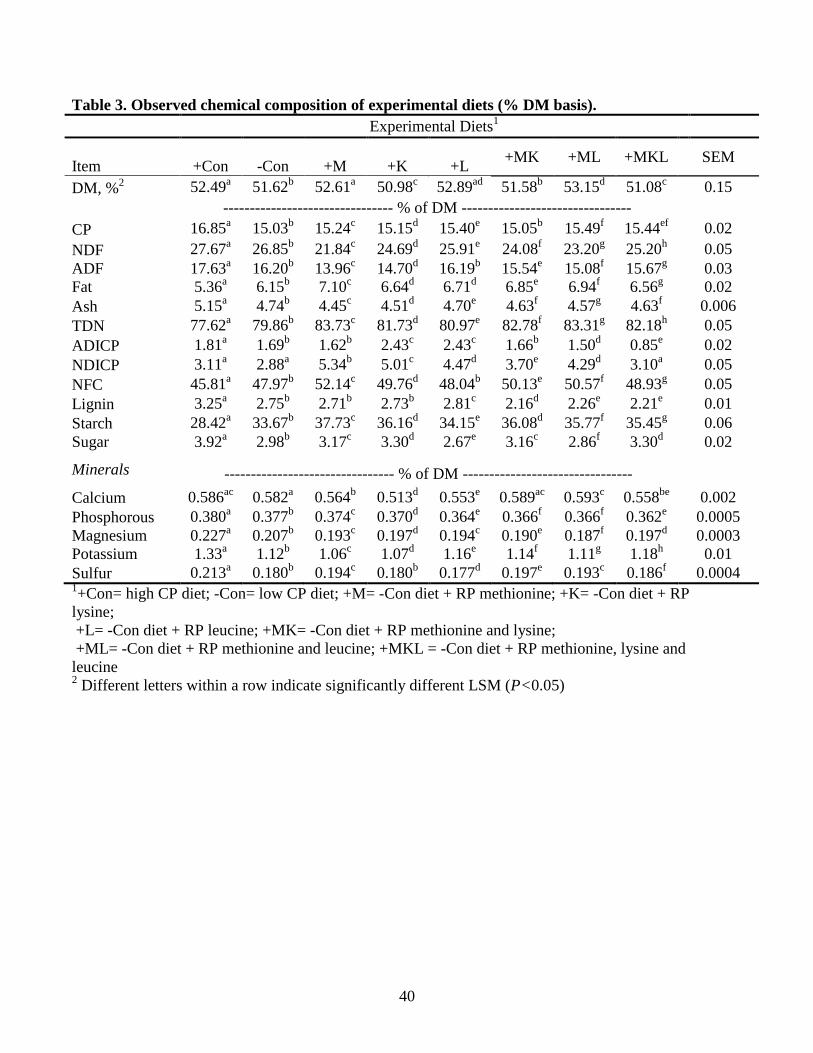
40
Table 3. Observed chemical composition of experimental diets (% DM basis).
Experimental Diets1
Item
+Con
-Con
+M
+K
+L +MK +ML +MKL SEM
DM, %2 52.49
a 51.62
b 52.61
a 50.98
c 52.89
ad 51.58
b 53.15
d 51.08
c 0.15
-------------------------------- % of DM --------------------------------
CP 16.85a 15.03
b 15.24
c 15.15
d 15.40
e 15.05
b 15.49
f 15.44
ef 0.02
NDF 27.67a 26.85
b 21.84
c 24.69
d 25.91
e 24.08
f 23.20
g 25.20
h 0.05
ADF 17.63a 16.20
b 13.96
c 14.70
d 16.19
b 15.54
e 15.08
f 15.67
g 0.03
Fat 5.36a 6.15
b 7.10
c 6.64
d 6.71
d 6.85
e 6.94
f 6.56
g 0.02
Ash 5.15a 4.74
b 4.45
c 4.51
d 4.70
e 4.63
f 4.57
g 4.63
f 0.006
TDN 77.62a 79.86
b 83.73
c 81.73
d 80.97
e 82.78
f 83.31
g 82.18
h 0.05
ADICP 1.81a 1.69
b 1.62
b 2.43
c 2.43
c 1.66
b 1.50
d 0.85
e 0.02
NDICP 3.11a 2.88
a 5.34
b 5.01
c 4.47
d 3.70
e 4.29
d 3.10
a 0.05
NFC 45.81a 47.97
b 52.14
c 49.76
d 48.04
b 50.13
e 50.57
f 48.93
g 0.05
Lignin 3.25a 2.75
b 2.71
b 2.73
b 2.81
c 2.16
d 2.26
e 2.21
e 0.01
Starch 28.42a 33.67
b 37.73
c 36.16
d 34.15
e 36.08
d 35.77
f 35.45
g 0.06
Sugar 3.92a 2.98
b 3.17
c 3.30
d 2.67
e 3.16
c 2.86
f 3.30
d 0.02
Minerals -------------------------------- % of DM --------------------------------
Calcium 0.586ac
0.582a 0.564
b 0.513
d 0.553
e 0.589
ac 0.593
c 0.558
be 0.002
Phosphorous 0.380a 0.377
b 0.374
c 0.370
d 0.364
e 0.366
f 0.366
f 0.362
e 0.0005
Magnesium 0.227a 0.207
b 0.193
c 0.197
d 0.194
c 0.190
e 0.187
f 0.197
d 0.0003
Potassium 1.33a 1.12
b 1.06
c 1.07
d 1.16
e 1.14
f 1.11
g 1.18
h 0.01
Sulfur 0.213a 0.180
b 0.194
c 0.180
b 0.177
d 0.197
e 0.193
c 0.186
f 0.0004
1+Con= high CP diet; -Con= low CP diet; +M= -Con diet + RP methionine; +K= -Con diet + RP
lysine;
+L= -Con diet + RP leucine; +MK= -Con diet + RP methionine and lysine;
+ML= -Con diet + RP methionine and leucine; +MKL = -Con diet + RP methionine, lysine and
leucine 2 Different letters within a row indicate significantly different LSM (P<0.05)

41
Table 4. Least squares means of intakes, milk production and composition, body weight, and
nitrogen efficiency for lactating dairy cows fed experimental diets.
Experimental Diets1
Variables
+Con
-Con
+M
+K
+L +MK +ML +MKL SEM
Intake, kg/d
DM2 22.64
a 21.17
ab 21.99
a 21.86
a 20.87
ab 20.93
ab 19.65
b 21.05
ab 0.75
CP 3.77a 3.15
b 3.31
bc 3.34
bd 3.50
acd 3.04
b 3.02
b 3.13
b 0.08
N 0.60a 0.50
b 0.53
bc 0.53
bd 0.56
acd 0.49
b 0.48
b 0.50
b 0.01
NDF 6.18a 5.64
b 4.75
ce 5.44
bd 5.88
ab 4.87
c 4.54
c 5.07
de 0.13
ADF 3.95a 3.40
be 3.03
cd 3.25
bd 3.70
ae 3.14
bd 2.95
cd 3.18
bc 0.08
Milk Production
Milk yield, kg/d 34.34a 31.06
b 32.17
ab 31.35
ab 31.86
ab 32.13
ab 31.75
ab 29.95
b 1.48
True Protein, kg/d 1.09a 0.98
b 1.01
ab 0.99
ab 1.01
ab 1.01
ab 1.00
ab 0.95
b 0.04
True Protein, % 3.21 3.23 3.18 3.28 3.20 3.23 3.21 3.28 0.07
Fat, kg/d 1.03 0.98 0.99 0.91 0.95 0.99 0.98 0.97 0.05
Fat, % 3.03ab
3.25ab
3.08ab
2.90a 2.99
ab 3.13
ab 3.12
ab 3.31
b 0.12
Lactose, kg/d 1.63a 1.46
ab 1.51
ab 1.48
ab 1.50
ab 1.51
ab 1.50
ab 1.41
b 0.07
Lactose, % 4.74 4.68 4.69 4.70 4.70 4.71 4.72 4.70 0.04
SCC, 1000 cells/mL 491 606 361 143 150
200 158 365 230
BW, kg 579 581 578 575 582 578 574 583 8.80
MUN, mg/dL 11.88a 9.78
b 10.08
b 10.20
b 10.02
b 9.60
b 10.58
b 10.56
b 0.33
N efficiency3, % 29.7 29.2 31.3 33.8 33.4 32.2 33.1 32.3 2.20
1+Con= high CP diet; -Con= low CP diet; +M= -Con diet + RP methionine; +K= -Con diet + RP
lysine;
+L= -Con diet + RP leucine; +MK= -Con diet + RP methionine and lysine;
+ML= -Con diet + RP methionine and leucine; +MKL = -Con diet + RP methionine, lysine and
leucine 2
Different letters within a row indicate significantly different LSM (P<0.05) 3
N efficiency = N yield / N intake x 100

42

43
Table 6. Concentrations of free AA in plasma of cows fed experimental diets
Experimental Diets1
+Con
-Con
+M
+K
+L +MK +ML +MKL SEM
Essential AA, μM
Arg 140.4 123.4 131.0 142.0 137.3 135.0 132.8 136.3 8.78
His 51.8 48.0 50.1 52.6 50.8 48.9 50.4 48.6 1.58
Ile2 118.0
a 94.2
b 99.2
ab 110.2
ab 101.4
ab 106.4
ab 108.4
ab 108.3
ab 5.14
Leu 180.6ab
160.5a 180.2
ab 188.9
ab 181.0
ab 176.5
ab 193.6
b 183.3
ab 7.80
Lys 90.3 81.3 83.5 94.0 87.4 88.2 94.6 88.4 4.54
Met 25.0 26.4 27.4 28.3 27.2 27.9 28.1 27.1 1.05
Phe 49.6 44.3 46.4 48.8 46.5 48.5 49.6 48.4 1.43
Thr 117.3 92.9 91.2 102.6 102.2 99.2 102.2 95.0 9.22
Val 271.3a 222.7
b 233.3
ab 259.7
ab 247.1
ab 246.8
ab 262.9
ab 252.8
ab 11.38
Nonessential AA, μM
Ala 261.2 258.1 277.2 280.7 268.9 286.6 280.5 258.9 11.02
Asp 94.5 95.6 93.8 95.9 95.2 99.0 94.4 95.0 1.82
Glu 100.8 105.8 104.9 112.3 105.5 109.8 109.6 106.7 3.55
Gly 380.9 473.4 441.9 450.3 466.6 431.4 415.9 406.2 26.08
Pro 109.6 106.9 116.2 121.2 117.0 111.8 111.3 108.7 4.11
Ser 98.9 105.5 106.1 111.8 114.4 108.4 106.4 101.4 5.21
Tyr 52.9 45.8 49.3 51.4 48.4 48.3 53.3 46.9 2.23 1+Con= high CP diet; -Con= low CP diet; +M= -Con diet + RP methionine; +K= -Con diet + RP
lysine;
+L= -Con diet + RP leucine; +MK= -Con diet + RP methionine and lysine;
+ML= -Con diet + RP methionine and leucine; +MKL = -Con diet + RP methionine, lysine and
leucine 2 Different letters within a row indicate significantly different LSM (P<0.05)

44
Table 7. Effects of experimental diets on the relative abundance of signaling proteins in
mammary biopsies.
Signaling
Protein1
Experimental Diets2
SEM +Con -Con +MK
T-S6K13 1.00 0.97 1.30 0.18
P-S6K1 1.00ab
0.61a 1.43
b 0.22
S6K1 ratio 1.00 0.57 1.00 0.23
T-rpS6 1.00 1.35 1.81 0.50
P-rpS6
1.00ab
0.52a 1.44
b 0.30
rpS6 ratio 1.00 1.05 0.93 0.39
T-4EBP1 1.00x 0.38
y 0.47
xy 0.20
P-4EBP1 1.00x 0.40
xy 0.36
y 0.23
4EBP1 ratio 1.00 1.12 1.00 0.11
T-eEF2 1.00a 0.89
a 1.67
b 0.15
P-eEF2 1.00a 0.89
a 1.74
b 0.14
eEF2 ratio 1.00 0.92 0.95 0.19
T-eIF2α 1.00 1.08 1.45 0.25
P-eIF2α 1.00a 2.10
ab 2.31
b 0.39
eIF2α ratio 1.00 1.72 1.30 0.31 1Total (T) and Phospho (P) abundances of signaling proteins were expressed
as ratios of abundance/abundance of tubulin. Ratios of signaling proteins were
expressed as phospho abundance/total abundance. All values were standardized
to the +Con treatment. 2+Con= high CP diet; -Con= low CP diet; +MK = -Con diet + RP methionine
and lysine 3 Different letters (a, b) within a row indicate significantly different LSM (P<0.05);
(x, y) within a row indicate statistical trend (P<0.10)

45
Table 8. Effect of signaling proteins on milk protein production in dairy cows.
Signaling Protein Estimate of
coefficient P-value
R2
Phosphorylated 0.15
4EBP1 0.00035 0.06
eEF2 -0.00042 0.04
Total
0.11
rpS6 -0.09067 0.10
4EBP1 0.00203 0.11

46
Figure 1. Representative Western blot images of the phosphorylated forms (P) of
analyzed signaling proteins from mammary biopsies.
+Con -Con +MK
S6K1
rpS6
4EBP1
eEF2
eIF2α

47
Figure 2. Representative Western blot images of the total forms (T) of analyzed
signaling proteins from mammary biopsies.
+Con -Con +MK
S6K1
rpS6
4EBP1
eEF2
eIF2α

48
CHAPTER 4
CONCLUSIONS AND IMPLICATIONS
Decreases in ammonia emissions from dairy cattle have been shown to occur
when dietary protein levels are lowered; however, this results in a reduction in milk
production at the expense of the dairy farmer. Supplementation of rumen protected
amino acids, such as Met and Lys, have shown to improve lactational performance of
dairy cows fed lower protein diets. The objective of this study was to improve the N
efficiency of dairy cows through the feeding of a low protein diet while alleviating the
reduction in milk yield with the supplementation of RP Met, Lys, Leu either individually
or in combination. Milk production was significantly decreased on the –Con and +MKL
treatments when compared to the +Con, and all other treatment diets did not significantly
differ from either the –Con or +Con. These results suggest that the supplementation of
RP AA except the combination of all 3 AA can prevent the loss in milk production and
milk protein associated with a low protein diet. All of the diets supplemented with RP
AA had significantly lower MUN and improved N efficiency from 29.7% to 32.7% on
average indicating these animals were able to increase N utilization and reduce N
excretions to the environment. Phosphorylation status of cellular signaling proteins was
not significantly affected by treatment. The addition of Met plus Lys was able to
numerically increase the phosphorylation status of 4EBP1 and S6K1 to that of the +Con
implying that increases in protein synthesis rates could be achieved when RP Met and
Lys are applied to a low protein diet.

49
APPENDIX
Anova Table for Statistical Model
Effect Type df1 ddfm
2
Treatment Fixed 7 38
Period Fixed 2 38
Residual Random 38
Total 47 1
df = degrees of freedom 2
ddfm = denominator degrees of freedom