effects of raising and lowering speed limits on … report documentation page effects of raising and...
TRANSCRIPT

Effects of Raising and Lowering Speed Limitson Selected Roadway Sections
Publication No. FHWA-RD-9 7-084 January 1997
U.S. Department of TransportationFederal Highway Administration
Research and DevelopmentTurner-Fairbank Highway Research Center6300 Georgetown PikeMcLean, Virginia 22010-2296
,
I

FOREWORD
This report may be of interest to traffic engineers and policy makers responsible for making decisionsinvolving the setting of speed limits on short segments on surface streets and highways in suburban andrural areas. The report results DO NOT involve changing speed limits on limited access highways(freeways). Measurements were also made on only four sections of Interstate highways and the resultsare presented in an appendix. The limited results of the freeway studies are an indication of the effects ofraising the speed limit at the study sites only. Thus, use of the study findings should not be made indiscussions about roadways that were formerly subject to the recently repealed National Maximum SpeedLimit.
Because of the controversial nature of the subject of changing speed limits, and because the results aresomewhat contrary to what many expect when speed limits are raised or lowered, the TransportationResearch Board conducted a workshop a t FHWA’s request with this report as the primary resource paper.The purpose of the workshop was to get a thorough review of the methods of data collection and analysesto ensure that there are no questions as to the validity of the reported results. As recommended by theworkshop participants, we are publishing this report with the few minor modifications identified. Thechanges dealt mostly with the following : removing the author’s opinions that were not based on theresearch results, indicating why the initial experimental plan could not be followed, describing the threetypes of sites where speed limits were changed, doing an accident analysis based on accident rates toaccommodate sites where traffic volumes had changed, and putting the freeway analysis in an appendixand noting that freeway data is much different than surface roadway site data in both speed changes andaccident results. Also, the report title was changed to indicate that the sites studied were “selectedroadway sections.”
The reader should remember that this report addresses the observed behavior of a very large number ofdrivers operating under a wide variety of highway conditions and various speed limit scenarios. The reportdescribes the results of one of the broadest speed behavior studies ever undertaken, and it is believed tooffer valuable insight on the relationship of highwa y geometrics, speed limits, driver behavior, and highwayaccidents. The report should be considered as a resource document as opposed to a speed policyrecommendation.
Sufficient copies of this report are being distributed to provide a minimum of two copies to each FHWAregional office and six copies to each Division office . Four of the Division office copies should be sent totheir State highway agency by the division
A. George Ostensen, DirectorOffice of Safety and Traffic Operations
Research and Development
NOTICE
This document is disseminated under the sponsorship of the Department of Transportation in the interestof information exchange. The United Sates Government assumes no liability for its contents or usethereof. This report does not constitute a standard, specification, or regulation.
The United States Government does not endorse products or manufacturers. Trade or manufacturersnames appear herein only because they are considered essential to the object of the document.

Technical Report Documentation Page
EFFECTS OF RAISING AND LOWERING SPEED LIMITSON SELECTED ROADWAY SECTIONS
Martin R. Parker & Associates, Inc.38549 Laurenwood Drive
Office of Safety and Traffic Operations R&DFederal Highway Administration6300 Georgetown PikeMcLean, Virginia 22101-2296
October 1985 - June 1996
Contracting Officer’s Technical Representative (COTR): Howard H. Bissell, HSR-30Davey L. Warren, HSR-20
t6. Abstract
The objective of this research was to examine the effects of raising and lowering posted speed limits ondriver behavior for urban and rural nonlimited access highways . Sites selected for study were furnished by theparticipating States. The study was conducted during the period from October 1985 to September 1992, whenthe maximum speed limit was 5 5 mi/h (89 km/h) on nonlimited access highways. During this period, the Statesand localities lowered and raised posted speed limits on short roadway segments, typically less than 2 mi(3.2 km) in length. The general types of sites included in the study were short sections, i.e. , 0.5mi (0.8-km)segments in rural communities, I-mi (1.6-km) sections in urban and rural communities, and 2-to 12-mi (3-to19-km) rural sections where speed limits were raised. The study included the collection of driver behavior andcrash data in 22 States. The data were collected at 100 sites on nonlimited access highways, consisting of172 mi (277 km) where speed limits were either lowered or raised, and at 83 comparison sites, consisting of132 mi (213 km) where no changes in the posted speed limits were made. Changes in the posted speed limitsranged from lowering the speed limit by 5, IO, 15, or 2 0 mi/h (8, 16, 24, or 32 km/h) to raising the speed limit by5, 10, or 15 mi/h (8, 16, or 24 km/h). Only one change in the posted speed limit was made at each site duringthe study.
There is statistically sufficient evidence in thi s dataset to reject the hypothesis that driver speeds do notchange when posted speed limits are either raised or lowered. However, the differences in speeds, less than1.5 mi/h (2.4 km/h), are not sufficiently large to be of practical significance, and are due primarily to largesample sizes. Although the changes in vehicle speeds were small, driver violations of the speed limitsincreased when posted speed limits were lowered. Conversely, violations decreased when speed limits wereraised. This does not reflect a change in driver behavior, but a change in how compliance is measured, i.e.,From the posted speed limit. There is not sufficient evidence in thi s dataset to reject the hypothesis that crashexperience changed when posted speed limits were either lowered or raised.
17. Key Words
Mean speed, 85th percentile speed,headway, driver compliance, crash analysis
18. Distribution Statement
No restrictions. This document is availablethrough the National Technical InformationService, Springfield, Virginia 22161.
19. Security Classif (of this report) 20. Security Classif. (of this page)
Unclassified Unclassified21. No. of Pages
17522. Price

METRIC/ENGLISH CONVERSION FACTORS
ENGLISH TO METRIC
LENGTH (APPROXIMATE)1 inch (in) = 2.5 centimeters (cm)1 foot (ft) = 30 centimeters (cm)
1 yard (yd) q 0.9 meter (m)1 mile (mi) = 1.6 kilometers (km)
AREA (APPROXIMATE)
1 square inch (sq in, in2 = 6.5 square centimeters (cm2)1 square foot (sq ft, ft2 = 0.09 square meter (m2)
1 square yard (sq yd, yd2) = 0.8 square meter (m2)1 square mile (sq mi, mi2) = 2.6 square kilometers (km2)1 acre = 0.4 hectares (he) = 4,000 square meters (m2)
MASS - WEIGHT (APPROXIMATE)
1 ounce (oz) = 28 grams (gr)1 pound (lb) = .45 kilogram (kg)
1 short ton = 2,000 pounds (Lb) = 0.9 tonne (t)
VOLUME (APPROXIMATE)
1 teaspoon (tsp) = 5 milliliters (ml)
1 tablespoon (tbsp) q 15 milliliters (ml)1 fluid ounce (fl oz) = 30 milliliters (ml)
1 cup (c) = 0.24 liter (l)1 pint (pt) = 0.47 liter (l)
1 quart (qt) = 0.96 liter (l)1 gallon (gal) = 3.8 liters (l)
1 cubic foot (cu ft, ft3) = 0.03 cubic meter (m3)1 cubic yard (cu yd, yd3) = 0.76 cubic meter (m3)
TEMPERATURE (EXACT)
[(x-32)(5/9)] oF q y oC
METRIC TO ENGLISH
LENGTH (APPROXIMATE)1 millimeter (mm) = 0.04 inch (in)1 centimeter (cm) = 0.4 inch (in)
1 meter (m) = 3.3 feet (ft)1 meter (m) = 1.1 yards (yd)
1 kilometer (km) = 0.6 mile (mi)
AREA (APPROXIMATE)
1 square centimeter (cm2) = 0.16 square inch (sq in, in2)1 square meter (m2) = 1.2 square yards (sq yd, yd2)
1 square kilometer (km2) = 0.4 square mile (sq mi, mi2)1 hectare (he) = 10,000 square meters (m2) = 2.5 acres
MASS - WEIGHT (APPROXIMATE)
1 gram (gr) = 0.036 ounce (oz)1 kilogram (kg) = 2.2 pounds (lb)
1 tonne (t) = 1,000 kilograms (kg) = 1.1 short tons
VOLUME (APPROXIMATE)
1 milliliters (ml) q 0.03 fluid ounce (fl oz)
1 liter (1) = 2.1 pints (pt)1 liter (l) = 1.06 quarts (qt)1 liter (l) = 0.26 gallon (gal)
1 cubic meter (m3) = 36 cubic feet (cu ft, ft3)1 cubic meter (m3) = 1.3 cubic yards (cu yd, yd3)
TEMPERATURE (EXACT)
[(9/5) y + 32] oC q x oF
QUICK INCH-CENTIMETER LENGTH CONVERSION
INCHES 0 1 2 3 4 5 6 7 8 9 10I I I I I I I I I I
CENTIMETERS 0 1 2 3 4 5 6 7 8 9 10 11 12 13 14 15 16 17 18 19 20 21 22 23 24 2525.40
QUICK FAHRENHEIT-CELSIUS TEMPERATURE CONVERSION
oF -40° -22O -4° 14° 32° 50° 68° 86° 104° 122° 140° 158° 176° 194° 212°
-40° I 1 I I I I I I I I I I I I
° C -3O° -2O° -l0° O° 1O° 20° 30° 40° 50° 60° 70° 80° 90° l00°
For more exact and or other conversion factors, see NBS Miscellaneous Publication 286, Units of Weights andMeasures. Price $2.50. SD Catalog No. Cl3 10286.
iv

TABLE OF CONTENTS
Section Page
INTRODUCTION . . . . . . . . . . . . . . . , . . . . . . . . . . . . . . . . . . . . . . . . . . . . . . . . . 1
OBJECTIVE PE . . . . . . . . . . . . . . . . . . . . . . . . . . . . . . . . . . . . . . . . . 2
METHODOL . . . . . . . . . . . . . . . . . . . . . . . . . . . . . . . . . . . . . . . . . . . . . . . . . 4
Selection of Experimental ectionss . . . . . . . . . . . . . . . . . . . . . . . . . . . . . . . . . 6Selection of Comparison Section s . . . . . . . . . . . . . . . . . . . . . . . . . . . . . . . . . . 9Data Collection . . . . . . . . . . . . . . . . . . . . . . . . . . . . . . . . . . . . . . . . . . . . . . . . . 10
Selection of Free-Flow Vehicle s . . . . . . . . . . . . . . . . . . . . . . . . . . . . 11Speed and Headway Data Collection . . . . . . . . . . . . . . . . . . . . . . . . 12Crash Data Collectio n . . . . . . . . . . . . . . . . . . . . . . . . . . . . . . . . . . . . . 15
SITE CHARACTERISTICS . . . . . . . . . . . . . . . . . . . . . . . . . . . . . . . . . . . . . . . . . 16
EFFECTS ON DRIVER BEHAVIOR . . . . . . . . . . . . . . . . . . . . . . . . . . . . . . . . . 22
Effects on Speedd . . . . . . . . . . . . . . . . . . . . . . . . . . . . . . . . . . . . . . . . . . . . . . . 22Speed Variables . . . . . . . . . . . . . . . . . . . . . . . . . . . . . . . . . . . . . . . . . 23Resultss . . . . . . . . . . . . . . . . . . . . . . . . . . . . . . . . . . . . . . . . . . . . . . . . . 24Resurfaced Section s . . . . . . . . . . . . . . . . . . . . . . . . . . . . . . . . . . . . . . 3885th Percentile Speed and Posted Speed Limit s . . . . . . . . . . . . . . . 40
Effects on Driver Complianc e . . . . . . . . . . . . . . . . . . . . . . . . . . . . . . . . . . . . . 43Effects on Close Following Behavior . . . . . . . . . . . . . . . . . . . . . . . . . . . . . . . 49Repeated Measurement s . . . . . . . . . . . . . . . . . . . . . . . . . . . . . . . . . . . . . . . . 54Indirect Effects on Nearby Road s . . . . . . . . . . . . . . . . . . . . . . . . . . . . . . . . . 57Discussion of Speed Effect s . . . . . . . . . . . . . . . . . . . . . . . . . . . . . . . . . . . . . 61
EFFECTS ON CRASHES . . . . . . . . . . . . . . . . . . . . . . . . . . . . . . . . . . . . . . . . . . 67
Analysis Methodologyy . . . . . . . . . . . . . . . . . . . . . . . . . . . . . . . . . . . . . . . . . . . 67Evaluation Design . . . . . . . . . . . . . . . . . . . . . . . . . . . . . . . . . . . . . . . . 68Procedure . . . . . . . . . . . . . . . . . . . . . . . . . . . . . . . . . . . . . . . . . . . . . . 70
Results . . . . . . . . . . . . . . . . . . . . . . . . . . . . . . . . . . . . . . . . . . . . . . . . . . . . . . . 71Results at 85th Percentile Site s . . . . . . . . . . . . . . . . . . . . . . . . . . . . . 71Multiple-Vehicle vs. Single-Vehicle Crashe s . . . . . . . . . . . . . . . . . . 75Crash-Speed Relationship s . . . . . . . . . . . . . . . . . . . . . . . . . . . . . . . . 76
Discussion of Crash Effect s . . . . . . . . . . . . . . . . . . . . . . . . . . . . . . . . . . . . . . 81
iii

TABLE OF CONTENTS (continued)
Section Page
SUMMARY, FINDINGS, AND CONCLUSIONS . . . . . . . . . . . . . . . . . . . . . . 83
SUMMARY . . . . . . . . . . . . . . . . . . . . . . . . . . . . . . . . . . . . . . . . . . . . . . . . . . . . 83FINDINGS . . . . . . . . . . . . . . . . . . . . . . . . . . . . . . . . . . . . . . . . . . . . . . . . . . . . . 85CONCLUSIONS . . . . . . . . . . . . . . . . . . . . . . . . . . . . . . . . . . . . . . . . . . . . . . . . 87
SUGGESTIONS FOR FUTURE RESEARCH . . . . . . . . . . . . . . . . . . . . . . . . 88
APPENDIX A. SITE CHARACTERISTICS . . . . . . . . . . . . . . . . . . . . . . . . . . 89
APPENDIX B. VEHICLE SPEED DATA . . . . . . . . . . . . . . . . . . . . . . . . . . . . 97
APPENDIX C. DRIVERS EXCEEDING THE SPEED LIMIT . . . . . . . . . . 123
APPENDIX D. REPEATED SPEED MEASUREMENTS . . . . . . . . . . . . . 131
APPENDIX E. SUMMARY OF CRASH DATA . . . . . . . . . . . . . . . . . . . 133
APPENDIX F. CRASH ANALYSIS PROCEDURE . . . . . . . . . . . . . . . . . . 141
APPENDIX G. EFFECTS ON A SAMPLE OFINTERSTATE SECTIONS.. . . . . . . . . . . . . . . . . . . . . . . . 147
REFERENCES . . . . . . . . . . . . . . . . . . . . . . . . . . . . . . . . . . . . . . . . . . . . . . . . . . . 163
iv
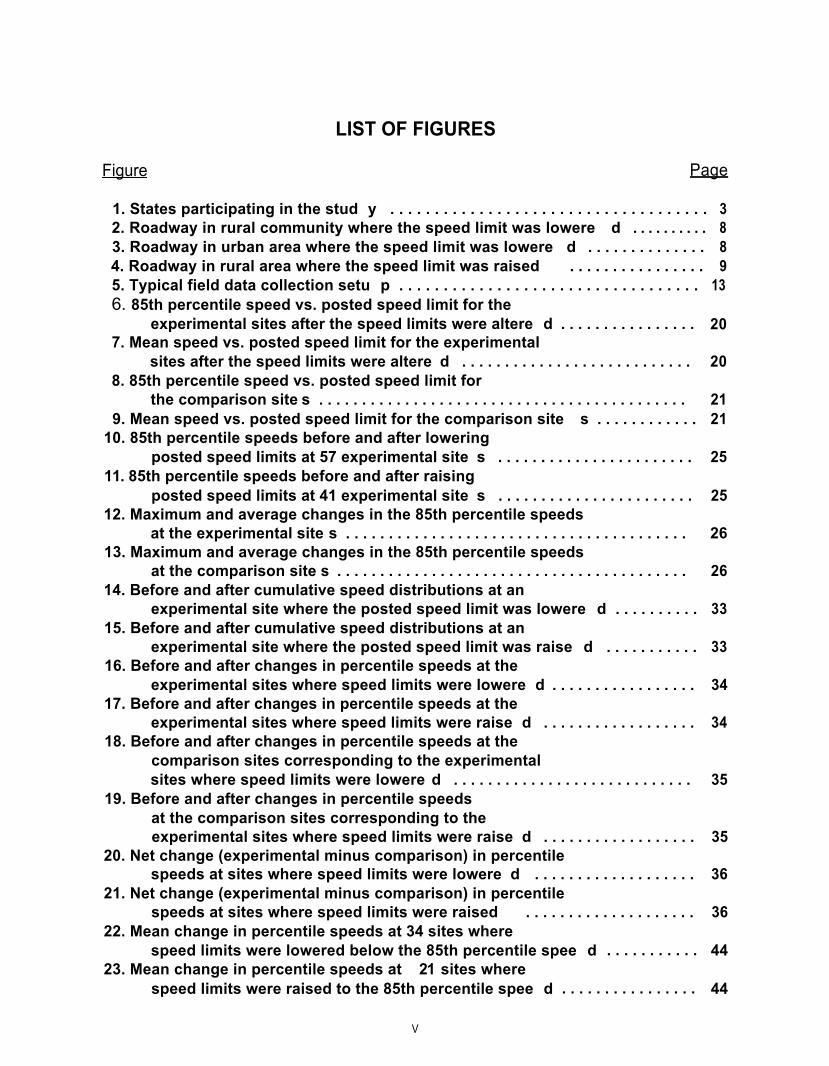
LIST OF FIGURES
Figure Page
1. States participating in the stud y . . . . . . . . . . . . . . . . . . . . . . . . . . . . . . . . . . . . 32. Roadway in rural community where the speed limit was lowere d . . . . . . . . . . 83. Roadway in urban area where the speed limit was lowere d . . . . . . . . . . . . . . 84. Roadway in rural area where the speed limit was raised . . . . . . . . . . . . . . . . 95. Typical field data collection setu p . . . . . . . . . . . . . . . . . . . . . . . . . . . . . . . . . . 136. 85th percentile speed vs. posted speed limit for the
experimental sites after the speed limits were altere d . . . . . . . . . . . . . . . . 207. Mean speed vs. posted speed limit for the experimental
sites after the speed limits were altere d . . . . . . . . . . . . . . . . . . . . . . . . . . . 208. 85th percentile speed vs. posted speed limit for
the comparison site s . . . . . . . . . . . . . . . . . . . . . . . . . . . . . . . . . . . . . . . . . . . 219. Mean speed vs. posted speed limit for the comparison site s . . . . . . . . . . . . 21
10. 85th percentile speeds before and after loweringposted speed limits at 57 experimental site s . . . . . . . . . . . . . . . . . . . . . . . 25
11. 85th percentile speeds before and after raisingposted speed limits at 41 experimental site s . . . . . . . . . . . . . . . . . . . . . . . 25
12. Maximum and average changes in the 85th percentile speedsat the experimental site s . . . . . . . . . . . . . . . . . . . . . . . . . . . . . . . . . . . . . . . . 26
13. Maximum and average changes in the 85th percentile speedsat the comparison site s . . . . . . . . . . . . . . . . . . . . . . . . . . . . . . . . . . . . . . . . . 26
14. Before and after cumulative speed distributions at anexperimental site where the posted speed limit was lowere d . . . . . . . . . . 33
15. Before and after cumulative speed distributions at anexperimental site where the posted speed limit was raise d . . . . . . . . . . . 33
16. Before and after changes in percentile speeds at theexperimental sites where speed limits were lowere d . . . . . . . . . . . . . . . . . 34
17. Before and after changes in percentile speeds at theexperimental sites where speed limits were raise d . . . . . . . . . . . . . . . . . . 34
18. Before and after changes in percentile speeds at thecomparison sites corresponding to the experimentalsites where speed limits were lowere d . . . . . . . . . . . . . . . . . . . . . . . . . . . . 35
19. Before and after changes in percentile speedsat the comparison sites corresponding to theexperimental sites where speed limits were raise d . . . . . . . . . . . . . . . . . . 35
20. Net change (experimental minus comparison) in percentilespeeds at sites where speed limits were lowere d . . . . . . . . . . . . . . . . . . . 36
21. Net change (experimental minus comparison) in percentilespeeds at sites where speed limits were raised . . . . . . . . . . . . . . . . . . . . 36
22. Mean change in percentile speeds at 34 sites wherespeed limits were lowered below the 85th percentile spee d . . . . . . . . . . . 44
23. Mean change in percentile speeds at 21 sites wherespeed limits were raised to the 85th percentile spee d . . . . . . . . . . . . . . . . 44
V

LlST OF FIGURES (continued)
Fiaure Paae
24. Average driver compliance at 57 experimental sitesbefore the speed limits were lowere d . . . . . . . . . . . . . . . . . . . . . . . . . . . . . 45
25. Average driver compliance at 41 experimental sitesbefore the speed limits were raise d . . . . . . . . . . . . . . . . . . . . . . . . . . . . . . . 45
26. Average driver compliance at the comparison site s . . . . . . . . . . . . . . . . . . . 4627. Driver compliance before and after speed limits
were changed at the experimental site s . . . . . . . . . . . . . . . . . . . . . . . . . . . 4728. Before and after percent changes in hea d ays at a low-volume
experimental site where the speed limit was lowere d . . . . . . . . . . . . . . . . 5229. Before and after percent changes in headways at a high-volume
experimental site where the speed limit was lowere d . . . . . . . . . . . . . . . . 5230. Before and after percent changes in headways at a low-volume
experimental site where the speed limit was raise d . . . . . . . . . . . . . . . . . . 5331. Before and after percent changes in headways at a high-volume
experimental site where the speed limit was raise d . . . . . . . . . . . . . . . . . . 5332. Mean changes in 85th percentile speeds at five sites where speed limits
were lowered and at six sites where speed limits were raise d . . . . . . . . . 5633. Summary of crash effects at sites where posted speed limits
werealtered . . . . . . . . . . . . . . . . . . . . . . . . . . . . . . . . . . . . . . . . . . . . . . . . . . 7434. Summary of crash effects at sites where speed limits were
lowered below or raised to the 85th percentile speed s . . . . . . . . . . . . . . . 7435. Before and after changes in crashes vs. changes in the
85th percentile speeds at sites where speed limits were lowere d . . . . . . 7736. Before and after changes in crashes vs. changes in the
85th percentile speeds at sites where speed limits were raise d . . . . . . . . 7737. Before and after changes in crashes vs. changes in the
mean speeds at sites where speed limits were lowere d . . . . . . . . . . . . . . 7838. Before and after changes in crashes vs. changes in the
mean speeds at sites where speed limits were raise d . . . . . . . . . . . . . . . . 7839. Before and after changes in crashes vs. changes in the coefficients
of variation of speeds at sites where speed limits were lowere d . . . . . . . 7940. Before and after changes in crashes vs. changes in the coefficients
of variation of speeds at sites where speed limits were raise d . . . . . . . . . 7941. Ratio of the change in crashes vs. ratio of the change in
85th percentile speeds where speed limits were lowere d . . . . . . . . . . . . . 8042. Ratio of the change in crashes vs. ratio of the change in
85th percentile speeds where speed limits were raise d . . . . . . . . . . . . . . . 8043. Mean changes in percentile speeds after speed limits were
lowered at 57 sites and raised at 41 site s . . . . . . . . . . . . . . . . . . . . . . . . . . 8544. Before and after cumulative speed distributions at a
rural Interstate experimental site in Californi a . . . . . . . . . . . . . . . . . . . . . 152
vi

LIST OF FIGURES (continued)
Figure Page
45. Changes in the percentile speeds for four selected ruralInterstate experimental sites after the speed limit was raised . . . . . . . . 153
46. Changes in the percentile speeds for four selectedInterstate comparison sites after the speed limitwas raised at the experimental sites . , . . . . . . . . . . . . . . . . . . . . . . . . . . . 153
47. Changes in the mean and standard deviation of speeds atfour selected rural Interstate experimental sites . . . . . . . . . . . . . . . . . . . 154
48. Before and after 85th percentile speeds at rural Interstate sites . . . . . . . . 15749. Before and after 85th percentile speeds at
three California limited access sites . . . . . . . . . . . . . . . . . . . . . . . . . . . . . 15750. Before and after mean speeds at a rural Interstate site, an urban
Interstate site, and two nearby rural two-lane highway locations . . . . . . 158
vii

TableLIST OF TABLES
Page
1. Sample of 24-h free-flow speed data collected at a site . . . . . . . . . . . . . . . . 142. Sample of crash data collected at a sit e . . . . . . . . . . . . . . . . . . . . . . . . . . . . . 153. Experimental sites by area type and level of speed limit change . . . . . . . . . 174. Distribution of experimental sites by before and after
percentilespeedsposted . . . . . . . . . . . . . . . . . . . . . . . . . . . . . . . . . . . . . . .5. Before and after group mean and 85th percentile speeds . . . . . . . . . . . . . . . 276. Before and after vehicle speeds for the experimental
andcomparisonsites . . . . . . . . . . . . . . . . . . . . . . . . . . . . . . . . . . . . . . . . . . 287. Differences in speed characteristics for the
resurfaced experimental site s . . . . . . . . . . . . . . . . . . . . . . . . . . . . . . . . . . . 398. Differences in speed characteristics for the
corresponding comparison site s . . . . . . . . . . . . . . . . . . . . . . . . . . . . . . . . . 399. Differences in speed characteristics at sites where speed limits were
lowered more than 5 mi/h (8 km/h) below the 85th percentile speed . . . . 4110. Differences in speed characteristics at sites where speed limits were
raised to within 5 mi/h (8 km/h) of the 85th percentile spee d . . . . . . . . . . 4211. Percentage of drivers exceeding posted
speed limits at the experimental site s . . . . . . . . . . . . . . . . . . . . . . . . . . . . . 4812. Percentage of drivers exceeding posted
speed limits at the comparison site s . . . . . . . . . . . . . . . . . . . . . . . . . . . . . . 4813. Before and after short headway data for 28 experimental sites
where posted speed limits were lowere d . . . . . . . . . . . . . . . . . . . . . . . . . . 5014. Before and after short headway data for 48 experimental sites
where posted speed limits were raise d . . . . . . . . . . . . . . . . . . . . . . . . . . . . 5115. Repeated speed measurements at 11 experimental site s . . . . . . . . . . . . . . . 5516. Contiguous site characteristic s . . . . . . . . . . . . . . . . . . . . . . . . . . . . . . . . . . . . 5717. Before speed data for the contiguous site s . . . . . . . . . . . . . . . . . . . . . . . . . . 5818. After speed data for the contiguous site s . . . . . . . . . . . . . . . . . . . . . . . . . . . . 5819. Differences in speed characteristics for the contiguous site s . . . . . . . . . . . 5920. Percentage of drivers exceeding posted speed limits
at the contiguous site s . . . . . . . . . . . . . . . . . . . . . . . . . . . . . . . . . . . . . . . . . 5921. Before and after crash data for the contiguous site s . . . . . . . . . . . . . . . . . . . 5922. Summary of research studies on the effects of
raising and lowering speed limit s . . . . . . . . . . . . . . . . . . . . . . . . . . . . . . . . 6323. Summary of operational studies on the effects
of raising and lowering speed limit s . . . . . . . . . . . . . . . . . . . . . . . . . . . . . . 6524. Summary of statistical test s . . . . . . . . . . . . . . . . . . . . . . . . . . . . . . . . . . . . . . . 7225. Summary of crash results at 85th percentile site s . . . . . . . . . . . . . . . . . . . . . 7326. Multiple-vehicle and single-vehicle crashe s . . . . . . . . . . . . . . . . . . . . . . . . . . 7527. Experimental site characteristic s . . . . . . . . . . . . . . . . . . . . . . . . . . . . . . . . . . 8928. Comparison site characteristic s . . . . . . . . . . . . . . . . . . . . . . . . . . . . . . . . . . . 9329. Before speed data for the experimental site s . . . . . . . . . . . . . . . . . . . . . . . . . 97
viii

TableLIST OF TABLES (continued)
Page
30. After speed data for the experimental site s . . . . . . . . . . . . . . . . . . . . . . . . . 10131. Differences in speed characteristics for the experimental site s . . . . . . . . . 10532. Average changes in speed characteristics for the
experimental site group s . . . . . . . . . . . . . . . . . . . . . . . . . . . . . . . . . . . . . . 10933. Before speed data for the comparison site s . . . . . . . . . . . . . . . . . . . . . . . . . 11034. After speed data for the comparison site s . . . . . . . . . . . . . . . . . . . . . . . . . . 11435. Differences in speed characteristics for the comparison site s . . . . . . . . . . 11836. Average changes in speed characteristics for the
comparison site group s . . . . . . . . . . . . . . . . . . . . . . . . . . . . . . . . . . . . . . . 12237. Percentage of drivers exceeding posted speed limits
at the experimental site s . . . . . . . . . . . . . . . . . . . . . . . . . . . . . . . . . . . . . . . 12338. Percentage of drivers exceeding posted speed limits
at the comparison site s . . . . . . . . . . . . . . . . . . . . . . . . . . . . . . . . . . . . . . . . 12739. Repeated speed measurements for the experimental sites
where speed limits were lowere d . . . . . . . . . . . . . . . . . . . . . . . . . . . . . . . . 13140. Repeated speed measurements for the experimental sites
where speed limits were raise d . . . . . . . . . . . . . . . . . . . . . . . . . . . . . . . . . 13241. Crash data for the experimental site s . . . . . . . . . . . . . . . . . . . . . . . . . . . . . . 13342. Crash data for the comparison site s . . . . . . . . . . . . . . . . . . . . . . . . . . . . . . . 13743. Crash summary by year for the sites where
speed limits were raise d . . . . . . . . . . . . . . . . . . . . . . . . . . . . . . . . . . . . . . . 14244. Example of paired comparison ratios method using
raised speed limit site s . . . . . . . . . . . . . . . . . . . . . . . . . . . . . . . . . . . . . . . . 14445. Interstate experimental site characteristic s . . . . . . . . . . . . . . . . . . . . . . . . . 14846. Interstate comparison and nearby site characteristic s . . . . . . . . . . . . . . . . 14847. Before speed data for the Interstate experimental site s . . . . . . . . . . . . . . . 14948. After speed data for the Interstate experimental site s . . . . . . . . . . . . . . . . . 14949. Differences in speed characteristics for the
Interstate experimental site s . . . . . . . . . . . . . . . . . . . . . . . . . . . . . . . . . . . 14950. Before speed data for the Interstate comparison and nearby site s . . . . . . 15051. After speed data for the Interstate comparison and nearby site s . . . . . . . . 15052. Differences in speed characteristics for the
Interstate comparison and nearby site s . . . . . . . . . . . . . . . . . . . . . . . . . . 15153. Percentage of drivers exceeding posted speed limits
at the Interstate experimental site s . . . . . . . . . . . . . . . . . . . . . . . . . . . . . . 15554. Percentage of drivers exceeding posted speed limits
at the Interstate comparison and nearby site s . . . . . . . . . . . . . . . . . . . . . 15555. Crash data for the Interstate experimental sites . . . . . . . . . . . . . . . . . . . . . 15956. Crash data for the Interstate comparison site s . . . . . . . . . . . . . . . . . . . . . . 15957. Crash data for the Interstate nearby site s . . . . . . . . . . . . . . . . . . . . . . . . . . . 16058. Interstate total crash result s . . . . . . . . . . . . . . . . . . . . . . . . . . . . . . . . . . . . . 16259. Interstate injury crash result s . . . . . . . . . . . . . . . . . . . . . . . . . . . . . . . . . . . . 162
ix

INTRODUCTION
This study was conducted to examine driver behavior effects when posted speedlimits are raised and lowered on nonlimited access urban and rural highways. In theevent that altering the posted speed limits had an impact on traffic speeds, crash datawere collected to examine the safety effects. While much research in recent years hasfocused on the effects of the 55- and 65-mi/h (89- and 105-km/h) speed limits on limitedaccess high-speed facilities, this research concentrated on lower speed urban streetsand rural highways that were posted between 20 and 55 mi/h (32 and 89 km/h).
A maximum speed limit is posted or set by statute on a highway to informmotorists of the highest speed considered to be safe and reasonable under favorableroad, traffic, and weather conditions.
A review of early vehicle speed legislation in the United States suggests thatspeed regulations were established to improve public safety!] The rationale forgovernment regulation of speed is based on the fact that unreasonable speed maycause damage or injury. Speed laws also provide a basis for punishing theunreasonable behavior of an individual driver.
Every State has a basic speed statute requiring drivers to operate their vehiclesat a speed that is reasonable and prudent under existin g conditions.[2] This lawrecognizes that the maximum safe speed varies due to traffic, roadway, weather, light,and other conditions, and places the responsibility of selecting a safe and reasonablespeed on the driver.
Most traffic engineers believe that speed limits should be posted to reflect themaximum speed considered to be safe and reasonable by the majority of drivers usingthe roadway under favorable conditions. [ 3 ] Procedures used to set speed limits haveevolved through years of experience and research. Most States and localities setmaximum speed limits based on the results of an engineering and traffic investigation.
The 85th percentile speed is used as a major factor in selecting the appropriatespeed limit for a street or highway; however, other factors, such as roadside develop-ment, crash experience, and design speed, are ofte n considered.[3] While trafficengineers and enforcement officials consider a number of factors when determining thespeed limit to post, public and political opinions can and do influence their decision.
There are a number of strongly held opinions by the public concerning theeffects of a posted speed limit. One of the opinions often expressed is that setting lowspeed limits will reduce vehicle speeds and crashes. Also, it has been frequentlysuggested that most motorists drive 5 to I O mi/h (8 to 16 km/h) over the posted speedlimit, so lower speed limits should be established to account for this condition.
Conversely, it is believed that raising the posted speed limit on nonlimited accesshighways increases vehicle speeds and crashes. For example, following a severecrash, one of the most frequent requests made to highway jurisdictions is to lower the
1

speed limit. These requests are founded on public knowledge that crash severityincreases with increasing vehicle speed, because in a collision, the amount of kineticenergy dissipated is proportional to the square of the velocity. Simply stated, when avehicle is involved in a crash, the higher the vehicle speed, the greater the chance ofbeing seriously injured or killed. However, as noted by a number of researchers, thepotential for being involved in a crash is highest when traveling at a speed much loweror much higher than the majority o f motorists.[4-7]
For years, traffic engineering texts have supported the conclusion that motoristsignore unreasonable speed limits. [ 8 ] Both formal research and informal operationalobservations conducted over many years indicate that there is very little change in themean or 85th percentile speed as the result of raising or lowering the posted speed limiton urban and rural nonlimited acces s highways.[9]
Highway administrators, enforcement officials, the judiciary, and the public needfactual information concerning the effects of posted speed limits on driver behavior fornonlimited access roadways. For example, will lowering the posted speed limit on atwo-lane roadway section through a rural community reduce vehicle speeds? Doesraising the posted speed limit to the 85th percentile speed on a short segment ofroadway increase vehicle speeds? Do most motorists drive 5 to 10 mi/h (8 to 16 km/h)above the posted speed limit? What are the effects of lowering or raising speed limitson driver compliance?
OBJECTIVES AND SCOPE
The objective of this research was to determine the effects of raising andlowering speed limits on driver behavior for urban and rural nonlimited accesshighways. During the period the study was conducted, from October 1985 untilSeptember 1992, the maximum speed limit was 55 mi/h (89 km/h) on nonlimited accesshighways. During this time, the locations where States and localities raised andlowered posted speed limits were typically limited to roadway segments less than 2 mi(3.2 km) in length. Consequently, the sites selected for study were limited to roadwaysections with an average site length of 1.7 mi (2.7 km).
Driver behavior effects examined in this study included the speed distribution(percentile speeds), mean speeds, speed variance, percent of drivers exceeding theposted speed limit, and close following behavior. Anticipating that changing the postedspeed limit could have an effect on driver speeds, crash data were collected to examinethe safety effects. The crash data included police-reported crashes, crashes involvinginjury or death, and multiple-vehicle and single-vehicle crashes.
It is important to emphasize that this research was limited to examining driverbehavior effects as a result of changing the posted speed limit only. It is recognizedthat enforcement and public education are key components in making any trafficregulation effective, including speed limits. While highly visible enforcement is essentialto detecting and deterring speeding motorists, and public educational campaigns caninfluence motorists’ attitudes, this research did not examine these factors.
2
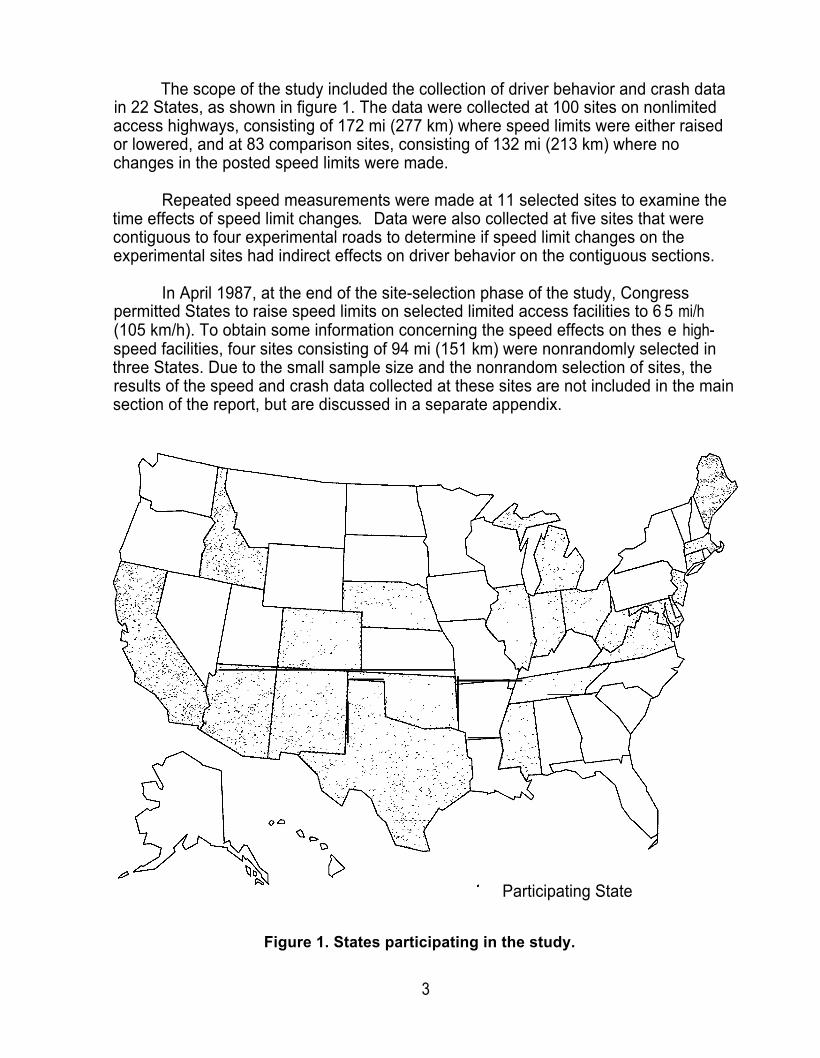
The scope of the study included the collection of driver behavior and crash datain 22 States, as shown in figure 1. The data were collected at 100 sites on nonlimitedaccess highways, consisting of 172 mi (277 km) where speed limits were either raisedor lowered, and at 83 comparison sites, consisting of 132 mi (213 km) where nochanges in the posted speed limits were made.
Repeated speed measurements were made at 11 selected sites to examine thetime effects of speed limit changes. Data were also collected at five sites that werecontiguous to four experimental roads to determine if speed limit changes on theexperimental sites had indirect effects on driver behavior on the contiguous sections.
In April 1987, at the end of the site-selection phase of the study, Congresspermitted States to raise speed limits on selected limited access facilities to 6 5 mi/h(105 km/h). To obtain some information concerning the speed effects on thes e high-speed facilities, four sites consisting of 94 mi (151 km) were nonrandomly selected inthree States. Due to the small sample size and the nonrandom selection of sites, theresults of the speed and crash data collected at these sites are not included in the mainsection of the report, but are discussed in a separate appendix.
Participating State
Figure 1. States participating in the study.
3

METHODOLOGY
Early in the development of the methodology for the study, the researchersproposed that a before-and-after with randomized control group experimental design beutilized to determine the effects of raising and lowering posted speed limits on driverbehavior and crashes. With this design, roadway sections would be randomly drawnfrom the population of nonlimited access highways in the United States. The selectedsections would then be randomly assigned to experimental and control groups. Postedspeed limits on highways in the experimental group would either be raised or lowered.No changes in the posted speed limits would be made at the control sites.
Utilizing this experimental plan would reduce the major threats to internal andexternal validity, i.e., one would be able to generalize the findings to the population ofnonlimited access roadways from which the sites were drawn.
It was recognized by the sponsor and the researchers that this experimentaldesign would be extremely difficult, if not impossible, to implement. On late 1985, letterswere sent to the 50 State transportation agencies requesting their participation in theexperiment. Written responses and telephone conversations with agency personnelindicated that only three States had a limited interest in permitting the researchers torandomly select roadways for speed limit changes.
The major reasons cited by the States for not participating are listed below:
By law, the States are responsible for setting speed limits on the basis of atraffic and engineering investigation. To raise or lower the speed limit on arandomly selected roadway section for research purposes would not meet therequirements of State and local statutes.
The potential for tort liability resulting from changing the speed limit on aselected experimental section, where the decision to alter the limit was notbased on an engineering investigation, was a major objection. Also, therewere liability concerns for not changing the speed limit on a comparisonsection if an investigation indicated that the limit should be altered.
There were concerns that the credibility and reputation of the transportationagency would be diminished if they allowed the researchers to select thesites for speed limit changes. The primary concern was that the speed limitchange would be controversial or would not be supported by the public.
From the responses received, it was clear that the study could not be conductedas proposed. Members of the American Association of State Highway andTransportation Officials’ (AASHTO) Subcommittee on Traffic Engineering wereinstrumental in assisting with the development of a realistic plan that would provideinformation on the effects of speed limit changes. Major considerations, provided bythe AASHTO Subcommittee, that influenced the selection of the final plan aresummarized on the following page:
4
-
-
-
-
-
Experimental sections for the study would have to be drawn from roadwayswhere speed limit changes were made by the agencies based on the resultsof a traffic and engineering investigation.
During any given 12-month period, it was estimated that speed limits werealtered on approximately 100 mi (161 km) of roadway in the United States.
The average length of a section where speed limits were altered was 0.5 mi(0.8 km); however, some sections were 1 mi (1.61 km) in length or greater.
After the decision is made to change a speed limit on a roadway, the newlimit is typically posted within a period ranging from 1 week t o 1 month. Thistime constraint would not permit the collection and analysis of speed, volume,and crash data needed to properly select and match comparison andexperimental site characteristics.
Due to the 55-mi/h (89-km/h) National Maximum Speed Limit in effect duringthe study, most posted speed limit changes occurred on short sections ofnonlimited access facilities located in urban fringe, suburban areas, and smallrural towns.
Because random selection and assignment of sites to experimental andcomparison groups was not possible, the sponsoring agency and the researchers madea decision to select the experimental sites from roadway sections where State and localjurisdictions planned to make speed limit changes based on the results of routine trafficand engineering investigations.[10]] The comparison sites were selected by the researchteam after the experimental sites were identified.
Speed limits on the experimental sites were either raised or lowered by theparticipating State or local highway agency for various reasons as listed below:
. As a result of a request from the public, political leaders, or enforcementofficials.
. To ensure that speed limits were appropriate for roadway and trafficconditions.
l As a result of a high incidence of traffic crashes.
l To comply with local laws or ordinances.
. In response to changing traffic volume and land-use patterns.
Nonrandom selection and assignment of sites to experimental and comparisongroups can produce biased results and limits the findings and conclusions only to thelocations studied. The findings may apply to similar sites where the speed limits arechanged for similar reasons. Generalizations to other roadways are not appropriate.
5

It is important to reiterate that speed limit changes at the study sites were notmade for the purpose of experimentation. Consequently, the researchers were notinvolved in determining the speed limit change, nor was a study of an individual State’smethod of setting speed limits undertaken. All speed limit changes were reported to thepublic in the routine manner used by the State or local jurisdiction. To the author ’sknowledge, no special enforcement or public information campaigns were initiated afterthe new speed limit was posted at any of the study sites.
Selection of Experimental Sections
With the modified plan, 33 States formally agreed to participate in the study bynotifying the researchers of nonlimited access roadway sections where they planned tomake speed limit changes. Using input from the participating jurisdictions, experimentalsites were selected during the period of May 1986 through April 1987. Experimentalsites were selected based on the following considerations:
-
-
-
-
-
-
-
Generally, sections less than 0.5 mi (0.8 km) in length were not selected. Insome cases, however, the segment where the speed limit change occurredwas shorter than originally proposed when the site was selected. Thus, thestudy includes some sites less than 0.5 mi (0.8 km) in length.
Sections that were recently reconstructed or were subject to constructionduring the before or after study periods were not used.
Sections were used when the only physical site changes during the studyperiod were due to routine maintenance, such as repairing potholes,regrading shoulders, repainting center and edge lines, etc. In some cases,sections were included that received minor safety improvements such asreplacing worn traffic signs with new signs. The pavement was resurfaced atfour experimental sites after the speed limits were raised, and the speedeffects at these locations are noted in a subsequent section of this report.
Sections with more than one speed limit change during the study period wereeliminated because the effects of multiple changes could confound theresults.
Sites were selected in States to represent a wide range of geographic andurban and rural conditions.
Sites were selected to provide a mixture of typical locations where speedlimits were either raised or lowered by the States and local jurisdictions duringthe time period the study was conducted.
Time constraints played a role in the selection of some sites. As previouslymentioned, the time period between notification of an available site and thetime the new speed limit was scheduled to be posted varied between 1 week
6

and 1 month. Some sites were not selected for study because there wasinsufficient time for the data collection crews to complete their currentassignment and travel to the next site before the new speed limit was posted.
Approximately 20 percent of the sites submitted by the States and jurisdictionswere actually selected for the study. The predominate reasons for not selecting siteswere that the sections were less than 0.5 mi (0.8 km) in length, and major constructionor safety improvements were made or planned at the sites either during the before orafter study periods.
The experimental plan for the study called for a minimum of 100 mi (161 km)each of experimental and comparison sections based on estimate d fatal and injurycrash counts.[10] As sites were selected, it became clear that the crash counts on thesections were lower than estimated, thus the final sample was increased to contain172 mi (277 km) of experimental sites and 132 mi (213 km) of comparison sites.
The experimental sites on nonlimited access highways included in the study canbe categorized into three basic groups:
1. A roadway section in a small rural town o r community where the speed limiton the adjoining roadway sections was 55 mi/h (89 km/h). Typically, thelength of these sections varied between 0.5 and 1 mi (0.81 and 1.61 km).The speed limit on these roadways was usually lowered, but in some cases,the limit was raised.
2. A roadway section in an urban. suburban. or rural area wher e public orpolitical requests or increases or decreases in th e adjacent land use andcorresponding traffic volumes dictated the need for a change in the speedlimit. These sections were typically 1 mi (1.61 km) in length. The speed limiton some of these roadways was raised, but was lowered at other sites.
3. A two- or four-lane nonlimited access roadway section in a rural area wherethe speed limit was raised to 5 5 mi/h (89 km/h). These sections weregenerally between 2 and 12 mi (3.2 and 19.3 km) in length.
Shown in figure 2 is a roadway section in a small rural community where thespeed limit was lowered from 5 5 mi/h to 45 mi/h (89 km/h to 72 km/h). The roadwaysection is 0.52 mi (0.84 km) in length, and the speed limit on the adjoining sections is55 mi/h (89 km/h).
Shown in figure 3 is a typical roadway in a small urban area where the speedlimit was lowered from 35 to 25 mi/h (56 to 40 km/h). The section is 0.74 mi (1.2 km) inlength. Speed limits on the adjoining sections are 25 and 3 5 mi/h (40 and 56 km/h).
Depicted in figure 4 is a rural location where the speed limit was raised from50 to 55 mi/h (81 to 89 km/h). The roadway segment is 7.33 mi (11.8 km) in length.The speed limit was raised as a result of a routine review of speed limits.
7

Figure 2. Roadway in rural community where the speed limit was lowered.
Figure 3. oadway in urban area where the speed Ii it was lowered.
8
m

Figure 4. Roadway in rural area where the speed limit was raised.
Selection of Comparison Sections
As previously mentioned, comparison sites were not randomly drawn from thepopulation of nonlimited access facilities or from the same source that produced theexperimental sites (i.e., sites studied by the highway agencies for speed limit revisions).Although attempts were made, it was not usually possible to obtain timely informationon segments that were studied for speed limit revisions, but where no speed limitchanges were made. Consequently, comparison sites were selected by the researchteam during their field review of the experimental sites.
Although the comparison sites were not drawn from the same source as theexperimental sites, the researchers decided that it was important to select comparisonsites and to collect speed data at these locations in an attempt to control for factorssuch as weather, special events in the area, and other similar conditions that can affectdriver behavior. The basic premise used to make this decision was that large beforeand after speed differences would be found at the experimental sites.
Guidelines for selecting comparison sites were based on matching, as closely aspossible, the geometric, volume, and speed characteristics of the experimental sites.The matching process, although imprecise because data could not be collected inadvance of site selection, was used in an attempt to find comparison locations withoperational and safety characteristics that were similar to the experimental sites. For
9

example, if the experimental site was a two-lane roadway carrying 2,000 vehicles perday, the research team would attempt to select another two-lane roadway in thejurisdiction with similar volume and speed characteristics.
Although efforts were made to find locations with the same posted speed limit,the comparison site did not always have the same posted speed limit as the experi-mental site. Also, it was not always possible to find a comparison site in the jurisdictionthat exactly matched the volume and speed characteristics of the experimental site. Ineach case, however, the experimental and comparison site pair have the same numberof lanes. Most comparison sections were located within 5 mi (8 km) of the experimentalsites.
In some cases, for economic efficiency, one comparison site was matched withtwo similar experimental sites. At three locations, speed limit changes were made atthe comparison sites after the before data were collected. These segments were thenreclassified as experimental sections. In one case, the speed limit was not changed onthe experimental section, but the agency changed the speed limit on the comparisonsection. The two sections were renamed and used in the study.
Data Collection
Before data were collected at 123 experimental sites and 114 comparison sitesby 3 two-person data collection teams. Some sections were eliminated from the studybecause the planned speed limit alterations were not made, or road and/or utilityconstruction was in progress. At one site in Maryland, two sites in Mississippi, and onesite in Tennessee, the roadway on the experimental section was resurfaced after thebefore data were collected. Instead of eliminating these segments from the study, itwas decided to collect after data at these locations to examine the speed changes. Theresults are presented in a subsequent section of this report.
When the data collection phase of the study was completed, before and afterdata were collected on 100 experimental sections consisting of 172 mi (277 km) and83 comparison locations totaling 132 mi (213 km). Complete speed and headway datawere available for 98 experimental sites and their corresponding comparison sites. Thetermini of two experimental sites were incorrectly given, thus speed data were taken atthe wrong locations. These data are not used in the subsequent analysis of speedeffects. Crash data were available for 99 experimental locations and their correspond-ing comparison sites. One locality could not provide crash data for a site located intheir jurisdiction.
The speed limits on the experimental sections were changed between July 1986and May 1989. Collection of the before data ranged from several days to 2 years priorto the speed limit change. Similarly, collection of the after data ranged from severaldays to as much as 2 years following the speed limit change. The before data werecollected between June 1986 and June 1988. The after data were collected betweenAugust 1987 and July 1989.
10
Selection of Free-Flow Vehicles
One of the basic premises of posting speed limits is to influence driver behavior.Most States and localities measure speeds for setting speed limits based on selectingthe speed of free-flow or unimpeded vehicles. The rationale for this procedure is thatdrivers who are in a platoon have their speed and maneuverability influenced by othervehicles and are not free to select their speed based on geometry, traffic control (whichincludes posted speed limits), and prevailing environmental conditions. Accordingly, ifspeed limits affect driving behavior, free-flow drivers are most likely to be influenced byspeed limit changes. In an attempt to measure the speeds of free-flow vehicles, it wasnecessary to select a method to measure free-flow behavior.
The determination of impeded vs. unimpeded vehicles is a complex issue thathas not been fully investigated. A minimum headway criterion is typically used toidentify free-flow vehicles. A review of the literature indicated that free flow has beendefined as having a minimum headway between vehicles of 3 to 9 s.[11-13] The mostcommonly used minimum headway values in practice and in research studies werebetween 4 and 6s.
In preparing to collect data for this study, it was decided to use a 4-s or greaterheadway, based on research conducted by Hanscom an d others.[14,15] Hanscom foundthat the mean speeds of platoon leaders and following vehicles in the platoon weresignificantly different for a headway time of 4 s or greater. In other words, when theplatoon leader begins to pull away from the following vehicle, the structure of theplatoon is no longer maintained.
Examination of the before data collected at the experimental sites in this studyrevealed that an average of 82 percent of the vehicles sampled had a headway of 4 sor greater and 76.5 percent of the vehicles had a headway of 6 s or greater. Thedifference is 5.5 percent. In other words, if a 6-s definition of free flow would have beenused instead of a 4-s definition, only 5.5 percent fewer vehicles would have been usedin the analysis.
As headway is a function of traffic flow, there is considerable variation in theaverage values mentioned. At a low-volume site (24-h volume of 318 vehicles),2.5 percent of the vehicles had a headway of less than 4 s and 3.1 percent of thevehicles had a headway of less than 6 s. At a high-volume site (24-h volume of19,024 vehicles), 37.7 percent of the vehicles had a headway of less than 4 s and49.8 percent of the vehicles had a headway of less than 6 s.
Regardless of which minimum headway criterion is selected, it is possible thatsituations occurred where headways were greater than 4 or 6 s, but vehicle speedswere impeded. For example, under heavy flow conditions, drivers may choose not toadjust their speed. Also, the platoon leader may just be driving slowly. Within thescope of the study and the equipment used, there was no method available to detectthese conditions or to ensure that all vehicles with a headway of 4 s or more wereunimpeded.
11
Because the speed and headway data were collected by automated equipmentin bins, it is not possible to reanalyze the data using a 6-s or any other headwaycriterion. Consequently, it is unknown whether a 6-s headway would have made adifference in the before and after speed data presented in this report.
While the speeds of all vehicles were measured, only the speeds of free-flowvehicles having a headway of 4 s or more were used in the analyses presented in thisreport. An examination of the all-vehicle speeds vs. free-flow speeds indicated thatfree-flow speeds at the study sites were normally less than 2 mi/h (3 km/h) higher thanthe all-vehicle speeds.
Speed and Headway Data Collection
Volume, speed, and headway data were collected for a 24-h period simultan-eously at each experimental and comparison site pair. The data were collected prior tothe speed limit change on the experimental section, and again after the change wasmade. In most cases, the after data were collected in the same season and on thesame weekday period as the before data. Data were collected during weekday andweekend periods, except no data were collected the day before, during, or after aholiday. At selected sites, multiple measurements were taken to examine seasonal andother effects. The speeds and headways of approximately 1.6 million vehicles werecollected during the study.
The volume, speed, and headway data were collected with Sarasota VC1 900automated roadside units.[16] Due to the memory limitations of the equipment, the datawere recorded in 2-h increments for a 24-h period. The units were programmed tocollect free-flow vehicle speeds by direction of travel and for two vehicle-lengthcategories. Vehicles with a length of less than 20 ft (6.1 m) were classified as shortvehicles. Vehicles 20 ft (6.1 m) in length or longer were classified as long vehicles. Foreach vehicle length, the equipment classified free-flow vehicle speeds i n 1-mi/h(1.6-km/h) bins from 1 to 128 mi/h (1.6 to 206 km/h). The accuracy of the equipment forspeed measurement was 0.5 mi/h (0.8 km/h), and the accuracy for length measurementwas 1.5 ft (0.5 m). [16] A field check of the accuracy of the equipment was made duringeach data collection session with either a stopwatch using a defined distance or avehicle with a calibrated speedometer.
Headway data were collected in 11 bins. Data in the first bin included thenumber of vehicles with headways of less than 2 s; the second bin included the numberof vehicles with headways ranging from 2.00 to 2.99 s, etc. The 1 Ith bin included thenumber of vehicles with headways of 11 s or more. The accuracy of the equipment forheadway measurement was 0.5 s.[16]
The data were collected for both directions of travel at a point representative oftypical conditions on the roadway section. At most sites, the data collection points werelocated on tangent, level sections. Shown in figure 5 is a data collection setup showingthe inductive loop mats in the roadway and the roadside units chained to a utility pole.
12

Figure 5. Typical field data collection setup.
Two inductive loop mats were deployed in the center of each lane at each site todetect vehicle speeds and one loop mat was deployed in each lane to collect headwaydata. For speed data collection , 3- by 6-ft (0.9- by 1.8-m) inductive loop mats wereplaced at a distance of 10 ft (3 m) from leading edge to leading edge. Temporaryinductive loop mats were used as sensors to differentiate speeds by vehicle length.
Before and after data were collected at the same point on the roadway to permitcomparisons and eliminate locational differences. Data were not collected near majorintersections, driveways, or other features that would atypically affect normal drivingspeeds. Every attempt was made to conceal the roadside units and to make thesensors as inconspicuous as possible.
The data were extracted from the roadside units with a laptop computer andstored on diskettes. A computer program, written especially for the study, was used tosummarize the speed and headway data for analysis. At each site, the free-flow speeddata were summarized for short vehicles (less than 20 ft (6.1 m) in length), longvehicles (20 ft (6.1 m) in length or greater), and for both vehicle lengths combined. Asample printout of the 24-h speed data for all free-flow vehicles with both vehiclelengths combined is shown in table 1.
The two-person data collection teams also recorded geometric and roadwayfeatures such as the number of lanes, lane width, number of public streets, number ofcommercial and residential driveways, and number of speed limit signs.
13

Table 1. Sample of 24-h free-flow speed data collected at a site.
SITE NUMBER - OK03EB AREA AND ROAD TYPE - Small Urban Two-Lane
STATE - Oklahoma JURISDICTION - City of Sallisaw
ROUTE - 59 (Wheeler Avenue) DIRECTION - Northbound and Southbound CHANNEL NUMBER - 1 and 2
SPEED LIMIT - 35 mi/h FREE-FLOW GAP = > 4 Seconds LONG VEHICLE LENGTH = > 20 Feet
BEGINNING DATE -August 26, 1986 RECORDING INTERVAL - 2 Hours
SUMMARY FOR ALL VEHICLE LENGTHS COMBINED
END MEAN STD FREE- PCT. PERCENT EXCEEDINGTIME S P E E D D E V T O T A L F L O W F R E E PERCENTILE SPEEDS mi/h SPEED LIMIT BY (mi/h) 10-mi/h PACE SKEW.PERIOD mi/h mi/h VOL. VOL. FLOW 1 5 10 15 25 35 50 65 75 85 90 95 99 0 5 10 1 5 ’ 20 LL UL PCT. INDEX
1300 39.5 6.21500 39.5 6.01700 38.8 6.21900 39.5 5.82100 39.2 5.62300 38.9 5.6
100 39.7 6.0300 40.4 6.6500 37.9 5.6700 39.2 6.1900 39.6 5.6
1100 38.9 6.2
729763972898542388147
5158
275796668
589 80.6626 82.0742 76.3711 79.2468 86.3343 88.9139 94.651 100 . 053 91.4
249 90.5603 75.8551 82.7
252223242625233123232524
29 32 34 36 38 4029 33 35 37 39 4028 31 33 35 37 4031 33 35 36 38 4031 33 34 36 38 4031 33 34 36 37 3930 33 35 36 38 4032 32 33 35 38 4031 32 33 35 36 3728 32 34 36 38 4030 33 35 36 38 4028 31 33 36 37 39
42 44 46 48 50 55 78.4 44.8 18.7 4.4 0.8 35 4442 44 45 47 49 53 81.6 48.6 14.4 3.8 0.2 36 4542 43 46 47 49 52 74.9 43.1 15.5 2.6 0.3 34 4342 44 46 47 49 53 80.3 47.0 18.0 3.1 0.4 35 4442 43 48 47 49 52 78.2 44.4 15.2 2.8 0.6 34 4341 43 45 47 49 53 75.2 40.5 14.6 2.3 0.0 35 4442 43 46 47 50 56 84.2 46.0 16.5 3.6 1.4 36 4543 44 49 50 50 54 72.5 47.1 23.5 5.9 0.0 35 4439 42 45 47 48 50 71.7 28.3 15.1 0.0 0.0 31 4042 43 45 48 50 54 78.7 43.0 14.9 4.4 0.4 35 4442 44 46 47 49 52 81.3 48.6 15.8 2.8 0.3 36 4542 43 46 48 49 53 75.7 43.6 16.7 1.6 0.9 35 44
62.0 1 .0067.3 0.8959.6 0.8964.0 0.9465.0 1 .0065.3 1.0667.6 0.9456.9 1.1167.9 1.2566.3 0.9065.5 1 .0060.4 0.95
T O T A L S‘ERIODS
12 39.3 6.0 6,283 5,125 81.6 24 29 32 34 36 38 40 42 43 46 47 49 54 78.4 45.1 16.2 3.1 0.5 35 44 63.0 0.94
1 ft = 0.31 m1 mi/h = 1.61 km/h

Crash Data Collection
The crash data base for this study contains 6,307 police-reported crashes from22 States. For most sections, crash data were available for a 3-yr period before thespeed limit was changed and for a 2-yr after period. The participating transportationagencies furnished the data in a variety of formats, including copies of the crashreports, computer summaries, and individual crash listings.
The original crash data from each jurisdiction were encoded in the formatreceived using dBASE IV, then summarized in a compatible format for analysis. Thevariables coded for each crash include site number, date, day of week, hour, severity(i.e., fatal crash, injury crash, or property damage only crash), the number of personsinjured and killed, type of collision, number of vehicles, lighting and roadway surfaceconditions, intersection relatedness, and estimated vehicle speed (when speeds wererecorded on the crash report). Other crash variables, such as contributing circum-stance, were not collected because they were either not available or not consistentlyreported.
A sample printout of the crash data that were collected and summarized at a siteis shown in table 2.
Table 2. Sample of crash data collected at a site.
SiteDay
Crash of Crash No. No. CrashRoad
No. Light Surface Int. Estimated Speed, mi/hNumber Date Week Hour Severity Inj. Fatal Type Veh. Cond. Cond. Related Veh. 1 Veh. 2 Veh. 3AZ01 E 10/25/84 Thu 15AZ01 E 06/15/65 Sat 7AZ01 E 06/19/85 Wed 10AZ01 E 06/1 9 /85 Wed 16AZ01 E 11/16/85 Sat 16AZ01 E 11 /24/86 Mon aAZ01 E 03/24/87 Tue 18AZ01 E 05/1 1 /87 Mon 16AZ01E 12/15/87 Tue 10AZ01 E 03/17/88 Thu 17AZ01 E 03/31/88 Thu l aAZ01 E 07/14/88 Thu 23AZ01 E 11 /28/88 Mon 6AZ01 E 01/12/89 Thu 6AZ01 E 02/18/89 Sat 20AZ01 E 03/28/89 Tue 6
InjuryInjuryinjuryPDOPDOPDOPDOPDOInjuryInjuryPDOPDOInjuryPDOInjuryInjury
3 03 01 00 00 00 00 00 01 01 00 00 03 00 01 02 0
Head-on 2 Day Dry Yes 30 15 NAHead-on 2
Other 2Angle 2Angle 2
Rear-end 2Ran-off-road 1
Rear-end 3Rear-end 2
Angle 2Other 1
Fixed-object 1Rear-end 4Rear-end 2
Angle 2Ran-off-road 1
Day Dry No 50 25 NADay Dry No NS 35 NADay Dry Yes 15 37 NADay Dry No 3 35 NADay Dry Yes 20 2 NA
Dusk Other Yes 54 NA NADay Dry Yes 40 15 45Day Dry Yes 40 5 NADay Dry Yes 40 15 NADusk Dry No 40 NA NADark Dry No 40 NA NADay Dry Yes 28 0 0Dark Dry Yes 45 0 NADark Dry Yes 45 10 NADay Dry No 40 NA NA
AZ01 E 04 /01 /89 Sat 10 PDO 0 0 Ran-off-road 2 Day Dry No 5 45 NA
1 mi/h = 1.61 km/hNote: PDO = Property Damage Only crash
NS = Not StatedNA = Not Applicable
15

SITE CHARACTERlSTlCS
Of the 100 experimental sites on nonlimited access highways that wereexamined in the study, speed limits were lowered at 59 locations and raised at 41 sites.The number of experimental sites and their section length, stratified by area populationand level of speed limit change, is shown in table 3. Changes in the posted speed limitranged from lowering speed limits by 20 mi/h (32 km/h) on three sections to raising theposted limit by 15 mi/h (24 km/h) at three other locations. Of the 100 sites, 6 roadwayswere multilane, covering 14 mi (23 m). The remainder of the sections were two-lanehighways.
The largest number of experimental sites (63), and nearly 80 percent of the totalmileage included in the study, were located in rural areas with a population of less than5,000 persons. Of the 63 rural sites, 24 sections were located on primary highways thatpassed through small towns and unincorporated areas. Speed limits were raised at 25of the 63 rural locations and lowered at 38 sites.
In addition, 22 sites, which were typically less than 1 mi (1.6 km) in length, werelocated in small urban areas with a population between 5,000 and 50,000 persons.Speed limits were raised at 5 of the 22 small urban sites and lowered at 17 sites.
Finally, 15 sites were located in urban areas with a population of more than50,000 persons. Speed limits were raised at 11 urban sites and lowered at only4 locations.
Speed limits were lowered by 1 0 mi/h (16 km/h) at 35 percent of the sites. Thesecond largest speed limit change occurred at 26 sites, where speed limits were raisedby 5 mi/h (8 km/h). The raised 5-mi/h (8-km/h) group also contained approximately43 percent of the total study mileage. Most of this mileage was at the rural sites wherethe average section length was 4 mi (6 km).
Sites where speed limits were lowered by either 15 or 20 mi/h (24 or 32 km/h)had the highest before posted speed limits, i.e., 50 or 5 5 mi/h (81 or 89 km/h). Bycontrast, sites where speed limits were raised by 10 or 15 mi/h (16 or 24 km/h) had thelowest before posted speed limits, i.e., between 20 and 40 mi/h (32 and 64 km/h).
The 24-h before traffic volumes at the experimental sites ranged from300 vehicles at a low-volume site to 17,000 vehicles at a high-volume location. Theaverage 24-h before volume for all experimental sites was 4,500 vehicles. At thecomparison sites, the 24-h before volumes ranged from a low of 200 vehicles to a highof 22,000 vehicles. The average 24-h before volume for all comparison sites was3,400 vehicles.
A summary of the characteristics for each experimental and comparison site isgiven in appendix A. The sites are grouped in appendix A by the amount the postedspeed limit was changed at the experimental sites to provide consistency with theanalyses presented in subsequent sections of this report.
16
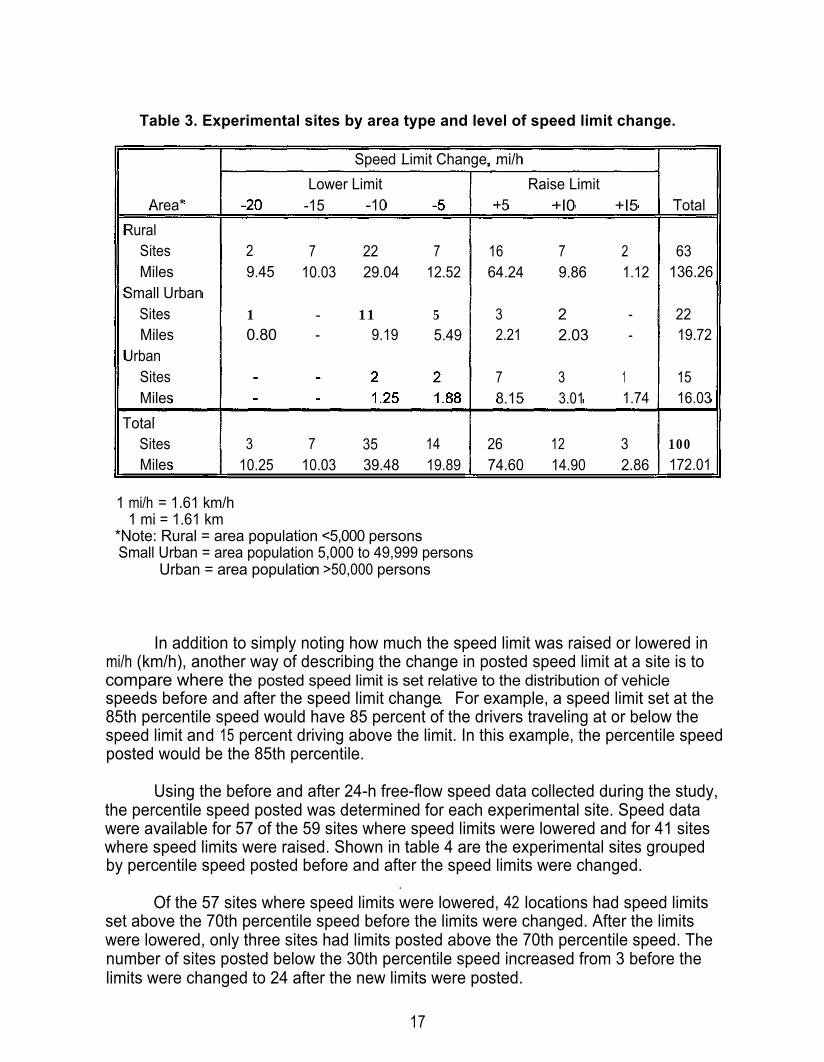
Table 3. Experimental sites by area type and level of speed limit change.
Area*Rural
SitesMiles
Small UrbanSitesMiles
UrbanSitesMiles
TotalSitesMiles
Speed Limit Change, mi/hLower Limit
-15 -10
2 7 22 79.45 10.03 29.04 12.52
1 - 11 50.80 - 9.19 5.49
3 7 35 1410.25 10.03 39.48 19.89
Raise Limit+5 +I0 +I5
16 7 264.24 9.86 1.12
3 2 -2.21 2.03 -
7 3 18.15 3.01 1.74
26 12 374.60 14.90 2.86
Total
63136.26
2219.72
1516.03
100172.01
1 mi/h = 1.61 km/h1 mi = 1.61 km
*Note: Rural = area population <5,000 personsSmall Urban = area population 5,000 to 49,999 persons
Urban = area population >50,000 persons
In addition to simply noting how much the speed limit was raised or lowered inmi/h (km/h), another way of describing the change in posted speed limit at a site is tocompare where the posted speed limit is set relative to the distribution of vehiclespeeds before and after the speed limit change. For example, a speed limit set at the85th percentile speed would have 85 percent of the drivers traveling at or below thespeed limit and 15 percent driving above the limit. In this example, the percentile speedposted would be the 85th percentile.
Using the before and after 24-h free-flow speed data collected during the study,the percentile speed posted was determined for each experimental site. Speed datawere available for 57 of the 59 sites where speed limits were lowered and for 41 siteswhere speed limits were raised. Shown in table 4 are the experimental sites groupedby percentile speed posted before and after the speed limits were changed.
.Of the 57 sites where speed limits were lowered, 42 locations had speed limits
set above the 70th percentile speed before the limits were changed. After the limitswere lowered, only three sites had limits posted above the 70th percentile speed. Thenumber of sites posted below the 30th percentile speed increased from 3 before thelimits were changed to 24 after the new limits were posted.
17
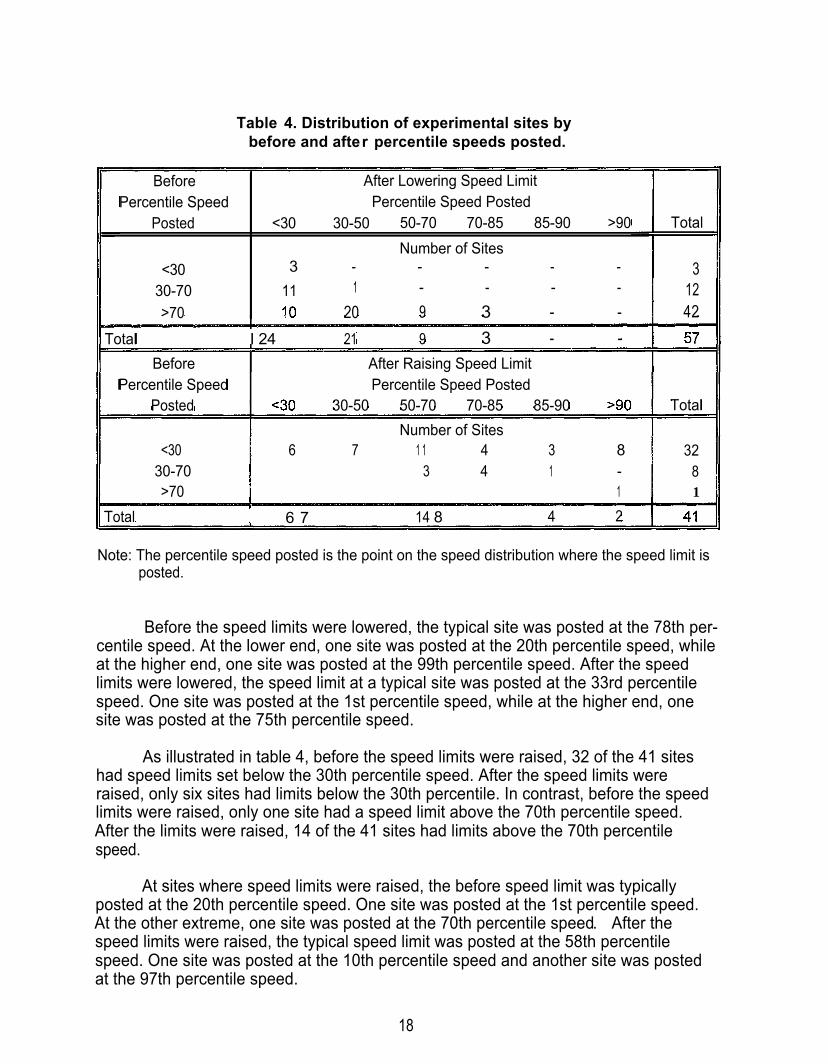
Table 4. Distribution of experimental sites bybefore and after percentile speeds posted.
Before After Lowering Speed LimitPercentile Speed Percentile Speed Posted
Posted <30 30-50 50-70 70-85 85-90 >90Number of Sites
<30 3 - - - - -30-70 11 1 - - - ->70 20 9 3 - -
Total I 24 21 9 3 - -Before
Percentile SpeedPosted
After Raising Speed LimitPercentile Speed Posted
30-50 50-70 70-85 85-90
<3030-70>70
Number of Sites6 7 1 1 4 3 8
3 4 1 -1
Total 6 7 14 8 4 2
Total
31242
Total
3281
Note: The percentile speed posted is the point on the speed distribution where the speed limit isposted.
Before the speed limits were lowered, the typical site was posted at the 78th per-centile speed. At the lower end, one site was posted at the 20th percentile speed, whileat the higher end, one site was posted at the 99th percentile speed. After the speedlimits were lowered, the speed limit at a typical site was posted at the 33rd percentilespeed. One site was posted at the 1st percentile speed, while at the higher end, onesite was posted at the 75th percentile speed.
As illustrated in table 4, before the speed limits were raised, 32 of the 41 siteshad speed limits set below the 30th percentile speed. After the speed limits wereraised, only six sites had limits below the 30th percentile. In contrast, before the speedlimits were raised, only one site had a speed limit above the 70th percentile speed.After the limits were raised, 14 of the 41 sites had limits above the 70th percentilespeed.
At sites where speed limits were raised, the before speed limit was typicallyposted at the 20th percentile speed. One site was posted at the 1st percentile speed.At the other extreme, one site was posted at the 70th percentile speed. After thespeed limits were raised, the typical speed limit was posted at the 58th percentilespeed. One site was posted at the 10th percentile speed and another site was postedat the 97th percentile speed.
18

After the speed limit changes were made at the experimental sites, on average,the speed limit was posted at the 43rd percentile speed. By way of comparison, thespeed limit posted at the comparison sites, where no speed limit changes were made,was, on average, the 45th percentile speed.
For the sites included in this study, these data suggest that the participatingjurisdictions typically post speed limits below the 50th percentile speed. The 85th per-centile speed has been cited as one factor considered by all States and most localitiesin making speed limit changes. [ 3 ] Based on the data collected at the study sites, itappears that other factors are more important than the 85th percentile speed in thedecision-making process.
Shown in figure 6 is the range in 85th percentile speeds by posted speed limitafter the limits were changed on the experimental sections. On average, the speedlimits were posted 5 to 16 mi/h (8 to 26 km/h) below the 85th percentile speed. Thelargest difference occurred at a site with a 47-mi/h (76-km/h) 85th percentile speed anda posted limit of 25 mi/h (40 km/h). At the other extreme, one site had an 85th percen-tile speed of 41 mi/h (66 km/h) and a posted limit of 45 mi/h (72 km/h).
The range in mean speeds by posted limit, after the limits were changed on theexperimental sites, is presented in figure 7. The data illustrate that the posted limitswere set slightly below the average speed of traffic for the majority of sites.
The range in 85th percentile speeds by posted speed limit for the comparisonsites is shown in figure 8. The data indicate that the existing speed limits on thesesections were posted 4 to 12 mi/h (6 to 19 km/h) below the 85th percentile speed. Therange in mean speed by posted limit for the comparison sites is illustrated in figure 9.
The findings on the comparison sites are similar to those at the experimentalsites, i.e., on average, the speed limits on the comparison sites were posted below the50th percentile speed or average speed of traffic.
19

8°Tr==================================~--------1
70
60 ..c: -'E ,j 50 Q) Q) a.
C/) Q) 40
~ Q)
~ 30 Q)
0.. ..c: fg 20
10
..... Highest 85th --If- Average 85th -0- Lowest 85th
64 63
=--::
29
25 30 35 40 45 50 55
1 mi/h == 1.61 km/h Posted Speed Limit, milh
Figure 6. 85th percentile speed vs. posted speed limit for the experimental sites after the speed limits were altered.
8°Tr==================================~-------' ..... Highest Mean --If- Average Mean -0- Lowest Mean
70
60
S 50 E ,j 41 :B 40 a.
C/)
c gj 30
:2:
20 22
10
25 30 35 40 45 50 55
1 mifh == 1.61 km/h Posted Speed Limit, mi/h
Figure 7. Mean speed vs. posted speed limit for the experimental sites after the speed limits were altered.
20

8°Tr=================================.--------~ ....... Highest 85th -H- Average 85th -0- Lowest 85th
70 66
60 ~ ..... 'E -0- 50 Q) Q) 0-W ~ 40 :;:::l c: Q)
e 30 Q) a. ~ 26 -~ 20
10
0 20 25 30 35 40 45 50 55
1 mi/h = 1.61 km/h Posted Speed Limit, mi/h
Figure 8. 85th percentile speed vs. posted speed limit for the comparison sites.
80~====================================~--------1
70
60
S 50 E -c :H 40 0-W c: m 30 ~
20
10
...... Highest Mean -H- Average Mean -0- Lowest Mean
59
21
o~~~~~~~~~~~~~~~~~~~~~~~~~ 20 25 30 35 40 45 50 55
1 mi/h = 1.61 km/h Posted Speed Limit, mi/h
Figure 9. Mean speed vs. posted speed limit for the comparison sites.
21

EFFECTS ON DRIVER BEHAVIOR
The effects of raising and lowering posted speed limits on driver behavior at thenonlimited access roadway sites selected for study are presented in this section. Thespecific effects of speed limit changes on driver behavior include changes in the speeddistribution, driver compliance, and close following.
Also presented in this section are the results of repeated speed measurementstaken at 11 sites to examine speed changes over time, and the results of before andafter speed data collected to examine the indirect effects of speed limit changes at5 contiguous sites. The section concludes with a general discussion of the findings.
Effects on Speed
The before and after results for the 98 experimental sites where speed data werecollected are presented in this section, followed by a discussion of speed changes at4 sites where the pavement was also resurfaced after speed limits were raised. Finally,before and after speed changes at sites where the speed limits were lowered more than5 mi/h (8 km/h) below the 85th percentile speed are given along with the results ofspeed changes at sites where the speed limits were raised to within 5 mi/h (8 km/h) ofthe 85th percentile speed.
The primary objective of the data analysis was to examine before and afterdifferences in driver behavior. The first step in the analysis was to examine before andafter differences in driver behavior at each site. The next step was to decide how togroup or categorize the sites to simplify presentation of the results. Because raisingposted speed limits could produce speed effects that were different than loweringspeed limits, the sites were subdivided into raised posted speed limit (41 sites) andlowered posted speed limit (57 sites) groups. In addition to this basic subdivision, thesites were grouped into a number of categories, including amount of posted speed limitchange, area population, geographic area (Western States, Southeastern States, etc.),number of lanes, traffic volume level, section length, and operating speed. Irrespectiveof how the sites were grouped, the results were similar. For presentation purposes inthis report, the sites were grouped by amount of posted speed limit change.
Although the sites were grouped by level of posted speed limit change, consider-able individual site data are presented in this section and more detailed information isincluded in appendix B.
Posted speed limit changes at the 98 experimental sites with before and afterspeed data ranged from lowering the limit by 20 mi/h (32 km/h) at 2 sites, to raising thelimit by 15 mi/h (24 km/h) at 3 other sites. However, as the posted limit was lowered by20 mi/h (32 km/h) at only two sites, these locations were grouped with th e 15-mi/h(24-km/h) lower limit sites for analysis. Similarly, as the speed limit was raised by15 mi/h (24 km/h) at only three sites, these sites were grouped with th e 10-mi/h(1 6-km/h) raised limit sites for analysis.
22

The posted speed limit groups and the number of experimental sites in eachgroup are shown below.
CategoryLower Limit
Posted Number ofSpeed Limit Group Experimental Sites
-15 & -20 mi/h 9-10 mi/h 34
-5 mi/h 14
Raise Limit +5 mi/h 26+10 & +I5 mi/h 15
1 mi/h = 1.61 km/h
Speed Variables
As discussed earlier, 24-h speed data were collected for free-flow vehicles(vehicles with a headway of 4 s or more) simultaneously at the experimental andcomparison sites before and after the new speed limits were posted. In addition to totalvolume and free-flow volume, the following spot speed statistics were summarized foranalysis:
. Mean speed.
l Standard deviation of speeds.
l Percentile speeds, ranging from the 1st to the 99th percentile.
l Percentage of vehicles exceeding the speed limit by 0, 5, 10, 15, and 20 mi/h(0, 8, 16, 24, and 32 km/h).
. Lower and upper limits of the 1 0-mi/h (16-km/h) pace and percentage ofvehicles in the pace.
l Skewness index.
The skewness index, a measure of the departure of the speed distribution fromsymmetry, is defined as:
Sl = 2(P93 - P50)P93 - P7
where: SI = Skewness indexP, = 7th percentile speed
P50 = 50th percentile speedP93 = 93rd percentile speed
23

Results
A summary of the effects of changing posted speed limits on vehicle speeds ispresented in this section. Detailed before and after speed data for each experimentaland comparison site are shown in appendix B. Also included in appendix B are tablesshowing the differences in the before and after speed characteristics at each site.
Previous studies of posted speed limit alterations primarily focused on changesin the mean and 85th percentile speeds. Shown in figure 10 are the before and after85th percentile speeds for the 57 experimental sites where speed limits were lowered.The before and after 85th percentile speeds for the 41 sites where speed limits wereraised are shown in figure 11
If lowering the posted speed limit reduces the 85th percentile speed, then thesymbols shown in figure 10 would fall below the diagonal line. Conversely, if raisingspeed limits increases the 85th percentile speed, then the symbols shown in figure 11should fall above the diagonal line. However, as shown in figures 10 and II, thesymbols appear to be uniformly distributed around the diagonals, irrespective of howmuch the speed limit was lowered or raised.
Lowering or raising the posted speed limits at the experimental sites had littleeffect on driver behavior as reflected by the 85th percentile speeds. Lowering thespeed limit by 5, 10, 15, or 20 mi/h (8, 16, 24, or 32 km/h) at the study sites did notresult in major reductions such as 5 mi/h (8 km/h) or more in the 85th percentilespeeds. Raising the speed limit by 5, 10, o r 15 mi/h (8, 16, or 24 km/h) at the studysites also did not result in major increases such as 5 mi/h (8 km/h) or more in the85th percentile speeds.
Figures 10 and 11 provide a graphical illustration of the before and after85th percentile speeds for each site. The sites were grouped by level of posted speedlimit change, and the before and after differences in 85th percentile speeds are shownin figure 12. The average change in 85th percentile speed for the sites in each speedlimit group, as well as the largest change at any individual experimental site in thegroup, is shown in figure 12. For example, for the group of sites where speed limitswere lowered by 15 or 20 mi/h (24 or 32 km/h), the average change in 85th percentilespeed was a 0.1-mi/h (0.16-km/h) decrease. Among the nine sites in this group, thelargest decrease in 85th percentile speed at an individual site was 1 mi/h (1.6 km/h).The largest increase in 85th percentile speed at an individual site was 2 mi/h (3.2 km/h).
The data in figure 12 illustrate that major reductions, 5 mi/h (8 km/h) or more, inthe 85th percentile speeds did not occur even for large reductions in the posted speedlimit. Also, major increases in the 85th percentile speeds did not occur at sites wherethe speed limits were raised. As shown in figure 13, small changes in the 85th per-centile speeds also occurred at the comparison sites where speed limits were notaltered.
24

65.-______________________________________________ ~
60
:S 55 E 't:i m 50 Q.
C/J Q)
E 45 Q)
~ Q)
a.. 40
~ co ~ 35
~ 30
Lower Posted Speed Limit
• -5 milh • -10 milh
25~----+_----4_----~----~----~----_+----_+----~
25 30 35 40 45 50 55 60 65
1 mi/h = 1.61 kmlh Before 85th Percentile Speed, mi/h
Figure 10. 85th percentile speeds before and after lowering posted speed limits at 57 experimental sites.
65 Raise Posted Speed Limit
60 I!iIII +5 mi/h A +10 & +15 mi/h I :S 55 E 't:i Q)
8. 50 C/J Q)
E 45 Q)
~ Q)
a... 40 .c: -Il) co ... 35
~ 30
25
25 30 35 40 45 50 55 60 Before 85th Percentile Speed, mi/h
1 mi/h = 1.61 km/h
, Figure 11. 85th percentile speeds before and after raising posted speed limits at 41 experimental sites.
25
65

5
4
..c: 3 -'E ,j"
2 Q) Q) a.
CJ)
J!! ~ c:: Q)
0 ~ Q) a.. £; -1 It) co .5 -2 Q) OJ c:: ~ -3 U
-4
I 1=====1",1=====
Maximum Increase --.
Maximum Decrease --.
Average Change
~0 ---I
-5~ __ ~ ______ ~ ______ ~ ________ ~ ________ ~ ____ ~
-15 & -20 -10 -5 +5 +10 & +15 Change in Posted Speed Limit, milh
1 mi/h = 1.61 km/h
Figure 12. Maximum and average changes in the 85th percentile speeds at the experimental sites.
5.-___________________________________________ ~
4
S 3 E -g 2 Q) a.
CJ)
J!! ~ ~ 0 -/--_-, Q) a.. ..c: -1 iO co .5 -2 Q) OJ c:: ~ -3 U
-4
Maximum Increase
Maximum Decrease
Average Change
-5~ ___ ~ ______ ~ ___ ~ _____ ~ ____ ~ __ ~
-15 & -20 -10 -5 +5 +10 & +15 Change in Limit at Test Sites, mi/h
1 mi/h = 1.61 km/h
Figure 13. Maximum and average changes in the 85th percentile speeds at the comparison sites.
26

The 85th percentile speed is only one parameter in the speed distribution.Shown in table 5 are the before and after means, 85th percentile speeds, and thedifferences in speeds for each of the raised and lowered speed limit groups. The datafor each experimental and comparison site are shown in table 6.
Examination of table 5 reveals that there were small differences (less than 1 mi/h(1.6 km/h)) in the group mean and 85th percentile speeds for each posted speed limitgroup. The standard deviation of the differences, however, is large, indicatingconsiderable site-to-site variation.
A review of the speed data in table 6 at each experimental site revealed thatbefore and after differences in the mean, standard deviation, and 85th percentile speedwere generally less than 2 mi/h (3.2 km/h). In addition, there were increases in speedsat some sites and decreases in speeds at other sites, irrespective of whether the speedlimit was raised or lowered or the amount the speed limit was changed. As also shownin table 6, similar differences in speed occurred at the comparison sites where postedspeed limits were not changed. It should be noted that many of the speed differencesof 1 mi/h (1.6 km/h) or more are statistically significant due to the large 24-h speedsamples collected.
Table 5. Before and after group mean and 85th percentile speeds.
Experimental SitesSpeed Group Std. Group Std.Limit Mean Speed Dev. 85th Percentile Speed Dev.
Group Before After Diff. Diff. Before After Diff. Diff.
-15 & -20 42.1 42.2 0.1 0.9 49.1 49.0 -0.1 1.3-10 42.7 42.7 0.1 1.0 50.0 49.9 -0.1 1.0
-5 43.7 43.7 -0.0 0.6 50.7 50.4 -0.3 1.0+5 41.9 42.2 0.2 1.2 48.5 48.4 -0.2 1.4
+10 & +15 36.7 37.5 0.8 1.5 43.3 43.8 0.5 1.5
Comparison SitesSpeed Group Std. Group Std.Limit Mean Speed Dev. 85th Percentile Speed Dev.
Group Before After Diff. Diff. Before After Diff. Diff.
-15 & -20 47.7 47.7 0.1 1.1 55.6 55.4 -0.1 1.1-10 47.8 48.1 0.4 1.0 55.3 55.5 0.2 1.0
-5 46.2 46.4 0.2 1.0 53.1 52.9 -0.2 1.0+5 40.5 40.4 -0.1 1.1 47.0 46.8 -0.2 1.1
+ 10 & +I5 32.9 32.9 -0.0 1.1 39.5 38.8 -0.7 1.1
1 mi/h = 1.61 km/hNote: All speed limits and vehicle speeds are shown i n mi/h.
27

Table 6. Before and after vehicle speeds for the experimental and comparison sites.
Experimental Before After Diff. Before After Diff. Before After Diff. Comparison Before After Diff. Before After Diff. Before After Diff. Site Before After Diff. Mean Mean Mean Std. Dev. Std Dev. Std. Dev. 85th 85th 85th Site Posted Mean Mean Mean Std. Dev. Std. Dev. Std. Dev. 85th 85th 85th
Number limit Limit Limit Speed Speed Speed Speed Speed Speed Speed Speed Speed Number Limit Speed Speed Speed Speed Speed Speed Speed Speed Speed
Speed Limit Lowered by 15 or 20 milh at Experimental Sites Comparison Sites where Posted Speed Limits were not changed
NJ04E 50 30 -20 37.7 37.8 0.1 6.6 5.5 -1.1 44 43 -1 NJ04C 50 47.6 46.6 -1.0 5.5 6.0 0.5 54 53 -1 TX03E 55 35 -20 36.2 37.9 1.7 5.0 4.7 -0.3 41 43 2 TX03C 55 49.6 52.3 2.7 10.4 7.8 -2.6 59 60 1 ..................... _ ....................................................................................................... u ................................ • ..................................................................................................................... _ .................. DE02E 50 35 -15 45.7 44.9 -0.8 6.8 66 -0.2 53 52 -1 DE02C 50 44.5 44.9 0.4 6.9 7.5 0.6 51 53 2 NM01E 55 40 -15 44.5 45.2 0.7 9.5 9.0 -0.5 55 54 -1 NM01C 55 52.2 52.2 0.0 7.7 7.9 0.2 60 60 0 NM03E 55 40 -15 42.0 41.1 -0.9 7.6 7.8 0.2 50 50 0 NM03C 40 44.2 43.6 -0.6 9.8 8.5 -1.3 54 53 -1 NM04E 55 40 -15 40.4 41.4 1.0 7.5 7.8 0.3 48 50 2 NM04C 40 44.2 43.6 -0.6 9.8 8.5 -1.3 54 53 -1 OH02E 55 40 -15 42.6 42.1 -0.5 6.3 6.1 -0.2 49 48 -1 OH02C 55 46.6 45.9 -0.7 7.2 7.0 -0.2 55 54 -1 OH13E 55 40 -15 41.9 41.9 0.0 5.7 5.4 -0.3 48 48 0 OH13C 55 47.5 47.6 0.1 6.2 6.7 0.5 54 54 0 TX05E 55 40 -15 47.9 47.5 -0.4 5.5 5.3 -0.2 54 53 -1 TX05C 55 52.6 53.0 0.4 6.4 6.0 -0.4 59 59 0
Average for 42.1 42.2 0.1 6.7 6.5 -0.3 49.1 49.0 -0.1 Average for 47.7 47.7 0.1 7.8 7.3 -0.4 55.6 55.4 -0.1 9 sites 9 sites
Speed Limit Lowered by 10 milh at Experimental Sites Comparison Sites where Posted Speed Limits were not changed
CA01E 35 25 -10 34.3 33.8 -0.5 6.9 6.7 -0.2 42 41 -1 CA01C 30 34.0 33.5 -0.5 5.6 5.4 -0.2 40 39 -1 DE03E 50 40 -10 45.0 45.1 0.1 6.9 6.8 -0.1 52 52 0 DE03C 50 49.5 49.6 0.1 8.6 8.7 0.1 58 58 0 DE04E 50 40 -10 48.7 48.1 -0.6 7.9 7.9 0.0 57 57 0 DE04C 50 49.3 49.5 0.2 8.7 8.8 0.1 58 58 0 IL01E 50 40 -10 43.6 42.9 -0.7 5.1 4.7 -0.4 49 48 -1 IL01C 45 43.6 43.3 -0.3 5.6 4.9 -0.7 49 48 -1 IN01E 55 45 -10 46.9 46.7 -0.2 5.8 5.6 -0.2 53 53 0 IN01C 55 52.9 53.4 0.5 6.6 6.7 0.1 60 60 0 MA01E 40 30 -10 41.9 40.9 -1.0 5.8 5.4 -0.4 48 47 -1 MA01C 30 37.9 38.0 0.1 6.3 5.7 -0.6 45 44 -1 ME02E 45 35 -10 33.0 33.4 0.4 7.2 7.2 0.0 41 42 1 ME02C 45 46.5 47.7 1.2 7.5 6.9 -0.6 54 55 1 MI09E 55 45 -10 49.7 50.5 0.8 8.8 7.9 -0.9 58 58 0 MI09C 55 56.7 57.0 0.3 7.2 6.8 -0.4 64 64 0 NE01E 55 45 -10 44.2 42.5 -1.7 7.5 6.7 -0.8 52 50 -2 NE01C 55 52.1 52.6 0.5 8.3 7.8 -0.5 59 60 1 NJ02E 45 35 -10 37.7 37.7 0.0 8.0 7.0 -1.0 46 46 0 NJ02C 50 50.6 50.5 -0.1 7.9 7.0 -0.9 59 57 -2 NJ03E 45 35 -10 41.0 41.5 0.5 6.8 6.3 -0.5 48 48 0 NJ03C 50 50.2 50.5 0.3 7.7 7.0 -0.7 58 58 0 OH01E 55 45 -10 53.0 51.7 -1.3 7.0 7.4 0.4 60 59 -1 OH01C 55 51.6 50.9 -0.7 9.4 9.5 0.1 61 60 -1 OH03E 55 45 -10 48.2 48.6 0.4 6.3 6.2 -0.1 55 55 0 OH03C 55 52.9 52.9 0.0 7.7 7.6 -0.1 61 61 0 OH04E 55 45 -10 45.8 45.1 -0.7 7.6 7.3 -0.3 54 53 -1 OH04C 55 46.8 47.5 0.7 5.9 5.9 0.0 53 54 1 OH05E 45 35 -10 38.7 38.8 0.1 7.6 6.6 -1.0 46 46 0 OH05C 55 50.0 50.2 0.2 11.1 10.5 -0.6 59 60 1 OH06E 55 45 -10 44.1 44.6 0.5 9.0 8.1 -0.9 53 53 0 OH06C 55 52.7 53.2 0.5 7.4 7.9 0.5 61 61 0 OH07E 55 45 -10 43.3 44.4 1.1 6.4 5.8 -0.6 50 50 0 OH07C 55 43.8 43.6 -0.2 8.4 7.2 -1.2 52 51 -1 OH08E 55 45 -10 39.1 39.8 0.7 7.5 8.1 0.6 47 49 2 OH08C 55 56.4 56.8 0.4 8.5 9.0 0.5 65 66 1 OH09E 55 45 -10 42.7 42.7 0.0 6.8 6.7 -0.1 49 49 0 OH09C 55 54.4 54.7 0.3 6.4 6.0 -0.4 61 61 0 OH10E 55 45 -10 46.7 44.7 -2.0 6.3 5.8 -0.5 53 51 ·2 OH10C 55 54.4 54.7 0.3 6.4 6.0 -0.4 61 61 0
1 mi/h = 1.61 kmlh Note: All speed limits and vehicle speeds are shown in milh.

Table 6. Before and after vehicle speeds for the experimental and comparison sites (continued).
Experimental Before After Diff. Before After Diff. Before After Diff. Comparison Before After Diff. Before After Diff. Before After Diff.Site Before After Diff. Mean Mean Mean Std. Dev. Std. Dev. Std. Dev. 85th 85th 85th Site Posted Mean Mean Mean Std. Dev. Std. Dev. Std. Dev. 85 th 85 th 85 t h
Number Limit Limit Limit Speed Speed Speed Speed Speed Speed Speed Speed Speed Number Limit Speed Speed Speed Speed Speed Speed Speed Speed Speeed
OH12E 5 5 45 -10 45 .6 44 . 3 -1.3 7.3 7.4 0.1 53 52 -1 -0.6 61 59 -2OK01E 45 35 -10 36.4 36.0 -0.4 6.3 6.5 0.2 43 43 0 1.0 7.0 6.4 -0.6 54 54 0OK02E 35 25 -10 29.5 29.9 0.4 4.8 4.5 -0.3 34 35 1 Comparison site was not available.OK03E 35 25 -10 39.3 40.6 1.3 6.0 5.9 -0.1 46 47 1 Comparison site was not available.OK04E 45 35 -10 42.7 42.3 -0.4 5.7 6.4 0.7 49 49 0 0.1 38 38 0TX02E 55 45 - 1 0 4 8 . 4 47.5 -0.9 6.5 5.9 -0.6 55 54 -1 52.3 2.7 10.4 7.8 -2.6 59 60 ITX04E 55 45 -10 40.4 41.7 1.3 7.2 7.0 -0.2 48 49 1 0.8 8.6 7.3 -1.3 59 59 0VA01E 55 45 -10 47.4 46.5 -0.9 7.2 6.6 -0.6 55 53 -2 -0.2 51 52 1VA03E 55 45 - 1 0 4 4 . 0 44.8 0.8 6.4 6.2 -0.2 51 52 1 45.8 0.6 6.7 8.4 1.7 53 54 1VA04E 55 45 -10 40.2 40.7 0.5 6.9 6.9 0.0 47 48 1 1.7 53 54 1VA05E 55 45 -10 44.8 45.0 0.2 8.5 7.7 -0.8 54 53 -1 46.8 1.6 6.7 8.1 1.4 53 55 2VA07E 55 45 -10 44.4 46.8 2.4 7.0 6.4 -0.6 52 54 2 0.2 57 59 2
55 .3 55 . 5 0.2
CT05E 4 5 40 -5 44.4 45.4 1.0 5.4 5.3 -0.1 50 51 1 0.0 54 55 1DE01E 40 35 -5 45.3 45.1 -0.2 8.4 7.1 -1.3 54 53 -1 1.2 40 42 2ID01E 55 50 -5 49.6 48.6 -1.0 6.9 6.0 -0.9 57 55 -2 0.1 6.6 5.7 -0.9 58 57 -1ID02E 55 50 -5 50.3 50.7 0.4 5.8 5.5 -0.3 56 57 1 0.1 6.6 5.7 -0.9 58 57 -1IL02E 50 45 -5 44.8 44.0 -0.8 5.2 5.2 0.0 50 49 -1 -0.7 49 48 -1IN05E 45 40 -5 41.7 41.1 -0.6 7.1 6.7 -0.4 50 49 -1 0.1 6.6 6.1 -0.5 55 54 -1IN06E 50 45 -5 45.4 45.0 -0.4 7.2 6.6 -0.6 53 52 -1 -0.1 58 58 0IN07E 50 45 -5 44.1 44.7 0.6 7.4 7.3 -0.1 51 52 1 -0.1 58 58 0
0.3 41 41 0 -0.3 45 44 -1
1 mi/h = 1.61 km/hNote. All speed limits and vehicle speeds are shown in mi/h.
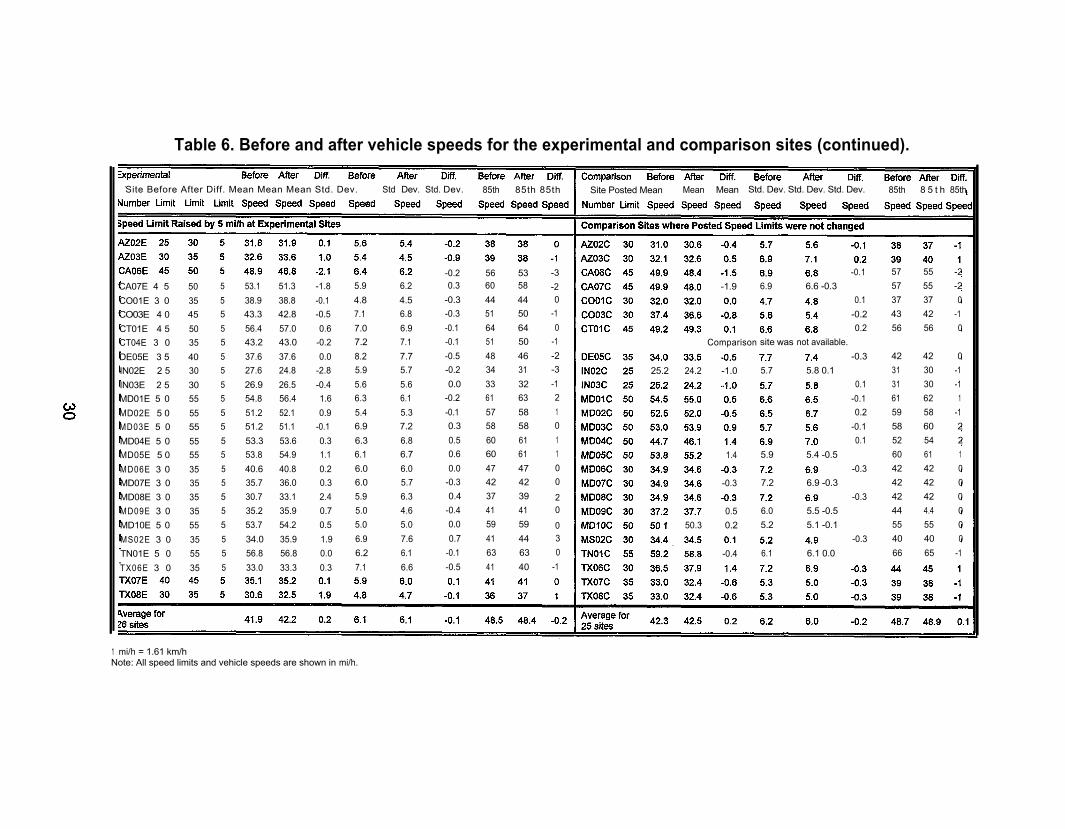
Table 6. Before and after vehicle speeds for the experimental and comparison sites (continued).
Site Before After Diff. Mean Mean Mean Std. Dev. Std Dev. Std. Dev. 85th 85th 85th Site Posted Mean Mean Mean Std. Dev. Std. Dev. Std. Dev. 85th 8 5 t h 85th
-0.2 56 53 -3 -0.1 57 55 -2CA07E 4 5 50 5 53.1 51.3 -1.8 5.9 6.2 0.3 60 58 -2 -1.9 6.9 6.6 -0.3 57 55 -2CO01E 3 0 35 5 38.9 38.8 -0.1 4.8 4.5 -0.3 44 44 0 0.1 37 37 0CO03E 4 0 45 5 43.3 42.8 -0.5 7.1 6.8 -0.3 51 50 -1 -0.2 43 42 -1CT01E 4 5 50 5 56.4 57.0 0.6 7.0 6.9 -0.1 64 64 0 0.2 56 56 0CT04E 3 0 35 5 43.2 43.0 -0.2 7.2 7.1 -0.1 51 50 -1 Comparison site was not available.DE05E 3 5 40 5 37.6 37.6 0.0 8.2 7.7 -0.5 48 46 -2 -0.3 42 42 0IN02E 2 5 30 5 27.6 24.8 -2.8 5.9 5.7 -0.2 34 31 -3 25.2 24.2 -1.0 5.7 5.8 0.1 31 30 -1IN03E 2 5 30 5 26.9 26.5 -0.4 5.6 5.6 0.0 33 32 -1 0.1 31 30 -1MD01E 5 0 55 5 54.8 56.4 1.6 6.3 6.1 -0.2 61 63 2 -0.1 61 62 1MD02E 5 0 55 5 51.2 52.1 0.9 5.4 5.3 -0.1 57 58 1 0.2 59 58 -1MD03E 5 0 55 5 51.2 51.1 -0.1 6.9 7.2 0.3 58 58 0 -0.1 58 60 2MD04E 5 0 55 5 53.3 53.6 0.3 6.3 6.8 0.5 60 61 1 0.1 52 54 2MD05E 5 0 55 5 53.8 54.9 1.1 6.1 6.7 0.6 60 61 1 1.4 5.9 5.4 -0.5 60 61 1MD06E 3 0 35 5 40.6 40.8 0.2 6.0 6.0 0.0 47 47 0 -0.3 42 42 0MD07E 3 0 35 5 35.7 36.0 0.3 6.0 5.7 -0.3 42 42 0 -0.3 7.2 6.9 -0.3 42 42 0MD08E 3 0 35 5 30.7 33.1 2.4 5.9 6.3 0.4 37 39 2 -0.3 42 42 0MD09E 3 0 35 5 35.2 35.9 0.7 5.0 4.6 -0.4 41 41 0 0.5 6.0 5.5 -0.5 44 4.4 0MD10E 5 0 55 5 53.7 54.2 0.5 5.0 5.0 0.0 59 59 0 50.3 0.2 5.2 5.1 -0.1 55 55 0MS02E 3 0 35 5 34.0 35.9 1.9 6.9 7.6 0.7 41 44 3 -0.3 40 40 0TN01E 5 0 55 5 56.8 56.8 0.0 6.2 6.1 -0.1 63 63 0 -0.4 6.1 6.1 0.0 66 65 -1TX06E 3 0 35 5 33.0 33.3 0.3 7.1 6.6 -0.5 41 40 -1
1 mi/h = 1.61 km/hNote: All speed limits and vehicle speeds are shown in mi/h.
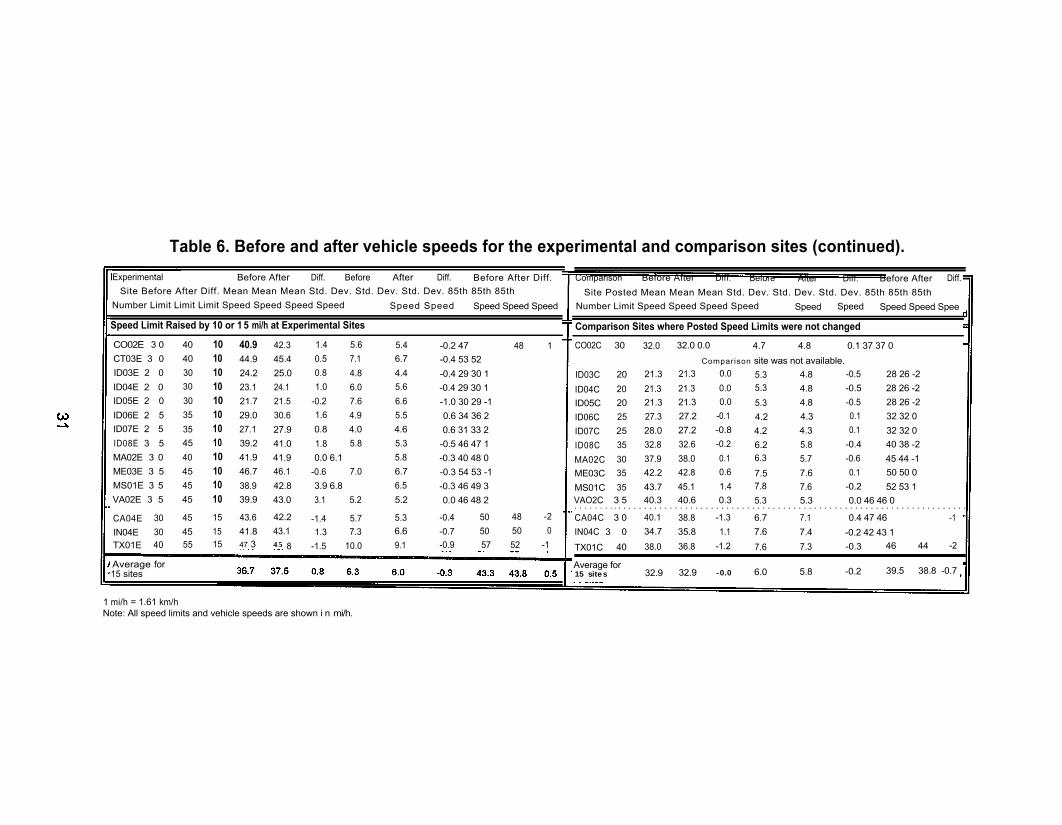
Table 6. Before and after vehicle speeds for the experimental and comparison sites (continued).Experimental Before After Diff. Before After Diff. Before After Diff.
Site Before After Diff. Mean Mean Mean Std. Dev. Std. Dev. Std. Dev. 85th 85th 85thNumber Limit Limit Limit Speed Speed Speed Speed Speed Speed Speed Speed Speed
Speed Limit Raised by 10 or 1 5 mi/h at Experimental Sites
CO02E 3 0CT03E 3 0ID03E 2 0ID04E 2 0ID05E 2 0ID06E 2 5ID07E 2 5ID08E 3 5MA02E 3 0ME03E 3 5MS01E 3 5
404030303035354540454545
101010101010101010101010
40.9 42.3 1.4 5.6 5.4 -0.2 47 48 144.9 45.4 0.5 7.1 6.7 -0.4 53 52 -124.2 25.0 0.8 4.8 4.4 -0.4 29 30 123.1 24.1 1.0 6.0 5.6 -0.4 29 30 121.7 21.5 -0.2 7.6 6.6 -1.0 30 29 -129.0 30.6 1.6 4.9 5.5 0.6 34 36 227.1 27.9 0.8 4.0 4.6 0.6 31 33 239.2 41.0 1.8 5.8 5.3 -0.5 46 47 141.9 41.9 0.0 6.1 5.8 -0.3 40 48 046.7 46.1 -0.6 7.0 6.7 -0.3 54 53 -138.9 42.8 3.9 6.8 6.5 -0.3 46 49 3
VA02E 3 5 39.9 43.0 3.1 5.2 5.2 0.0 46 48 2 CA04E 30 45 15 43.6 42.2 -1.4 5.7 5.3 -0.4 50 48 -2
IN04E 30 45 15 41.8 43.1 1.3 7.3 6.6 -0.7 50 50 0TX01E 40 55 15 47 3 45 8 -1.5 10.0 9.1 -0.9 57 52 -1
Average for15 sites
Comparison Before After Diff. Before After Diff. Before After Diff.Site Posted Mean Mean Mean Std. Dev. Std. Dev. Std. Dev. 85th 85th 85th
Number Limit Speed Speed Speed Speed Speed Speed Speed Speed Spee
Comparison Sites where Posted Speed Limits were not changed
CO02C 30 32.0 32.0 0.0 4.7 4.8 0.1 37 37 0Comparison site was not available.
ID03C 20 21.3 21.3 0.0 5.3 4.8 -0.5ID04C 20 21.3 21.3 0.0 5.3 4.8 -0.5ID05C 20 21.3 21.3 0.0 5.3 4.8 -0.5ID06C 25 27.3 27.2 -0.1 4.2 4.3 0.1ID07C 25 28.0 27.2 -0.8 4.2 4.3 0.1ID08C 35 32.8 32.6 -0.2 6.2 5.8 -0.4MA02C 30 37.9 38.0 0.1 6.3 5.7 -0.6ME03C 35 42.2 42.8 0.6 7.5 7.6 0.1MS01C 35 43.7 45.1 1.4 7.8 7.6 -0.2
28 26 -228 26 -228 26 -232 32 032 32 040 38 -245 44 -150 50 052 53 1
VAO2C 3 5 40.3 40.6 0.3 5.3 5.3 0.0 46 46 0. . . . . . . . . . . . . . . . . . . . . . . . . . . . . . . . . . . . . . . . . . . . . . . . . . . . . . . . . . . . . . . . . . . . . . . . . . . . .CA04C 3 0 40.1 38.8 -1.3 6.7 7.1 0.4 47 46 -1IN04C 3 0 34.7 35.8 1.1 7.6 7.4 -0.2 42 43 1TX01C 40 38.0 36.8 -1.2 7.6 7.3 -0.3 46 44 -2
Average for15 sites 32.9 32.9 -0.0 6.0 5.8 -0.2 39.5 38.8 -0.7
1 mi/h = 1.61 km/hNote: All speed limits and vehicle speeds are shown i n mi/h.

Unlike many previous studies which only reported changes in the mean and85th percentile speeds, the 24-h data collected during this effort permitted examinationof the entire speed distribution. Shown in figure 14 is the before and after cumulativefrequency distributions of free-flow vehicle speeds for a site in Ohio (OH01 E) where thespeed limit was lowered from 55 to 45 mi/h (89 to 72 km/h) in a rural community. Thetwo-lane site is 0.52 mi (0.84 km) long and the before 24-h volume was 3,900 vehicles.As indicated in the figure, before and after speed differences along the entire distri-bution are 2 mi/h (3 km/h) or less, which is typical of the findings at most of theexperimental and comparison sites.
Another example of the before and after speed distributions is given in figure 15for a main two-lane street in an Idaho cit y (ID03E) where the population was less than5,000 persons. The speed limit on the 1.79-mi (2.88-km) section was raised from 20 to30 mi/h (32 to 48 km/h). The before 24-h volume was 1,400 vehicles. As shown infigure 15, the before and after speed differences are 2 mi/h (3 km/h) or less.
The changes in the speed distributions illustrated in figures 14 and 15 are but2 examples from the 98 experimental sites. As shown in more detail in appendix B,there were site-to-site variations in the before and after percentile speeds for both theexperimental and comparison locations.
To provide a summary of the before and after speed differences, the sites weregrouped by amount of posted speed limit change. Mean changes in the speed distri-bution were calculated for each posted speed limit group. The mean changes for thespeed limit groups are summarized in appendix B. Because 24-h free-flow speed datawere collected before and after speed limits were changed, the samples are large. Forexample, the speed limit group with the smallest sample is nine sites where speed limitswere lowered by 15 or 2 0 mi/h (24 or 32 km/h). For this group, the before period50th percentile contains the speeds of more than 8,900 free-flow vehicles. The 1st and99th percentiles each contain approximately 180 vehicle speeds. The speed limit groupwith the largest number of sites (lowered by 1 0 mi/h (16 km/h)) contains more than61,000 free-flow vehicle speeds in the 50th percentile, and more than 1,200 vehiclespeeds each in the 1st and 99th percentiles.
Mean differences in the before and after percentile speeds for the group of siteswhere speed limits were lowered and raised, by amount of posted speed limit change,are shown in figures 16 and 17, respectively. Mean changes in the before and afterpercentile speeds for the comparison site groups, where speed limits were notchanged, are shown in figures 18 and 19, respectively. Finally, the net effects of thechanges, obtained by subtracting the differences at the comparison sites from thedifferences at the experimental sites, are shown in figures 20 and 21.

99
95
90
85
C 75
~ 65 a.. ~ 50
:0:;
..!!! 35 ::J E ::J 25 U
15
10
5
Posted Speed Limit Lowered at OH01 E
1___ 55 mi/h - Before ..s;;}- 45 mi/h - After
o 5 10 15 20 25 30 35 40 45 50 55 60 65 70 75
1 mi/h = 1.61 km/h Speed, mi/h
Figure 14. Before and after cumulative speed distributions at an experimental site where the posted speed limit was lowered.
99
95
90
85
C 75
~ 65 a.. ~ 50
~ 35 ::J E ::J 25 U
15
10
5
Posted Speed Limit Raised at ID03E
1 ___ 20 mi/h - Before -t::r- 30 mi/h - After
o 5 10 15 20 25 30 35 40
1 mi/h = 1.61 kmlh Speed, mi/h
Figure 15. Before and after cumulative speed distributions
45
at an experimental site where the posted speed limit was raised.
33

5~ ______________________________________________ ~
Lower Posted Speed Limit 4
1 ___ -5 mi/h ....... -10 mi/h ...... -15 & -20 mi/h I
-4
-5~~ __ ~~~~ __ ~ __ ~ __ ~ __ ~ __ ~ __ ~~~~ __ ~~ 5 10 15 25 35 50 65 75 85 90 95 99
1 mi/h = 1.61 km/h Percentile Speed
Figure 16. Before and after changes in percentile speeds at the experimental sites where speed limits were lowered.
5~ ______________________________________________ ~
Raise Posted Speed Limit 4
1 ___ +5 mi/h """I!r- +10 & +15 mi/h I 3
-4
-5~~ __ ~~~~ __ ~ __ ~ __ ~ __ ~ __ ~~~~ __ ~ __ ~~ 5 10 15 25 35 50 65 75 85 90 95 99
1 mi/h = 1.61 km/h Percentile Speed
Figure 17. Before and after changes in percentile speeds at the experimental sites where speed limits were raised.
34
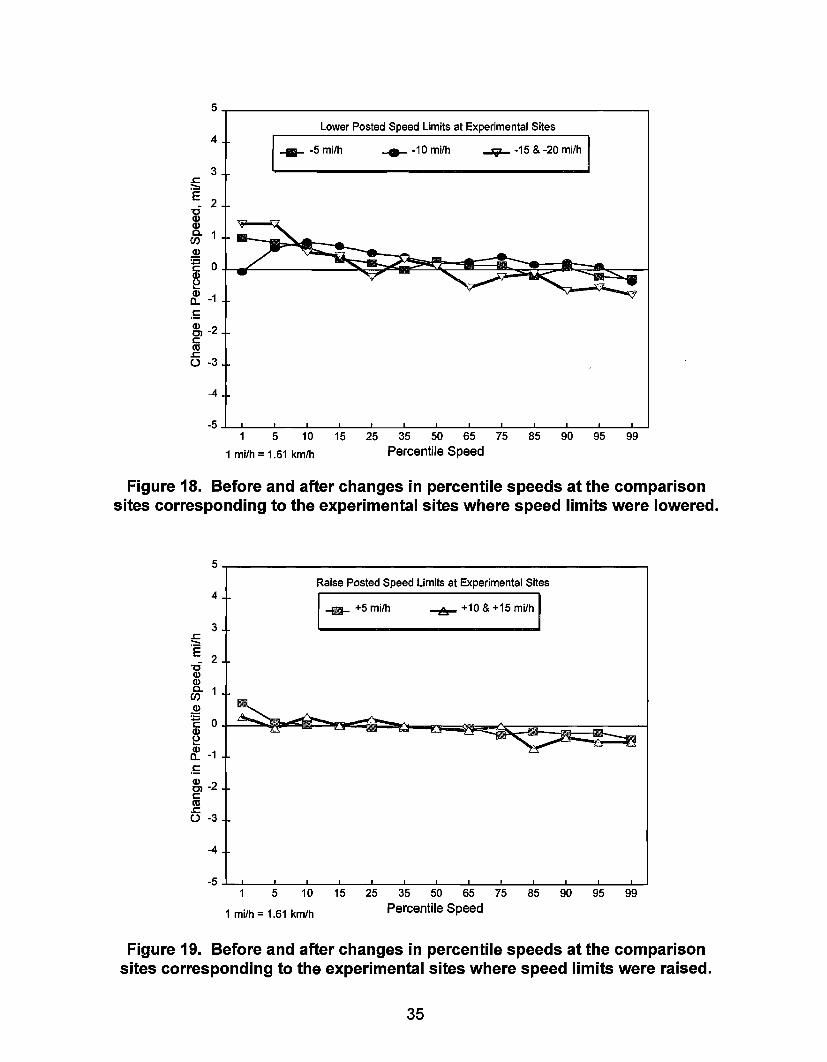
5~ ______________________________________________ -,
Lower Posted Speed Limits at Experimental Sites 4
1 ___ -5 mi/h ___ -10 mi/h ..1iI- -15 & -20 mi/h I
3
-4
5 10 15 25 35 50 65 75 85 90 95 99
1 mi/h = 1.61 km/h Percentile Speed
Figure 18. Before and after changes in percentile speeds at the comparison sites corresponding to the experimental sites where speed limits were lowered.
5,-______________________________________________ -,
Raise Posted Speed Limits at Experimental Sites
1 ___ +5 mi/h ""'I!l- +10 & +15 mi/h I 4
3
-4
5 10 15 25 35 50 65 75 85 90 95 99
1 mi/h = 1.61 km/h Percentile Speed
Figure 19. Before and after changes in percentile speeds at the comparison sites corresponding to the experimental sites where speed limits were raised.
35

5T-----------------------------------------------~ Lower Posted Speed Limit
4
3
1 ___ -5 mi/h ___ -10 mi/h ...... -15 & -20 mi/h I
-4
5 10 15 25 35 50 65 75 85 90 95 99
1 mi/h = 1.61 km/h Percentile Speed
Figure 20. Net change (experimental minus comparison) in percentile speeds at sites where speed limits were lowered.
5T-----------------------------------------------~
4
3
.5 ~ -2 c: to .c: U -3
-4
Raise Posted Speed Limit
1 ___ +5 mi/h -,!r- +10 & +15 mi/h I
5 10 15 25 35 50 65 75 85 90 95 99
1 mi/h = 1.61 km/h Percentile Speed
Figure 21. Net change (experimental minus comparison) in percentile speeds at sites where speed limits were raised.
36
At sites where speed limits were lowered, percentile speeds below the 50th per-centile speed tended to increase, and percentile speeds above the 50th percentilespeed tended to decrease. However, as shown in figure 18, a similar trend occurred atthe comparison sites where the posted speed limits were not changed. The net effects,shown in figure 20, indicate that when speeds were reduced by 10 mi/h (16 km/h), theslowest drivers (1st percentile) increased their speed approximately 1 mi/h (1.6 km/h).There were no changes in the highest speed drivers (99th percentile); however, whenspeed limits were lowered by 15 or 20 mi/h (24 or 32 km/h), there was approximately a1-mi/h (1.6-km/h) increase in the 95th percentile speed.
At sites where posted speed limits were raised, generally there was a smallincrease in speeds below the 75th percentile (less than 1 .5 mi/h (2.4 km/h)). The neteffects, shown in figure 21, indicate that there was a small decrease in the 99th per-centile speed when speed limits were raised by IO or 1 5 mi/h (16 or 24 km/h).
As described in the Methodology section of the report, the comparison sites werenot selected from the same source as the experimental sites. Consequently, the neteffects mentioned above may be biased. Even if one excludes the comparison sitedata altogether, the findings for the experimental groups remain unchanged.
Other measures of the distribution of vehicle speeds include the standarddeviation of speeds, the percentage of vehicles in the 10-mi/h (16-km/h) pace, and theskewness index. These data are given in appendix B for each experimental andcomparison site.
For the experimental site groups examined in this study, there was a generalreduction in the standard deviation of speeds, ranging from 0.1 to 0. 3 mi/h (0.16 to0.5 km/h), irrespective of whether speed limits were raised or lowered. In addition, thepercentage of vehicles in the 10-mi/h (16-km/h) pace increased by approximately2 percent for all posted speed limit groups. There was very little change in theskewness index.
In order to compare speed variations between groups of sites with differentspeed zones, the coefficient of variation (the standard deviation of speeds divided bythe mean speed) was calculated for each speed limit group. Generally, the coefficientof variation decreased by 1 percent for all speed groups, which implies that the distri-bution of speeds decreased slightly after the speed limits were altered.
It should be noted that statistical tests (i.e., t-test for means, f-test for variance,or Kolomogorov-Smirnow for shifts in distribution), applied to any of the datasets,produce statistically significant results. The reason significant results are achieved isbased on the fact that data at each site were collected for a 24-h period, which typicallyproduces a large sample. When the data are combined for groups of speed limitchanges, the samples are very large. With the large samples used in this dataset, thestatistical tests always indicate that the results are highly significant. Consequently,changes such as 1 mi/h (1.6 km/h), as mentioned above, are statistically significant, butnot practically meaningful.
37

Resurfaced Sections
Throughout the site selection process, the researchers coordinated efforts withthe participating transportation agencies to ensure that a change in posted speed limitwas the only change contemplated at the experimental sites. However, because thestudy was conducted over several years, the agencies could not guarantee that otherchanges would not be made.
As the data collectors were preparing to collect after data, they reported that abituminous concrete riding surface had been applied to four of the experimentalsections after the posted speed limits were raised. None of the experimental siteswhere speed limits were lowered or comparison sites in the study were resurfaced.Because improvements in riding quality may increase vehicle speeds, the first thoughtwas to eliminate the sections from the study. After reconsideration, it was decided tocollect the after data and examine the differences in speed. It should be noted,however, that the experimental sections discussed below received both a posted speedlimit change and a new pavement surface; consequently, it is not possible to determineif the speed differences are due to the new speed limit, the resurfaced pavement, orboth.
The sections resurfaced include MD04E, a 5.83-mi (9.39-km) rural two-laneroadway in Maryland where the speed limit was raised from 50 to 5 5 mi/h (81 to89 km/h). Two sites i n Brandon, Mississippi, a small urban area (population between5,000 and 50,000 persons), were also resurfaced. MS01 E is a 0.43-mi (0.69-km)two-lane section that transitions from a rural to an urban area. The speed limit on thesection was raised from 35 to 45 mi/h (56 to 72 km/h) . MS02E is a 0.68-mi (1.09-km)two-lane urban section where the limit was raised from 30 to 3 5 mi/h (48 to 56 km/h).In Tennessee, TN01 E is a 6.16-mi (9.92-km) rural four-lane divided highway where thespeed limit was raised from 50 to 5 5 mi/h (81 to 89 km/h).
The before and after differences in speed characteristics for the four resurfacedsections are shown in table 7. The speed data for their corresponding comparison sitesare shown in table 8.
Examination of the speed data shown in table 7 indicates that at the two rurallong sections (MD04E and TN01E), the speed changes were minor, i.e., generally lessthan 1 mi/h (1.6 km/h).
At the two small urban area site s (MS01E and MS02E), the 85th percentilespeeds increased by 3 mi/h (4.8 km/h). There was a corresponding increase in themean speed at these locations, as well as a general increase in speeds through thespeed distribution. These changes are statistically significant. The changes in speedat the corresponding comparison sites do not reflect a general increase in speeds in thearea. The increase in speeds at these locations are among the largest recorded in thestudy; however, there were several other locations (i.e., IN02E, VA02E, and VA07E)that had similar changes in before and after speeds, but were not resurfaced.
38

Table 7. Differences in speed characteristics for the resurfaced experimental sites.
Experimental Std. Free- Pct.Site Diff. Mean Dev.
10-mi/hTotal Flow Free Percentile Speeds Lower Upper
Number Limit Speed Speeds Volume Volume Flow 1 5 10 1 5 25 35 50 65 75 85 90 95 99 Limit Limit
MD04E 5 0.3 0.5 1,060 710 -5.5MS01E 10
4 - 1 0 0 0 0 0 1 0 1 0 1 03.9 0
-0.3 727 484 -0.9MSO2E
- 2 4 4 5 5 5 4 5 3 3 3 2 15 51.9 0.7 119 233 1.8
TN01E2 - 1 0 0 2 2 3 3 2 3 2 2 2
5 30.0-0.1 1,185 880 -1.5 1 0 0 1 1 0 0 0 0 0 0 0 0 1
1 mi/h = 1.61 km/hNote: All speed limits and vehicle speeds are shown in mi/h.
Table 8. Differences in speed characteristics for the corresponding comparison sites.
Comparison Std. Free- Pct.Site Diff. Mean Dev.
10-mi/hTotal Flow Free
Number Limit SpeedPercentile Speeds Lower
Speeds Volume VolumeUpper
Flow 1 5 10 15 25 35 50 65 75 85 90 95 99 Limit Limit
MD04C 50 1.4 0.1 182 155 -1.3MS01C 35
-1 0 1 1 1 3 2 1 1 2 1 0 21.4 2
-0.2 496 412 -1.1MS02C 30 4 2 2 1 1 1 1 1 2 1 2 1 30.1 1
-0.3 247 259 0.9 10 0 0 0 0 0 0 0 0 0 0 -1 1 TN01C 55 -0.4 0.0 498 422 -2.1 1 0 0 -1 -1 0 -1 0 0 -1 0 0 -1 -1 -1
1 mi/h = 1.61 km/hNote: All speed limits and vehicle speeds are shown i n mi/h.

As before and after pavement roughness information was not available for any ofthe sites, it is not known if the riding quality significantly changed after the sections wereresurfaced.
As the sample of sites is small, no conclusions concerning the effects of resur-facing and raising posted speed limits can be drawn from this data set.
85th Percentile Speed and Posted Speed Limits
The 85th percentile speed is used as one factor in determining the numericalvalue of the speed limit to post by all State and most local transportation agencies.[3] Aspreviously shown in figure 6, after the posted limits were changed on the experimentalsections, the limits posted typically ranged from 5 to 1 6 mi/h (8 to 26 km/h) below the85th percentile speed. Some sites, however, had speed limits set within 5 mi/h (8 km/h)of the 85th percentile speed.
The data collected for this study provide an opportunity to examine changes invehicle speeds when speed limits are posted within 5 mi/h (8 km/h) of the 85th per-centile speed versus changes in speeds when limits are set at more than 5 mi/h(8 km/h) below the 85th percentile speed.
Examination of the data revealed that 34.experimental sites had speed limits setwithin 5 mi/h (8 km/h) of the 85th percentile speed before the new speed limits wereposted. Posted speed limits on the 34 sections were lowered more than 5 mi/h(8 km/h) below the 85th percentile speed, i.e., the after speed limits were posted from6 to 17 mi/h (10 to 27 km/h) below the 85 percentile speed on these sections.
At 21 other experimental sites, the before posted speed limit was more than5 mi/h (8 km/h) below the 85th percentile speed. At these locations, the before speedlimit ranged from 6 to 2 0 mi/h (10 to 32 km/h) below the 85th percentile speed. Thespeed limits on these sections were raised to within 5 mi/h (8 km/h) of the 85th per-centile speed.
The before and after differences in speed characteristics for the 34 sites wherethe speed limits were lowered more than 5 mi/h (8 km/h) below the 85th percentilespeed are shown in table 9. The data for the 21 sites where speed limits were raised towithin 5 mi/h (8 km/h) of the 85th percentile speed are given in table 10.
Similar to the results of other analyses, the differences in the before and afterspeeds at the sites were typically less than 2 mi/h (3 km/h), regardless of whether the .posted limit was lowered more than 5 mi/h (8 km/h) below the 85th percentile speed orraised to within 5 mi/h (8 km/h) of the 85th percentile speed.
40

Table 9. Differences in speed characteristics at sites where speed limits werelowered more than 5 mi/h (8 km/h) below the 85th percentile speed.
Experimental Std. 10-mi/h Pace
Site Diff. Mean Dev. Percentile Speeds L o w e r UpperN u m b e r Limit s p e e d Speeds 1 5 10 15 25 35 50 65 75 85 90 95 99 Limit Limit
DEO2E -15 -0.8 - 0 . 2 2 -1 -1 0 0 0 -1 -1 - 2 -1 -1 0 - 2 -2 - 2
NM01E -15 0 . 7 - 0 . 5 0 2 2 3 2 1 0 -1 -1 -1 0 2 3 - 3 - 3
NM03E -15 - 0 . 9 0.2 -1 -2 -2 -2 -1 0 -1 - 2 -1 0 0 -1 - 2 -1 -1
TX05E - 1 5 - 0 . 4 -0.2 1 1 0 0 0 -1 0 0 -1 -1 -1 0 -1 -1 -1.....................................................................................................................................................................................................DE03E -10 0.1 -0.1 0 0 0 1 0 1 0 0 0 0 0 0 0 0 0
IL01E -10 -0.7 0.4 -1 0 0 0 0 0 -1 -1 -1 -1 -1 -1 - 2 -1 -1
IN01 E -10 -0.2 -0.2 0 1 0 0 0 0 -1 -1 0 0 0 0 0 0 0
ME02E - 1 0 0 .4 0 . 0 1 1 1 0 0 0 0 1 1 1 2 1 0 - 2 - 2
MI09E -10 0 .8 - 0 . 9 2 3 3 3 2 1 0 0 -1 0 0 0 -1 -1 -1
NJ02E -10 0 . 0 -1 .0 2 2 1 1 1 1 0 0 -1 0 -1 -1 - 2 0 0
N J 0 3 E -10 0 . 5 -0.5 -6 4 3 2 1 0 0 0 0 0 -1 -1 -1 0 0
OH01E - 1 0 - 1 . 3 04 -2 -2 -2 - 2 -2 -1 -2 -1 -1 -1 -1 0 0 -2 - 2
OH03E - 1 0 0 . 4 -0.1 1 1 0 0 0 0 0 0 0 0 0 -1 2 0 0
OH04E -10 -0.7 - 0 . 3 1 0 0 0 -1 -1 -1 -1 -1 -1 0 0 0 - 2 - 2
OH05E - 1 0 0.1 - 1 . 0 6 3 0 1 1 0 -1 -1 -1 0 0 0 0 -1 -1
OH06E -10 0 5 - 0 . 9 5 2 2 1 I 0 0 -1 -1 0 1 0 -1 - 2 - 2
OH10E -10 -20 -0.5 0 -1 - 2 -1 -1 - 2 - 2 - 3 - 2 - 2 - 2 - 3 - 3 -2 - 2
O H 1 1 E - 1 0 1 .9 -2.1 2 3 4 5 9 3 1 0 -1 0 0 -1 -1 -1 -1
OH12E -10 - 1 . 3 0.1 2 -1 -1 -1 -2 - 2 -2 -1 - 2 -1 - 2 0 1 - 2 - 2
OK01E -10 -0.4 0.2 -1 -2 0 0 0 0 0 -1 -1 0 0 0 1 - 2 - 2
OK02E -10 0 . 4 - 0 3 2 1 0 0 1 0 0 0 0 1 0 0 0 0 0
OKO4E -10 - 0 . 4 0.7 -3 -2 -1 -1 -1 0 0 0 0 0 0 0 1 0 0
TX02E -10 -0.9 - 0 . 6 2 0 0 -1 -1 -1 -1 -1 -1 -1 - 2 -1 -1 - 2 - 2
VA01 E -10 -0.9 - 0 . 6 1 1 0 0 -1 -1 -1 -1 -2 -2 -1 -1 -1 - 2 - 2
VA03E -10 0 .8 - 0 . 2 1 1 1 1 1 1 0 0 0 1 0 0 -1 1 1
VA05E -10 0 .2 - 0 . 8 1 4 1 0 1 1 0 0 0 -1 -1 -1 0 3 3
VAO7E - 1 0 2 . 4 - 0 . 6 4 3 4 3 3 2 3 2 1 2 2 2 1 2 2. . . . . . . . . . . . . . . . . . . . . . . . . . . . . . . . . . . . . . . . . . . . . . . . . . . . . . . . . . . . . . . . . . . . . . . . . . . . . . . . . . . . . . . . . . . . . . . . . . . . . . . . . . . . . . . . . . . . . . . . . . . . . . . . . . . . . . . . . . . . . . . . . . . . . . . . . . . . . . . . . . . . . . . . . . . . . . . . . .CT02E -5 0 . 0 -0.1 0 0 1 0 0 0 0 0 0 0 0 0 0 0 0
CT05E - 5 1.0 -0.1 1 1 2 1 1 1 1 1 1 1 1 1 1 0 0
lD02E - 5 0 . 4 - 0 . 3 1 1 1 1 0 1 1 0 1 1 -1 -1 -1 2 2
IN05E -5 - 0 . 6 - 0 . 4 1 0 0 0 0 0 -1 -1 -1 -1 -1 -1 -1 1 1
IN08E - 5 - 0 . 4 - 0 . 6 0 1 1 1 -1 0 -1 -1 0 -1 -1 -1 -1 -1 -1
IN07E - 5 0 . 6 - 0 1 1 1 1 I 1 1 0 0 1 1 1 0 2 0 0
NJ01E - 5 0 . 4 0 . 0 0 0 1 0 0 0 0 0 1 0 1 0 0 0 0
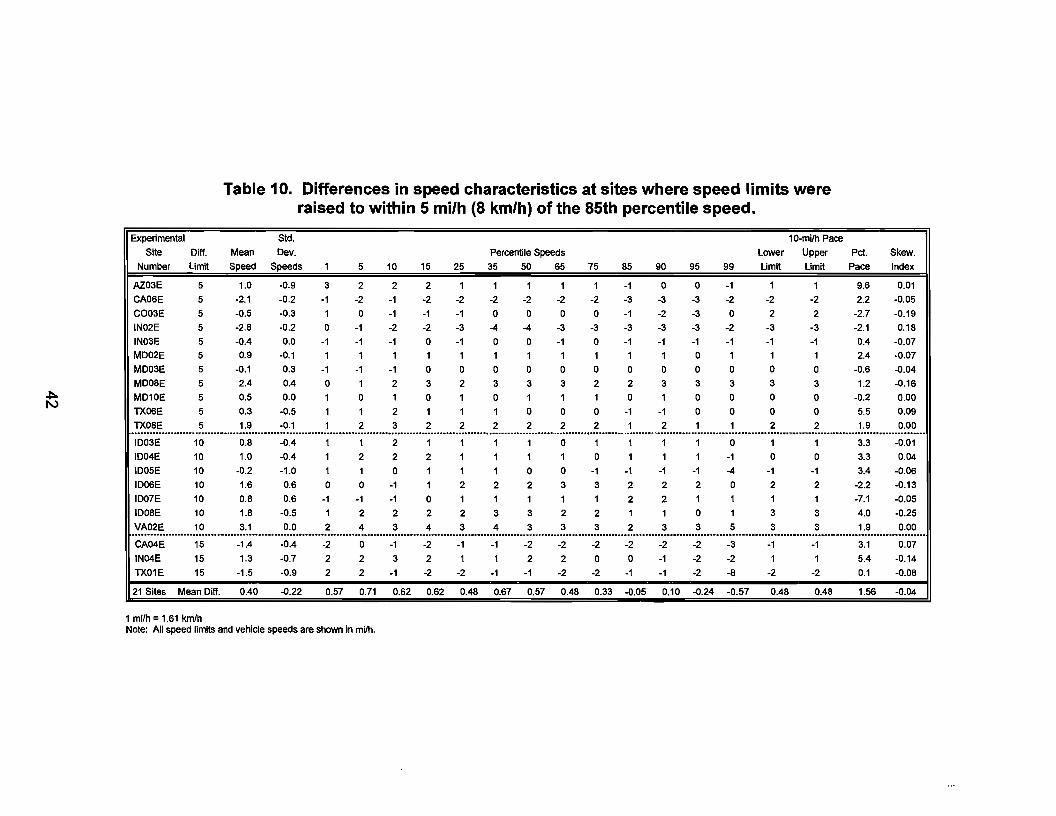
Experimental
Site Diff.
Number Limit
AZ03E 5
CAOSE 5
C003E 5
IN02E 5
IN03E 5
MD02E 5
MD03E 5
MD08E 5
MD10E 5
TXOSE 5
TX08E 5
Table 10. Differences in speed characteristics at sites where speed limits were raised to within 5 mi/h (8 km/h) of the 85th percentile speed.
Std. 10-milh Pace
Mean Dev. Percentile Speeds Lower Upper
Speed Speeds 1 5 10 15 25 35 50 65 75 85 90 95 99 Limit Limit
1.0 -0.9 3 2 2 2 1 1 1 1 1 -1 0 0 -1 1 1
-2.1 -0.2 -1 -2 -1 -2 -2 -2 -2 -2 -2 -3 -3 -3 -2 -2 -2
-0.5 -0.3 1 0 -1 -1 -1 0 0 0 0 -1 -2 -3 0 2 2
-2.8 -0.2 0 -1 -2 -2 -3 -4 -4 -3 -3 -3 -3 -3 -2 -3 -3
-0.4 0.0 -1 -1 -1 0 -1 0 0 -1 0 -1 -1 -1 -1 -1 -1 0.9 -0.1 1 1 1 1 1 1 1 1 1 1 1 0 1 1 1
-0.1 0.3 -1 -1 -1 0 0 0 0 0 0 0 0 0 0 0 0
2.4 0.4 0 1 2 3 2 3 3 3 2 2 3 3 3 3 3
0.5 0.0 1 0 1 0 1 0 1 1 1 0 1 0 0 0 0
0.3 -0.5 1 1 2 1 1 1 0 0 0 -1 -1 0 0 0 0
1.9 -0.1 1 2 3 2 2 2 2 2 2 1 2 1 1 2 2
Pet. Skew.
Pace Index
9.6 0.01
2.2 -0.05
-2.7 -0.19
-2.1 0.18
0.4 -0.07
2.4 -0.07
-O.S -0.04
1.2 -0.1S
-0.2 0.00
5.5 0.09
1.9 0.00 ....................................................................................................................................................................................... " .................................................................................................. ID03E 10 0.8 -0.4 1 1 2 1 1 1 1 0 1 1 1 1 0 1 1 3.3 -0.01
ID04E 10 1.0 -0.4 1 2 2 2 1 1 1 1 0 1 1 1 -1 0 0 3.3 0.04
ID05E 10 -0.2 -1.0 1 1 0 1 1 1 0 0 -1 -1 -1 -1 -4 -1 -1 3.4 -O.OS
IDOSE 10 1.S 0.6 0 0 -1 1 2 2 2 3 3 2 2 2 0 2 2 -2.2 -0.13
ID07E 10 0.8 0.6 -1 -1 -1 0 1 1 1 1 1 2 2 1 1 1 1 -7.1 -0.05
ID08E 10 1.8 -0.5 1 2 2 2 2 3 3 2 2 1 1 0 1 3 3 4.0 -0.25
VA02E 10 3.1 0.0 2 4 3 4 3 4 3 3 3 2 3 3 5 3 3 1.9 0.00 .............................. -...................................................................................................................................................................................................................................................... CA04E 15 -1.4 -0.4 -2 0 -1 -2 -1 -1 -2 -2 -2 -2 -2 -2 -3 -1 -1 3.1 0.07
IN04E 15 1.3 -0.7 2 2 3 2 1 1 2 2 0 0 -1 -2 -2 1 1 5.4 -0.14
TX01E 15 -1.5 -0.9 2 2 -1 -2 -2 -1 -1 -2 -2 -1 -1 -2 -8 -2 -2 0.1 -0.08
21 Sites Mean Diff. 0.40 -0.22 0.57 0.71 0.S2 0.62 0.48 0.S7 0.57 0.48 0.33 -0.05 0.10 -0.24 -0.57 0.48 0.48 1.5S -0.04
1 mVh = 1.61 kmlh Note: All speed limits and vehicle speeds are shown in mi/h.

The mean differences in the before and after percentile speeds were calculatedfor both groups of sites and the results are presented graphically in figures 22 and 23.As shown in figure 22, for the group of 34 sites where speed limits were lowered morethan 5 mi/h (8 km/h) below the 85th percentile speed, there was a small increase-lessthan 1 mi/h (1.6 km/h)-in speed below the 50th percentile. For this group of sites,there was a small decrease-less than 1 mi/h (1.6 km/h)-in speeds above the50th percentile.
As shown in figure 23, there was a small increase-less than 1 mi/h(1.6 km/h)-in speeds below the 85th percentile speed for the group of 21 sites wherespeed limits were raised to within 5 mi/h (8 km/h) of the 85th percentile speed. For thisgroup, there was a small decrease in speeds above the 85th percentile speed.
These data suggest that there is a statistically significant difference in free-flowvehicle speeds when posted limits are set more than 5 mi/h (8 km/h) below the 85thpercentile speed or within 5 mi/h of the 85th percentile speed; however, for the sitesselected in this study, the difference was less than 1 mi/h (1.6 km/h).
Effects on Driver Compliance
Driver compliance with a posted speed limit is defined as the percentage ofvehicles traveling at or below the posted limit . For example, if 75 percent of the driverssampled in a 50-mi/h (81-km/h) posted speed zone are traveling at or below 50 mi/h(81 km/h), then driver compliance would be reported as 75 percent. Traffic engineeringand enforcement officials have not defined specific numerical thresholds for acceptabledriver compliance.
Average driver compliance with speed limits for the group of 57 experimentalsites, before the speed limits were lowered, is shown in figure 24 for posted speed limitsranging from 30 to 5 5 mi/h (48 to 89 km/h). Generally, driver compliance could beconsidered as acceptable for limits posted at 45 mi/h (72 km/h) or greater. However,for sections where the posted limits were less than 4 5 mi/h (72 km/h), driver compliancewas poor. As shown in figure 25, average driver compliance at the 41 experimentalsites, before the speed limits were raised, was very poor for all posted limits.
Average driver compliance for the group of comparison sites, where postedspeed limits were not changed, is shown in figure 26. At limits posted below 55 mi/h(89 km/h), driver compliance at these locations was also poor.
As noted in the previous section on speed effects, most drivers at the study sitesdid not make major alterations in their speed after the new speed limits were posted. Itappears that the new posted speed limits alone, without some additional engineering,enforcement, or educational measures, did not have a major effect on driver behavioror encourage most drivers to comply with the posted speed limit. In the remainingdiscussion on driver compliance, it is important to realize that the before and afterchanges mentioned are basically attributable to the way compliance is measured (i.e.,from the posted speed limit) and not to actual changes in driver behavior.
43

5~ ____________________________________________ ~
4
3 ..c: -'E -c 2 :g {jf1
I ........ Speed Limits Lowered Below 85th I
.!! ~ O+-_______________ ~ __ ~~----------~=_----------~ ~ ~~~~~--~~~~~~--~-Ef -1
.5 & -2 c: CU ..c: () -3
-4
-5~~~ __ ~ __ ~ __ ~ __ ~ __ ~~ __ ~ __ ~ __ ~ __ ~~~ 5 10 15 25 35 50 65 75 85 90 95 99
1 mi/h = 1.61 km/h Percentile Speed
Figure 22. Mean change in percentile speeds at 34 sites where speed limits were lowered below the 85th percentile speed.
5~ ____________________________________________ -,
4
3 5 E -c 2 Q) Q) Q. W
-fr- Speed Limits Raised to 85th
.!! ~ 0 Q) +--------------------------------=~--~~-----; ~ ~ -1 .5 ~ -2 c: cu <3 -3
-4
5 10 15 25 35 50 65 75 85 90 95 99
1 mi/h = 1.61 km/h Percentile Speed
Figure 23. Mean change in percentile speeds at 21 sites where speed limits were raised to the 85th percentile speed.
44

100
90 90
Q) 0 80 c .!!! i5.. E 70 0 (j L- SO ~ .;:; Q
50 '0 Q) Cl 40 IU -C Q)
e 30 Q) 0-c
20 IU Q)
~ 10
o 30 35 40 45 50 55
1 mi/h = 1.S1 km/h Posted Speed Limit, mi/h
Figure 24. Average driver compliance at 57 experimental sites before the speed limits were lowered.
100
90
Q) 0 80 c .!!! i5.. E 70 0 (j "- so Q) > .;:; Q
50 '0 44 Q) Cl 40 IU -C Q)
e 30 Q) 0-c
20 IU Q)
~ 10
0 20 25 30 35 40 45 50
1 mi/h = 1.S1 km/h Posted Speed Limit, mi/h
Figure 25. Average driver compliance at 41 experimental sites before the speed limits were raised.
45

100
90
B 80 c:: .!'!! Q. E 70 69 0
(..) ..... 60 ~ ·c Cl
50 "-0 Q) 01 40 Jg c:: Q)
~ 30 Q) a.. c::
20 til Q)
:2 10
0 20 25 30 35 40 45 50 55
1 mi/h = 1.61 km/h Posted Speed Limit, mi/h
Figure 26. Average driver compliance at the comparison sites.
The mean change in driver compliance, after speed limit alterations were made at the experimental sites, is shown in figure 27 for the speed limit change groups. For the group of sites where the speed limits were lowered by 15 or 20 mi/h (24 or 32 km/h), average compliance decreased by two-thirds. At sites where speed limits were lowered by 10 mi/h (16 km/h), there was approximately a 50 percent reduction in compliance. The majority of drivers, for whatever reasons, apparently did not choose to comply with the new, lower speed limits at these sites.
Conversely, at the group of sites where speed limits were raised by 10 or 15 mi/h (16 or 24 km/h) , there was a fourfold increase in driver compliance. Even at this level, however, only about two-thirds of the motorists drove at or below the posted speed limits. Again, it should be noted that these figures do not reflect a change in driver behavior to comply with the new limits, but a change in the standard used to measure compliance, i.e., the posted speed limit.
Noncompliance with a posted speed limit, as measured by the percentage of drivers who exceed the speed limit by various amounts, has also been used to describe driver behavior. Shown in table 11 is a summary of the mean percentage of drivers exceeding the speed limit by 0, 5, 10, 15, or 20 mi/h (0, 8, 16, 24, or 32 km/h) at the experimental sites for each speed limit change group.
46

(1) 0 c: a:I =a E 0 (.) ... (1) > ·c 0 '0 (1) C)
~ ~ (1) a.
100 93
90
80
70
60
50
40
30
20
10
0 ·15 & ·20
1 mi/h = 1.61 kmlh
II Before Compliance .' After Compliance ,::;,~"'.<
66
·10 ·5 +5 +10 & +15 Change in Posted Speed Limit, mi/h
Figure 27. Driver compliance before and after speed limits were changed at the experimental sites.
As with driver compliance, when the limits were lowered, a greater percentage of drivers exceeded the new limits. When speed limits were raised, more drivers were in compl.iance with the speed limits. Again, these figures do not represent a shift in driver behavior, but a change in how noncompliance is measured, i.e., from the posted speed limit.
As shown in table 12, the mean change in driver compliance between the before and after periods for the comparison site groups where speed limits were not altered was less than 1.6 percent.
There was considerable variation in the percentages from site to site, depending upon the level of the speed limit change. Individual site data for the experimental and comparison sites are given in appendix C.
Overall, altering the speed limits at the experimental sites had a dramatic effect on driver compliance, but most of the effect was due to how compliance was measured, i.e., percentage of motorists driving at or below the posted speed limit. Changing the speed limit did not alter driver behavior. After the speed limits were lowered, driver compliance was typically less than 40 percent at the study sites. At sites where speed limits were raised, compliance was generally less than 60 percent.
47
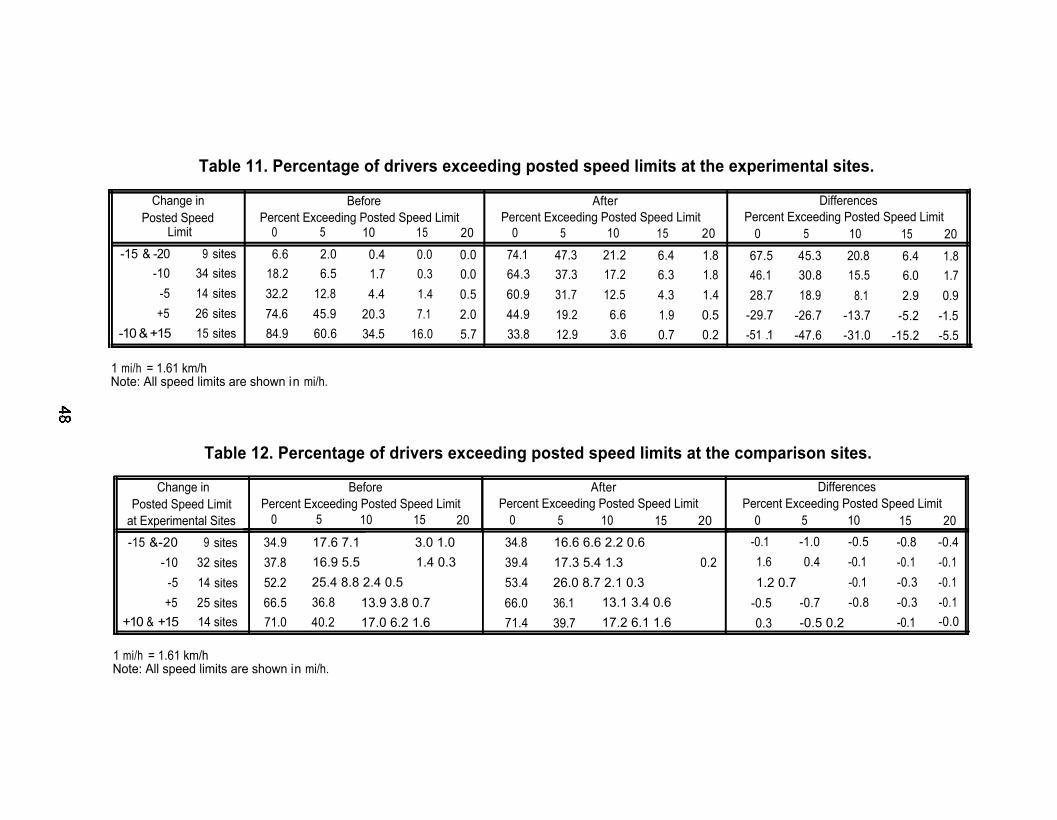
Table 11. Percentage of drivers exceeding posted speed limits at the experimental sites.
Change in Before After DifferencesPosted Speed Percent Exceeding Posted Speed Limit Percent Exceeding Posted Speed Limit Percent Exceeding Posted Speed Limit
Limit 0 5 10 15 20 0 5 10 15 20 0 5 10 15 20-15 & -20 9 sites 6.6 2.0 0.4 0.0 0.0 74.1 47.3 21.2 6.4 1.8 67.5 45.3 20.8 6.4 1.8
-10 34 sites 18.2 6.5 1.7 0.3 0.0 64.3 37.3 17.2 6.3 1.8 46.1 30.8 15.5 6.0 1.7-5 14 sites 32.2 12.8 4.4 1.4 0.5 60.9 31.7 12.5 4.3 1.4 28.7 18.9 8.1 2.9 0.9+5 26 sites 74.6 45.9 20.3 7.1 2.0 44.9 19.2 6.6 1.9 0.5 -29.7 -26.7 -13.7 -5.2 -1.5
-10 & +15 15 sites 84.9 60.6 34.5 16.0 5.7 33.8 12.9 3.6 0.7 0.2 -51 .1 -47.6 -31.0 -15.2 -5.5
1 mi/h = 1.61 km/hNote: All speed limits are shown in mi/h.
Table 12. Percentage of drivers exceeding posted speed limits at the comparison sites.
Change inPosted Speed Limit
at Experimental Sites-15 &-20 9 sites
-10 32 sites-5 14 sites+5 25 sites
+10 & +15 14 sites
Before AfterPercent Exceeding Posted Speed Limit Percent Exceeding Posted Speed Limit
0 5 10 15 20 0 5 10 15 2034.9 17.6 7.1 3.0 1.0 34.8 16.6 6.6 2.2 0.637.8 16.9 5.5 1.4 0.3 39.4 17.3 5.4 1.3 0.252.2 25.4 8.8 2.4 0.5 53.4 26.0 8.7 2.1 0.366.5 36.8 13.9 3.8 0.7 66.0 36.1 13.1 3.4 0.671.0 40.2 17.0 6.2 1.6 71.4 39.7 17.2 6.1 1.6
DifferencesPercent Exceeding Posted Speed Limit
0 5 10 15 20-0.1 -1.0 -0.5 -0.8 -0.41.6 0.4 -0.1 -0.1 -0.11.2 0.7 -0.1 -0.3 -0.1
-0.5 -0.7 -0.8 -0.3 -0.10.3 -0.5 0.2 -0.1 -0.0
1 mi/h = 1.61 km/hNote: All speed limits are shown in mi/h.
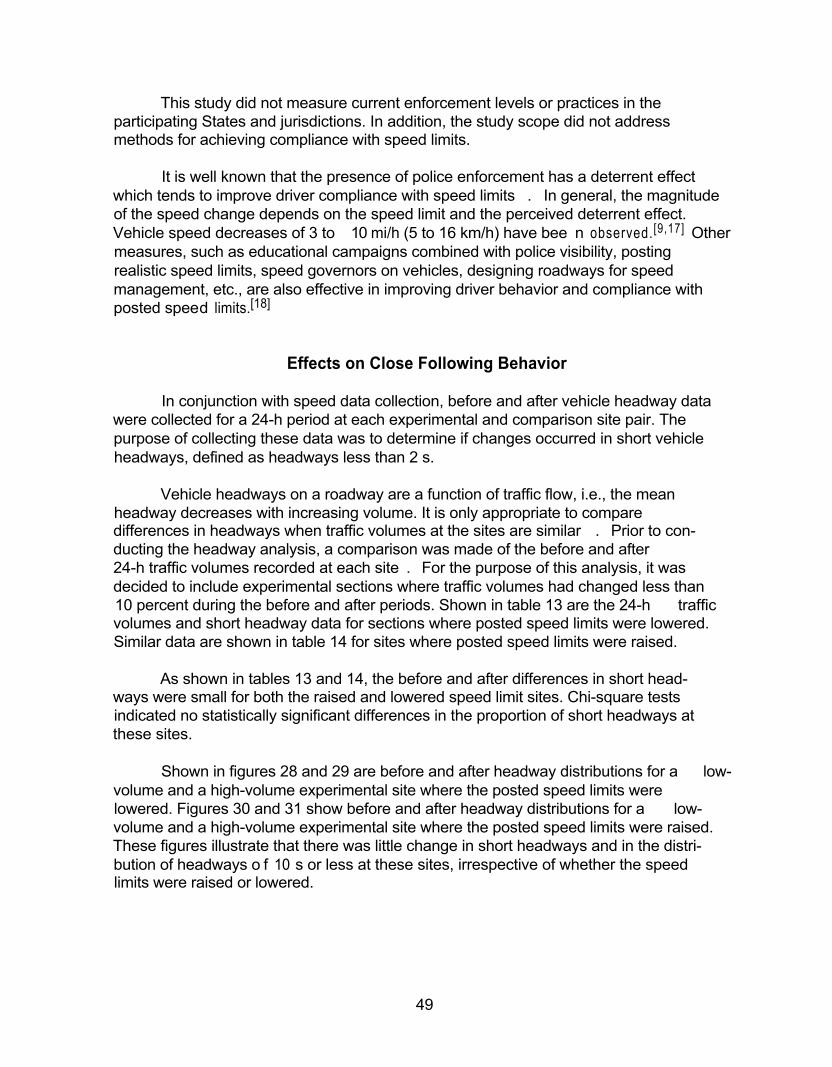
This study did not measure current enforcement levels or practices in theparticipating States and jurisdictions. In addition, the study scope did not addressmethods for achieving compliance with speed limits.
It is well known that the presence of police enforcement has a deterrent effectwhich tends to improve driver compliance with speed limits . In general, the magnitudeof the speed change depends on the speed limit and the perceived deterrent effect.Vehicle speed decreases of 3 to 10 mi/h (5 to 16 km/h) have bee n observed.[9,17] Othermeasures, such as educational campaigns combined with police visibility, postingrealistic speed limits, speed governors on vehicles, designing roadways for speedmanagement, etc., are also effective in improving driver behavior and compliance withposted speed limits.[18]81
Effects on Close Following Behavior
In conjunction with speed data collection, before and after vehicle headway datawere collected for a 24-h period at each experimental and comparison site pair. Thepurpose of collecting these data was to determine if changes occurred in short vehicleheadways, defined as headways less than 2 s.
Vehicle headways on a roadway are a function of traffic flow, i.e., the meanheadway decreases with increasing volume. It is only appropriate to comparedifferences in headways when traffic volumes at the sites are similar . Prior to con-ducting the headway analysis, a comparison was made of the before and after24-h traffic volumes recorded at each site . For the purpose of this analysis, it wasdecided to include experimental sections where traffic volumes had changed less than10 percent during the before and after periods. Shown in table 13 are the 24-h trafficvolumes and short headway data for sections where posted speed limits were lowered.Similar data are shown in table 14 for sites where posted speed limits were raised.
As shown in tables 13 and 14, the before and after differences in short head-ways were small for both the raised and lowered speed limit sites. Chi-square testsindicated no statistically significant differences in the proportion of short headways atthese sites.
Shown in figures 28 and 29 are before and after headway distributions for a low-volume and a high-volume experimental site where the posted speed limits werelowered. Figures 30 and 31 show before and after headway distributions for a low-volume and a high-volume experimental site where the posted speed limits were raised.These figures illustrate that there was little change in short headways and in the distri-bution of headways o f 10 s or less at these sites, irrespective of whether the speedlimits were raised or lowered.
49

Table 13. Before and after short headway data for 28 experimental siteswhere posted speed limits were lowered.
Before After Total Before Before Total After AfterSite Speed Speed Diff. Before <2 s <2 s
IAfter <2 s <2 s
Number Limit Limit Limit Volume Volume Pct. Volume Volume Pct.Two-Lane Sites - Lower Speed LimitsDE02E 50 35 -15 507 13 2.56MA01E 40 30 -10 318 1 0.31 319 4 1.25ME02E 45 35 -10 405 4 0.99 380 5 1.32DE04E 50 40 -10 433 4 0.92 413 6 1.45OH08E 55 45 -10 626 6 0.96 697 5 0.72OH06E 55 45 -10 1,138 22 1.93 1,051 17 1.62VAO5E 5 5 45 -10 1,247 40 3.21 1,230 50 4.07VA03E 5 5 45 -10 1,295 47 3.63 1,307 52 3.98OH11E 50 40 -10 1,391 25 1.80 1,455 23 1.58TX02E 5 5 45 -10 2,259 96 4.25 2,412 107 4.44IN01E 55 45 -10 2,305 87 3.77 2,209 95 4.30CA01E 35 25 -10 2,553 72 2.82 2,493 78 3.13VA07E 5 5 45 -10 4,588 487 10.61 4,305 411 9.55OK04E 45 35 -10 5,663 700 12.36 5,301 599 11.30OK03E 35 25 -10 6,322 490 7.75 5,755 420 7.30NJ02E 4 5 35 -10 7,328 854 11.65 7,584 994 13.11OH07E 55 45 -10 7,715 1,026 13.30 8,280 1,084 13.09VA01E 5 5 45 -10 8,456 1,227 14.51 8,651 1,325 15.32DE03E 50 40 -10 9,039 1,835 20.30 9,092 1,839 20.23OK02E 35 25 -10 11,512 1,000 8.69 11,019 1,063 9.65ME01 E 45 40 -5 343 1 0.29 333 6 1.80IN05E 45 40 -5 1,486 49 3.30 1,521 49 3.22IN07E 50 45 -5 5,745 516 8.98 6,023 602 10.00AZ01E 50 45 -5 7,979 1,577 19.76 8,083 1,686 20.86ID02E 55 50 -5 8,155 1,388 17.02 8,270 1,333 16.12IN06E 50 45 -5 8,563 1,320 15.42 8,770 1,386 15.80IL02E 50 45 -5 9,542 1,611 16.88 10,420 1,909 18.32NJ01 E 40 35 -5 12.853 2.777 21.61 12.485 2.921 23.40
529 11 2.08
1 mi/h = 1.61 km/hNote: All speed limits are shown in mi/h.
50
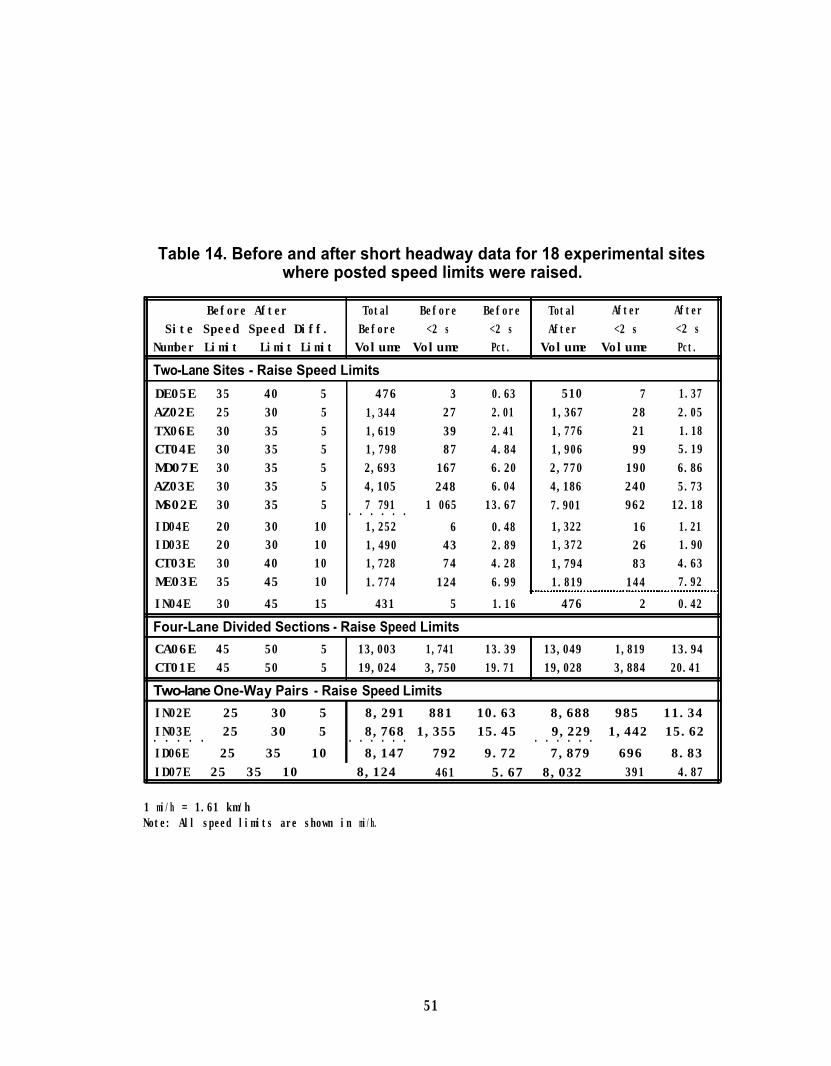
Table 14. Before and after short headway data for 18 experimental siteswhere posted speed limits were raised.
Before After Total Before Before Total After AfterSite Speed Speed Diff. Before <2 s <2 s After <2 s <2 s
Number Limit Limit Limit Volume Volume Pct. Volume Volume Pct.Two-Lane Sites - Raise Speed LimitsDE05E 35 40 5AZ02E 25 30 5TX06E 30 35 5CT04E 30 35 5MD07E 30 35 5AZ03E 30 35 5MS02E 30 35 5ID04E 20 30 10ID03E 20 30 10CT03E 30 40 10ME03E 35 45 10
476 3 0.631,344 27 2.011,619 39 2.411,798 87 4.842,693 167 6.204,105 248 6.047 791 1 065 13.67. . . . . . 1,252 6 0.481,490 43 2.891,728 74 4.281.774 124 6.99
510 7 1.371,367 28 2.051,776 21 1.181,906 99 5.192,770 190 6.864,186 240 5.737.901 962 12.181,322 16 1.211,372 26 1.901,794 83 4.631.819 144 7.92
IN04E 30 45 15 431 5Four-Lane Divided Sections - Raise Speed Limits
1.16 476 2 0.42
CA06E 45 50 5 13,003 1,741CT01E 45 50 5 19,024 3,750Two-lane One-Way Pairs - Raise Speed Limits
13.39 13,049 1,819 13.9419.71 19,028 3,884 20.41
IN02E 25 30 5 8,291 881 10.63 8,688 985 11.34IN03E 25 30 5 8,768 1,355 15.45 9,229 1,442 15.62. . . . . . . . . . . . . . . . . ID06E 25 35 10 8,147 792 9.72 7,879 696 8.83ID07E 25 35 10 8,124 461 5.67 8,032 391 4.87
1 mi/h = 1.61 km/hNote: All speed limits are shown in mi/h.
51

30~ ______________________________________________ ~
25
m 20 U :c ~ ..... o 15 Q) tn
~ Q)
~ 10 rT.
5
Posted Speed Limit Lowered at VA05E
1___ 55 mifh - Before 4r- 45 mifh - After
Before 24-h Volume 1,247 After 24-h Volume 1,230
<:2 2-2.9 3-3.9 4-4.9 5-5.9 6-S.9 7-7.9 8-8.9 9-9.9 10-10.9
1 mifh = 1.61 kmfh Headway, S
Figure 28. Before and after percent changes in headways at a low-volume experimental site where the speed limit was lowered.
30~ ______________________________________________ ~
25
m 20 15 :c ~ ..... o 15 Q) tn
~ Q)
~ 10 Q)
a.
5
Posted Speed Limit Lowered at DE03E
1___ 50 mifh - Before --.s;;}- 40 mifh - After
Before 24-h Volume 9,039 After 24-h Volume 9,092
O~~ ____ ~ __ ~ ____ ~ __ ~ ____ ~ __ ~ ____ ~ __ ~ ____ ~ <2 2-2.9 3-3.9 4-4.9 5-5.9 6-S.9 7-7.9 8-8.9 9-9.9 10-10.9
1 mifh = 1.S1 kmfh Headway, S
Figure 29. Before and after percent changes in headways at a high-volume experimental site where the speed limit was lowered.
52

30~ ______________________________________________ ~
25
:3 20 13 :E ~ -o 15 Q) Cl .s c Q)
~ 10 Q) a..
5
Posted Speed Limit Raised at AZ02E
1___ 25 mi/h - Before --t::r- 30 mi/h - After
Before 24-h Volume 1,344 After 24-h Volume 1,367
o---o-.....---~~.=~~ O~~ ____ ~ __ ~ ____ ~ __ ~ ____ ~ __ ~ ____ ~ __ ~ ____ ~
<2 2-2.9 3-3.9 4-4.9
1 mi/h = 1.61 km/h
5-5.9 6-6.9
Headway, s 7-7.9 8-8.9 9-9.9 10-10.9
Figure 30. Before and after percent changes in headways at a low-volume experimental site where the speed limit was raised.
30~ ______________________________________________ --,
25
:3 20 13 :E ~ -o 15 Q) Cl .s c Q)
~ 10 Q) a..
5
Posted Speed Limit Raised at CA06E
1 ___ 45 mi/h - Before --t::r- 50 mi/h - After
Before 24-h Volume 13,003 After 24-h Volume 13,049
o~~ ____ ~ __ ~ ____ ~ __ ~ ____ ~ __ ~ ____ ~ __ ~ ____ ~ <2 2-2.9 3-3.9 4-4.9 5-5.9 6-6.9 7-7.9 8-8.9 9-9.9 10-10.9
1 mi/h = 1.61 km/h Headway, s
Figure 31. Before and after percent changes in headways at a high-volume experimental site where the speed limit was raised.
53

Repeated Measurements
The results of speed observations have shown that variations in spot speedsoccur over time, even in the absence of speed limit changes or othe r alterations.[19-21]
To obtain some information on the time effects of speed limit alterations, repeatedspeed measurements were made at 11 experimental and comparison sites.
Posted speed limits on the experimental sites were lowered at five locations andraised at six other sites. Speed data were collected before the speed limits wereposted and again after the new limits were posted, at intervals ranging from 1 day to2 years and 9 months. A summary of the 24-h mean and 85th percentile speeds for the11 sites is shown in table 15. A detailed summary of the speed measurements for thesites is given in appendix D.
Of the five sites where speed limits were lowered, two locations, OH01 E andOH05E, were on roadways passing through small rural communities. Two otherlocations, DE01 E and VA05E, were two-lane facilities in rural communities. Sit e IN07Ewas a primary route in a small urban area.
As shown in table 15, at four sites where speed measurements were taken within1 to 3 months after the speed limits were lowered, the 85th percentile speeds increasedby 1 mi/h (1.6 km/h) at one site, decreased by 2 mi/h (3.2 km/h) at another site, andremained the same at two locations. One year after the speed limits were lowered, the85th percentile speeds decreased by 1 mi/h (1.6 km/h) at one site, decreased by 2 mi/h(3.2 km/h) at one site, and remained the same at two sites. At three sites wheremeasurements were taken 2 yr after the speed limits were lowered, 85th percentilespeeds decreased by 1 mi/h (1.6 km/h) at two sites, and increased by 1 mi/h (1.6 km/h)at one site.
Of the six sites where speed limits were raised, two locations , MD06E andTX01E, were roadways passing through small rural communities. Site s ID03E andID04E were urban streets in a city of less than 5,000 persons. The site in Virginia,VA02E, was a two-lane facility in a small urban area. Sit e MD01E was a rural two-laneroadway where the speed limit was raised from 50 to 55 mi/h (81 to 89 km/h).
At five sites where speed measurements were taken within 1 to 3 months afterthe speed limits were raised, the 85th percentile speeds increased by 1 mi/h (1.6 km/h)at three sites, increased by 2 mi/h (3.2 km/h) at one site, and remained the same at onesite. One year after the speed limits were changed, the 85th percentile speedsincreased by 1 mi/h (1.6 km/h) at two locations, increased by 2 mi/h (3.2 km/h) at twosites, and decreased by 3 mi/h (4.8 km/h) at one location. At three sites wheremeasurements were made 2 yr after the speed limits were raised, the 85th percentilespeeds increased by 2 mi/h (3.2 km/h) at one location, remained the same at onelocation, and decreased by 1 mi/h (1.6 km/h) at one location.
54
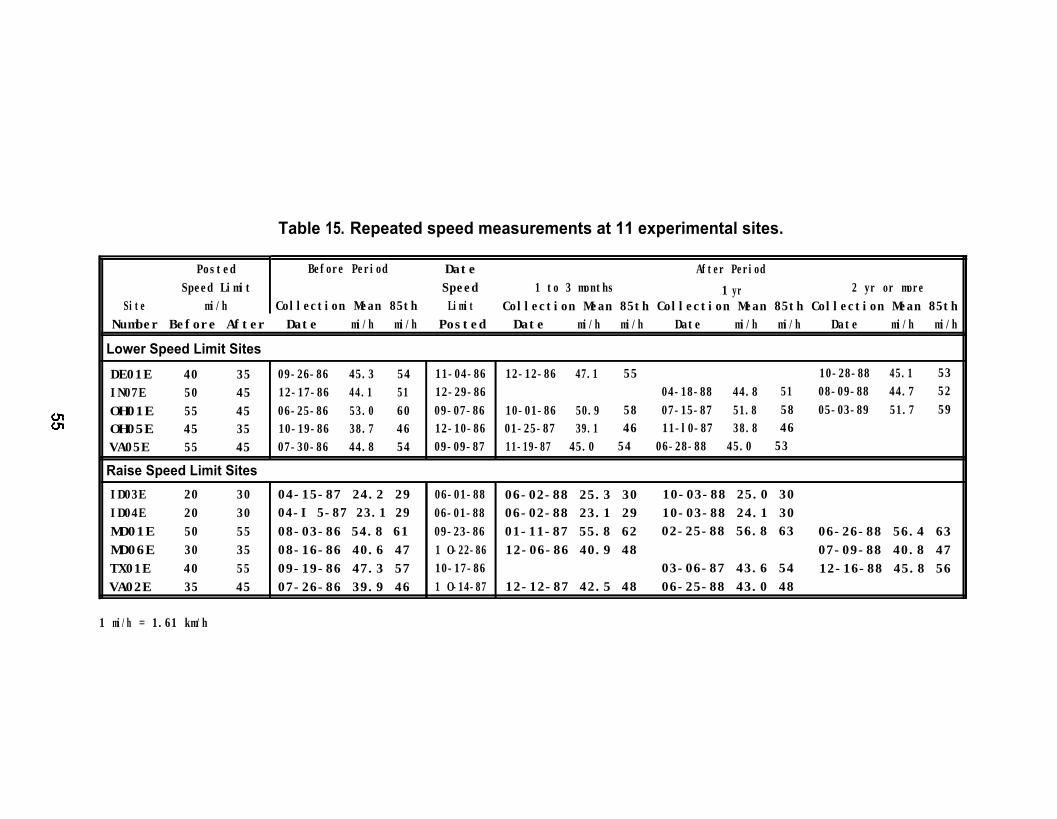
Table 15. Repeated speed measurements at 11 experimental sites.
Before Period Date After PeriodPostedSpeed Limit Speed
Site mi/h Collection Mean 85thNumber Before After Date
1 to 3 months 1 yr 2 yr or moreLimit Collection Mean 85th Collection Mean 85th Collection Mean 85th
mi/h mi/h Posted Date mi/h mi/h Date mi/h mi/h Date mi/h mi/h
Lower Speed Limit Sites
DE01E 40 35 09-26-86 45.3 54 11-04-86 12-12-86 47.1 55 10-28-88 45.1 53IN07E 50 45 12-17-86 44.1 51 12-29-86 04-18-88 44.8 51 08-09-88 44.7 52OH01E 55 45 06-25-86 53.0 60 09-07-86 10-01-86 50.9 58 07-15-87 51.8 58 05-03-89 51.7 59OH05E 45 35 10-19-86 38.7 46 12-10-86 01-25-87 39.1 46 11-l0-87 38.8 46VA05E 55 45 07-30-86 44.8 54 09-09-87 11-19-87 45.0 54 06-28-88 45.0 53
Raise Speed Limit SitesID03E 20 30 04-15-87 24.2 29 06-01-88 06-02-88 25.3 30 10-03-88 25.0 30ID04E 20 30 04-I 5-87 23.1 29 06-01-88 06-02-88 23.1 29 10-03-88 24.1 30MD01E 50 55 08-03-86 54.8 61 09-23-86 01-11-87 55.8 62 02-25-88 56.8 63 06-26-88 56.4 63MD06E 30 35 08-16-86 40.6 47 1 O-22-86 12-06-86 40.9 48 07-09-88 40.8 47TX01E 40 55 09-19-86 47.3 57 10-17-86 03-06-87 43.6 54 12-16-88 45.8 56VA02E 35 45 07-26-86 39.9 46 1 O-14-87 12-12-87 42.5 48 06-25-88 43.0 48
1 mi/h = 1.61 km/h

Shown in figure 32 are the average changes in the before and after 85th percentile speeds for the group of five locations where speed limits were lowered, and the group of six locations where speed limits were raised.
Inspection of figure 32 reveals that for the group of five sites where speed limits were lowered, the average change in 85th percentile speeds was a decrease of less than 1 mi/h (1.6 km/h) for 1 and 2 yr following the speed limit change.
For the group of six sites where speed limits were raised, the average change in 85th percentile speeds was an increase of less than 1 mi/h (1.6 km/h) for 1 and 2 yr following the speed limit change.
The number of sites and the number of repeated measurements are too small to establish trends or permit drawing conclusions concerning the time effects of speed limit changes. The speed measurements taken at 11 selected sites over a 2-yr period after speed limits were altered revealed that small changes (Le., 2 mi/h (3.2 km/h» occur in the 24-h 85th percentile speeds of free-flow vehicles at any given site. Similar changes were also found in the mean speeds. For the group of sites where speed limits were lowered, the 85th percentile speeds decreased by less than 1 mi/h (1.6 km/h). At sites where posted speed limits were raised, the 85th percentile speeds increased by 1 mi/h (1.6 km/h) or less.
5.-________________________________________ ~
4 III Lower Speed Limit Sites ::'~ Raise Speed Limit Sites
S 3 E -g 2 Q) 0-
C/)
~1 :;:::
1.0 0.6 0.3 c: ' . ",' ", .
~ 0 "1--___ " '~'~' __ ;'~''''>'''·---'1IJ!-01J.3.:t:·::;':~;''---I
.c: -1 -0.8
~ .£ -2 Q) Ol c: ~ -3 ()
-4
-5~ ______ ~ __________ ~ ____________ ~ ______ ~
1 to 3 Months
1 mi/h = 1.61 km/h
1 Year
After Posting New Speed Limit 2 Years
Figure 32. Mean changes in 85th percentile speeds at five sites where speed limits were lowered and at six sites where speed limits were raised.
56

Indirect Effects on Nearby Roads
Speed, headway, and crash data were collected for five selected highwaysections that were contiguous to four experimental sites. The purpose of thesemeasurements was to determine if speed limit changes on the experimental sectionshad an indirect effect on driver behavior on the contiguous sections. Selection of thecontiguous sites was not random, but was dependent on the selection of the experi-mental sites provided by the participating jurisdictions. Due to cost constraints, thesample of sites studied was limited to five locations.
No speed limit or other alterations to the roadway were made on the contiguoussections during the study period. Posted speed limits on the adjacent experimentalsections were lowered at two sites and raised at two other sites. All of the contiguousand experimental sites were two-lane facilities.
The general characteristics of the contiguous sites are shown in table 16. Asummary of the before and after 24-h free-flow speed data, as well as the differences inspeed characteristics, is given in tables 17 through 19. The percentage of drivers thatexceeded the posted speed limits at these sites is shown in table 20. A summary ofbefore and after police-reported crashes on the contiguous sections is shown in table21. A discussion of the indirect effects at each of the contiguous sites is given below.
The first site listed in table 16, COO1 P, had a posted speed limit of 40 mi/h(64 km/h) and was contiguous to a 1.05-mi (1.69-km) rural experimental section,CO01E, where the speed limit was raised from 30 to 3 5 mi/h (48 to 56 km/h). Thesections were located on the only major highway facility in the area. The general terrainof the area was mountainous, where horizontal and vertical alignment constraintsfrequently require motorists to reduce speed. Between the before and after datacollection periods, there was a 10 percent increase in the 24-h traffic volume on theexperimental section. As shown in table 19, there was a 1-mi/h (1.6-km/h) decrease inthe percentile speeds on the contiguous section after the speed limit was raised on theexperimental section.
Table 16. Contiguous site characteristics.
Parallel Speed Intersections DrivewaysSite Length, No. Limit Signalized No Signal Comm. Resid.
Number Jurisdiction Route Area Miles Lanes mi/h Per Mile
COO1 P Jefferson Count y 72 Rural 2.45 2 40 0.00 0.00 0.00 7.76IN07P Scott County 31 at Scottsburg Small Urban 0.37 2 35 0.00 16.22 24.32 27.03T X0 6P City of Justin FR 156 Rural 0.48 2 35 0.00 18.75 56.25 0.00WV1 1 P Kanawha Count y 62 Rural 0.20 2 45 0.00 5.00 30.00 5.00WV12P Kanawha Count y 62 Rural 1.12 2 45 0.00 11.61 14.29 38.39
5 Sites 4.62 Miles
1 mi= 1.61 km1 milh = 1.61 km/hNote: All speed limits are shown in mi/h.
57

Table 17. Before speed data for the contiguous sites.
BeforeParallel Posted Data Std. Free- Pct. 10-mi/h Pace
Site Speed Collection Mean Dev. Before Flow Free Percentile Speeds Lower Upper Pct. Skew.Number Limit Date Speed Speeds Volume Volume Flow 1 5 IO 15 25 35 50 65 75 85 90 95 99 Limit Limit Pace Index
CO01P 40 02/02/87 47.0 4.8 3,275 2,488 76.0 34 40 42 43 45 46 48 49 50 52 53 55 59 43 52 73.8 0.86IN07P 35 12/17/86 42.3 6.4 8,468 6,634 78.3 24 32 35 37 39 41 43 45 47 49 50 53 57 39 48 62.5 1 .00T X 0 6 P 35 03/11/87 34.7 6.9 3,787 3,372 89.0 17 23 26 29 31 33 35 38 40 42 44 46 51 31 40 58.2 1 .00WV11P 45 06/19/86 47.1 8.4 3,720 3,191 85.8 25 33 37 40 43 45 48 51 53 55 58 61 67 43 52 49.3 0.92WV12P 45 06/19/86 41.0 8.5 8.902 6.888 77.4 22 29 31 32 35 37 41 45 48 50 53 55 61 37 46 39.8 1.08
1 mi/h = 1.61 km/hNote: All speed limits and vehicle speeds are shown in mi/h.
Table 18. After speed data for the contiguous sites.
Parallel Posted Data Std. Free- Pct. 10-mi/h PaceSite Speed Collection Mean Dev. After Flow Free Percentile Speeds L o w e r U p p e r Pct. Skew.
Number Limit Date Speed Speeds Volume Volume Flow 1 5 IO 15 25 35 50 65 75 85 90 95 99 Limit Limit Pace IndexII
CO01 P 40 05/16/88 46.5 4.9 3,592 2,642 73.6 33 39 41 42 44 46 47 49 50 51 53 54 58 43 52 74.5 0.92IN07P 35 08/09/88 42.3 6.9 8,804 7,065 80.2 23 29 33 36 39 41 43 46 47 49 51 53 57 40 49 58.7 0.86T X 0 6 P 35 03/31/88 35.3 6.5 3,853 3,529 91.6 17 25 28 29 32 34 36 38 40 42 44 46 51 32 41 59.5 0.95WV11P 45 06/21 /89 47.1 7.3 5,273 4,056 76.9 27 35 39 41 44 45 48 50 52 55 56 59 64 43 52 56.4 0.95WV12P 45 06/21/89 41.1 8.4 9.193 7.018 76.3 25 29 31 32 35 38 42 45 48 50 52 55 62 39 48 41.1 1 .oo
1 mi/h = 1.61 km/hNote: All speed limits and vehicle speeds are shown in mi/h.

Table 19. Differences in speed characteristics for the contiguous sites.Parallel Posted Std. Free- Pct. 10-mi/h Pace
Site Speed Mean Dev. Total Flow Free Percentile Speeds Lower Upper Pct. Skew.Number Limit Speed Speeds Volume Volume Flow 1 5 10 15 25 35 50 65 75 85 90 95 99 Limit Limit Pace Index
CO01 P 40 -0.5 0.1 317 154 -2.4 -1 -1 -1 -1 -1 0 -1 0 0 -1 0 -1 -1 0 0 0.7 0.06IN07P 35 0.0 0.5 336 431 1.9 -1 -3 -2 -1 0 0 0 1 0 0 1 0 0 1 1 -3.8 -0.14T X 0 6 P 35 0.6 -0.4 66 157 2.6 0 2 2 0 1 1 1 0 0 0 0 0 0 1 1 1.3 -0.05WV11P 45 0.0 -1.1 1,553 865 -8.9 2 2 2 1 1 0 0 -1 -1 0 -2 -2 -3 0 0 7.1 0.03WV12P 45 0.1 -0.1 291 130 -1.1 3 0 0 0 0 1 1 0 0 O - l 0 1 2 2 1.3 -0.08
1 mi/h = 1.61 km/hNote: All speed limits and vehicle speeds are shown in mi/h.
Table 20. Percentage of drivers exceeding posted speed limits at the contiguous sites.Parallel Posted
Site SpeedNumber Limit
CO01 P 40IN07P 35TX06P 35WV11P 45WV12P 45
BeforePercent Exceeding Posted Speed Limit
AfterPercent Exceeding Posted Speed Limit
DifferencesPercent Exceeding Posted Speed Limit
0 5 10 15 20 0 5 10 15 20
91.8 66.7 21.8 3.2 0.3 -0.9 -1.7 -2.9 -1.0 -0.286.7 67.3 36.2 10.4 1.9 -2.0 0.3 2.2 1.0 0.054.0 22.2 6.2 1.3 0.1 5.5 1.8 -0.2 0.1 -0.163.8 33.2 12 1 3.5 0.7 1.6 -2.9 -2.7 -1.8 -0.733 .9 14.7 4.6 1.3 0.3 0.3 0.2 -0 .1 0.3 0.1
Note: All speed limits are shown in mi/h
Table 21. Before and after crash data for the contiguous sites.
Third Before Second Before First Before First AfterParallel
Second AfterPeriod Period Period Total Before Period Period Total After
Site Posted Length, Before After B3 B3 B3 B2 B2 B2 B1 B1 B1 B B B Al Al Al A2 A2 A2 A A ANumber Limit Miles Volume Volume Total Injury Month Total Injury Month Total Injury Month Total Injury Mont h Total Injury Month Total Injury Month Total Injury Month
CO01P 40 2.45 3,275 3,592 17 7 12 12 7 12 6 3 12 35 17 36 8 4 12 8 4 12IN07P 35 0.37 8,468 8,804 6 2 12 3 0 12 9 4 12 18 6 36 4 2 12 4 1 12 8 3 24T X 0 6 P 35 0.48 3,787 3,853 3 0 12 3 2 12 4 2 12 10 4 36 2 1 12 2 1 12WV11PP 45 0.20 3,720 5,273 1 0 12 1 1 12 2 2 12 4 3 36 2 0 12 0 0 12 2 0 24WV12P 4 5 1.12 8,902 9,193 11 1 12 10 2 12 17 8 12 38 11 36 11 6 12 14 8 12 25 14 24
5 Sites 4.62 38 10 29 12 38 19 105 41 27 13 18 9 45 221 mi= 1.61 km
1 mi/h = 1.61 km/hNote: All speed limits are shown in mi/h. Blanks indicate that crash data were not available for the period.

The Indiana site, IN07P, was on a major primary highway located in a smallurban area. The speed limit on the section was 3 5 mi/h (56 km/h). The site waslocated between two experimental sites , IN06E and IN07E, where the speed limits werelowered from 50 to 45 mi/h (81 to 72 km/h). The 24-h traffic volume increasedapproximately 4 percent on the experimental sections between the before and afterperiods. As shown in table 19, there was no change in the mean speed, but there weresmall reductions in the percentile speeds below the 15th percentile, on the contiguoussection, after the posted speed limits were lowered on the experimental sections.
The Texas site, TX06P, passed through a small rural community and waslocated adjacent to a 0.54-mi (0.87-km) experimental site where the speed limit wasraised from 30 to 35 mi/h (48 to 56 km/h). The posted speed limit o n TX06P was35 mi/h (56 km/h). Drivers on the experimental section must turn onto and off of theadjacent section to continue their journey. The experimental and adjacent sections arethe only major primary highways in the community. There was a minor change in the24-h traffic volume on the experimental section during the study period. As shown intable 19, there was a 0.6-mi/h (0.97-km/h) increase in the mean speed, and there weresmall increases in the percentile speeds below the 50th percentile speed, on theadjacent section, after the posted speed limit was raised on the experimental section.
The two West Virginia contiguous sites, WV1 1 P and WV1 2P, were located in asmall city at each end of a 1.14-mi (1.84-km) experimental section where the speedlimit was lowered from 45 to 35 mi/h (72 to 56 km/h). The speed limit posted on thecontiguous sections was 45 mi/h (72 km/h). The 24-h traffic volume at site WV1 1 Pincreased by 42 percent; however, the volume at site WV12P only increased by3 percent during the study period. Based on a review of the area, the volume increaseat site WV1 1 P was due to development in the adjacent area, and was not due to driversattempting to avoid the lower speed limit on the experimental section. There were noother major highways in the area that could be used by drivers to bypass the experi-mental section. As shown in table 19, changes in the mean speeds at the contiguoussites were minor; however, there was a small increase in the percentile speeds belowthe 50th percentile and a small decrease in the percentile speeds above the 50thpercentile at site WV1 1 P after the speed limit was lowered on the experimental site.
As can be seen by examining table 19, changes in the mean speeds, standarddeviation of speeds, and 85th percentile speeds at the contiguous locations weregenerally less than 1 mi/h (1 .6 km/h). As shown in table 20, there were minor changesin the percentage of drivers exceeding the posted speed limits at these sites. Thenumber of before and after police-reported crashes on the contiguous sections,summarized in table 21, is too small to provide meaningful results.
Due to the small sample of sites examined in this study, it is not possible to drawconclusions concerning potential carryover effects of posted speed limit changes on aroadway section to nearby roadways where speed limits were not changed. Drivers onthe five contiguous sections examined in this study did not appear to change theirbehavior, regardless of whether the speed limits were lowered or raised on theexperimental sites.
60

Discussion of Speed Effects
The purpose of this study was to examine the effects of raising and loweringposted speed limits on driver behavior for urban and rural nonlimited access roadways.Although additional enforcement, education, and other engineering measures havebeen used to effectively manage vehicle speeds, this study only examined the effects ofchanging the posted speed limit on driver behavior.
Because the participating transportation officials would not permit randomselection of sites for speed limit changes, experimental sections were selected fromlocations where the agencies planned to change posted speed limits as a result ofroutine traffic and engineering investigations. Comparison sites, where speed limitswere not changed, were selected by the research team to control for extraneous factorssuch as weather conditions. During the time that data were collected, from June 1986through July 1989, the maximum speed limit on nonlimited access highways was55 mi/h (89 km/h). At that time, State and local transportation officials typically changedposted speed limits on short roadway segments, i.e., usually less than 2 mi (3.2 km) inlength. The average length of sections selected for the study was 1.7 mi (2.7 km).Sixty-three percent of the sites were located in rural areas and small communities witha population of less than 5,000 persons.
Of the 98 sites selected for speed data collection in 22 States, posted speedlimits were lowered at 57 sites and raised at 41 other locations. Changes in the postedspeed limits ranged from lowering the speed limit by 5, 10, 15, or 20 mi/h (8, 16, 24, or32 km/h) to raising the speed limit by 5, 10, or 1 5 mi/h (8, 16, or 24 km/h). During thestudy, only one change in the posted speed limit was made at each site. Before andafter speeds of free-flow vehicles (vehicles with a headway of 4 s or more) werecollected for a 24-h period simultaneously at each experimental and comparison sitepair.
A review of the before and after speed data at each experimental site revealedthat differences in the mean speeds, standard deviation of speeds, and 85th percentilespeeds were generally less than 2 mi/h (3.2 km/h). When sites were grouped byamount of speed limit change, the differences in the percentile speeds for each groupwere less than 1.5 mi/h (2.4 km/h), irrespective of whether the posted speed limit waslowered or raised, or the amount that the limit was changed. While these differencesare statistically significant due to the large speed samples collected, the overall changein speeds is small.
At 34 locations, existing speed limits were posted within 5 mi/h (8 km/h) of the85th percentile speed. Speed limits at these sites were lowered more than 5 mi/h(8 km/h) below the 85th percentile speed. At 21 other locations, existing speed limitswere posted more than 5 mi/h (8 km/h) below the 85th percentile speed, and theagencies raised the posted speed limit to within 5 mi/h (8 km/h) of the 85th percentilespeed. Comparison of the before and after percentile speeds for both groups of sitesrevealed that the mean difference in percentile speeds was less than 1 mi/h (1.6 km/h).
61

Based on the speed data collected at the study sites, speed limits were typicallyset below the average speed of traffic.
By defining driver compliance as the number or percentage of drivers that travelat or below the posted speed limit, major changes in compliance occurred when speedlimits were either raised or lowered. However, as reflected in small changes in vehiclespeeds, driver behavior did not change; but the standard for measuring compliance,i.e., posted speed limit, changed.
Because the sites were not randomly selected from the population of nonlimitedaccess highways, the findings apply only to the locations studied, and may apply toother locations where agencies alter speed limits for similar reasons. As noted below,the study findings are similar to the results reported by other researchers who examineddriver behavior changes before and after speed limits were changed on nonlimitedaccess highways.
A number of studies have been conducted on nonlimited access highways toexamine the effects of changing posted speed limits on drive r behavior. [22-33] Asummary of the data obtained from published reports is shown in table 22 for urban andrural nonlimited access highways. Table 23 provides a summary of operational studies.It should be noted that studies concerning the effects of posted speed limit changes onlimited access high-speed highways are not included in the following discussion, norare the effects of other speed management techniques, as this study only examinedchanges in posted speed limits on nonlimited access highways.
Avery conducted before and after studies on 11 arterial streets consisting ofsegments varying from 1 to 4.5 mi (1.6 to 7.3 km) in length.[22] Speed limits were raisedfrom 30 to 35 mi/h (48 to 56 km/h) on some sections, and from 30 to 40 mi/h (48 to64 km/h) on other sections. Avery found that the speed changes were small and notrelated to the amount that the limit was changed.
Ogawa et al. examined the effects of raising the speed limit by 5 mi/h (8 km/h) intwo rural towns in lll inois.[24] No significant difference in speeds was found where speedlimits were raised; however, a small, but statistically significant increase in speedoccurred in one town where the speed limit was lowered.
Roberts found that raising the speed limit from 35 to 40 mi/h (56 to 64 km/h) on a1.5-mi (2.4-km) four-lane urban street in Columbia, South Carolina, did not significantlychange the mean, 85th percentile, or 10-mi/h (16-km/h) pace. [25]
Rowan and Keese conducted before and after studies at 186 locations to deter-mine the effect of speed limit signs on traffic speeds. [29]q Speed limits were changedfrom 60 to 30 mi/h (97 to 48 km/h) and from 30 to 55 mi/h (48 to 89 km/h) in 5-mi/h(8-km/h) increments. They found that speed limit signs had little influence on drivers’speeds; however, they detected a slight decrease in the dispersion of traffic speeds.
62

Table 22. Summary of research studies on the effects of raising and lowering speed limits.
Speed Speed Average 85th Percentile Speed, mi/hNumber Limit Limit After After
Author, Date, of Before After Posting PostingLocation and Reference Sections mi/h mi/h Before Lower Limit Higher Limit Remarks
Urban
St. Paul, Avery, 1 960[22] 7 30 35 35.5 35.8 Compliance increased from 36 to 80 percent.Minnesota
4 30 40 39.4 40.8 Compliance increased from 19 to 82 percent.
West Lafayette, Elmberg, 1 9 6 0 [ 2 3 ] 1 35 30 38.4 38.5 Percentage of vehicles exceeding the speedIndiana limit by 5 mi/h or more increased from 10 to
30 percent.
St. Joseph, Ogawa, 1 9 6 2 [ 2 4 ] 1 30 35 30.6* 31.3* Speed limit revisions based on 85th percentileIllinois speeds. The mean speed increase in Ogden
is statistically significant.
Ogden, Illinois 1 40 35 32.2* 33.3”
Fithian, Illinois 1 35 40 34.9* 35.3*
Columbia, Roberts, 1 9 6 7 [ 2 5 ] 1 35 40 42.5 41.0 Compliance increased from 28 to 76 percent.South Carolina
10 California Spitz, 1 9 8 4 [ 2 6 ] 40 NA NA 39.9 40.3 The 85th percentile speed in the 2 7 compari-Cities
10son samples where no change in the limit
NA NA 36.9 38.6 was made increased from 40.1 to 40.8 mi/h.
3 UrbanFringe Areasin Texas Dudek, 1986[27] 6 55 45 55.9 54.0 Lowering the speed limit had little effect on
vehicle speeds and speed variance.
1 mi/h = 1.61 km/hNA = Not Available
* = Denotes mean speeds, not 85th percentile speeds[ ] = Numbers in brackets refer to references
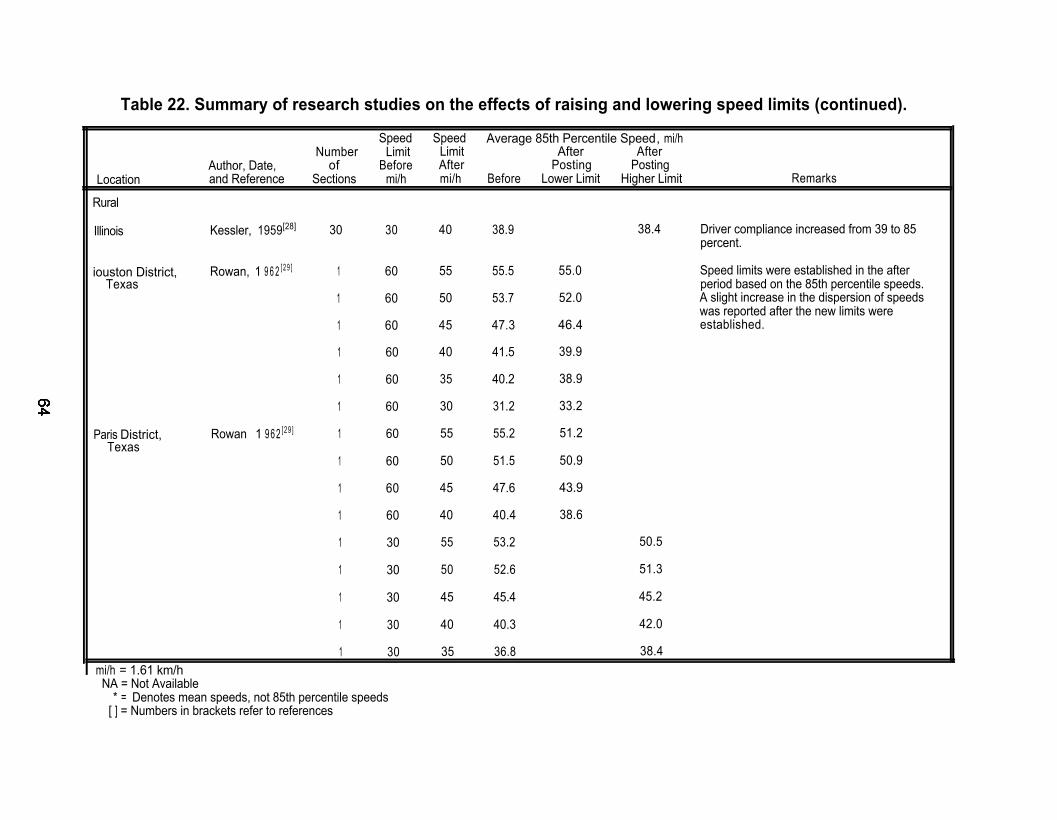
Table 22. Summary of research studies on the effects of raising and lowering speed limits (continued).
Location
Rural
Author, Date,and Reference
Speed Speed Average 85th Percentile Speed, mi/hNumber Limit Limit After After
of Before After Posting PostingSections mi/h mi/h Before Lower Limit Higher Limit Remarks
Illinois Kessler, 1959[28] 30 30
iouston District, Rowan,, 1 9 6 2 [ 2 9 ] 1 60Texas
1 60
1 60
1 60
1 60
1 60
Paris District, Rowan, 1 9 6 2 [ 2 9 ] 1 60Texas
1 60
1 60
1 60
1 30
1 30
1 30
1 30
1 30mi/h = 1.61 km/hNA = Not Available
* = Denotes mean speeds, not 85th percentile speeds[ ] = Numbers in brackets refer to references
40 38.9
55 55.5
50 53.7
45 47.3
40 41.5
35 40.2
30 31.2
55 55.2
50 51.5
45 47.6
40 40.4
55 53.2
50 52.6
45 45.4
40 40.3
35 36.8
55.0
52.0
46.4
39.9
38.9
33.2
51.2
50.9
43.9
38.6
38.4
50.5
51.3
45.2
42.0
38.4
Driver compliance increased from 39 to 85percent.
Speed limits were established in the afterperiod based on the 85th percentile speeds.A slight increase in the dispersion of speedswas reported after the new limits wereestablished.

Table 23. Summary of operational studies on the effects of raising and lowering speed limits.
Speed Speed Average 85th Percentile Speed, mi/hNumber Limit Limit After After
Author, Date, of Before After Posting PostingLocation and Reference Sections mi/h mi/h Before Lower Limit Higher Limit Remarks
Massachusetts Oct. 1 9 6 6 [ 3 0 ] 19 Two-lane 30-45 20-35 47.5 48.3 After posting 10-mi/h lower and higher limitsthan existing zones, no differences in 85th
30-45 40-55 47.5 48.0 percentile speeds were found.
6 Dual-lane 50-55 40-45 60.7 60.3
60-65 60.7 61 .O
Minnesota Jan. 1 979[31] 12 Two-lane 45 30 NA 43.6
4 Four-lane 40 30 42.0 40.3
Washington 1981 -82[32] 3 25 30 34.7 34.3
1 50 55 57.0 59.0
1 50 35 43.0 42.0
3 40 35 45.0 43.7
Michigan 1 982 [33 ] 4 25 35 37.6 36.0 Compliance increased from 10 to 81 percent.
4 55 50 56.8 54.8 Compliance decreased from 73 to 56 percent.
4 55 50 57.8 56.0 Compliance decreased from 71 to 46 percent.
5 45 35 49.2 47.0 Compliance decreased from 56 to 7 percent.
1 mi/h = 1.61 km/hNA = Not Available
* = Denotes mean speeds, not 85th percentile speeds[ ] = Numbers in brackets refer to references
Dudek and Ullman conducted before and after studies where speed limits werelowered from 55 to 45 mi/h (89 to 72 km/h) on six urban fringe highway sites inTexas. [27] Roadway section lengths ranged from 2 to 3.9 mi (3.2 to 6.3 km). Nosignificant changes were found in speeds or the speed distributions.
Studies conducted by Avery and Elmberg revealed that there were few changesin the mean, standard deviation, and percentage of vehicles in the pace when speedlimits were established on the basis of the 85th percentil e speed. [22,23]
While much of the previous speed limit research on nonlimited access highwayswas limited in scope, several trends are worth noting. First, the magnitude of anychange in speed due to a speed limit alteration was small, typically 1 mi/h (1.6 km/h),even in cases with large posted speed limit changes. Secondly, due to the speed limitchange and the fact that driver compliance is measured as the number or percentage ofmotorists driving at or below the posted limit, there was a significant change incompliance.
The findings of the current study, as well as the results of previous research,indicate that changing the posted speed limit did not have a major effect on driverbehavior on the urban and rural nonlimited access highway sections that were studied.

EFFECTS ON CRASHES
Prior to collecting before and after speed data for this study, the effects of postedspeed limit changes on vehicle speeds for a large sample of jurisdictions wereunknown. During the development of the experimental plan, it was assumed thatposted speed limits would have an effect on driver speeds, and that the speed changeswould be large enough to have an effect on crashes. [10] Accordingly, at that time, adecision was made to collect and analyze crash data.
As the results of the driver behavior analysis indicate, vehicle speed changes atindividual study sites, although statistically significant, were small, i.e., generally lessthan 2 mi/h (3.2 km/h). As there were small differences in vehicle speeds, irrespectiveof whether posted speed limits were raised or lowered and the amount of the change,there is no reason to suspect that changing posted speed limits at the study sites hadan effect on crashes. Thus, any changes in crashes at the study sites may beattributed to other factors beyond the scope of this study, and not to altering the postedspeed limits.
As before and after crash data were collected at the experimental and compari-son sites, the data were analyzed and the results are reported in this section.
As previously mentioned, the study sites were located in 22 States. In any crashevaluation, the quality of the data is always a majo r concern. [34] It is well known thatcrash reporting practices, reporting thresholds, level of detail, and other factors thataffect the quality of crash data vary widely among States and jurisdictions. Whileattempts were made to obtain accurate crash data for the study sites, the overall qualityof the data is unknown. Accordingly, the results of this or any other evaluation thatuses multi-State data should be interpreted with caution.
Analysis Methodology
As the participating States and jurisdictions would not permit random selectionand assignment of sites to experimental and control groups, experimental sites wereselected from locations furnished by the jurisdictions where speed limit changes weremade as part of a routine traffic and engineering investigation. By necessity, compari-son sites were selected by the research team in the field during the review of theexperimental sections. Although the team attempted to match comparison sites andexperimental sites with similar safety and operational characteristics, i.e., number of

Because a crash at a site is rare compared to other events, such as trafficvolume, free-flow vehicle speeds, etc., the minimum sample size requirements for thestudy were based on estimated crash counts. As sites were furnished by the partici-pating agencies, attempts were made during the site selection process to ensure thatthe minimum sample size would be obtained. It was clear early in the site selectionprocess that crash counts at the selected sites were less than originally estimated. Asa result, additional sites beyond the 100 mi (161 km) originally estimated were selecteduntil all of the available funding for data collection was depleted.
After speed limit changes were made on the experimental sections, police-reported crash data were obtained for each experimental and comparison site. Thecrash data were received from the participating agencies in a variety of formats,including computerized summaries, hard copies of the reports, and data formatted oncomputer diskette.
Before and after crash data were collected for 99 experimental sites and theircorresponding comparison locations. As speed limits on the experimental sectionswere posted on different dates, every effort was made to collect as much crash data aspossible to increase the sample size. For most locations, the crash data were collectedfor a 3-yr before period and a 2-yr after period. The final crash data base available foranalysis contained 6,307 crashes.
Shown in appendix E are the before and after summaries of the total police-reported crashes and fatal and injury crashes for each experimental and comparisonsite.
Evaluation Design
The evaluation design selected to estimate the effectiveness of speed limitchanges on crashes was the before-and-after design with a comparison group, and acheck for comparability . [ 3 5 ] With this design, multiple before and after crash counts aretaken at both the experimental and comparison locations. The purpose of the multiplemeasurements is to determine if the comparison locations are suitable comparisons forthe experimental sites. The purpose of the comparison group is to account for changesin safety (such as weather conditions, driver characteristics, etc.) between the beforeand after periods, The primary benefit of this design is that the comparison groupcontrols for extraneous factors, and as multiple measurements are made over anumber of years, some relief from regression-to-the-mean bias is possible.
Numerous statistical methods have been used for analyzing categorical crashdata. Each method contains strengths and weaknesses. For example, the simplebefore-and-after design may be biased due to nonrandom errors introduced byunaccounted for factors that unevenly affect crashes in the before or after period. Onthe other hand, the use of a comparison group with a small number of crashes can alsobias the results. Due to the strengths and weaknesses of various analysis methods,four different techniques were used to estimate the safety effects of the speed limitchanges.
68

The first method, reported by Griffin, uses multiple before and after analyses withpaired comparison ratios to estimate the overall safety effects at multiple treatmentlocations.[36,37] The second method is the classical cross-product ratio or odds ratio thatestimates safety effects based only on the total crash counts at the sites. Application ofthis method is also discussed b y Griffin.[35]
Because regression-to-the-mean is an important factor that can often lead toerroneous conclusions in crash analyses, the third analysis method employed the useof a new empirical Bayes method, EBEST (Empirical Bayes Estimation of Safety andTransportation), which adjusts for regression-to-the-mean bias and provides a morerealistic estimate of the safety effects. [ 3 8 ] The EBEST procedure requires a referencegroup and measurement of site exposure. Because the reference group available foruse in this study was smaller than required for appropriate application of the method,the procedure was used primarily to approximate the amount of regression-to-the-meanbias in the dataset.
The fourth analysis method is the before-and-after design that uses the weightedaverage logit to produce an overall estimate of safety effects at multiple treatmentlocations.[39] This method does not use comparison sites to control for extraneousfactors. The results obtained with the before-and-after design may contain nonrandomerrors such as changes in traffic volumes, weather conditions, crash reportingthresholds, and other factors. Thus, the safety estimates produced by this method maybe biased and invalid.
The before-and-after design with a comparison group and a check for compara-bility can be used to estimate the effects of a treatment on crashes at a single site or fora group of sites if the number of reported crashes is sufficiently large. In this study, thedesign was used to estimate safety effects for groups of sites. The design was notused to estimate the effect of posted speed limit changes on crashes at each individualexperimental site due to the small number of crash counts at the experimental andcomparison sites . In addition, the comparison group must have a sufficient number ofcrashes, otherwise, it is better not to use it.[40]
The comparison group was not used to estimate the safety effects when thecomparability tests indicated that the crash histories either during the before period orduring the after period at the experimental and comparison sites were not comparable.When the groups were not comparable, the before-and-after design, using the weightedaverage logit, was employed.[39]
The null hypothesis tested was that the observed crashes after treatment, i.e.,installation of the new speed limit signs, were equal to the expected crashes aftertreatment. All statistical analyses were conducted at the 0.05 significance level (a).Rejection of the null hypothesis required a probability or p-value <0.05.
For each of the analysis methods, the expected crashes after treatment explicitlyconsidered unequal before and after reporting periods and changes in traffic volumes atthe sites.
69

Procedure
The analysis procedure included the following steps:
(1) Conduct a check for comparability.
(2) Estimate the treatment effects using multiple before and after analyses withpaired comparison ratios. The comparison ratios adjust the expectednumber of crashes for unequal time periods and changes in traffic volumes.
(3) Estimate the treatment effects using the classical cross-product ratio or oddsratio based on the total number of crashes in the evaluation group.
(4) Use the empirical Bayes method to examine the amount o f regression-to-the-mean bias present in the sample.
(5) Estimate the safety effects using the before-and-after design that employsthe weighted average logit.
Estimates of the effects of speed limit changes on total crashes were made forthe following groups:
- The 58 experimental sites where posted speed limits were lowered using49 corresponding comparison sites. In addition, the sites were furtheranalyzed by level of posted speed limit change, i.e., reduced by 5, 10, or15 and 20 mi/h (8, 16, or 24 and 32 km/h).
l The 41 experimental sites where posted speed limits were raised using34 corresponding comparison sites. These sites were further subdividedinto two groups, i.e., raised 5 mi/h (8 km/h) and raised 10 and 15 mi/h(16 and 24 km/h).
- The 21 sites where speed limits were posted within 5 mi/h (8 km/h) of the85th percentile speed and the 34 sites where the speed limits were postedmore than 5 mi/h (8 km/h) below the 85th percentile speed.
Estimates of the effects of speed limit changes on fatal and injury crashes werealso made for the lowered and raised speed limit groups. Due to sample sizelimitations of these data, no analyses were conducted for the amount of speed limitchange groups.
Although it is possible to subdivide the sites into other groups, this was not doneas further subdivisions produced too small a sample size for analysis.
Details of the analysis procedure, along with an example of the paired compari-son ratios method, are provided in appendix F.
70
Results
As previously mentioned, the statistical analyses were conducted for sites wherespeed limits were lowered and sites where speed limits were raised. A summary of theresults by analysis method is provided in table 24. illustrated graphically in figure 33are the 95 percent confidence limits, which are very large for both lowered and raisedposted speed limit conditions.
As shown in table 24, the results of the statistical tests indicated that there is notsufficient evidence in this dataset to reject the hypothesis that total crashes or fatal andinjury crashes changed when posted speed limits were either raised or lowered.
The EBEST analysis indicated that the average shrinkage in th e dataset wherespeed limits were lowered was 0.15. The average shrinkage in th e dataset wherespeed limits were raised was 0.10. Average shrinkage factors range from 0 (noregression-to-the-mean bias) to 1 .O, indicating substantial bias. The shrinkage factorsmentioned above provide an indication that regression-to-the-mean may not be a majorfactor with this dataset.
The paired comparison ratios method indicated that there was a statisticallysignificant increase in crashes at the 14 sites where speed limits were lowered by5 mi/h (8 km/h). This result must be viewed with caution due to the small number ofcrashes in the sample.
The before-and-after method indicated that there was a significant decrease incrashes at the 41 sites where speed limits were raised. This result is contrary to theresults of the other methods and may be due to the previously cited limitations of thebefore-and-after method.
Results at 85th Percentile Sites
Crash data were analyzed for the 34 experimental sites where posted speedlimits were initially within 5 mi/h (8 km/h) of the 85th percentile speeds and postedspeed limits were lowered at these sites more than 5 mi/h (8 km/h) below the 85thpercentile speeds. An analysis was also conducted for the 21 sites where speed limitswere initially set more than 5 mi/h (8 km/h) below the 85th percentile speeds, and theposted speed limits were raised to within 5 mi/h (8 km/h) of the 85th percentile speeds.
As shown in table 25, there is not sufficient evidence in thi s dataset to reject thehypothesis that crash experience changed when posted speed limits were either raisedto within 5 mi/h (8 km/h) of the 85th percentile speeds or lowered more than 5 mi/h(8 km/h) below the 85th percentile speeds. The 95 percent confidence limits for theseestimates, which are large, are shown in figure 34.
71
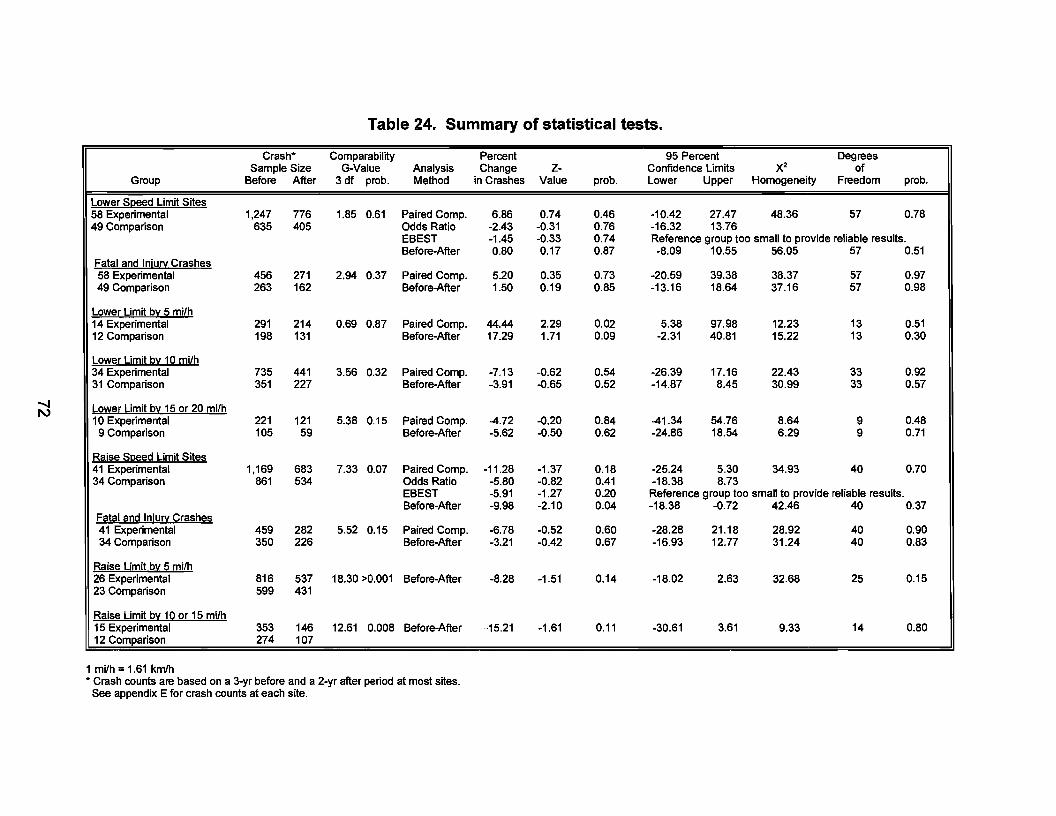
Table 24. Summary of statistical tests.
Crash* Comparability Percent 95 Percent Degrees Sample Size G-Value Analysis Change z- Confidence Limits X2 of
Group Before After 3 df prob. Method in Crashes Value prob. Lower Upper Homogeneity Freedom prob.
Lower Sl2eed Limit Sites 58 Experimental 1,247 776 1.85 0.61 Paired Compo 6.86 0.74 0.46 ·10.42 27.47 48.36 57 0.78 49 Comparison 635 405 Odds Ratio -2.43 -0.31 0.76 -16.32 13.76
EBEST -1.45 -0.33 0.74 Reference group too small to provide reliable results. Before-After 0.80 0.17 0.87 -8.09 10.55 56.05 57 0.51
Fatal and Injuri Crashes 58 Experimental 456 271 2.94 0.37 Paired Compo 5.20 0.35 0.73 -20.59 39.38 38.37 57 0.97 49 Comparison 263 162 Before-After 1.50 0.19 0.85 -13.16 18.64 37.16 57 0.98
Lower Limit by: 5 mi/h 14 Experimental 291 214 0.69 0.87 Paired Compo 44.44 2.29 0.02 5.38 97.98 12.23 13 0.51 12 Comparison 198 131 Before-After 17.29 1.71 0.09 -2.31 40.81 15.22 13 0.30
Lower Limit by: 10 mi/h 34 Experimental 735 441 3.56 0.32 Paired Compo -7.13 -0.62 0.54 -26.39 17.16 22.43 33 0.92 31 Comparison 351 227 Before-After -3.91 -0.65 0.52 -14.87 8.45 30.99 33 0.57
Lower Limit by: 15 or 20 mi/h 10 Experimental 221 121 5.38 0.15 Paired Compo -4.72 -0.20 0.84 -41.34 54.76 8.64 9 0.48 9 Comparison 105 59 Before-After -5.62 -0.50 0.62 -24.86 18.54 6.29 9 0.71
Raise Sl2eed Limit Sites 41 Experimental 1,169 683 7.33 0.07 Paired Compo -11.28 -1.37 0.18 -25.24 5.30 34.93 40 0.70 34 Comparison 861 534 Odds Ratio -5.80 -0.82 0.41 -18.38 8.73
EBEST -5.91 -1.27 0.20 Reference group too small to provide reliable results. Before-After -9.98 -2.10 0.04 -18.38 -0.72 42.46 40 0.37
Fatal and Injuri Crashes 41 Experimental 459 282 5.52 0.15 Paired Compo -6.78 -0.52 0.60 -28.28 21.18 28.92 40 0.90 34 Comparison 350 226 Before-After -3.21 -0.42 0.67 -16.93 12.77 31.24 40 0.83
Raise Limit by: 5 mi/h 26 Experimental 816 537 18.30 >0.001 Before-After -8.28 -1.51 0.14 -18.02 2.63 32.68 25 0.15 23 Comparison 599 431
Raise Limit by: 10 or 15 mi/h 15 Experimental 353 146 12.61 0.008 Before-After -15.21 -1.61 0.11 -30.61 3.61 9.33 14 0.80 12 Comparison 274 107
1 mi/h = 1.61 krnlh * Crash counts are based on a 3-yr before and a 2-yr after period at most sites.
See appendix E for crash counts at each site.

Table 25. Summary of crash results at 85th percentile sites.
Crash* Comparability Percent 95 PercentSample Size G-Value
GroupAnalysis Change Z- Confidence Limits X2
Degreesof
Before After 3 df prob. Method in Crashes Value prob. Lower Upper Homogeneity Freedom prob.
Sites where speed limits were within 5 mi/h of the 85th percentile steeds and speed limits were lowered more than 5 mi/h below the 85th Percentile speeds
34 Experimental 854 501 4.40 0.22 Paired Comp . 13.90 1.24 0.22 -7.26 39.90 34.75 3330 Comparison
0.39478 291 Before-After 0.25 0.04 >0.90 -10.46 12.24 33.91 33 0.43
Sites where speed limits were more than 5 mi/h below the 85th oercentile speeds an d speed limits were raised to within 5 mi/h of the 85th oercentile speeds
21 Experimental 693 407 29.38>0.001 Before-After -8.32 -1.34 0.18 -19.25 4.09 19.75 2017 Comparison
0.48409 202
1 mi/h = 1.61 km/h* Crash counts are based on a 3-yr before and a 2-yr after period at most sites.
See appendix E for crash counts at each site.

50
40
30
Upp" E,Um'" ~
27.5
III Ql 20 ..c III e () 10 .f:
/ Best Estimate
6.9 5.3
Ql 0 C>
c: C\3 ..c () -10 -c: Ql ~ -20 Ql a.
-30
-,".4 ,I -11.3
Lower Estimate -20.2
-40
-50 . . .. Lower Speed Limit Raise Speed Limit
Type of Posted Speed Limit Change
Figure 33. Summary of crash effects at sites where posted speed limits were altered.
50
40
30 Upper Estimate
III Ql 20 ..c III 12.2 e () 10
Best Estimate
.f: 0.3 Ql
C> 0
4.1
c: a:i ..c () -10 - -8. c: Ql ~ -20 Ql a.
-30
-40
-50 Lower Below 85th Raise to 85th
Type of Posted Speed Limit Change
Figure 34. Summary of crash effects at sites where speed limits were lowered below or raised to the 85th percentile speeds.
74

Multiple-Vehicle vs. Single-Vehicle Crashes
Before-and-after crash data collected at the study sites provided information oncrash severity, persons killed and injured, collision type, number of vehicles, lightingconditions, roadway surface conditions, intersection-relatedness, and estimated speedsof the vehicles involved in the crashes. Information on contributing circumstances wasnot available for all jurisdictions. While a breakdown of the crashes by each of thesevariables is possible, the resulting number of crashes is too small to provide meaningfulresults.
In order to provide an indication of the sample sizes for each speed limit changegroup, the crash data were summarized for multiple-vehicle and single-vehicle crashesfor equal before and after time periods. The results are shown in table 26. If loweringthe speed limit resulted in additional vehicle queues, one might expect an increase inmultiple-vehicle crashes. On the other hand, if speed limits were raised, it is plausiblethat there could be an increase in single-vehicle crashes, assuming that all other factorsremained the same.
As shown in table 26, there was a small percent increase in multiple-vehiclecrashes for all speed limit groups. As traffic volumes increased by 4 to 12 percentduring the study period for the group of sites, this result is most likely due to volumeincreases at the sites, as opposed to the posted speed limit change. In fact, the limitedamount of short headway data collected during the study indicated that the proportionof vehicles traveling at short headways after the new speed limits were posted did notchange at locations where traffic volumes did not change.
Table 26. Multiple-vehicle and single-vehicle crashes.
Multiple-Vehicle3-yr Before 2-yr After Diff.
No. Pct. No. Pct. Pct.149 67.42 74 72.55 5.13503 68.44 270 74.38 5.94205 74.01 177 83.10 9.09548 69.28 393 74.86 5.58275 77.90 115 79.31 1.41
Single-Vehicle3-yr Before 2-yr After Diff.
No. Pct. No. Pct. Pct.72 32.58 28 27.45 -5.13
232 31.56 93 25.62 -5.9472 25.99 36 16.90 -9.09
243 30.72 132 25.14 -5.5878 22.10 30 20.69 -1.41
1 mi/h = 1.61 km/h
75

Crash-Speed Relationships
In an effort to examine if changes in the speed distributions produced corres-ponding changes in crashes at the study sites, scatter plots of selected variables weredeveloped. No attempt was made to develop a mathematical model, as the primaryinterest was to examine before-and-after differences in the variables.
Selected parameters of the speed distributions were plotted against changes incrashes at the experimental sites. For example, the changes in crashes vs. thechanges in 85th percentile speeds are shown in figure 35 for sites where speed limitswere lowered. The data for sites where speed limits were raised are shown infigure 36. The changes in crashes vs. the changes in mean speeds are shown infigures 37 and 38 for the lowered and raised sites, respectively. The changes incrashes vs. the changes in coefficients of variation (the standard deviation divided bythe mean) of speeds are shown in figures 39 and 40 for the lowered and raised sites,respectively.
As can be seen by examining figures 35 through 40, the scatter plots do notprovide an indication of any relationship between changes in crashes and changes inthe three speed parameters examined. It is important to note, however, that thechanges in the speed distributions are quite small, perhaps too small to have an effecton crashes.
Changes in crashes with changes in other speed variables, including the 50thpercentile speed, the upper limit of the pace, and the skewness index, were plotted.These plots also did not reveal any trends or relationships.
A scatter plot was also developed to determine if a relationship exists betweenthe ratio of after-to-before 85th percentile speeds and the ratio of after-to-beforecrashes. For example, if the after-to-before speed ratio is greater than 1 .O, there hasbeen an increase in the 85th percentile speed. One might expect that an increase inspeed could increase the crash ratio. Similarly, when the speed ratio is less than 1 .O,one might expect a decrease in the crash ratio. Shown in figures 41 and 42 are plots ofthe crash-speed ratios for the lowered and raised speed limit sites, respectively. Theseplots also do not show a relationship between the crash-speed ratios.
76

20
15 't:J 0 .;:: Q)
10 a.. L-Q) Q,
~ 5 ~ ... Q) Q, 0 m .c. II)
!!! -5 o .!: Q) -10 0) c:: C'U .c. o -15
-20
I y Lower Posted Speed Limit I
" .,. .,. .,.
I F .,. J -• ~ * .,.
• .,. .,. .,.
.,.
-5 -4 -3 -2 -1 0 1 2 3 4 5
1 mi = 1.61 km Change in 85th Percentile Speed, mi/h
1 mi/h = 1.61 km/h
Figure 35. Before and after changes in crashes vs. changes in the 85th percentile speeds at sites where speed limits were lowered.
20
15 't:J
I A Raise Posted Speed Limit
0 .;:: Q)
10 a.. &
e,.
L-Q) Q,
~ 5 ~ ... Q) Q, 0
I.il. f:.:,. I.il.
&, f:.:,. ~ ~ &,
II) Q) .c. II)
!!! -5
= ~ ~ I.il. LI. LI.
I.il. e,.
0 .5 & -10 c:: C'U
.c:. .c. o -15
f:.:,.
-20
-5 -4 -3 -2 -1 0 1 2 3 4 5
1 mi = 1.61 km Change in 85th Percentile Speed, mi/h
1 mi/h = 1.61 kmlh
Figure 36. Before and after changes in crashes vs. changes in the 85th percentile speeds at sites where speed limits were raised.
77

20
15 "C
I y Lower Posted Speed Limit I
0 ·c Q) a. 10 .... ... Q) a. ... ~ 5 :il .... Q) a. 0
, ... ... "" . ~.,." ...
~.;- ~, .. -, II) Q) .c II)
-5 l!!
w'" ,"'V"w " ...... i'" ......"
()
. 5 ... " Q) -10 C) c: CIS .c () -15 "
-20
-5 -4 -3 ~ ~ 0 1 2 3 4 5
1 mi = 1.61 km Change in Mean Speed, mi/h
1 mi/h = 1.61 km/h
Figure 37. Before and after changes in crashes vs. changes in the mean speeds at sites where speed limits were lowered.
"C o ·c Q)
20
15
Cl. 10 .... Q) a. ~ 5 :il .... <II a. 0 II) Q) .c II)
~ -5 ()
.5 Q) -10 C) t: CIS .c U -15
-20
I /::;. Raise Posted Speed Limit I 6
Co.
66 6.
6 Co. 6~ " AI. 6
A '-"~ ~- .Co.~.£,.,,",&
r &I. A
Co.
~
A
A
-5 -4 -3 ~ ~ 0 1 2 3 4
1 mi = 1.61 km Change in Mean Speed, mi/h
1 mi/h = 1.61 km/h
Figure 38. Before and after changes in crashes vs. changes in the mean speeds at sites where speed limits were raised.
78
5

20
15 I • Lower Posted Speed Limit I 'C 0 '1: Q)
10 a.. ... ... ...
Q) Q. ~ ~ 5 :5 ... Q) Q. 0
.\ ... ... '- ... ... • ... I/) Q) J:: I/)
~ -5
... 'Y~~ I" '"
... ... ... ...... U .5 ... ... & -10 I: ctI
J:: U -15 ...
-20
-10 -8 -6 4 ~ 0 2 4 6 8 10
Change in Coefficient of Variation 1 mi = 1.61 km
Figure 39. Before and after changes in crashes vs. changes in the coefficients of variation of speeds at sites where speed limits were lowered.
20
15 I~ Raise Posted Speed Limit I 'C 0
'1: Q)
10 a.. ... Q) Q.
~ 5 :5 ... Q) Q. 0 :B J:: I/)
~ -5 U .5 & -10 I: ctI J:: U -15
-20
-10 -8
1 mi = 1.61 km
-6
6. ~
6. &. 6.
~ ~A6.6. 8A
6. =8 6.7i7!Ki
!1;;. 6. f: 6.
6. 6.
t;".
6.
I
4 ~ 0 2 4 Change in Coefficient of Variation
6 8 10
Figure 40. Before and after changes in crashes vs. changes in the coefficients of variation of speeds at sites where speed 'limits were raised.
79

5~ ____________________________________________ --,
I '" Lower Posted Speed Limit I 4
, .."
.." .." .." ¥ .."
JJ I .. ~ W .."
f .." .." .."
• ..".."
.." .." • o+_----+-----+_----+-~~~~_.+_----+_----+_--~
0.8
1 mi = 1.61 km
0.9 1.0 1.1
After/Before 85th Percentile Speed Ratio 1.2
Figure 41. Ratio of the change in crashes vs. ratio of the change in 85th percentile speeds where speed limits were lowered.
5~ ____________________________________________ --,
4 o
~ ~
~ 3 !/) Q)
..c: !/)
~ ()
~ 2 .E Q)
CO 1::: Q)
~ 1
., A Raise Posted Speed Limit .. 1 8
o+-____ +-____ +_----+_~~+_·~~~~--+_----+_--~
0.8
1 mi = 1.61 km
0.9 1.0 1.1
After/Before 85th Percentile Speed Ratio 1.2
Figure 42. Ratio of the change in crashes VS. ratio of the change in 85th percentile speeds where speed limits were raised.
80

Discussion of Crash Effects
Before and after crash data were collected at the study locations because it wasassumed that posted speed limits could have an effect on driver speeds, and that thespeed changes would be large enough to have an effect on crashes. As the results ofthe before and after speed analyses indicate, vehicle speed changes at the study siteswere small. Accordingly, it is not logical to assume that changing the posted speedlimits at the study sites had an effect on crashes.
As before and after crash data were collected at the study sites, the data wereanalyzed using four crash evaluation analysis methods. Before and after crash datawere analyzed for 99 experimental sites and their corresponding comparison locations.
The results of the statistical tests indicate that there is not sufficient evidence toreject the hypothesis that total crashes or fatal and injury crashes changed when postedspeed limits were either raised or lowered.
Crash data were also analyzed for 34 experimental sites where posted speedlimits were initially set within 5 mi/h (8 km/h) of the 85th percentile speeds and postedlimits at these sites were lowered more than 5 mi/h (8 km/h) below the 85th percentilespeeds. An analysis was also conducted for the 21 sites where speed limits wereinitially set more than 5 mi/h (8 km/h) below the 85th percentile speeds and the limits atthese sites were raised to within 5 mi/h (8 km/h) of the 85th percentile speeds. Theresults of these analyses indicate that there is not sufficient evidence to reject thehypothesis that crash experience changed when posted speed limits were eitherlowered more than 5 mi/h (8 km/h) below the 85th percentile speeds or raised to within5 mi/h (8 km/h) of the 85th percentile speeds.
Because random selection and assignment of roadway sections to experimentalgroups for posted speed limit changes and to control groups were not possible, thesefindings apply only to the study locations and cannot be generalized.
Although many transportation engineers and the public consider posted speedlimits to be associated with safety, very few investigators have studied the effect ofchanging speed limits on crashes on nonlimited access highways. Most of the recentstudies have dealt with the effects of 55- and 65-mi/h (89- and 105-km/h) speed limitson crashes on high-speed limited access highways. As the scope of this study onlyincluded nonlimited access facilities, the following discussion only pertains to studies onnonlimited access highways.
Kessler found that when speed limits were raised at 30 locations in Illinois, the85th percentile speeds did not change; however, the number of crashes decreasedfrom 62 to 40. [28]
Wenger examined crash experiences at 25 locations in St. Paul, Minnesota, andfound that raising speed limits from 30 to 35 or 40 mi/h (48 to 56 or 64 km/h) adverselyaffected crashes.[41]
81

Dudek and Ullman examined the impacts of posting speed limits below the 85thpercentile speeds at six locations in Texas and found no conclusive effect on eithertravel speeds or crashes.[27]
McCoy et al. collected crash, speed, and other data at 38 nonlimited access sitesin Nebraska.[42] The sections examined ranged from 0.2 to 1.2 mi (0.3 to 1.9 km) inlength, and average daily traffic volumes ranged from 500 to 20,000 vehicles. Theresults of their analyses indicated that sites with reasonable speed limits set by theNebraska Department of Roads’ method of speed zoning were safer than zones withposted speed limits that were set 5 or 10 mi/h (8 or 16 km/h) below the reasonablelimits.
One problem with the previous research, including the current study, is the smallnumber of crashes used to estimate the safety effects.
The study with the largest crash sample size conducted to date was completedby Parker in Michigan . [21]I The study included experimental sites where posted speedlimits were changed, and corresponding comparison sites where no changes weremade. Before and after crash data were collected for 68 nonlimited access highwaysections and 86 comparison sections. At the experimental sites , 1 1,120 crashes wereavailable for analysis. At the 86 comparison sites, 26,617 crashes were analyzed.
Analysis of the data indicated that there was no t sufficient evidence to reject thehypothesis that crash experience changed when posted speed limits were either raisedor lowered. The same finding was reported for sites where the speed limit was set atthe 85th percentile speed and at sites where the speed limit was posted more than5 mi/h (8 km/h) below the 85th percentile speed. Although the Michigan crash database was much larger than the crash data base used in the current study, the resultswere the same.
Based on the best information available to date, there is no evidence to suggestthat lowering or raising posted speed limits on nonlimited access roadways has aneffect on crashes. Reducing the posted speed limit without utilizing other enforcement,educational, and engineering measures does not appear to be an effective safetytreatment.
82

SUMMARY, FINDINGS, AND CONCLUSIONS
SUMMARY
This research was conducted to examine the effects of raising and loweringposted speed limits on driver behavior for urban and rural nonlimited access roadways.The scope of the study was limited to examining changes in driver behavior when theonly change was an alteration in the posted speed limit.
Due to legislative requirements, tort liability issues, and public confidenceconcerns, the participating States and jurisdictions would not permit the research teamto randomly select and assign roadway sections for speed limit changes. Because theoriginal study design could not be implemented, experimental sections were selectedfrom locations where transportation agencies planned to change posted speed limits asa result of routine traffic and engineering investigations. Based on safety and opera-tional characteristics, comparison sites were selected by the research team during afield review of the experimental locations.
The study was conducted from October 1985 to September 1992, when themaximum speed limit was 55 mi/h (89 km/h) on nonlimited access highways. Duringthis period, the States and localities lowered and raised posted speed limits on shortroadway segments, typically less than 2 mi (3.2 km) in length. The general types ofsites included in the study were:
1. A roadway section in a small rural town or community where the speed limiton the adjoining roadway sections was 5 5 mi/h (89 km/h). The length ofthese sections varied between 0.5 and 1 mi (0.8 and 1.6 km).
2. A roadway section in an urban. suburban. or rural area where public orpolitical requests or increases or decreases in th e adjacent land use andcorresponding traffic volumes dictated the need for a change in the speedlimit. These sections were typically 1 mi (1.6 km) in length.
3. A two- or four-lane nonlimited access roadway section in a rural area wherethe speed limit was raised to 5 5 mi/h (89 km/h). These sections werebetween 2 and 12 mi (3.2 and 19.3 km) in length.
Posted speed limits were changed for the following reasons:
l As a result of a request from the public, political leaders, or enforcementofficials.
l To ensure that speed limits were appropriate for roadway and trafficconditions.
l As a result of a high incidence of traffic crashes.l To comply with local laws or ordinances.l In response to changing traffic volume and land-use patterns.
83

The study included the collection of driver behavior and crash data in 22 States.The data were collected at 100 sites on nonlimited access highways, consisting of172 mi (277 km) where speed limits were either lowered or raised, and at 83 compari-son sites, consisting of 132 mi (213 km), where no changes in the posted speed limitswere made. Sixty-three percent of the sites selected were in rural areas and smallcommunities with a population of less than 5,000 persons. Ninety-four percent of thesections were two-lane highways. Traffic volumes on the sections ranged from 300 to17,000 vehicles/day.
Of the 100 study sites, posted speed limits were lowered at 59 sites and raisedat 41 other locations. Changes in the posted speed limits ranged from lowering thespeed limit by 5, IO, 15, or 20 mi/h (8, 16, 24, or 32 km/h) to raising the speed limit by5, 10, or 15 mi/h (8, 16, or 24 km/h). Only one change in the posted speed limit wasmade at each site during the study.
Speed limits on the experimental sections were changed between July 1986 andMay 1989. The before speed data were collected between June 1986 and June 1988.The after speed data were collected between August 1987 and July 1989. Collection ofthe before data ranged from several days to 2 years prior to the speed limit change.Collection of the after data ranged from several days to as much as 2 years followingthe speed limit change.
The examination of driver behavior data, collected at 98 experimental sections,included the speed distribution (percentile speeds), mean speeds, speed variance,percentage of drivers exceeding the posted speed limit, and close following behavior.Before and after speeds of free-flow vehicles (vehicles with a headway of 4 s or more)were collected for a 24-h period simultaneously at each experimental and comparisonsite pair.
The crash data collected included police-reported crashes, crashes involvinginjury or death, and multiple-vehicle and single-vehicle crashes. Before and after crashdata were collected at 99 experimental sections and their corresponding comparisonsections. For most sections, crash data were available for a 3-yr period before thespeed limit was changed and for a 2-yr after period. A total of 6,307 police-reportedcrashes were used in the analysis.
Analyses were conducted to examine before-and-after differences in driverbehavior at each site. The sites were divided into lowered posted speed limit andraised posted speed limit groups. The sites were further subdivided into groups basedon the amount of posted speed limit change. Group means and other statistics werecalculated for each of the speed variables collected.
Four evaluation methods were used to analyze the crash data. The methodsincluded multiple before and after analyses with paired comparison ratios, the classicalcross-product ratio, the new empirical Bayes method, and the before-and-after designusing a weighted average logit to produce an overall estimate of safety effects.
84
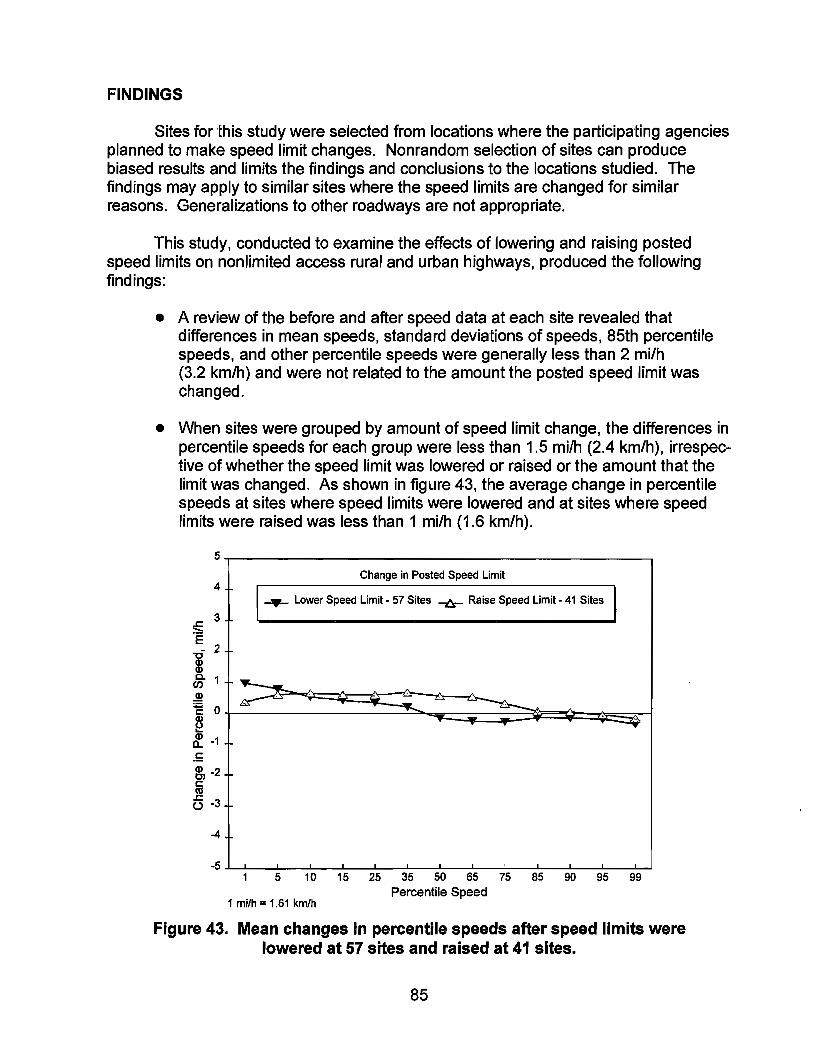
FINDINGS
Sites for this study were selected from locations where the participating agencies planned to make speed limit changes. Nonrandom selection of sites can produce biased results and limits the findings and conclusions to the locations studied. The findings may apply to similar sites where the speed limits are changed for similar reasons. Generalizations to other roadways are not appropriate.
This study, conducted to examine the effects of lowering and raising posted speed limits on nonlimited access rural and urban highways, produced the following findings:
• A review of the before and after speed data at each site revealed that differences in mean speeds, standard deviations of speeds, 85th percentile speeds, and other percentile speeds were generally less than 2 mi/h (3.2 km/h) and were not related to the amount the posted speed limit was changed.
• When sites were grouped by amount of speed limit change, the differences in percentile speeds for each group were less than 1.5 mi/h (2.4 km/h), irrespective of whether the speed limit was lowered or raised or the amount that the limit was changed. As shown in figure 43, the average change in percentile speeds at sites where speed limits were lowered and at sites where speed limits were raised was less than 1 mi/h (1.6 km/h).
5T---------------------------------------------------------------------------------~ Change in Posted Speed Limit
4 ~ ....... Lower Speed Limit - 57 Sites -t:r- Raise Speed Limit - 41 Sites I
-4
-5~~-L ____ ~~~~----~~~~----~~~~~~~~ 5 10 15 25 35 50 65 75 85 90 95 99
1 mi/h = 1.61 km/h Percentile Speed
Figure 43. Mean changes in percentile speeds after speed limits were lowered at 57 sites and raised at 41 sites.
85

l The small differences in before and after speeds, as shown in figure 43, werestatistically significant due primarily to the large sample size collected.
l At 34 locations, existing speed limits were posted within 5 mi/h (8 km/h) of the85th percentile speeds. When speed limits at these sites were lowered morethan 5 mi/h (8 km/h) below the 85th percentile speeds, the mean difference inpercentile speeds was less than 1 mi/h (1 .6 km/h).
- At 21 other locations, existing speed limits were posted more than 5 mi/h(8 km/h) below the 85th percentile speeds. When the agencies raised thelimits to within 5 mi/h (8 km/h) of the 85th percentile speeds at these sites,the mean difference in percentile speeds was less than 1 mi/h (I .6 km/h).
l By defining driver compliance as the number or percentage of drivers thattravel at or below the posted speed limit, major changes in complianceoccurred when speed limits were raised or lowered. However, as reflected insmall changes in vehicle speeds, driver behavior did not change, but thestandard for measuring compliance, i.e., posted speed limit, changed.
l Based on the free-flow speed data collected for a 24-h period at the experi-mental and comparison sites in 22 States, posted speed limits were set, onaverage, at the 45th percentile speed or below the average speed of traffic.
l Only minor changes in vehicles following at headways of less than 2 s werefound at the experimental sites with similar before and after traffic volumes.
l The indirect effects of speed limit changes on a sample of five contiguousand adjacent roadways were found to be small and insignificant.
- There is not sufficient evidence, in thi s dataset, to reject the hypothesis thattotal crashes or fatal and injury crashes changed when posted speed limitswere either lowered or raised.
l There is not sufficient evidence, in thi s dataset, to reject the hypothesis thattotal crashes changed when posted speed limits were lowered more than5 mi/h (8 km/h) below the 85th percentile speeds.
- There is not sufficient evidence, in thi s dataset, to reject the hypothesis thattotal crashes changed when posted speed limits were raised to within 5 mi/h(8 km/h) of the 85th percentile speeds.
l In April 1987, when Congress permitted States to raise speed limits to65 mi/h (105 km/h) on selected limited access highways, speed and crashdata were collected for a sample of four limited access Interstate segments.The findings concerning speed and crashes, which are different than thosefound on the nonlimited access roadway sites studied, are discussed inappendix G.
86
CONCLUSIONS
The general conclusions of this study are:
There is statistically sufficient evidence in thi s dataset to reject the hypothe-sis that driver speeds do not change when posted speed limits are eitherraised or lowered. However, the differences in speeds are not sufficientlylarge to be of practical significance, and are due primarily to large samplesizes.
Although the changes in vehicle speeds were small, driver violations of thespeed limits increased when posted speed limits were lowered. Conversely,violations decreased when speed limits were raised. This does not reflect achange in driver behavior, but a change in how compliance is measured, i.e.,from the posted speed limit.
The majority of motorists did not drive 5 to 10 mi/h (8 to 16 km/h) above theposted speed limit when speed limits were raised, nor did they reduce theirspeed by 5 to 10 mi/h (8 to 16 km/h) when speed limits were lowered.
Based on the sites selected for this study, it appears that highway agencieshave a tendency to set speed limits slightly below the average speed oftraffic.
Changing posted speed limits alone, without additional enforcement, educa-tional programs, or other engineering measures, has only a minor effect ondriver behavior.
There is not sufficient evidence in this dataset to reject the hypothesis thatcrash experience changed when posted speed limits were either lowered orraised.
87

SUGGESTIONS FOR FUTURE RESEARCH
Based on the results of this research, the following areas are suggested forfurther investigation:
There is an immediate need to examine the State policies and practices usedto set posted speed limits on nonlimited access facilities. In particular,attention should be given to identifying factors or a method that leads toestablishing uniform speed limits for similar roadway and traffic conditions.
The use of automated equipment and other alternative economical means ofcollecting unbiased speed data used to set speed limits should be exploredas an alternative to the conventional use of radar.
Actual prevailing speed data for a variety of roadwa y geometrics and highwaysystems should be summarized and provided to design engineers for use asa guideline when setting the design speed on a proposed roadway project.
The implications of setting speed limits based on samples obtained by usingan hourly or minimum vehicle requirement should be reexamined. Based onthe 2-h data collection increments from the current study, as well as recentresearch conducted in Michigan, wide variations in the 85th percentile speedsoccurred throughout the 24-h recordin g periods.[21] In addition, the hourlyvariations were not consistent from site to site. This suggests that speedsamples should be taken throughout the day to obtain a representativesample of the 85th percentile speed, as opposed to collecting a sample overa short time period such as 2 h.
88

00 <0
Table 27. Experimental site characteristics.
Experimental Before After Date Intersections Driveways
Site Length, No. Speed Speed New Limit Signalized No Signal Comm. Resid. Number Jurisdiction Route Area Miles Lanes Limit Limit Posted Per Mile
Speed Limit Lowered by 15 or 20 mi/h at Experimental Sites
NJ04E Burlington County Oxmead Road Rural 1.03 2 50 30 02128/89 0.00 3.88 0.00 11.65
TX03E City of Rockwall 1-30 N. Frontage Road Small Urban 0.80 2 55 35 05/01/87 0.00 7.50 11.25 0.00 VA06E Scott County 72 West of Rte. 65 Rural 8.42 2 55 35 10/27/86 Data Not Available ....................... _ ................................................................................................................................. " ............. _ ........... _ ........... _ .................... _ .................................................................................................... DE02E New Castle County 428 N. of Odessa Rural 2.11 2 50 35 11/06/86 0.00 2.84 2.84 18.96
NM01E Dona Ana County A-17 Rural 0.58 2 55 40 04/01/87 0.00 3.45 3.45 1.72
NM03E Valencia County Marquez Road Rural 1.04 2 55 40 03/01/87 0.00 5.77 0.00 19.23 NM04E Valencia County Romero Road Rural 1.39 2 55 40 03/01/87 0.00 5.76 0.72 26.62 OH02E Lawrence County 243 Rural 2.74 2 55 40 07113/86 0.00 2.92 5.11 21.53 OH13E Portage County 43 at Suffield Rural 1.00 2 55 40 06/30/87 2.00 7.00 19.00 35.00 TX05E Highland Village & Flower Mound FM 407 Rural 1.17 2 55 40 05/30/89 2.56 5.13 7.69 0.85
10 Sites 20.28
Speed Limit Lowered by 10 mi/h at Experimental Sites
CA01E City of Modesto Conant Avenue Urban 0.61 2 35 25 03/05/87 0.00 16.39 9.84 19.67 DE03E Sussex County 24 E. of Millsboro Rural 0.77 2 50 40 12/12/86 0.00 0.00 24.68 6.49 DE04E Kent County 166 near Kenton Rural 1.38 2 50 40 12/15/86 0.00 1.45 1.45 28.99
IL01E Lake County Butterfield Road Small Urban 0.89 2 50 40 01/19/88 2.25 13.48 4.49 0.00
IN01E Hancock County 109 at Warrington Rural 0.40 2 55 45 09/23/86 0.00 5.00 0.00 17.50
MA01E Town of Boxford Barehill Road Rural 1.00 2 40 30 10/31/86 0.00 2.00 0.00 18.00
ME02E City of Rockland West Meadow Road Small Urban 1.40 2 45 35 05/01/87 0.00 2.14 0.00 29.29 MI09E Jackson County 106 at Munith Rural 0.56 2 55 45 06/13/88 0.00 8.93 10.71 12.50
NE01E Cass County 50 at Louisville Rural 0.66 2 55 45 05/29/87 0.00 4.55 3.03 3.03
NJ02E City of Millville 667 Small Urban 0.56 2 45 35 02105187 0.00 7.14 5.36 35.71 NJ03E City of Millville 667 Small Urban 0.63 2 45 35 02/05/87 1.59 4.76 12.70 0.00
OH01E Fulton County 20 at Oakshade Rural 0.52 2 55 45 09/07/86 0.00 3.85 3.85 28.85
OH03E Delaware County 315 Rural 7.26 2 55 45 01/16/87 0.14 1.79 0.83 11.85
OH04E Athens County 33 at Shade Rural 0.47 2 55 45 11118186 0.00 4.26 8.51 19.15
OH05E Meigs County 7 at Tuppers Plains Rural 0.83 2 45 35 12110/86 0.00 6.02 18.07 66.27
OH06E Wayne County 604 at Canaan Rural 0.75 2 55 45 12122186 0.00 2.67 5.33 33.33
1 mi = 1.61 km 1 milh = 1.61 kmlh Note: All speed limits are shown in mi/h.
» "tJ "tJ m Z C
>< » . en =i m o :I: » ~ o -I m ~ en :::! o en

Table 27. Experimental site characteristics (continued).
ExperimentalSite
Number Jurisdiction Route
Speed Limit Lowered by 1 0 mi/h at Experimental Sites (continued)OH07E Butler County 129OH08E Madison County 38 at PlumwoodOH09E Mahoning County 45 at EllsworthOH10E Mahoning County 224 at ElisworthOH1 1 E Washington County 124OH1 2E Trumbull County 7 at BurghillOK01 E City of Muskogee 62 & 64 & 16OK02E City of Sallisaw 59OK03E City of Sallisaw 59OK04E City of Pryor 20TX02E City of Rockwall I-30 N. Frontage RoadTX04E City of McKinney FR 3038VA01 E Chesterfield County 144 S. of ChesterVA03E Powhatan County 677VA04E Powhatan County 678VA05E Powhatan County 610VA07E Smyth County 16 S. of MarionWV01 E Kanawha County 62 at Cross LanesWV03E Mingo County 49 at Matewan35 Sites
Speed Limit Lowered by 5 mi/h at Experimental SitesAZ01 E City of Phoenix Beardsley RoadCT02E Cheshire County 10 South of MilldaleCT05E Ellington County 83 South of EllingtonDE01 E Sussex County 357 near Ocean ViewID01 E Ada County 55 near EagleID02E Ada County 20
1 mi= 1.61 km1 mi/h = 1.61 kmlhNote: All speed limits are shown in mi/h.
Before After Date Intersections DrivewaysLength, No. Speed Speed New Limit Signalized No Signal Comm. Resid.
Area Miles Lanes Limit Limit Posted Per Mile
Urban 0.64 2 55 45 11/26/86 0.00 4.69 7.81 42.19Rural 0.74 2 55 45 0 2 / 1 0 / 8 7 0.00 10.81 8.11 20.27Rural 1.10 2 55 45 04 /29 /87 0.91 1.82 10.91 30.00Rural 0.70 2 55 45 05/12 /87 1.43 4.29 30.00 28.57Rural 0.73 2 50 40 03 /23 /87 0.00 8.22 20.55 15.07Rural 1.33 2 55 45 10/15/87 0.00 2.26 18.05 45.86
Small Urban 0.69 4 45 35 09 /15 /86 0.00 17.39 44.93 33.33Small Urban 0.74 2 35 25 09 /15 /86 1.35 18.92 58.11 6.76Small Urban 0.30 2 35 25 09/15 /86 3.33 23.33 20.00 10.00Small Urban 0.30 2 45 35 04 /06 /87 0.00 6.67 43.33 6.67Small Urban 1.75 2 55 45 05 /01 /87 0.00 6.29 10.29 0.00Small Urban 0.46 2 55 45 06/23 /87 0.00 13.04 17.39 0.00Small Urban 1.47 2 55 45 08 /25 /86 0.00 7.48 0.68 21.09
Rural 1.19 2 55 45 06 /16 /87 0.00 2.52 0.84 9.24Rural 1.63 2 55 45 10/28/86 0.00 3.68 1.23 28.83Rural 1.67 2 55 45 09 /09 /87 0.00 1.80 0.00 16.17Rural 2.25 2 55 45 10/17/87 0.00 2.22 11.11 32.44Rural 1.14 2 45 35 08 /04 /86 0.88 11.40 35.96 20.18Rural 1.96 2 45 35 09/15 /86 0.00 0.51 11.73 32.14
39.48
Urban 1.00 2 50 45 04/28 /87 1 .oo 5.00 3.00 1 .ooSmall Urban 1.01 2 45 40 10/23/86 3.96 6.93 4.95 20.79
Rural 1.09 2 45 40 03/26 /87 0.00 0.00 7.34 16.51Rural 0.80 2 40 35 11/04/86 0.00 5.00 2.50 18.75Rural 2.68 2 55 50 10/01/88 0.00 4.10 3.73 17.16Rural 3.50 2 55 50 10/01/88 0.29 3.43 5.43 12.57

co
Table 27. Experimental site characteristics (continued).
ExperimentalSite
Number Jurisdiction Route
Speed Limit Lowered by 5 mi/h at Experimental Sites (continued)IL02E Lake County 45IN05E Spencer County 245 at Santa ClausIN06E Scott County 31 at N. ScottsburgIN07E Scott County 31 at S. ScottsburgMA03E Town of Boxford Barehill RoadME01 E City of Rockland West Meadow RoadNJ01 E Mercer County Klockner RoadNM02E Dona Ana County A-17
14 Sites
Speed Limit Raised by 5 mi/h at Experimental SitesAZ02R City of Phoenix Grovers AvenueAZ03E City of Phoenix 29th AvenueCA06E City of Mission Viejo Trabuco RoadCA07E City of Mission Viejo Marguerite ParkwayCO01E Jefferson County 72CO03E Boulder & Gilpin Cos. 72CT01E Windsor & S. Windsor 291CT04E Sharon County 41 South of SharonD E0 5 E Kent County 105 near Star HillIN02E City of Lafayette 3rd Street (Rt. 231)IN03E City of Lafayette 4th Street (Rt. 231)MD01 E Carroll County 194MD02E Carroll County 27MD03E Carroll County 75MD04E Frederick County 75MD05E Frederick & Carroll Cos. 26M D 0 6 E Frederick County 194 at New MidwayMD07E Carroll County 194 at Keymar
1 mi= 1.61 km1 mi/h = 1.61 kmlhNote: All speed limits are shown in milh.
Before After Date Intersections DrivewaysLength, No. Speed Speed New Limit Signalized N O Signal Comm. Resid.
Area Miles Lanes Limit Limit Posted Per Mile
Small Urban 1.04 2 50 45 10/08/86 0.96 5.77 9.62 26.92Rural 0.80 2 45 40 1 2 / 0 4 / 8 6 0.00 6.25 7.50 10.00
Small Urban 1.02 2 50 45 12/29/86 0.00 3.92 20.59 5.88Small Urban 1.12 2 50 45 1 2 / 2 9 / 8 6 0.00 7.14 18.75 33.04
Rural 0.68 2 30 25 1 0 / 3 1 / 8 6 0.00 2.94 0.00 32.35Small Urban 1.30 2 45 40 05/01 /87 0.00 0.00 4.62 29.23
Urban 0.88 2 40 35 02/09/87 2.27 9.09 3.41 51.14Rural 2.97 2 55 50 04/01/87 0.00 0.34 1.35 3.37
19.89
Urban 1.00 2 25 30 07/22/87 0.00 15.00 4.00 73.00Urban 1.00 2 30 35 04/04/88 2.00 10.00 10.00 30.00Urban 0.89 4 45 50 04/30 /87 2.25 7.87 4.49 0.00Urban 2.73 4 45 50 05/07 /87 1.47 6.96 1.47 0.00Rural 1.05 2 30 35 1 1 / 0 4 / 8 7 0.00 0.95 0.95 3.81Rural 4.23 2 40 45 11/04/87 0.00 0.95 0.71 3.78Urban 1.77 4 45 50 1 2 / 1 1 / 8 6 0.00 0.00 0.00 0.00Rural 0.47 2 30 35 10/24/86 0.00 4.26 4.26 29.79Rural 1.87 2 35 40 12/16/86 0.00 4.28 5.35 20.86Urban 0.38 2 25 30 10/06/86 7.89 36.84 63.16 0.00Urban 0.38 2 25 30 10/06/86 7.89 36.84 34.21 0.00Rural 4.72 2 50 55 09/23 /86 0.00 1.69 1.27 11.23Rural 7.33 2 50 55 11/19/86 0.00 3.68 0.68 5.32Rural 4.00 2 50 55 1 1 / 2 8 / 8 6 0.00 3.00 0.50 3.25Rural 5.83 2 50 55 1 1 / 1 7 / 8 6 0.00 2.23 0.17 8.06Rural 12.60 2 50 55 10/02/86 0.00 2.78 1.19 7.46Rural 0.80 2 30 35 1 0 / 2 2 / 8 6 0.00 5.00 10.00 27.50Rural 0.63 2 30 35 09/30/86 0.00 3.17 20.63 42.86

Table 27. Experimental site characteristics (continued).
IxperimentalSite
Before After Date Intersections DrivewaysLength, No. Speed Speed New Limit Signalized No Signal Comm. Resid .
Number Jurisdiction Route Area Miles Lanes Limit Limit Posted Per Mile
Speed Limit Raised by 5 mi/h at Experimental Sites (continued)
M D 0 8 E Frederick County 26 at Mt. PleasantM D 0 9 E Frederick County 550 at ThurmontMD10E Howard County 32M S 0 2 E City of Brandon 18TN01 E Shelby County Route 204T X 0 6 E City of Justin FR 407TX07E City of Paris L 469TX08E City of Paris L 46926 Sites
Speed Limit Raised by 10 or 15 mi/h at Experimental Sites
Rural 0.95 2 30 35 02/25/87 0.00 5.26 16.84 47.37Rural 0.57 2 30 35 01 /09 /87 0.00 17.54 5.26 31.58Rural 12.49 2 50 55 10/24/87 0.00 2.64 0.08 5.04
Small Urban 0.68 2 30 35 02 /18 /87 0.00 8.82 1.47 30.88Rural 6.16 4 50 55 10/30/86 0.00 1.46 0.49 2.11Rural 0.54 2 30 35 06/01/87 0.00 27.78 11.11 50.00
Small Urban 0.67 2 40 45 08 /20 /87 0.00 28.36 11.94 65.67Small Urban 0.86 2 30 35 08 /20 /87 1.16 19.77 54.65 53.49
74.60
CO02E Jefferson & Boulder Cos. 72 Rural 3.91 2 30 40 11 / 0 4 / 8 7 0.00 2.05 7.16 9.72CT03E Sharon County 41 South of Sharon Rural 0.65 2 30 40 10/24/86 0.00 6.15 0.00 18.46lD03E City of American Falls Fort Hall Avenue Rural 1.79 2 20 30 06 /01 /88 0.00 12.85 15.64 12.85ID04E City of American Falls Falls Avenue Rural 0.82 2 20 30 0 6 / 0 1 /88 0.00 37.80 4.88 46.34ID05E City of American Falls Bennett Avenue Rural 0.49 2 20 30 06/01/88 0.00 40.82 4.08 46.94ID06E City of Pocatello 4th Avenue Urban 0.94 2 25 35 09 /22 /88 3.19 27.66 32.98 27.66ID07E City of Pocatello 5th Avenue Urban 0.96 2 25 35 09/22/88 3.13 27.08 46.88 3.13ID08E City of Pocatello South 2nd Avenue Urban 1.11 2 35 45 09 /16 /88 0.00 0.00 4.50 1.80M A 0 2 E Town of Boxford Pond Street Rural 0.40 2 30 40 10/31/86 0.00 5.00 0.00 22.50ME03E Town of Raymond 121 Rural 1.80 2 35 45 05 /26 /87 0.00 4.44 2.78 29.44MS01 E City of Brandon 18 Small Urban 0.43 2 35 45 02/18/87 0.00 6.98 0.00 44.19VA02E Chesterfield County 651 Small Urban 1.60 2 35 45 10 / 1 4 / 8 7 0.63 3.75 4.38 21.88CA04E City of Irvine Campus Drive Urban 1.74 4 30 45 03/12/87 2.30 9.20 2.87 0.00IN04E Lawrence County 58 E. of Heltonville Rural 0.62 2 30 45 11 /20/86 0.00 3.23 1.61 22.58TX01 E City of Anna FM 455 Rural 0.50 2 40 55 10/17 /86 0.00 0.00 0.00 32.0015 Sites 17.76
Total 100 Sites 172 01 Miles
1 mi= 1.61 km1 mi/h = 1.61 kmlhNote: All speed limits are shown in milh.

Table 28. Comparison site characteristics.
ComparisonSite
Number Jurisdiction Route
Speed Limit Lowered by 15 or 2 0 mi/h at Experimental Sites
AreaLength, No.Miles Lanes
Posted Intersections DrivewaysSpeed Signalized No Signal Comm. Resid.Limit Per Mile
NJ04C Burlington County Oxmead Road Rural 1.66 2 50 0.00 3.61 0.00 9.04TX03C Rockwall County I-30 N. Frontage Road Small Urban 2.39 2 55 0.00 2.93 4.18 0.00V A 0 6 C Scott County 65 Rural 2.85 2 55 0.00 0.70 1.40 11.23DE02C New Castle County 4291428 Rural 2.62 2 50 0.00 1.91 1.53 3.44NM01C Dona Ana County 273 Rural 3.31 2 55 0.00 2.72 1.81 3.93NM03C Valencia County 263 Rural 1.70 2 40 0.00 5.29 4.71 41.76NM04C Valencia County 263 Rural 1.70 2 40 0.00 5.29 4.71 41.76OH02C Lawrence County 243 Rural 3.00 2 55 0.00 1.33 2.00 14.00OH13C Portage County 43 Rural 1 .00 2 55 0.00 8.00 9.00 51 .ooTX05C Denton County FM 407 Rural 1.17 2 55 0.00 4.27 0.00 5.98
Speed Limit Lowered by 10 mi/h at Experimental Sites
CA01C City of ModestoDE03C Sussex CountyDE04C Sussex CountyIL01C McHenry CountyIN01C Hancock CountyMA01C Town of BoxfordME01 C Town of WaldoboroMl09C Jackson CountyNE01C Cass CountyNJ02C Cumberland CountyNJ03C Cumberland CountyOH01C Fulton CountyOH03C Delaware CountyOH04C Athens CountyO H 0 5 C Meigs CountyO H 0 6 C Wayne County
West Rumble Road24 near Mission24 near Mission176109 N. of WarringtonDepot RoadOld Route 11061553 near Gouldtown553 near Gouldtown20257 (Riverside Dr.)33 at Pratts Fork7604 at West Canaan
Urban 0.48 2 30 0.00 20.83 10.42 37.50Rural 1.58 2 50 0.00 3.16 1.90 10.76Rural 1.58 2 50 0.00 3.16 1.90 10.76Rural 1.15 2 45 0.87 10.43 3.48 11.30Rural 0.45 2 55 0.00 4.44 0.00 13.33Rural 0.99 2 30 0.00 6.06 0.00 33.33Rural 2.15 2 45 0.00 0.00 0.00 19.53Rural 0.82 2 55 0.00 7.32 3.66 9.76Rural 0.62 2 55 0.00 3.23 0.00 8.06Rural 0.78 2 50 0.00 7.69 2.56 39.74Rural 0.78 2 50 0.00 7.69 2.56 39.74Rural 0.59 2 55 0.00 3.39 1.69 5.08Rural 6.37 2 55 0.00 1.88 0.47 18.84Rural 0.37 2 55 0.00 0.00 0.00 32.43Rural 1.12 2 55 0.00 2.68 1.79 11.61Rural 0.96 2 55 0.00 4.17 0.00 10.42
1 mi= 1.61 km1 mi/h = 1.61 kmlhNote: All speed limits are shown i n mi/h

Table 28. Comparison site characteristics (continued).
Comparison Posted Intersections DrivewaysSite Length, No. Speed Signalized No Signal Comm. Resid.
Number Jurisdiction Route Area Miles Lanes Limit Per Mile
Speed Limit Lowered by 10 mi/h at Experimental Sites (continued)OH07C Butler County 129 Urban 0.74 2 55 0.00 6.76 8.11 41.89OH08C Madison County 38 Rural 1.16 2 55 0.00 3.45 0.00 9.48OH09C Mahoning County 45 near N. Jackson Rural 1.04 2 55 0.00 2.88 0.00OH10C
15.38Mahoning County 45 near N. Jackson Rural 1.04 2 55 0.00 2.88 0.00 15.38
OH11C Washington County 555 Rural 0.83 2 50 0.00 8.43 4.82 33.73OH12C Trumbull County 88 Rural 1.58 2 55 0.00 2.53 6.96 11.39OK01C City of Muskogee 62 & 64 & 16 Small Urban 0.76 4 45 0.00 3.95 11.84 32.89OK04C City of Pryor 20 Small Urban 0.50 2 35 2.00 30.00 80.00 10.00TX02C Rockwall County l-30 N. Frontage Road Small Urban 2.39 2 55 0.00 2.93 4.18 0.00TX04C City of McKinney FR 3038 Small Urban 0.55 2 55 0.00 1.82 0.00 3.64VA01C Chesterfield County 144 Small Urban 1.55 2 55 0.65 7.74 6.45 25.16VA03C Powhatan County 628 Rural 1.72 2 55 0.00 2.33 1.74 20.93VA04C Powhatan County 628 Rural 1.72 2 55 0.00 2.33 1.74 20.93VA05C Powhatan County 628 Rural 1.72 2 55 0.00 2.33 1.74 20.93VA07C Smyth County 16 Rural 2.04 2 55 0.00 1.47 3.43WV03C
16.18Mingo County 49 Rural 2.55 2 45 0.00 0.39 7.06 15.69
Ppeed Limit Lowered by 5 mi/h at Experimental Sites
AZ01C Phoenix & Maricopa Co. 32nd Street Urban 0.87 2 45 0.00 6.90 5.75 0.00CT02C Cheshire County 70 North of Cheshire Rural 2.24 2 45 0.45 5.36 4.91CT05C
21.43Stafford County 30 S. of W. Stafford Rural 1.67 2 45 0.00 2.99 0.00 8.38
DE01C Sussex County 357 near Ocean View Rural 0.22 2 40 0.00 22.73 4.55ID01C
13.64Ada County 55 N. of Rte. 44 Rural 2.75 2 55 0.00 1.82 0.73 6.91
ID02C Ada County . 55 N. of Rte. 44 Rural 2.75 2 55 0.00 1.82 0.73 6.91ILO2C McHenry County 176 Rural 1.15 2 45 0.87 10.43 3.48 11.30IN05C Spencer County 245 N. of Santa Claus Rural 1.02 2 45 0.00 2.94 2.94 10.78IN06C Scott County 56 at W. Scottsburg Small Urban 0.72 2 50 0.00 4.17 2.78 11.11IN07C Scott County 56 at W. Scottsburg Small Urban 0.72 2 50 0.00 4.17 2.78 11.11
1 mi= 1.61 km1 mi/h = 1.61 km/hNote: All speed limits are shown in milh.

Table 28. Comparison site characteristics (continued).
ComparisonSite
Number Jurisdiction Route
Speed Limit Lowered by 5 mi/h at Experimental Sites (continued)
AreaLength, No.Miles Lanes
Posted Intersections DrivewaysSpeed Signalized No Signal Comm. Resid.Limit Per Mile
MA03C T o w n o f Boxford Depot Road Rural 0.99 2 30 0.00 6.06 0.00 33.33ME01C Town of Waldoboro Old Route 1 Rural 2.15 2 45 0.00 0.00 0.00 19.53NJ01C Mercer County Crosswicks-Ham. Sq . Rd. Urban 0.96 2 40 0.00 5.21 2.08 38.54NM02C Dona Ana County 273 Rural 3.31 2 55 0.00 2.72 1.81 3.93
Speed Limit Raised by 5 mi/h at Experimental Sites
AZ02C City of PhoenixAZ03C City of PhoenixC A 0 6 C City of Mission ViejoCA07C City of Mission ViejoCO01C Boulder & Gilpin Cos.CO03C Boulder & Gilpin Cos.CT01C East HartfordDE05C Kent CountyIN02C City of LafayetteIN03C City of LafayetteMD01C Carroll CountyMD02C Carroll CountyMD03C Carroll CountyMD04C Frederick & Carroll Cos.MD05C Carroll CountyM D 0 6 C Frederick CountyMD07C Frederick CountyMD08C Frederick CountyMD09C Frederick CountyMD10C Carroll CountyMS02C City of Brandon
Grovers Avenue Urban 0.97 2 30 1.03 15.46 7.22 21.65Holmes Blvd. & 27th Ave. Urban 1.11 2 30 0.90 11.71 10.81 0.00Trabuco Road Urban 1.01 4 45 2.97 10.89 2.97 0.00Trabuco Road Urban 1.01 4 45 2.97 10.89 2.97 0.0072 Rural 3.98 2 30 0.00 0.50 0.00 7.0472 Rural 3.98 2 30 0.00 0.50 0.00 7.045 Urban 1.41 4 45 1.42 9.22 21.99 26.24105 Rural 0.51 2 35 0.00 5.88 5.88 54.90Union Street Urban 0.46 2 25 2.17 21.74 2.17 17.39Union Street Urban 0.46 2 25 2.17 21.74 2.17 17.39194 Rural 4.43 2 50 0.00 1.35 0.00 10.38496 Rural 7.23 2 50 0.00 1.94 1.24 11.8927 Rural 3.73 2 50 0.00 2.95 0.80 17.1675 Rural 3.63 2 50 0.00 1.93 3.31 8.2627 Rural 7.28 2 50 0.00 2.75 0.41 21.02Frederick Street Rural 1.07 2 30 0.00 11.21 23.36 37.38Frederick Street Rural 1.07 2 30 0.00 11.21 23.36 37.38Frederick Street Rural 1.07 2 30 0.00 11.21 23.36 37.38550 at Creagerstown Rural 0.66 2 30 0.00 7.58 4.55 39.3932 Rural 1.58 2 50 0.00 1.27 0.00 6.33468 Small Urban 0.81 2 30 1.23 9.88 14.81 33.33
1 mi = 1.61 km1 mi/h = 1.61 km/hNote: All speed limits are shown in mi/h.

Table 28. Comparison site characteristics (continued).
ComparisonSite
Number Jurisdiction Route A r e aLength, No.
Miles Lanes
Posted Intersections DrivewaysSpeed Signal ized No Signal Comm. Resid.Limit Per Mile
Speed Limit Raised by 5 mi/h at Experimental Sites (continued)
TN01C Shelby County 3 8 5 Rural 2 . 9 5 4 5 5 0 . 0 0 2.71 0.00 0.00T X 0 6 C City of Justin FR 407 Rural 0.26 2 3 0 0.00 2 6 . 9 2 26.92 26.92TX07C City of Paris FM 79 Small Urban 0 . 6 0 2 3 5 1.67 2 1 . 6 7 23.33 4 1 . 6 7TX06C City of Paris FM 79 Small Urban 0.60 2 3 5 1.67 2 1 . 6 7 23.33 4 1 . 6 7
Speed Limit Raised by 10 or 15 mi/h at Experimental Sites
CO02C Boulder & Gilpin Cos. 7 2 Rural 3.98 2IDO3C City of American Falls Polk Street Rural 0.63 2ID04C City of American Falls Polk Street Rural 0.63 2ID05C City of American Falls Polk Street Rural 0 . 6 3 2ID06C City of Pocatello Arthur Avenue Urban 0.95 2ID07C City of Pocatello Arthur Avenue Urban 0.95 2ID08C City of Pocatello South Grant Ave. Urban 1.30 2MA02C Town of Boxford Depot Road Rural 0 . 9 9 2ME03C Oxford County 121 at Otisfield Rural 0.61 2MS01C City of Brandon 8 0 Small Urban 0 . 3 5 2VA02C Chesterfield County 6 4 3 Small Urban 1.83 2 3 5 0.55 4 . 9 2 1.64 44.81
CA04C City of Irvine Harvard Avenue Urban 1 .04 4 3 0 2 . 8 8 8 . 6 5 0.00 1.92IN04C Lawrence County 58 at Heltonville Rural 0 . 6 3 2 3 0 0 . 0 0 7 . 9 4 3.17 31.75
3 02 02 02 02 52 53 53 03 53 5
0.000.000.000.004.214.210 . 0 00 . 0 00 . 0 00 . 0 0
0.5050.7950.7950.7929.4729.47
3 . 8 56 . 0 63.28
11.43
0.003.173.173.17
32.6332.63
2.310 . 0 0
13.110.00
7.0457.1457.1457.1417.8917.8919.2333.3331.1525.71
TX01C City of Anna FM 455 Rural 0.45 2 4 0 0 . 0 0 13.33 0.00 33.33
1 mi= 1.61 km1 mi/h = 1.61 km/hNote: All speed limits are shown in mi/h.

Table 29. Before speed data for the experimental sites.
Before Experimental Data Std. Free- Pct. 10-mi/h Pace
Site Before After Diff. Date Limit Collection Mean Dev. Before Flow Free Percentile Speeds Lower Upper Pct. Skew. Number Limit Limit Limit Posted Date Speed Speeds Volume Volume Flow 1 5 10 15 25 35 50 65 75 85 90 95 99 Limit Limit Pace Index
Speed Limit Lowered by 15 or 20 mi/h at Experimental Sites
NJ04E 50 30 -20 02/28/89 01/17/87 37.7 6.6 408 394 96.6 18 27 29 32 34 36 38 41 43 44 46 48 55 35 44 59.6 0.95 TX03E 55 35 -20 05/01/87 03/02/87 36.2 5.0 1,173 1,081 92.2 21 28 31 32 34 35 37 39 40 41 43 44 48 32 41 73.8 1.00
•••••••••••••••• _ ................................................................................................. D ••••••••••••••••••••••••••••••••••••••••• D ................. _ •••• _ •••• _ ...... _ ....... _ ...... _ ..... _ •••• _ ..... _ ...... _ ..... _ ..... _ •••• _ ....................................................
DE02E 50 35 -15 11/06/86 09/29/86 45.7 6.8 468 449 95.9 28 35 38 39 41 43 46 49 51 53 55 57 62 42 51 53.7 1.00 NM01E 55 40 -15 04/01/87 02/23/87 44.5 9.5 571 551 96.5 24 28 31 33 38 42 46 50 52 55 57 58 64 46 55 42.8 0.79 NM03E 55 40 -15 03/01/87 02/26/87 42.0 7.6 473 444 93.9 25 30 33 35 37 39 42 46 48 50 52 55 61 39 48 48.4 1.05 NM04E 55 40 -15 03/01/87 02/26/87 40.4 7.5 620 560 90.3 23 28 32 34 36 38 41 44 46 48 50 53 61 37 46 53.6 1.00 OH02E 55 40 -15 07113/86 06128/86 42.6 6.3 1,453 1,354 93.2 27 33 36 37 39 41 43 45 47 49 51 53 59 38 47 61.4 1.00 OH13E 55 40 -15 06/30/87 03/28/87 41.9 5.7 4,201 3,197 76.1 25 34 36 37 39 41 42 44 46 48 49 51 56 38 47 67.6 1.07 TX05E 55 40 -15 05/30/89 03/08/87 47.9 5.5 10,752 6,852 63.7 33 39 42 43 45 47 48 50 52 54 55 57 61 44 53 68.1 1.07
Speed Limit Lowered by 10 mi/h at Experimental Sites
CA01E 35 25 -10 03/05/87 02/09/87 34.3 6.9 2,552 2,388 93.6 18 22 26 28 31 32 35 37 39 42 44 46 51 30 39 55.3 0.95 DE03E 50 40 -10 12/12/86 11112186 45.0 6.9 8,986 6,198 69.0 26 33 37 39 42 43 46 48 50 52 54 56 60 41 50 57.9 0.90 DE04E 50 40 -10 12/15/86 11/12/86 48.7 7.9 393 384 97.7 27 35 39 42 45 46 49 52 55 57 59 61 66 45 54 51.3 0.96 IL01E 50 40 -10 01/19/88 09/13/86 43.6 5.1 8,457 6,321 74.7 32 36 38 39 41 42 44 46 47 49 50 52 56 40 49 70.5 1.00 IN01E 55 45 -10 09/23/86 09/07/86 46.9 5.8 2,279 2,151 94.4 33 37 40 41 44 45 48 50 51 53 54 56 61 43 52 63.2 0.82 MA01E 40 30 -10 11/01/86 10/29/86 41.9 5.8 303 297 98.0 27 32 35 37 39 40 43 45 46 48 49 52 54 38 47 63.3 0.89 ME02E 45 35 -10 05/01187 10/15/86 33.0 7.2 375 364 97.1 18 21 23 26 29 31 34 36 38 41 42 46 51 31 40 53.3 0.91 MI09E 55 45 -10 06/13/88 10/12187 49.7 8.8 2,544 2,340 92.0 25 33 38 41 45 48 51 54 57 58 60 62 68 49 58 48.5 0.80 NE01E 55 45 -10 05/29/87 04/20/87 44.2 7.5 3,847 3,190 82.9 25 31 35 37 40 43 46 48 50 52 54 55 59 43 52 51.1 0.82 NJ02E 45 35 -10 02/05/87 12/15/86 37.7 8.0 7,295 5,669 77.7 19 24 28 30 33 35 38 41 44 46 48 51 56 34 43 46.1 1.00 NJ03E 45 35 -10 02/05/87 12/18/86 41.0 6.8 7,594 5,972 78.6 23 29 33 35 38 40 42 44 46 48 50 52 57 38 47 59.2 0.90 OH01E 55 45 -10 09/07/86 06/25/86 53.0 7.0 3,948 3,380 85.6 34 42 45 47 50 51 54 56 58 60 62 64 70 50 59 57.9 0.90 OH03E 55 45 -10 01116187 06/30/86 48.2 6.3 3,835 3,020 78.7 32 38 41 43 45 47 49 51 53 55 57 59 62 45 54 59.2 0.95 OH04E 55 45 -10 11/18/86 10/17/86 45.8 7.6 3,464 2,572 74.2 25 33 37 39 42 44 47 49 51 54 55 58 63 43 52 52.4 0.91 OH05E 45 35 -10 12/10/86 10/19/86 38.7 7.6 3,909 3,452 88.3 14 25 31 33 35 37 40 42 44 46 47 50 55 36 45 57.0 0.86 OH06E 55 45 -10 12/22/86 10/26/86 44.1 9.0 1,113 1,074 96.5 21 29 32 35 39 42 46 49 51 53 55 58 63 44 53 44.6 0.81 OH07E 55 45 -10 11/26/86 10/29/86 43.3 6.4 7,695 5,877 76.4 26 32 36 38 40 42 44 46 48 50 51 54 58 39 48 62.5 0.95 OH08E 55 45 -10 02/10/87 11/23/86 39.1 7.5 596 575 96.5 20 25 29 32 35 37 40 43 45 47 48 50 54 36 45 51.0 0.86
1 milh = 1.61 km/h Note: All speed limits and vehicle speeds are shown in mi/h.
» ." ." m Z C >< m . < m ::::c -o rm en ." m m c
~ >

Table 29. Before speed data for the experimental sites (continued).
BeforeExperimental Data Std. Free- Pct.
Site Before After Di f f . Date Limit Col lect ion Mean Dev. Before Flow FreeN u m b e r L i m i t L i m i t L i m i t P o s t e d Date S p e e d S p e e d s V o l u m e V o l u m e F l o w
Speed Limit Lowered by 10 milh at Experimental Sites (continued)
10-mi/h PacePercentile Speeds L o w e r U p p e r Pct. S k e w .
1 5 10 15 25 35 50 65 75 85 90 95 99 Limit Limit P a c e I n d e x
OH09E 55OH10E 55OH11E 50OH12E 55OK01 E 45OK02E 35OK03E 35OK04E 45TXO2E 55TXO4E 55VA01 E 55VA03E 55VA04E 55VA05E 55VA07E 55WV03E 45
45 -10 04/29/87 01/16/8745 -10 05/12/87 01/16/8740 -10 03123187 0112618745 -10 I 0/15/87 03/26/8735 -10 09/15/86 08/21/8625 -10 09/15/86 08/26/8625 -10 09/15/86 08/26/8635 -10 04/06/87 03/16/8745 -10 05/01/87 03/02/8745 - 1 0 06/23/87 03 /05 /8745 -10 08/25/86 07 /1 1/8645 -10 06/16/87 07/28/8645 -10 1 0 / 2 8 / 8 6 07/30/8645 -10 09/09/87 07/30/8645 -10 1 0 / 1 7 / 8 7 08/27/8635 -10 09/15/86 08/29/86
42.7 6.8 3,261 2,916 89.4 20 32 35 37 40 41 4 3 4 6 4 7 4 9 51 5 3 5 8 4 0 4 9 60.8 1 .oo46.7 6.3 4,152 3,306 79.6 30 36 40 41 43 45 47 50 51 53 54 57 62 43 52 63.3 1 .oo35.5 12.6 1,350 1,292 95.7 1 0 15 17 1 9 2 4 33 3 9 4 3 4 6 4 8 5 0 5 3 5 8 3 8 4 7 37.5 0.7245.6 7.3 2,608 2,295 88.0 22 34 37 39 42 44 47 49 51 53 55 57 61 43 52 54.9 0.8636.4 6.3 9,691 8,825 91.1 18 2 6 2 9 31 3 3 3 5 3 7 4 0 41 4 3 4 4 4 6 5 0 3 4 4 3 61.1 0.8929.5 4.8 11,472 8,288 72.2 15 22 25 26 27 29 30 32 33 34 36 37 41 26 35 75.7 0.9239.3 6.0 6,283 5,125 81.6 24 29 32 34 36 38 40 42 43 46 47 49 54 35 44 63.0 0.9442.7 5.7 5,625 4,337 77.1 27 34 36 38 40 41 43 46 47 49 50 52 56 39 48 65.5 1 .oo4 8 . 4 6.5 2,233 2,054 92.0 32 38 41 43 45 47 49 51 53 55 57 59 64 45 54 60.2 1 .oo40.4 7.2 2,991 2,619 87.6 24 30 32 34 36 38 40 43 46 48 50 53 61 35 44 52.5 1.1047.4 7.2 8,425 6,410 76.1 29 34 38 41 44 46 49 51 53 55 56 58 63 45 54 57.0 0.7344.0 6.4 1,303 1,238 95.0 28 33 36 38 41 42 45 47 49 51 53 55 60 40 49 59.8 0.9040.2 6.9 533 514 96.4 23 28 32 34 36 38 41 43 45 47 49 52 57 36 45 57.6 0.9544.8 8.5 927 869 93.7 23 28 35 38 40 42 46 49 51 54 56 58 62 40 49 45.8 0.8844.4 7.0 4,551 3,674 80.7 24 33 36 38 41 43 45 48 50 52 53 55 60 41 50 57.2 0.9044.0 7.1 2,170 1,914 88.2 28 32 35 37 40 42 45 47 49 52 53 56 61 41 50 53.1 0.91
Speed Limit Lowered by 5 mi /h at Experimental Sites
AZ01E 5 0 4 5 -5 04/28/87 03/27/87 4 4 . 8 5.5 7,830 5,438 69.5 31 37 39 40 42 43 45 47 49 51 52 54 60 41 50 67.7 1.07CT02E 4 5 4 0 -5 1 0 / 2 3 / 8 6 1 0 / 0 8 / 8 6 39.9 5.7 13,646 7,608 55.8 25 31 33 35 37 3 9 41 4 3 4 4 4 6 4 7 4 9 5 3 3 6 4 5 65.3 0.88CT05E 4 5 4 0 -5 03/26/87 10/25/86 44.4 5.4 9,658 6,305 65.3 30 36 38 40 42 43 45 47 48 50 51 53 59 41 50 69.3 0.92DE01E 4 0 3 5 -5 11/04/86 09/26/86 45.3 a . 4 986 946 95.9 27 33 35 37 40 42 46 48 51 54 57 62 67 40 49 48.8 1.04ID01E 5 5 5 0 -5 10/10/88 04/12/87 49.6 6.9 4,357 3,705 85.0 31 38 41 43 46 48 50 53 55 57 58 61 65 46 55 58.7 1 .ocID02E 5 5 5 0 -5 10/01/88 04/12/87 50.3 5.8 8,064 5,816 72.1 34 41 44 45 48 49 51 53 54 56 58 60 64 46 55 66.5 0.88
IL02E 5 0 4 5 -5 10/08/86 09113/86 4 4 . 8 5.2 9,481 6,761 71.3 31 37 39 40 42 44 46 47 48 50 51 53 57 41 50 71.1 0.86IN05E 4 5 4 0 -5 12/04/86 11/12/86 41.7 7.1 1,455 1,381 94.9 25 30 33 35 37 39 42 45 47 50 51 53 57 37 46 50.3 0.95IN06E 5 0 4 5 -5 12/29/86 12/17/86 45.4 7.2 8,528 6,259 73.4 24 32 37 39 43 44 47 49 50 53 54 56 60 43 52 60.0 0.76IN07E 5 0 4 5 -5 12/29/86 12/17/86 44.1 7.4 5,743 4,750 82.7 20 29 35 38 41 4 3 4 6 4 8 4 9 51 5 2 5 5 5 8 4 2 51 61.7 0.73
1 mi/h = 1.61 km/hNote: All speed limits and vehicle speeds are shown in mi/h.

Table 29. Before speed data for the experimental sites (continued).
BeforeExperimental Data Std. Free- Pct. 10-mi/h Pace
Site Before After Di f f . Date Limit Col lect ion Mean Dev. B e f o r e F l o w Free Percentile Speeds L o w e r U p p e r Pct. S k e w .Number Limit Limit Limit Posted Date Speed Speeds Volume Volume Flow 1 5 1 0 15 2 5 3 5 5 0 6 5 7 5 8 5 9 0 9 5 9 9 Limit Limit Pace Index
Speed Limit Lowered by 5 milh at Experimental Sites (continued)
MA03E 3 0 2 5 -5 11/01/86 10/31/86 33.9 6.1 371 361 97.3 19 2 4 2 6 2 8 31 3 2 3 4 3 7 3 9 41 4 2 4 4 4 7 31 4 0 60.1 0.95ME01E 4 5 4 0 -5 05/01/87 10/15/86 36.1 7 . 0 306 303 99.0 21 2 4 2 7 2 9 3 2 3 4 3 6 3 9 41 4 4 4 6 4 9 5 3 3 3 4 2 53.5 1.09NJ01E 4 0 3 5 -5 02/09/87 11/18/86 38.3 5 . 7 12,669 7,744 61.1 2 3 3 0 3 2 3 4 3 6 3 7 3 9 41 4 2 4 4 4 5 4 8 5 3 3 4 4 3 68.9 1 .ooNM02E 5 5 5 0 - 5 04/01/87 02/23/87 53.8 8.8 4 8 4 466 96.3 3 3 3 8 4 3 4 6 4 9 5 2 5 5 5 7 6 0 6 3 6 5 6 9 7 4 5 0 5 9 4 7 . 0 0.92
Speed Limit Raised by 5 mi/h at Experimental Sites
AZ02E 25 30 5 07/22/87 03/30/87 31.8 5.6 1,296 1,252 96.6 2 0 2 4 2 5 2 7 2 6 3 0 3 2 3 4 3 6 3 8 4 0 4 2 4 6 2 7 3 6 62.5 1.00AZ03E 3 0 3 5 5 04/04/88 04/01/87 32.6 5 . 4 4 , 0 0 5 3,521 87.9 21 2 5 2 7 2 8 3 0 31 3 3 3 5 3 6 3 9 4 0 4 2 4 7 2 8 3 7 67.0 1.07CA06E 45 50 5 04/30/87 03/13/87 4 8 . 9 6 . 4 12,917 10,201 79.0 3 4 3 9 41 4 3 4 5 4 7 4 9 5 2 5 3 5 6 5 8 6 0 6 5 4 5 5 4 58.1 1.05CA07E 4 5 5 0 5 05/07/87 03/22/87 53.1 5 . 9 14,132 9,789 69.3 4 0 4 4 4 6 4 8 5 0 51 5 4 5 6 5 7 6 0 61 6 3 . 6 9 4 9 5 8 62.0 0.94CO01E 3 0 3 5 5 11/04/87 04/04/87 38.9 4 . 8 2,975 2,375 79.8 2 8 3 2 3 3 3 5 3 6 3 8 3 9 41 4 2 4 4 4 5 4 7 5 2 3 5 4 4 73.0 1.08CO03E 4 0 4 5 5 11/04/87 02/02/87 4 3 . 3 7.1 491 4 7 8 97.4 2 8 3 2 3 5 3 7 3 9 41 4 3 4 6 4 8 51 5 3 5 7 6 2 3 9 4 8 55.9 1.14CT01E 4 5 5 0 5 12/11/86 10/05/86 5 6 . 4 7.0 17,040 11,932 70.0 41 4 6 4 6 50 5 2 5 4 5 7 5 9 61 6 4 6 6 6 9 7 5 5 2 61 55.3 1 .ooCT04E 30 35 5 10/24/86 10/11/86 43.2 7.2 1,762 1,619 91.9 2 5 31 3 5 37 3 9 41 4 4 4 7 4 8 51 5 3 5 5 6 0 4 0 4 9 54.3 0.95DE05E 3 5 4 0 5 12/16/86 11/15/86 3 7 . 6 8.2 4 2 8 4 1 9 97.9 17 2 4 2 7 2 9 3 3 3 5 3 8 41 4 4 4 8 4 9 5 1 5 5 3 4 4 3 4 8 . 4 1.00IN02E 2 5 3 0 5 10/06/86 09/10/86 2 7 . 6 5 . 9 8,170 6,095 74.6 11 17 2 0 22 2 5 2 7 2 9 3 0 3 2 3 4 3 5 37 41 2 4 3 3 66.3 0.82IN03E 2 5 3 0 5 10/06/86 09/10/86 26.9 5 . 6 8,698 5,592 6 4 . 3 12 16 21 22 2 5 2 6 2 8 3 0 31 3 3 3 4 3 6 3 9 2 4 3 3 69.2 0.82MD01E 5 0 5 5 5 09/23/86 08/03/86 54.8 6.3 2,898 2,498 86.2 3 8 4 6 4 8 4 9 5 2 5 3 5 5 5 7 5 9 61 6 3 65 71 51 6 0 63.3 1.06MD02E 5 0 5 5 5 11/19/86 08/06/86 51.2 5.4 6,046 4,493 74.3 3 8 4 3 4 5 4 7 4 8 5 0 5 2 5 4 5 5 5 7 5 8 6 1 6 5 4 7 5 6 68.4 1 .ooMD03E 5 0 5 5 5 11/28/86 08/07/86 51.2 6 . 9 2,509 2,241 89.3 3 3 3 9 4 2 4 5 4 8 5 0 5 2 5 4 5 6 5 8 6 0 6 2 6 8 4 8 5 7 60.4 0.86MD04E 5 0 5 5 5 1 l/17/86 08/10/86 53.3 6 . 3 2,794 2,434 87.1 3 8 4 3 4 6 4 8 5 0 5 2 5 4 5 6 5 8 6 0 6 2 6 3 6 9 5 0 5 9 61.0 0 . 9 4MD05E 5 0 5 5 5 10/02/86 08/12/86 5 3 . 8 6.1 2 , 9 0 8 2,432 6 3 . 6 3 6 4 5 4 7 4 9 51 5 2 5 4 5 7 5 8 6 0 6 2 6 4 6 9 5 0 5 9 62.9 1.06M D 0 6 E 3 0 3 5 5 10/22/86 08/16/86 4 0 . 6 6.0 3,666 3,086 84.2 2 7 31 3 3 35 3 7 3 9 41 4 3 4 5 4 7 4 9 5 1 5 6 3 6 4 5 59.4 1 .ooMD07E 3 0 3 5 5 09/30/86 08116186 35.7 6 . 0 2,688 2,351 87.5 2 2 2 7 2 9 30 3 2 3 4 3 6 3 8 4 0 4 2 4 4 4 6 5 0 3 2 41 61.6 1.06MD08E 3 0 3 5 5 02/25/87 08/16/86 30.7 5.9 7,562 5,599 74.0 17 2 0 2 3 2 5 2 8 2 9 31 3 3 3 5 3 7 3 8 4 0 4 5 2 7 3 6 63.8 1 .ooMD09E 3 0 3 5 5 01/09/87 08/18/86 35.2 5.0 4,586 3,700 80.7 2 2 2 7 2 9 31 3 3 3 4 3 6 3 7 3 9 41 4 2 4 4 4 8 3 2 41 70.5 0.93MD10E 5 0 5 5 5 10/08/86 08/20/86 5 3 . 7 5 . 0 9,429 5,680 60.2 4 0 4 6 4 8 5 0 51 5 3 5 4 5 6 5 7 5 9 6 0 6 2 6 7 5 0 5 9 7 3 . 5 1 .ooMS02E 3 0 3 5 5 02/18/87 09/25/86 34.0 6 . 9 7,755 5,801 74.8 17 2 3 2 5 2 7 3 0 3 3 3 5 3 7 3 9 41 4 3 4 5 5 0 31 4 0 56.6 0.90
1 mi/h = 1.61 km/hNote: All speed limits and vehicle speeds are shown in mi/h.

Table 29. Before speed data for the experimental sites (continued).
BeforeExperimental Data Std. Free- Pct. 10-mi/h Pace
Site B e f o r e After Di f f . Date Limit Col lect ion Mean Dev. Before Flow Free Percentile Speeds L o w e r U p p e r Pct. S k e w .Number Limit Limit Limit Posted Date Speed Speeds Volume Volume Flow 1 5 1 0 1 5 2 5 35 50 65 75 85 90 95 99 Limit Limit Pace Index
Speed Limit Raised by 5 milh at Experimental Sites (continued)
TN01E 5 0 5 5 5 10/30/86 09/03/86 56.8 6 . 2 6,313 5 , 3 1 2 84.1 4 2 4 8 50 51 53 55 57 59 61 63 65 67 74 5 2 61 6 3 . 0 1.06TX06E 3 0 3 5 5 06/01/87 03/11/87 3 3 . 0 7.1 1,562 1,482 9 4 . 9 177 21 24 26 29 31 34 36 38 41 43 45 49 2 9 3 8 5 3 . 4 0.91TX07E 4 0 4 5 5 08/20/87 03/13/87 35.1 5.9 6,807 5 , 6 7 4 83.4 15 2 5 29 31 33 34 36 38 39 41 42 44 48 3 2 41 6 9 . 7 0.88
TX08E 3 0 3 5 5 08/20/87 03/13/87 30.6 4 . 8 9,217 6 , 6 9 8 72.7 18 2 3 25 27 28 29 31 33 34 36 37 39 43 2 7 3 6 7 4 . 3 1 .oo
Speed Limit Raised by 10 or 15 mi/h at Experimental Sites
CO02E 3 0 4 0 10 11/04/87 04/04/87 40.9 5 . 6 2,098 1,853 88.3 2 8 3 2 34 36 38 39 41 43 45 47 48 51 55 3 7 4 6 6 5 . 2 1.06
CT03E 3 0 4 0 1 0 10/24/86 10/11/86 44.9 7.1 1,711 1,523 89.0 2 7 3 4 37 39 41 43 45 48 50 53 55 57 62 4 0 4 9 53.1 1.05ID03E 2 0 3 0 10 06/Ol/88 04/15/87 24.2 4 . 8 1,414 1,351 95.5 14 17 18 20 22 23 25 27 28 29 30 32 36 2 0 2 9 71.1 0.93ID04E 2 0 3 0 10 06/01/88 04/15/87 23.1 6 . 0 1,161 1,126 97.0 8 11 1 5 1 8 2 1 2 2 2 4 2 6 2 8 2 9 3 0 3 2 3 7 21 3 0 6 6 . 3 0.78lD05E 2 0 3 0 1 0 06/01188 04/17/87 21.7 7.6 538 5 3 2 98.9 8 10 12 13 16 19 23 25 28 30 31 33 40 21 3 0 51.3 0.86ID06E 2 5 3 5 I 0 09/22/88 04/17/87 29.0 4.9 8,019 6 , 1 7 2 77.0 16 19 24 26 27 28 30 31 32 34 35 36 41 2 6 3 5 7 7 . 6 0.80ID07E 2 5 3 5 IO 09/22/88 06/O4/88 27.1 4 . 0 8,010 6 , 7 5 7 8 4 . 4 17 21 23 24 25 26 28 29 30 31 32 34 37 2 3 3 2 8 1 . 8 0.91
ID08E 3 5 4 5 IO 09/16/88 06/04/88 39.2 5.8 2,075 1,880 90.6 2 7 31 33 34 36 37 39 41 43 46 47 50 54 3 4 4 3 6 5 . 6 1.18MA02E 3 0 4 0 IO 11/01/86 10/29/86 41.9 6.1 1,394 1,340 96.1 2 5 3 2 35 37 39 40 43 45 46 48 50 52 57 3 8 4 7 6 5 . 0 0.89ME03E 3 5 4 5 1 0 05/26/87 10121 /86 4 6 . 7 7 . 0 1,720 1,517 88.2 2 9 3 6 39 41 43 45 47 50 52 54 56 59 64 4 2 51 5 5 . 4 1.05
MSOIE 3 5 4 5 IO 02/18/87 09/23/86 38.9 6 . 8 5,345 3 , 9 8 9 74.6 2 2 2 9 32 33 35 37 39 41 44 46 48 51 57 3 4 4 3 58.1 1.05VA02E 3 5 4 5 1 0 lO/14/87 07/26/86 39.9 5.2 2,231 1,990 89.2 2 7 3 2 34 35 37 38 40 42 44 46 47 49 53 3 6 4 5 69.1 1.07
CA04E 3 0 4 5 15 03/12/87 02/28/87 43.6 5.7 11,480 6 , 9 5 0 78.0 3 2 3 5 37 39 40 42 44 46 46 50 51 54 60 3 9 4 8 6 5 . 2 1.06
IN04E 3 0 4 5 15 11 /20/86 11/10/86 41.8 7.3 4 0 5 3 9 0 96.3 2 6 3 0 32 34 38 40 42 45 48 50 52 55 58 4 0 4 9 50.5 1.04TX01E 4 0 5 5 15 10/17/86 09/19/86 47.3 10.0 745 7 0 2 94.2 18 2 9 36 39 43 45 48 52 54 57 58 62 71 4 6 5 5 4 5 . 7 0.93
1 milh = 1.61 kmlhNote: All speed limits and vehicle speeds are shown in mi/h.

Table 30. After speed data for the experimental sites.
After Experimental Data Std. Free- Pet. 10-mi/h Pace
Site Before After Diff. Date Limit Collection Mean Dev. After Flow Free Percentile Speeds Lower Upper Pct. Skew. Number Limit Limit Limit Posted Date Speed Speeds Volume Volume Flow 1 5 10 15 25 35 50 65 75 85 90 95 99 Limit Limit Pace Index
Speed Limit Lowered by 15 or 20 mi/h at Experimental Sites
NJ04E 50 30 -20 02/28/89 04/02/89 37.8 5.5 633 603 95.3 23 29 31 33 35 37 38 40 42 43 45 47 51 34 43 67.3 1.00 TX03E 55 35 -20 05/01/87 03/29/88 37.9 4.7 1,378 1,281 93.0 27 31 33 34 35 37 38 40 41 43 44 46 50 34 43 73.6 1.00 ...................... -.......... ~ ...................................................................................... -.................................................................... - ..... _ .... - ..... - .... -.... _ .... - ..... _ ..... _ .... - .... _ .... _ .... - ..................................................... DE02E 50 35 -15 11/06/86 10/24/88 44.9 6.6 486 476 97.9 30 34 37 39 41 43 45 48 49 52 54 57 60 40 49 60.1 1.00 NM01E 55 40 -15 04/01/87 04/06/88 45.2 9.0 867 831 95.8 24 30 33 36 40 43 46 49 51 54 57 60 67 43 52 47.2 0.92 NM03E 55 40 -15 03/01/87 04/15/88 41.1 7.8 263 256 97.3 24 28 31 33 36 39 41 44 47 50 52 54 59 38 47 49.2 1.04 NM04E 55 40 -15 03/01/87 04/15/88 41.4 7.8 374 363 97.1 23 29 31 34 37 39 41 45 47 50 52 55 60 38 47 48.5 1.04 OH02E 55 40 -15 07113/86 09125/87 42.1 6.1 1,803 1,659 92.0 25 32 35 37 39 41 43 45 46 48 50 52 57 38 47 64.0 0.94 OH13E 55 40 -15 06/30/87 03/12188 41.9 5.4 3,749 3,029 80.8 28 34 36 37 39 40 42 44 46 48 49 51 55 38 47 69.3 1.07 TX05E 55 40 -15 05/30/89 07/08/89 47.5 5.3 13,035 7,706 59.1 34 40 42 43 45 46 48 50 51 53 54 57 60 43 52 68.4 1.00
Speed Limit Lowered by 10 mi/h at Experimental Sites
CA01E 35 25 -10 03/05/87 05/26/88 33.8 6.7 2,458 2,309 93.9 19 23 25 27 30 32 35 37 39 41 42 45 51 30 39 57.8 0.90 DE03E 50 40 -10 12/12/86 02/29/88 45.1 6.8 9,042 6,226 68.9 26 33 37 40 42 44 46 48 50 52 54 56 60 41 50 59.0 0.90 DE04E 50 40 -10 12/15/86 02129188 48.1 7.9 375 367 97.9 30 35 39 41 44 46 48 51 54 57 59 62 66 43 52 51.0 1.04 IL01E 50 40 -10 01/19/88 09/17/88 42.9 4.7 10,006 7,104 71.0 31 36 38 39 41 42 43 45 46 48 49 51 54 39 48 75.2 1.08 IN01E 55 45 -10 09/23/86 08111188 46.7 5.6 2,168 2,027 93.5 33 38 40 41 44 45 47 49 51 53 54 56 61 43 52 64.6 0.94 MA01E 40 30 -10 11/01/86 12/07/88 40.9 5.4 289 283 97.9 28 33 35 36 37 39 41 44 45 47 48 50 54 37 46 64.0 1.07 ME02E 45 35 -10 05/01/87 12/01188 33.4 7.2 345 336 97.4 19 22 24 26 29 31 34 37 39 42 44 47 51 29 38 49.4 0.95 MI09E 55 45 -10 06/13/88 06/08/89 50.5 7.9 2,975 2,674 89.9 27 36 41 44 47 49 51 54 56 58 60 62 67 48 57 53.6 0.92 NE01E 55 45 -10 05/29187 05112188 42.5 6.7 4,666 3,821 81.9 27 32 34 36 39 41 43 46 48 50 51 54 58 39 48 55.9 1.00 NJ02E 45 35 -10 02/05/87 05/01/88 37.7 7.0 7,526 5,760 76.5 21 26 29 31 34 36 38 41 43 46 47 50 54 34 43 52.9 1.00 NJ03E 45 35 -10 02/05/87 05/01188 41.5 6.3 10,268 6,735 65.6 17 33 36 37 39 40 42 44 46 48 49 51 56 38 47 67.6 1.00 OH01E 55 45 -10 09/07/86 05/03/89 51.7 7.4 3,192 2,836 88.8 32 40 43 45 48 50 52 55 57 59 61 64 70 48 57 54.1 1.05 OH03E 55 45 -10 01/16/87 09/23/87 48.6 6.2 4,278 3,308 77.3 33 39 41 43 45 47 49 51 53 55 57 58 64 45 54 62.4 0.94 OH04E 55 45 -10 11/18/86 11/07/87 45.1 7.3 2,559 2,147 83.9 26 33 37 39 41 43 46 48 50 53 55 58 63 41 50 55.0 1.00 OH05E 45 35 -10 12/10/86 11110/87 38.8 6.6 3,458 3,047 88.1 20 28 31 34 36 37 39 41 43 46 47 50 55 35 44 62.3 1.05 OH06E 55 45 -10 12/22186 11/01187 44.6 8.1 1,022 977 95.6 26 31 34 36 40 42 46 48 50 53 56 58 62 42 51 48.1 0.88
1 mi/h = 1.61 kmlh Note: All speed limits and vehicle speeds are shown in mi/h.

Table 30. After speed data for the experimental sites (continued).
After Experimental Data Std. Free- Pet. 10-mi/h Pace
Site Before After Diff. Date Limit Colleetion Mean Dev. After Flow Free Percentile Speeds Lower Upper Pet. Skew. Number Limit Limit Limit Posted Date Speed Speeds Volume Volume Flow 1 5 10 15 25 35 50 65 75 85 90 95 99 Limit Limit Pace Index
Speed Limit Lowered by 10 mi/h at Experimental Sites (continued)
OH07E 55 45 -10 11/26/86 11/04/87 44.4 5.8 8,256 6,332 76.7 28 35 38 40 41 43 45 47 48 50 52 54 58 40 49 65.9 1.00 OH08E 55 45 -10 02110187 11/04/87 39.8 8.1 675 653 96.7 21 26 29 31 35 38 41 44 46 49 50 52 56 39 48 47.3 0.83 OH09E 55 45 -10 04/29/87 03/11/88 42.7 6.7 3,920 3,254 83.0 22 31 35 37 40 42 44 46 47 49 51 53 58 39 48 62.8 0.84 OH10E 55 45 -10 05/12187 03/11/88 44.7 5.8 5,083 3,819 75.1 30 35 38 40 42 43 45 47 49 51 52 54 59 41 50 66.5 1.00 OH11E 50 40 -10 03/23/87 11/10/87 37.4 10.5 1,417 1,334 94.1 12 18 21 24 33 36 40 43 45 48 50 52 57 37 46 44.7 0.69 OH12E 55 45 -10 10/15/87 05/03/88 44.3 7.4 3,227 2,784 86.3 24 33 36 38 40 42 45 48 49 52 53 57 62 41 50 55.0 0.95 OK01E 45 35 -10 09/15/86 07/09/89 36.0 6.5 11,051 9,970 90.2 17 24 29 31 33 35 37 39 40 43 44 46 51 32 41 63.3 0.84 OK02E 35 25 -10 09115/86 07/11/89 29.9 4.5 10,985 7,715 70.2 17 23 25 26 28 29 30 32 33 35 36 37 41 26 35 77.4 1.08 OK03E 35 25 -10 09/15/86 07/11/89 40.6 5.9 5,734 4,776 83.3 26 31 34 35 38 39 41 43 45 47 48 50 55 37 46 62.1 1.00 OK04E 45 35 -10 04/06/87 03/27/88 42.3 6.4 5,302 4,184 78.9 24 32 35 37 39 41 43 46 47 49 50 52 57 39 48 62.2 0.89 TX02E 55 45 -10 05/01/87 03129/88 47.5 5.9 2,343 2,134 91.1 34 38 41 42 44 46 48 50 52 54 55 58 63 43 52 64.1 1.06 TX04E 55 45 -10 06/23/87 04/04/88 41.7 7.0 3,433 2,977 86.7 24 31 33 35 38 40 42 45 47 49 51 53 58 39 48 53.6 1.00 VA01E 55 45 -10 08/25/86 08/07/87 46.5 6.6 8,605 6,411 74.5 30 35 38 41 43 45 48 50 51 53 55 57 62 43 52 61.1 0.80 VA03E 55 45 -10 06116/87 11/16/87 44.8 6.2 1,292 1,209 93.6 29 34 37 39 42 43 45 47 49 52 53 55 59 41 50 61.5 1.05 VA04E 55 45 -10 10/28/86 11/19/87 40.7 6.9 498 485 97.4 24 29 32 34 37 39 42 44 46 48 50 52 56 38 47 53.6 0.90 VA05E 55 45 -10 09/09/87 06/26/88 45.0 7.7 1,066 1,022 95.9 24 32 36 38 41 43 46 49 51 53 55 57 62 43 52 50.6 0.96 VA07E 55 45 -10 10/17/87 10/27/87 46.8 6.4 4,266 3,550 83.2 28 36 40 41 44 45 48 50 51 54 55 57 61 43 52 61.5 0.89 WV03E 45 35 -10 09/15/86 11/07/87 45.1 7.0 1,219 1,122 92.0 29 34 37 38 41 43 46 48 50 53 55 58 62 40 49 52.2 0.95
Speed Limit Lowered by 5 mi/h at Experimental Sites
AZ01E 50 45 -5 04/28/87 04/09/88 44.2 5.2 8,028 5,469 68.1 32 37 39 40 41 43 44 46 48 50 51 53 58 40 49 70.6 1.14 CT02E 45 40 -5 10/23/86 12106188 39.9 5.6 12,183 7,073 58.1 25 31 34 35 37 39 41 43 44 46 47 49 53 36 45 67.2 0.88 CT05E 45 40 -5 03/26/87 12/03/88 45.4 5.3 11,966 7,570 63.3 31 37 40 41 43 44 46 48 49 51 52 54 60 41 50 70.5 0.93 DE01E 40 35 -5 11/04/86 10/28/88 45.1 7.1 775 742 95.7 30 34 37 39 41 43 45 47 50 53 55 58 65 41 50 56.2 1.14 (OO1E 55 50 -5 10/01/88 10/04/88 48.6 6.0 5,120 4,176 81.6 32 39 42 44 46 47 49 51 53 55 56 58 62 45 54 65.5 0.94 1D02E 55 50 -5 10/01/88 10/04/88 50.7 5.5 8,200 5,850 71.3 35 42 45 46 48 50 52 53 55 57 57 59 63 48 57 69.6 0.80 IL02E 50 45 -5 10/08/86 09/17/88 44.0 5.2 10,380 7,043 67.9 30 36 38 40 42 43 45 46 48 49 51 53 57 40 49 70.9 0.93 (N05E 45 40 -5 12/04/86 03/24/88 41.1 6.7 1,500 1,404 93.6 26 30 33 35 37 39 41 44 46 49 50 52 56 38 47 53.1 1.10 IN06E 50 45 -5 12/29/86 08/09/88 45.0 6.6 8,721 6,465 74.1 24 33 38 40 42 44 46 48 50 52 53 55 59 42 51 63.3- 0.84
1 mi/h = 1.61 kmlh Note: All speed limits and vehicle speeds are shown in mi/h.

Table 30. After speed data for the experimental sites (continued).
After Experimental Data Std. Free- Pet. 10-mi/h Pace
Site Before After Diff. Date Limit Collection Mean Dev. After Flow Free Percentile Speeds Lower Upper Pet. Skew. Number Limit Limit Limit Posted Date Speed Speeds Volume Volume Flow 1 5 10 15 25 35 50 65 75 85 90 95 99 Limit Limit Pace Index
Speed Limit Lowered by 5 mi/h at Experimental Sites (continued)
IN07E 50 45 -5 12/29/86 08/09/88 44.7 7.3 5,954 4,947 83.1 21 30 36 39 42 44 46 48 50 52 53 55 60 42 51 62.7 0.76 MA03E 30 25 -5 11/01/86 12/08/88 34.2 6.4 314 306 97.5 20 23 27 28 31 32 35 37 39 41 43 45 50 31 40 58.2 0.95 ME01E 45 40 -5 05/01/87 12/01/88 36.1 7.2 315 307 97.5 19 24 27 29 32 34 37 39 42 43 46 49 53 33 42 53.4 0.91 NJ01E 40 35 -5 02/09/87 04/03/89 38.7 5.7 12,450 7,557 60.7 23 30 33 34 36 37 39 41 43 44 46 48 53 34 43 69.1 1.00 NM02E 55 50 -5 04/01/87 04/06/88 54.6 8.8 712 684 96.1 32 41 44 47 50 52 55 58 61 64 66 70 75 49 58 47.5 1.00
Speed Limit Raised by 5 mi/h at Experimental Sites
AZ02E 25 30 5 07/22/87 04/11/88 31.9 5.4 1,332 1,284 96.4 19 24 26 27 29 30 32 34 36 38 39 41 45 27 36 66.7 1.07 AZ03E 30 35 5 04/04/88 04112188 33.6 4.5 4,156 3,704 89.1 24 27 29 30 31 32 34 36 37 38 40 42 46 29 38 76.6 1.08 CA06E 45 50 5 04/30/87 05/23/88 46.8 6.2 13,017 10,044 77.2 33 37 40 41 43 45 47 50 51 53 55 57 63 43 52 60.3 1.00 CA07E 45 50 5 05/07/87 05/24/88 51.3 6.2 17,054 11,449 67.1 36 42 44 46 48 50 52 54 56 58 59 62 67 48 57 61.5 1.00 C001E 30 35 5 11/04/87 05/14/88 38.8 4.5 3,528 2,734 77.5 29 32 34 35 36 38 39 41 42 44 45 47 51 35 44 76.9 1.08 C003E 40 45 5 11/04/87 05/16/88 42.8 6.8 602 585 97.2 29 32 34 36 38 41 43 46 48 50 51 54 62 41 50 53.2 0.95 CT01E 45 50 5 12/11/86 12104188 57.0 6.9 18,923 12,696 67.1 41 47 49 51 53 55 57 60 62 64 66 69 76 53 62 57.4 1.05 CT04E 30 35 5 10/24/86 12/09/88 43.0 7.1 1,884 1,731 91.9 24 31 34 36 39 41 44 46 48 50 52 54 60 40 49 54.8 0.90 DE05E 35 40 5 12/16/86 02/27/88 37.6 7.7 453 440 97.1 18 25 28 31 34 35 38 41 43 46 48 50 55 34 43 52.3 1.04 IN02E 25 30 5 10/06/86 09/06/88 24.8 5.7 8,608 6,276 72.9 11 16 18 20 22 23 25 27 29 31 32 34 39 21 30 64.2 1.00 IN03E 25 30 5 10/06/86 09/06/88 26.5 5.6 9,162 5,876 64.1 11 15 20 22 24 26 28 29 31 32 33 35 38 23 32 69.6 0.75 MD01E 50 55 5 09/23/86 06/28/88 56.4 6.1 3,284 2,754 83.9 41 47 50 51 53 55 57 59 60 63 64 67 73 53 62 65.0 1.00 MD02E 50 55 5 11119186 07/11188 52.1 5.3 6,681 4,782 71.6 39 44 46 48 49 51 53 55 56 58 59 61 66 48 57 70.8 0.93 MD03E 50 55 5 11128/86 06/28/88 51.1 7.2 2,769 2,454 88.6 32 38 41 45 48 50 52 54 56 58 60 62 68 48 57 59.8 0.82 MD04E 50 55 5 11/17186 08/31188 53.6 6.8 3,854 3,144 81.6 34 42 46 48 50 52 54 57 58 61 62 64 69 50 59 60.3 0.95 MD05E 50 55 5 10/02/86 06/29/88 54.9 6.7 3,176 2,635 83.0 38 45 48 50 52 53 55 57 59 61 63 66 73 50 59 65.1 1.06 MD06E 30 35 5 10/22/86 07109/88 40.8 6.0 4,114 3,389 82.4 27 32 34 35 37 39 41 43 45 47 49 52 57 36 45 61.6 1.06 MD07E 30 35 5 09/30/86 07/09/88 36.0 5.7 2,728 2,390 87.6 23 27 30 31 33 34 36 38 40 42 43 46 52 32 41 64.5 1.06 MD08E 30 35 5 02125187 07110/88 33.1 6.3 8,594 6,175 71.9 17 21 25 28 30 32 34 36 37 39 41 43 48 30 39 65.0 0.84 MD09E 30 35 5 01/09/87 07/11/88 35.9 4.6 5,299 4,029 76.0 24 29 31 32 34 35 36 38 39 41 42 44 47 32 41 75.6 1.08 MD10E 50 55 5 10/08/86 07112188 54.2 5.0 10,828 6,178 57.1 41 46 49 50 52 53 55 57 58 59 61 62 67 50 59 73.3 1.00 MS02E 30 35 5 02118/87 12/20/88 35.9 7.6 7,874 6,034 76.6 19 22 25 27 32 35 38 40 41 44 45 47 52 34 43 54.7 0.70
1 mi/h = 1.61 krnlh Note: All speed limits and vehicle speeds are shown in mi/h.

Table 30. After speed data for the experimental sites (continued).
After Experimental Data Std. Free- Pet. 10-milh Pace
Site Before After Diff. Date Limit Collection Mean Dev. After Flow Free Percentile Speeds Lower Upper Pet. Skew.
Number Limit Limit Limit Posted Date Speed Speeds Volume Volume Flow 1 5 10 15 25 35 50 65 75 85 90 95 99 Limit Limit Pace Index
Speed Limit Raised by 5 mi/h at Experimental Sites (continued)
TN01E TX06E TX07E TX08E
50 55 30 35 40 45 30 35
5 10/30/86 07/12/89 56.8
5 06/01187 03/31/88 33.3
5 08/20/87 04/02/88 35.2
5 08/20/87 04/02/88 32.5
Speed Limit Raised by 10 or 15 mi/h at Experimental Sites
6.1 7,498 6,192 82.6 43 48 50 52 54 55 57 59 61 63 65 67 74 53 6.6 1,749 1,679 96.0 18 22 26 27 30 32 34 36 38 40 42 45 49 29 6.0 7,964 6,269 78.7 14 26 29 31 33 34 36 38 39 41 43 44 48 32 4.7 10.623 6.954 65.5 19 25 28 29 30 31 33 35 36 37 39 40 44 29
62 38 41 38
64.1 1.06 58.9 1.00 67.8 0.88 76.2 1.00
C002E 30 40 10 11/04/87 05/14/88 42.3 5.4 2,398 2,067 86.2 28 34 36 38 39 41 43 45 46 48 49 51 55 38 47 67.8 0.93 CT03E 30 40 10 10/24/86 12/09/88 45.4 6.7 1,766 1,600 90.6 29 35 37 39 42 44 46 49 50 52 54 56 62 42 51 57.6 0.95 ID03E 20 30 10 06/01/88 10/03/88 25.0 4.4 1,343 1,299 96.7 15 182021 23242627 29 30 31 33 36 21 30 74.4 0.92 ID04E 20 30 10 06/01/88 10/03188 24.1 5.6 1,202 1,165 96.9 9 13 17 20 22 23 25 27 28 30 31 33 36 21 30 69.6 0.82 ID05E 20 30 10 06/01/88 10/02/88 21.5 6.6 643 625 97.2 9 11 12 14 17 20 23 25 27 29 30 32 36 20 29 54.7 0.80 ID06E 25 35 10 09/22/88 09/30/88 30.6 5.5 7,869 6,195 78.7 16 19 23 27 29 30 32 34 35 36 37 38 41 28 37 75.4 0.67 ID07E 25 35 10 09/22/88 09/30/88 27.9 4.6 7,945 6,763 85.1 16 20 22 24 26 27 29 30 31 33 34 35 38 24 33 74.7 0.86 ID08E 35 45 10 09/16/88 10/01/88 41.0 5.3 1,714 1,571 91.7 28 3335 36 38 40 42 43 454748 50 55 37 46 69.6 0.93 MA02E 30 40 10 11/01/86 12/07/88 41.9 5.8 1,611 1,507 93.5 253336 37 39 40 43 45 4648 50 52 56 38 47 65.2 0.94 ME03E 35 45 10 05/26/87 11/30/88 46.1 6.7 1,791 1,595 89.1 30 35 38 40 43 45 47 49 51 53 54 5762 43 52 57.8 0.90 MS01E 35 45 10 02118/87 12119/88 42.8 6.5 6,072 4,473 73.7 20 33 36 38 40 42 43 46 47 49 51 53 58 39 48 64.8 1.06
.y.~~~~ .... _ ... ~.~ ....... ~~ ......... ~.~ ..... ~.~!.~~!.~?.-.?~!.~.~!.~.~ ....... ~~:?--...... ?.'.~ ........ ~~~~.~.-.... ~~~.~.~ ...... ~.~:~ ... -~?-~~-~!.-~?-~~-~~-~~-~~-~!.-~~-~~-~~-~~-... ~~ ......... ~~ ......... ?~:~ ....... ~;~? .. CA04E 30 45 15 03/12/87 05/21/88 42.2 5.3 12,683 9,618 75.8 30 35 36 37 39 41 42 44 46 48 49 52 57 38 47 68.3 1.13 IN04E 30 45 15 11/20/86 04/18/88 43.1 6.6 437 426 97.5 28 323536 39 41 44474850 51 53 56 41 50 55.9 0.90 TX01E 40 55 15 10/17/86 12/16/88 45.8 9.1 582 572 98.3 20 31 353741 444750 525657 6063 44 53 45.8 0.85
1 milh = 1.61 krnlh Note: All speed limits and vehicle speeds are shown in milh.

Table 31. Differences in speed characteristics for the experimental sites.
Experimental Std. Free- Pet. 10-mi/h Pace
Site Diff. Mean Dev. Total Flow Free Percentile Speeds Lower Upper Pet. Skew.
Number Limit Speed Speeds Volume Volume Flow 1 5 10 15 25 35 50 65 75 85 90 95 99 Limit Limit Pace Index
Speed Limit Lowered by 15 or 20 mi/h at Experimental Sites
NJ04E -20 0.1 -1.1 225 209 -1.3 5 2 2 1 1 1 0 -1 -1 -1 -1 -1 -4 -1 -1 7.7 0.05
TX03E -20 1.7 -0.3 205 200 0.8 6 3 2 2 1 2 1 1 1 2 1 2 2 2 2 -0.2 0.00 ........................................................ _ • •• o ......................... ~ •••••••••••• a ...................•••• _ ..........................................................................................................................................................................................
DE02E -15 -0.8 -0.2 18 27 2.0 2 -1 -1 0 0 0 -1 -1 -2 -1 -1 0 -2 -2 -2 6.4 0.00
NM01E -15 0.7 -0.5 296 280 -0.7 0 2 2 3 2 1 0 -1 -1 -1 0 2 3 -3 -3 4.4 0.13
NM03E -15 -0.9 0.2 -210 -188 3.4 -1 -2 -2 -2 -1 0 -1 -2 -1 0 0 -1 -2 -1 -1 0.8 -0.01
NM04E -15 1.0 0.3 -246 -197 6.8 0 1 -1 0 1 1 0 1 1 2 2 2 -1 1 1 -5.1 0.04
OH02E -15 -0.5 -0.2 350 305 -1.2 -2 -1 -1 0 0 0 0 0 -1 -1 -1 -1 -2 0 0 2.6 -0.06
OH13E -15 0.0 -0.3 -452 -168 4.7 3 0 0 0 0 -1 0 0 0 0 0 0 -1 0 0 1.7 0.00
TX05E -15 -0.4 -0.2 2,283 854 -4.6 1 1 0 0 0 -1 0 0 -1 -1 -1 0 -1 -1 -1 0.3 -0.07
Speed Limit Lowered by 10 mi/h at Experimental Sites
CA01E -10 -0.5 -0.2 -94 -79 0.3 1 1 -1 -1 -1 0 0 0 0 -1 -2 -1 0 0 0 2.5 -0.05
DE03E -10 0.1 -0.1 56 28 -0.1 0 0 0 1 0 1 0 0 0 0 0 0 0 0 0 1.1 0.00 DE04E -10 -0.6 0.0 -18 -17 0.2 3 0 0 -1 -1 0 -1 -1 -1 0 0 1 0 -2 -2 -0.3 0.08 IL01E -10 -0.7 -0.4 1,549 783 -3.7 -1 0 0 0 0 0 -1 -1 -1 -1 -1 -1 -2 -1 -1 4.7 0.08
IN01E -10 -0.2 -0.2 -111 -124 -0.9 0 1 0 0 0 0 -1 -1 0 0 0 0 0 0 0 1.4 0.12
MA01E -10 -1.0 -0.4 -14 -14 -0.1 1 1 0 -1 -2 -1 -2 -1 -1 -1 -1 -2 0 ·1 -1 0.7 0.18
ME02E -10 0.4 0.0 -30 -28 0.3 1 1 1 0 0 0 0 1 1 1 2 1 0 -2 -2 -3.9 0.04
MI09E -10 0.8 -0.9 431 334 -2.1 2 3 3 3 2 1 0 0 -1 0 0 0 -1 -1 -1 5.1 0.12
NE01E -10 -1.7 -0.8 819 631 -1.0 2 1 -1 -1 -1 -2 -3 -2 -2 -2 -3 -1 -1 -4 -4 4.8 0.18 NJ02E -10 0.0 -1.0 231 91 -1.2 2 2 1 1 1 1 0 0 -1 0 -1 -1 -2 0 0 6.8 0.00 NJ03E -10 0.5 -0.5 2,674 763 -13.0 -6 4 3 2 1 0 0 0 0 0 -1 -1 -1 0 0 8.4 0.10
OH01E -10 -1.3 0.4 -756 -544 3.2 -2 -2 -2 -2 -2 -1 -2 -1 -1 -1 -1 0 0 -2 -2 -3.8 0.15 OH03E -10 0.4 -0.1 443 288 -1.4 1 1 0 0 0 0 0 0 0 0 0 -1 2 0 0 3.2 -0.01
OH04E -10 -0.7 -0.3 -905 -425 9.7 1 0 0 0 -1 -1 -1 -1 -1 -1 0 0 0 -2 -2 2.6 0.09
OH05E -10 0.1 -1.0 -451 -405 -0.2 6 3 0 1 1 0 -1 -1 -1 0 0 0 0 -1 -1 5.3 0.19
OH06E -10 0.5 -0.9 -91 -97 -0.9 5 2 2 1 1 0 0 -1 -1 0 1 0 -1 -2 -2 3.5 0.07
OH07E -10 1.1 -0.6 561 455 0.3 2 3 2 2 1 1 1 1 0 0 1 0 0 1 1 3.4 0.05
OH08E -10 0.7 0.6 79 78 0.2 1 1 0 -1 0 1 1 1 1 2 2 2 2 3 3 -3.7 -0.03
OH09E -10 0.0 -0.1 659 338 -6.4 2 -1 0 0 0 1 1 0 0 0 0 0 0 -1 -1 2.0 -0.16
1 mi/h = 1.61 krnlh Note: All speed limits and vehicle speeds are shown in mi/h.

Table 31. Differences in speed characteristics for the experimental sites (continued).
Experimental Std. Free- Pet. 10-mi/h Pace Site Diff. Mean Dev. Total Flow Free Percentile Speeds Lower Upper Pet. Skew.
Number Limit Speed Speeds Volume Volume Flow 1 5 10 15 25 35 50 65 75 85 90 95 99 Limit Limit Pace Index
Speed Limit Lowered by 10 mi/h at Experimental Sites (continued)
OH10E -10 -2.0 -0.5 931 513 -4.5 0 -1 -2 -1 -1 -2 -2 -3 -2 -2 -2 -3 -3 -2 -2 3.2 0.00 OH11E -10 1.9 -2.1 67 42 -1.6 2 3 4 5 9 3 1 0 -1 0 0 -1 ·1 -1 -1 7.2 -0.03 OH12E -10 -1.3 0.1 619 489 -1.7 2 -1 -1 -1 -2 -2 -2 -1 -2 -1 -2 0 1 -2 -2 0.1 0.09 OK01E -10 -0.4 0.2 1,360 1,145 -0.9 -1 -2 0 0 0 0 0 -1 -1 0 0 0 1 -2 -2 2.2 -0.05 OK02E -10 0.4 -0.3 -487 -573 -2.0 2 1 0 0 1 0 0 0 0 1 0 0 0 0 0 1.7 0.16 OK03E -10 1.3 -0.1 -549 -349 1.7 2 2 2 1 2 1 1 1 2 1 1 1 1 2 2 -0.9 0.06 OK04E -10 -0.4 0.7 -323 -153 1.8 -3 -2 -1 -1 -1 0 0 0 0 0 0 0 1 0 0 -3.3 -0.11 TX02E -10 -0.9 -0.6 110 80 -0.9 2 0 0 -1 -1 -1 -1 -1 -1 -1 -2 -1 -1 -2 -2 3.9 0.06 TX04E -10 1.3 -0.2 442 358 -0.9 0 1 1 1 2 2 2 2 1 1 1 0 -3 4 4 1.1 -0.10 VA01E -10 -0.9 -0.6 180 1 -1.6 1 1 0 0 -1 -1 -1 -1 -2 -2 -1 -1 -1 -2 -2 4.1 0.07 VA03E -10 0.8 -0.2 -11 -29 -1.4 1 1 1 1 1 1 0 0 0 1 0 0 -1 1 1 1.7 0.15 VA04E -10 0.5 0.0 -35 -29 1.0 1 1 0 0 1 1 1 1 1 1 1 0 -1 2 2 -4.0 -0.05 VA05E -10 0.2 -0.8 139 153 2.2 1 4 1 0 1 1 0 0 0 -1 -1 -1 0 3 3 4.8 0.08 VA07E -10 2.4 -0.6 -285 -124 2.5 4 3 4 3 3 2 3 2 1 2 2 2 1 2 2 4.3 -0.01 WV03E -10 1.1 -0.1 -951 -792 3.8 1 2 2 1 1 1 1 1 1 1 2 2 1 -1 -1 -0.9 0.04
Speed Limit Lowered by 5 mi/h at Experimental Sites
AZ01E -5 -0.6 -0.3 198 31 -1.4 1 0 0 0 -1 0 -1 -1 -1 -1 -1 -1 -2 -1 -1 2.9 0.07 CT02E -5 0.0 -0.1 -1,463 -535 2.3 0 0 1 0 0 0 0 0 0 0 0 0 0 0 0 1.9 0.00 CT05E -5 1.0 -0.1 2,308 1,265 -2.0 1 1 2 1 1 1 1 1 1 1 1 1 1 0 0 1.2 0.00 DE01E -5 -0.2 -1.3 -211 -204 -0.2 3 1 2 2 1 1 -1 -1 -1 -1 -2 -4 -2 1 1 7.4 0.10 ID01E -5 -1.0 -0.9 763 471 -3.4 1 1 1 1 0 -1 -1 -2 -2 -2 -2 -3 -3 -1 -1 6.8 -0.06 ID02E -5 0.4 -0.3 136 34 -0.8 1 1 1 1 0 1 1 0 1 1 -1 -1 -1 2 2 3.1 -0.08 I L02E -5 -0.8 0.0 899 282 -3.4 -1 -1 -1 0 0 -1 -1 -1 0 -1 0 0 0 -1 -1 -0.2 0.07 IN05E -5 -0.6 -0.4 45 23 -1.3 1 0 0 0 0 0 -1 -1 -1 -1 -1 -1 -1 1 1 2.8 0.15 INOSE -5 -0.4 -0.6 193 206 0.7 0 1 1 1 -1 0 -1 -1 0 -1 -1 -1 -1 -1 -1 3.3 0.08 IN07E -5 0.6 -0.1 211 197 0.4 1 1 1 1 1 1 0 0 1 1 1 0 2 0 0 1.0 0.03 MA03E -5 0.3 0.3 -57 -55 0.2 1 -1 1 0 0 0 1 0 0 0 1 1 3 0 0 -1.9 0.00 ME01E -5 0.0 0.2 9 4 -1.5 -2 0 0 0 0 0 1 0 1 -1 0 0 0 0 0 -0.1 -0.18 NJ01E -5 0.4 0.0 -219 -187 -0.4 0 0 1 0 0 0 0 0 1 0 1 0 0 0 0 0.2 0.00 NM02E -5 0.8 0.0 228 218 -0.2 -1 3 1 1 1 0 0 1 1 1 1 1 1 -1 -1 0.5 0.08
1 mi/h = 1.61 km/h Note: All speed limits and vehicle speeds are shown in mi/h.

Table 31. Differences in speed characteristics for the experimental sites (continued).
Experimental Std. Free- Pet. 10-mi/h Pace Site Oiff. Mean Oev. Total Flow Free Percentile Speeds Lower Upper Pct. Skew.
Number Limit Speed Speeds Volume Volume Flow 1 5 10 15 25 35 50 65 75 85 90 95 99 Limit Limit Pace Index
Speed Limit Raised by 5 mi/h at Experimental Sites
AZ02E 5 0.1 -0.2 36 32 -0.2 -1 0 1 0 1 0 0 0 0 0 -1 -1 -1 0 0 4.2 0.07 AZ03E 5 1.0 -0.9 151 183 1.2 3 2 2 2 1 1 1 1 1 -1 0 0 -1 1 1 9.6 0.01 CA06E 5 -2.1 -0.2 100 -157 -1.8 -1 -2 -1 -2 -2 -2 -2 -2 -2 -3 -3 -3 -2 -2 -2 2.2 -0.05 CA07E 5 -1.8 0.3 2,922 1,660 -2.2 -4 -2 -2 -2 -2 -1 -2 -2 -1 -2 -2 -1 -2 -1 -1 -0.5 0.06 C001E 5 -0.1 -0.3 553 359 -2.3 1 0 1 0 0 0 0 0 0 0 0 0 -1 0 0 3.9 0.00 C003E 5 -0.5 -0.3 111 107 -0.2 1 0 -1 -1 -1 0 0 0 0 -1 -2 -3 0 2 2 -2.7 -0.19 CT01E 5 0.6 -0.1 1,883 764 -2.9 0 1 1 1 1 1 0 1 1 0 0 0 1 1 1 2.1 0.05 CT04E 5 -0.2 -0.1 122 112 0.0 -1 0 -1 -1 0 0 0 -1 0 -1 -1 -1 0 0 0 0.5 -0.05 OE05E 5 0.0 -0.5 25 21 -0.8 1 1 1 2 1 0 0 0 -1 -2 -1 -1 0 0 0 3.9 0.04 IN02E 5 -2.8 -0.2 438 181 -1.7 0 -1 -2 -2 -3 -4 -4 -3 -3 -3 -3 -3 -2 -3 -3 -2.1 0.18 IN03E 5 -0.4 0.0 464 284 -0.2 -1 -1 -1 0 -1 0 0 -1 0 -1 -1 -1 -1 -1 -1 0.4 -0.07 M001E 5 1.6 -0.2 386 256 -2.3 3 1 2 2 1 2 2 2 1 2 1 2 2 2 2 1.7 -0.06 M002E 5 0.9 -0.1 635 289 -2.7 1 1 1 1 1 1 1 1 1 1 1 0 1 1 1 2.4 -0.07 M003E 5 -0.1 0.3 260 213 -0.7 -1 -1 -1 0 0 0 0 0 0 0 0 0 0 0 0 -0.6 -0.04 M004E 5 0.3 0.5 1,060 710 -5.5 -4 -1 0 0 0 0 0 1 0 1 0 1 0 0 0 -0.7 0.01 M005E 5 1.1 0.6 268 203 -0.6 2 0 1 1 1 1 1 0 1 1 1 2 4 0 0 2.2 0.00 M006E 5 0.2 0.0 448 303 -1.8 0 1 1 0 0 0 0 0 0 0 0 1 1 0 0 2.2 0.06 M007E 5 0.3 -0.3 40 39 0.1 1 0 1 1 1 0 0 0 0 0 -1 0 2 0 0 2.9 0.00 M008E 5 2.4 0.4 1,032 576 -2.1 0 1 2 3 2 3 3 3 2 2 3 3 3 3 3 1.2 -0.16 M009E 5 0.7 -0.4 713 329 -4.7 2 2 2 1 1 1 0 1 0 0 0 0 -1 0 0 5.1 0.15 M010E 5 0.5 0.0 1,399 498 -3.1 1 0 1 0 1 0 1 1 1 0 1 0 0 0 0 -0.2 0.00 MS02E 5 1.9 0.7 119 233 1.8 2 -1 0 0 2 2 3 3 2 3 2 2 2 3 3 -1.9 -0.20 TN01E 5 0.0 -0.1 1,185 880 -1.5 1 0 0 1 1 0 0 0 0 0 0 0 0 1 1 1.1 0.00 TX06E 5 0.3 -0.5 187 197 1.1 1 1 2 1 1 1 0 0 0 -1 -1 0 0 0 0 5.5 0.09 TX07E 5 0.1 0.1 1,157 595 -4.7 -1 1 0 0 0 0 0 0 0 0 1 0 0 0 0 -1.9 0.00 TX08E 5 1.9 -0.1 1,406 256 -7.2 1 2 3 2 2 2 2 2 2 1 2 1 1 2 2 1.9 0.00
1 mi/h = 1.61 krnlh Note: All speed limits and vehicle speeds are shown in milh.
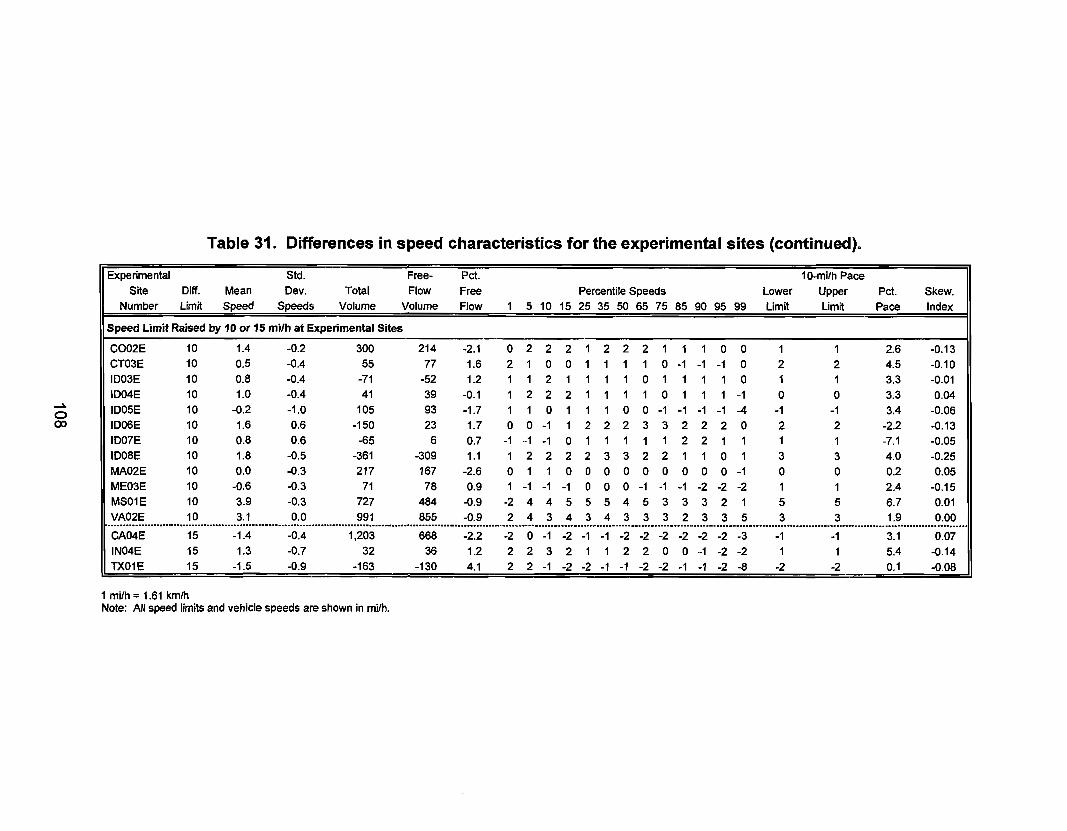
Table 31. Differences in speed characteristics for the experimental sites (continued).
Experimental Std. Free- Pet. 10-mi/h Pace
Site Diff. Mean Dev. Total Flow Free Percentile Speeds Lower Upper Pet. Skew. Number Limit Speed Speeds Volume Volume Flow 1 5 10 15 25 35 50 65 75 85 90 95 99 Limit Limit Pace Index
Speed Limit Raised by 10 or 15 mi/h at Experimental Sites
C002E 10 1.4 -0.2 300 214 -2.1 0 2 2 2 1 2 2 2 1 1 1 0 0 1 1 2.6 -0.13
CT03E 10 0.5 -0.4 55 77 1.6 2 1 0 0 1 1 1 1 0 -1 -1 -1 0 2 2 4.5 -0.10 ID03E 10 0.8 -0.4 -71 -52 1.2 1 1 2 1 1 1 1 0 1 1 1 1 0 1 1 3.3 -0.01 ID04E 10 1.0 -0.4 41 39 -0.1 1 2 2 2 1 1 1 1 0 1 1 1 -1 0 0 3.3 0.04
ID05E 10 -0.2 -1.0 105 93 -1.7 1 1 0 1 1 1 0 0 -1 -1 -1 -1 -4 -1 -1 3.4 -0.06
ID06E 10 1.6 0.6 -150 23 1.7 0 0 -1 1 2 2 2 3 3 2 2 2 0 2 2 -2.2 -0.13 ID07E 10 0.8 0.6 -65 6 0.7 -1 -1 -1 0 1 1 1 1 1 2 2 1 1 1 1 -7.1 -0.05 ID08E 10 1.8 -0.5 -361 -309 1.1 1 2 2 2 2 3 3 2 2 1 1 0 1 3 3 4.0 -0.25 MA02E 10 0.0 -0.3 217 167 -2.6 0 1 1 0 0 0 0 0 0 0 0 0 -1 0 0 0.2 0.05 ME03E 10 -0.6 -0.3 71 78 0.9 1 -1 -1 -1 0 0 0 -1 -1 -1 -2 -2 -2 1 1 2.4 -0.15
MS01E 10 3.9 -0.3 727 484 -0.9 -2 4 4 5 5 5 4 5 3 3 3 2 1 5 5 6.7 0.01
VA02E 10 3.1 0.0 991 855 -0.9 2 4 3 4 3 4 3 3 3 2 3 3 5 3 3 1.9 0.00 ...................................................................................................... " .................................... _ ........................................... , ............................................................................... " .......................................... CA04E 15 -1.4 -0.4 1,203 668 -2.2 -2 0 -1 -2 -1 -1 -2 -2 -2 -2 -2 -2 -3 -1 -1 3.1 0.07
IN04E 15 1.3 -0.7 32 36 1.2 2 2 3 2 1 1 2 2 0 0 -1 -2 -2 1 1 5.4 -0.14
TX01E 15 -1.5 -0.9 -163 -130 4.1 2 2 -1 -2 -2 -1 -1 -2 -2 -1 -1 -2 -8 -2 -2 0.1 -0.08
1 mi/h = 1.61 km/h Note: All speed limits and vehicle speeds are shown in milh.
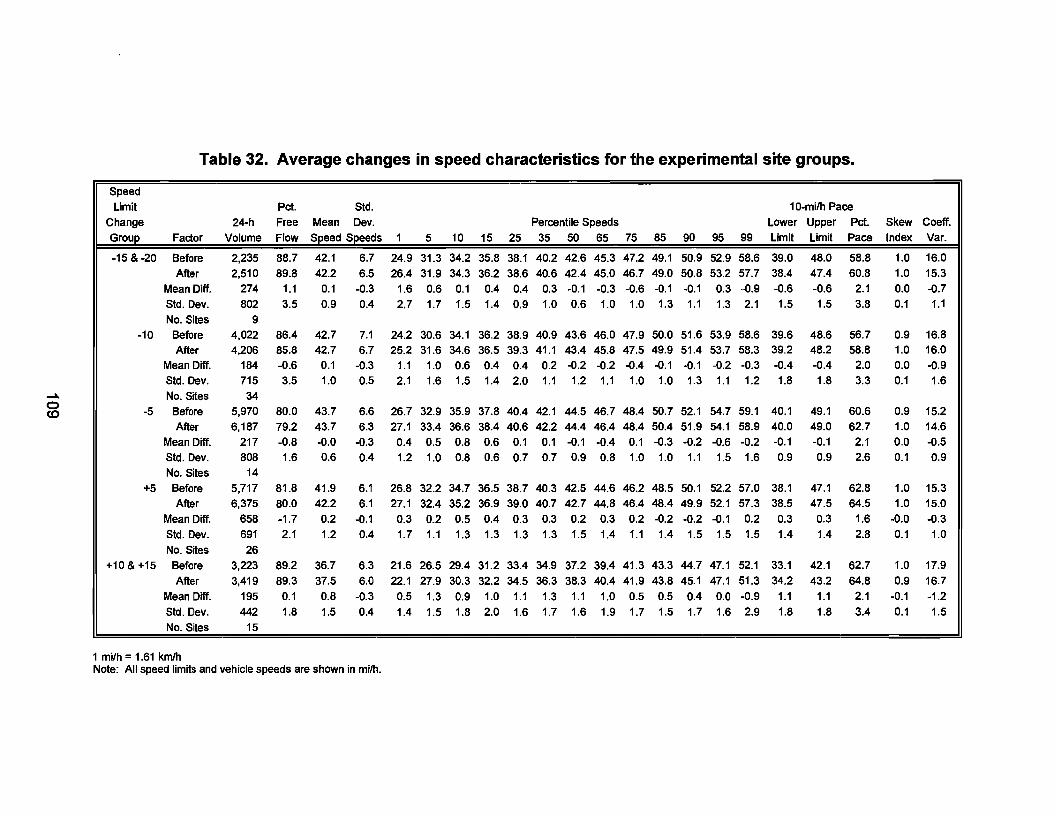
Table 32. Average changes in speed characteristics for the experimental site groups.
Speed Limit Pet. Std. 10-mi/h Pace
Change 24-h Free Mean Dev. Percentile Speeds Lower Upper Pet. Skew Coeff. Group Factor Volume Flow Speed Speeds 1 5 10 15 25 35 50 65 75 85 90 95 99 Limit Limit Pace Index Var.
-15 & -20 Before 2,235 88.7 42.1 6.7 24.9 31.3 34.2 35.8 38.1 40.2 42.6 45.3 47.2 49.1 50.9 52.9 58.6 39.0 48.0 58.8 1.0 16.0 After 2,510 89.8 42.2 6.5 26.4 31.9 34.3 36.2 38.6 40.6 42.4 45.0 46.7 49.0 50.8 53.2 57.7 38.4 47.4 60.8 1.0 15.3
Mean Diff. 274 1.1 0.1 -0.3 1.6 0.6 0.1 0.4 0.4 0.3 -0.1 -0.3 -0.6 -0.1 -0.1 0.3 -0.9 -0.6 -0.6 2.1 0.0 -0.7 Std. Dev. 802 3.5 0.9 0.4 2.7 1.7 1.5 1.4 0.9 1.0 0.6 1.0 1.0 1.3 1.1 1.3 2.1 1.5 1.5 3.8 0.1 1.1 No. Sites 9
-10 Before 4,022 86.4 42.7 7.1 24.2 30.6 34.1 36.2 38.9 40.9 43.6 46.0 47.9 50.0 51.6 53.9 58.6 39.6 48.6 56.7 0.9 16.8 After 4,206 85.8 42.7 6.7 25.2 31.6 34.6 36.5 39.3 41.1 43.4 45.8 47.5 49.9 51.4 53.7 58.3 39.2 48.2 58.8 1.0 16.0
Mean Diff. 184 -0.6 0.1 -0.3 1.1 1.0 0.6 0.4 0.4 0.2 -0.2 -0.2 -0.4 -0.1 -0.1 -0.2 -0.3 -0.4 -0.4 2.0 0.0 -0.9 Std. Dev. 715 3.5 1.0 0.5 2.1 1.6 1.5 1.4 2.0 1.1 1.2 1.1 1.0 1.0 1.3 1.1 1.2 1.8 1.8 3.3 0.1 1.6 No. Sites 34
-5 Before 5,970 80.0 43.7 6.6 26.7 32.9 35.9 37.8 40.4 42.1 44.5 46.7 48.4 50.7 52.1 54.7 59.1 40.1 49.1 60.6 0.9 15.2 After 6,187 79.2 43.7 6.3 27.1 33.4 36.6 38.4 40.6 42.2 44.4 46.4 48.4 50.4 51.9 54.1 58.9 40.0 49.0 62.7 1.0 14.6
Mean Diff. 217 -0.8 -0.0 -0.3 0.4 0.5 0.8 0.6 0.1 0.1 -0.1 -0.4 0.1 -0.3 -0.2 -0.6 -0.2 -0.1 -0.1 2.1 0.0 -0.5 Std. Dev. 808 1.6 0.6 0.4 1.2 1.0 0.8 0.6 0.7 0.7 0.9 0.8 1.0 1.0 1.1 1.5 1.6 0.9 0.9 2.6 0.1 0.9 No. Sites 14
+5 Before 5,717 81.8 41.9 6.1 26.8 32.2 34.7 36.5 38.7 40.3 42.5 44.6 46.2 48.5 50.1 52.2 57.0 38.1 47.1 62.8 1.0 15.3
After 6,375 80.0 42.2 6.1 27.1 32.4 35.2 36.9 39.0 40.7 42.7 44.8 46.4 48.4 49.9 52.1 57.3 38.5 47.5 64.5 1.0 15.0 Mean Diff. 658 -1.7 0.2 -0.1 0.3 0.2 0.5 0.4 0.3 0.3 0.2 0.3 0.2 -0.2 -0.2 -0.1 0.2 0.3 0.3 1.6 -0.0 -0.3 Std. Dev. 691 2.1 1.2 0.4 1.7 1.1 1.3 1.3 1.3 1.3 1.5 1.4 1.1 1.4 1.5 1.5 1.5 1.4 1.4 2.8 0.1 1.0
No. Sites 26 +10 & +15 Before 3,223 89.2 36.7 6.3 21.6 26.5 29.4 31.2 33.4 34.9 37.2 39.4 41.3 43.3 44.7 47.1 52.1 33.1 42.1 62.7 1.0 17.9
After 3,419 89.3 37.5 6.0 22.1 27.9 30.3 32.2 34.5 36.3 38.3 40.4 41.9 43.8 45.1 47.1 51.3 34.2 43.2 64.8 0.9 16.7
Mean Diff. 195 0.1 0.8 -0.3 0.5 1.3 0.9 1.0 1.1 1.3 1.1 1.0 0.5 0.5 0.4 0.0 -0.9 1.1 1.1 2.1 -0.1 -1.2 Std. Dev. 442 1.8 1.5 0.4 1.4 1.5 1.8 2.0 1.6 1.7 1.6 1.9 1.7 1.5 1.7 1.6 2.9 1.8 1.8 3.4 0.1 1.5
No. Sites 15
1 milh = 1.61 km/h Note: All speed limits and vehicle speeds are shown in milh.

Table 33. Before speed data for the comparison sites.
Before Comparison Posted Data Std. Free- Pet. 10-mVh Pace
Site Speed Collection Mean Dev. Before Flow Free Percentile Speeds Lower Upper Pet. Skew. Number Limit Date Speed Speeds Volume Volume Flow 1 5 10 15 25 35 50 65 75 85 90 95 99 Limit Limit Pace Index
Speed Limit Lowered by 15 or 20 mi/h at Experimental Sites
NJ04C 50 01/17/87 47.6 5.5 1,440 1,279 88.8 33 39 42 43 45 46 48 50 51 54 55 57 61 43 52 68.2 1.07 TX03C 55 03/02187 49.6 10.4 459 447 97.4 19 28 38 41 45 48 51 55 57 59 62 64 71 48 57 44.5 0.86
................................................................................. 00 •• 0 .............................................................................................................. O ...................... ~ .............. o ................................................................ " ......... ..
DE02C 50 09/29/86 44.5 6.9 213 210 98.6 25 32 36 39 42 43 45 47 49 51 53 56 59 42 51 61.4 0.91 NM01C 55 02/23/87 52.2 7.7 1,496 1,407 94.1 33 40 43 45 48 50 52 55 57 60 62 65 74 48 57 54.1 1.04 NM03C 40 02/26/87 44.2 9.8 577 559 96.9 20 25 31 35 40 42 46 49 51 54 57 60 67 41 50 46.3 0.77 NM04C 40 02126187 44.2 9.8 577 559 96.9 20 25 31 35 40 42 46 49 51 54 57 60 67 41 50 46.3 0.77 OH02C 55 06/28/86 46.6 7.2 668 642 96.1 29 35 38 40 43 45 47 50 52 55 57 59 63 43 52 52.5 1.00 OH13C 55 03/28/87 47.5 6.2 6,517 4,834 74.2 30 38 41 42 45 46 48 50 52 54 55 58 63 43 52 64.9 0.94 TX05C 55 03108187 52.6 6.4 4,281 3,527 82.4 33 43 46 47 50 51 53 56 57 59 61 63 68 49 58 63.3 1.00
Speed Limit Lowered by 10 milh at Experimental Sites
5.6 8.6 8.7 5.6 6.6 6.3 7.5 7.2 8.3 7.9 7.7 9.4 7.7 5.9
11.1 7.4
8,689 3,005 3,005 9,208 1,993
581 364
3,180 821
2,161 2,045 3,720 1,491 2,826 2,771
854
6,780 2,632 2,624 6,298 1,861
563 356
2,819 784
2,014 1,914 3,252 1,359 2,166 2,412
823
78.0 87.6 87.3 68.4 93.4 96.9 97.8 88.6 95.5 93.2 93.6 87.4 91.1 76.6 87.0 96.4
21 25 27 29 31 32 34 36 38 40 42 44 49 30 28 35 38 40 45 48 51 54 56 58 60 62 69 49 27 34 38 40 44 47 51 54 56 58 60 62 69 49 27 33 37 39 41 43 44 46 48 49 51 52 56 40 34 42 45 47 50 51 54 56 58 60 61 63 69 50 23 27 30 32 34 36 39 41 42 45 46 49 53 33 29 33 36 39 42 45 48 50 52 54 56 59 62 45 37 45 48 50 53 55 58 60 62 64 65 69 74 53 26 37 42 45 49 51 54 56 57 59 62 64 68 49 28 37 41 44 47 49 52 54 56 59 60 63 69 46 28 38 41 43 46 48 51 54 56 58 60 62 69 47 26 35 38 41 47 50 54 57 58 61 62 65 72 52 29 40 44 47 50 52 54 56 58 61 62 65 70 49 32 37 40 41 44 46 48 49 51 53 54 57 63 43 20 27 31 37 47 50 54 56 58 59 61 64 70 50 34 40 43 46 48 50 53 56 58 61 62 65 69 50
CA01C DE03C DE04C IL01C IN01C MA01C ME02C MI09C NE01C NJ02C NJ03C OH01C OH03C OH04C OH05C OH06C OH07C OH08C
30 50 50 45 55 30 45 55 55 50 50 55 55 55 55 55 55 55
02109/87 11/12186 11112186 09113/86 09/07/86 10/29/86 10115/86 10/12187 04/20/87 12115186 12/18/86 06/25/86 06/30186 10/17/86 10/19/86 10126/86 10/29/86 11/23/86
34.0 49.5 49.3 43.6 52.9 37.9 46.5 56.7 52.1 50.6 50.2 51.6 52.9 46.8 50.0 52.7 43.8 56.4
8.4 6,534 5,347 81.8 23 29 32 35 39 42 46 48 50 52 54 56 62 43 8.5 554 525 94.8 30 38 46 50 53 56 58 60 62 65 66 68 72 54
1 mi/h = 1.61 km/h Note: All speed limits and vehicle speeds are shown in mVh.
39 58 58 49 59 42 54 62 58 55 56 61 58 52 59 59 52 63
64.7 47.9 47.3 69.1 59.8 59.7 53.1 58.3 59.2 51.9 52.6 49.6 57.2 65.2 53.4 51.3
1.06 0.80 0.80 0.88 0.89 0.95 0.78 0.86 0.67 0.87 0.91 0.71 0.95 0.82 0.48 0.96
50.1 0.72 55.4 0.75

Table 33. Before speed data for the comparison sites (continued).
Before Comparison Posted Data Std. Free- Pet. 10-mi/h Pace
Site Speed Colleetion Mean Dev. Before Flow Free Percentile Speeds Lower Upper Pet. Skew. Number Limit Date Speed Speeds Volume Volume Flow 1 5 10 15 25 35 50 65 75 85 90 95 99 Limit Limit Pace Index
Speed Limit Lowered by 10 mi/h at Experimental Sites (continued)
OH09C 55 01/16/87 54.4 6.4 2,957 2,624 88.7 37 44 47 49 52 53 55 57 58 61 62 65 71 50 59 65.3 1.00 OH10C 55 01/16/87 54.4 6.4 2,957 2,624 88.7 37 44 47 49 52 53 55 57 58 61 62 65 71 50 59 65.3 1.00 OH11C 50 01/26/87 41.6 6.4 1,327 1,258 94.8 23 33 35 36 38 40 42 45 46 48 50 52 57 38 47 61.1 1.06 OH12C 55 03/26/87 53.3 7.4 1,835 1,714 93.4 32 42 45 47 50 52 54 57 58 61 62 65 71 50 59 57.6 1.00 OK01C 45 08/21/86 46.6 7.0 6,456 5,962 92.3 24 36 39 41 43 45 47 50 51 54 55 58 63 43 52 60.1 1.05 OK04C 35 03/16/87 32.0 5.5 7,258 5,543 76.4 17 23 26 27 29 31 33 35 36 38 39 41 45 29 38 69.1 0.88 TX02C 55 03/02/87 49.6 10.4 459 447 97.4 19 28 38 41 45 48 51 55 57 59 62 64 71 48 57 44.5 0.86 TX04C 55 03/05/87 50.5 8.6 603 575 95.4 32 37 40 43 45 48 51 54 56 59 62 65 73 46 55 46.8 1.04 VA01C 55 07/11/86 44.7 6.1 7,973 5,892 73.9 27 35 38 39 42 43 46 48 49 51 53 54 58 41 50 63.0 0.94 VA03C 55 07/28/86 45.2 6.7 967 916 94.7 28 34 37 39 41 43 46 48 50 53 54 57 61 41 50 55.2 0.95 VA04C 55 07/28/86 45.2 6.7 967 916 94.7 28 34 37 39 41 43 46 48 50 53 54 57 61 41 50 55.2 0.95 VA05C 55 07/28/86 45.2 6.7 967 916 94.7 28 34 37 39 41 43 46 48 50 53 54 57 61 41 50 55.2 0.95 VA07C 55 08/27/86 49.4 8.1 2,144 1,925 89.8 26 36 39 42 45 48 51 53 55 57 59 62 67 46 55 50.6 0.78 WV03C 45 08/29/86 39.0 7.8 1,035 966 93.3 20 25 29 31 35 37 40 43 45 47 49 52 57 36 45 50.9 0.92
Speed Limit Lowered by 5 mi/h at Experimental Sites
AZ01C 45 03/27/87 46.9 6.5 1,757 1,637 93.2 30 37 39 41 44 45 48 50 51 54 55 58 63 43 52 60.4 0.95 CT02C 45 10/08/86 40.7 8.8 4,761 3,894 81.8 18 22 29 32 37 40 43 46 47 49 51 53 58 40 49 51.7 0.67 CT05C 45 10/25/86 48.3 5.6 3,462 2,858 82.6 36 41 42 43 45 47 48 50 52 54 56 58 64 43 52 68.1 1.13 DE01C 40 09/26/86 33.2 6.2 605 573 94.7 17 23 26 28 30 32 34 36 38 40 41 44 47 28 37 60.2 0.89 ID01C 55 04/12/87 51.5 6.6 2,508 2,220 88.5 34 41 44 46 48 50 52 54 56 58 60 62 69 48 57 61.3 1.00 ID02C 55 04/12/87 51.5 6.6 2,508 2,220 88.5 34 41 44 46 48 50 52 54 56 58 60 62 69 48 57 61.3 1.00 IL02C 45 09/13/86 43.6 5.6 9,208 6,298 68.4 27 33 37 39 41 43 44 46 48 49 51 52 56 40 49 69.1 0.88 IN05C 45 11/12/86 48.0 6.6 1,321 1,235 93.5 30 37 40 42 44 47 49 51 53 55 56 59 62 44 53 58.5 0.90 IN06C 50 12/17186 51.0 6.6 4,593 3,887 84.6 33 40 43 45 48 50 52 54 56 58 59 62 65 48 57 59.3 0.90 IN07C 50 12/17/86 51.0 6.6 4,593 3,887 84.6 33 40 43 45 48 50 52 54 56 58 59 62 65 48 57 59.3 0.90 MA03C 30 10/31186 37.6 6.8 632 620 98.1 21 26 29 31 34 36 38 41 42 45 46 50 53 34 43 56.9 0.95 ME01C 45 10/15/86 46.5 7.5 364 356 97.8 29 33 36 39 42 45 48 50 52 54 56 59 62 45 54 53.1 0.78 NJ01C 40 11118186 44.4 6.3 2,747 2,357 85.8 25 35 37 39 41 43 45 47 49 51 52 55 60 40 49 63.4 1.00 NM02C 55 02/23/87 52.2 7.7 1,496 1,407 94.1 33 40 43 45 48 50 52 55 57 60 62 65 74 48 57 54.1 1.04
1 mi/h = 1.61 km/h Note: All speed limits and vehicle speeds are shown in milh.

Table 33. Before speed data for the comparison sites (continued).
Before
Comparison Posted Data Std. Free- Pet. 10-mi/h Pace
Site Speed Colleetion Mean Dev. Before Flow Free Percentile Speeds Lower Upper Pet. Skew.
Number Limit Date Speed Speeds Volume Volume Flow 1 5 10 15 25 35 50 65 75 85 90 95 99 Limit Limit Pace Index
Speed Limit Raised by 5 mi/h at Experimental Sites
AZ02C 30 03/30/87 31.0 5.7 2,100 1,946 92.7 18 22 25 26 28 29 31 33 35 38 39 41 46 27 36 64.2 1.06
AZ03C 30 04/01/87 32.1 6.9 2,715 2,483 91.5 14 19 24 26 29 31 33 35 37 39 41 43 48 29 38 61.2 0.86
CA06C 45 03/13/87 49.9 6.9 21,723 13,741 63.3 29 39 42 44 46 48 51 53 55 57 59 61 66 46 55 57.4 0.95
CA07C 45 03/13/87 49.9 6.9 21,723 13,741 63.3 29 39 42 44 46 48 51 53 55 57 59 61 66 46 55 57.4 0.95
C001C 30 04/04/87 32.0 4.7 754 708 93.9 22 25 27 28 29 31 32 34 35 37 38 40 46 28 37 74.3 1.08
C003C 30 02/02187 37.4 5.6 572 552 96.5 24 29 31 32 34 36 38 40 42 43 45 47 52 33 42 65.4 1.00
CT01C 45 10/05/86 49.2 6.6 18,424 12,193 66.2 26 39 42 44 46 48 50 52 54 56 57 59 64 46 55 61.8 0.94
DE05C 35 11115186 34.0 7.7 938 910 97.0 16 22 25 27 30 32 34 37 39 42 44 48 53 29 38 51.0 1.04 IN02C 25 09/10/86 25.2 5.7 6,505 4,981 76.6 12 16 19 20 22 24 26 28 29 31 33 35 41 21 30 64.4 0.94
IN03C 25 09/10/86 25.2 5.7 6,505 4,981 76.6 12 16 19 20 22 24 26 28 29 31 33 35 41 21 30 64.4 0.94
MD01C 50 08/03/86 54.5 6.6 2,943 2,508 85.2 35 43 47 49 51 53 56 57 59 61 63 65 70 51 60 61.7 0.84
MD02C 50 08/06/86 52.5 6.5 1,565 1,410 90.1 37 43 46 47 49 51 53 55 57 59 61 64 70 48 57 61.1 1.00
MD03C 50 08/07/86 53.0 5.7 6,123 4,335 70.8 41 45 47 48 50 51 53 55 57 58 60 63 71 48 57 68.9 1.13
MD04C 50 08/10/86 44.7 6.9 1,251 1,187 94.9 27 34 37 39 41 42 45 48 50 52 54 57 60 40 49 56.2 1.10
MD05C 50 08/12186 53.8 5.9 6,527 4,685 71.8 37 45 48 49 51 52 54 56 58 60 61 63 68 50 59 66.5 1.00
MD06C 30 08/16/86 34.9 7.2 1,730 1,650 95.4 18 22 25 28 31 33 36 38 40 42 44 46 51 33 42 55.5 0.82
MD07C 30 08/16/86 34.9 7.2 1,730 1,650 95.4 18 22 25 28 31 33 36 38 40 42 44 46 51 33 42 55.5 0.82
MD08C 30 08/16/86 34.9 7.2 1,730 1,650 95.4 18 22 25 28 31 33 36 38 40 42 44 46 51 33 42 55.5 0.82
MD09C 30 08/18/86 37.2 6.0 3,080 2,726 88.5 23 28 30 32 34 35 38 40 42 44 45 48 52 33 42 60.5 1.00
MD10C 50 08/19/86 50.1 5.2 8,562 5,288 61.8 36 42 44 46 48 49 51 52 54 55 57 58 62 46 55 71.9 0.86
MS02C 30 09/25/86 34.4 5.2 6,429 5,197 80.8 22 27 29 30 32 33 35 37 38 40 41 43 48 30 39 69.6 1.00
TN01C 55 09/03/86 59.2 6.1 1,705 1,605 94.1 44 50 52 54 56 57 60 62 63 66 67 70 75 55 64 62.2 1.00
TX06C 30 03/11/87 36.5 7.2 1,734 1,566 90.3 17 24 28 30 33 35 37 40 42 44 46 48 52 33 42 53.9 0.95
TX07C 35 03/13/87 33.0 5.3 6,045 5,159 85.3 20 25 27 28 30 32 33 36 37 39 40 42 47 29 38 68.2 1.07
TX08C 35 03/13/87 33.0 5.3 6,045 5,159 85.3 20 25 27 28 30 32 33 36 37 39 40 42 47 29 38 68.2 1.07
1 mi/h = 1.61 kmlh Note: All speed limits and vehicle speeds are shown in milh.

Table 33. Before speed data for the comparison sites (continued).
Comparison Posted Site Speed
Number Limit
Before Data
Collection Date
Std. Free-Mean Dev. Before Flow Speed Speeds Volume Volume
Speed Limit Raised by 10 or 15 mi/h at Experimental Sites
Pet. Free Flow
10-mi/h Pace Percentile Speeds Lower Upper Pet. Skew.
5 10 15 25 35 50 65 75 85 90 95 99 Limit Limit Pace Index
C002C 30 04/04/87 32.0 4.7 754 708 93.9 22 25 27 28 29 31 32 34 35 37 38 40 46 28 37 74.3 1.08 ID03C 20 04115187 21.3 5.3 434 431 99.3 10 13 15 17 18 20 22 24 25 28 29 30 36 17 26 67.3 0.93 ID04C 20 04/15/87 21.3 5.3 434 431 99.3 10 13 15 17 18 20 22 24 25 28 29 30 36 17 26 67.3 0.93 ID05C 20 04/15/87 21.3 5.3 434 431 99.3 10 13 15 17 18 20 22 24 25 28 29 30 36 17 26 67.3 0.93 ID06C 25 04/17/87 27.3 4.2 7,840 6,298 80.3 15 21 23 24 26 27 28 29 30 32 33 34 38 24 33 82.2 0.91 ID07C 25 06/04/88 28.0 4.2 7,041 5,844 83.0 16 22 24 25 26 27 29 30 31 32 33 35 39 24 33 81.5 0.91 ID08C 35 06/04/88 32.8 6.2 578 559 96.7 17 23 26 27 30 31 33 36 37 40 41 43 48 28 37 61.7 1.00 MA02C 30 10/29/86 37.9 6.3 581 563 96.9 23 27 30 32 34 36 39 41 42 45 46 49 53 33 42 59.7 0.95 ME03C 35 10/21/86 42.2 7.5 661 640 96.8 23 29 33 35 39 40 43 45 47 50 52 55 62 39 48 56.7 0.91 MS01C 35 09/23/86 43.7 7.8 2,882 2,613 90.7 22 30 34 37 40 42 45 47 49 52 53 56 61 41 50 51.9 0.82
.y.~~~~ ............... ~.~ .......... ~?~~~~~~ ... _ ..... ~~:~ .. -...... ~:.~ ... -... ~:~~~ ....... ~:~~? ....... ~:~ ....... ~? .. ~~ ... ~~ ... ~~ ... ~~ ... ~~ ... ~! ... ~~ ... ~ ... ~~ ... ~?. ... ~~ ... ~~ ....... ~~ ........... ~.~ .......... ?~ .. ~ ........ ~:.~~ .. CA04C 30 02/28/87 40.1 6.7 4,080 3,912 95.9 25 30 32 34 36 38 41 43 45 47 49 51 57 37 46 55.8 0.95 IN04C 30 11110186 34.7 7.6 521 507 97.3 13 18 24 29 32 34 36 38 40 42 44 46 51 32 41 60.9 0.75 TX01C 40 09/19/86 38.0 7.6 1,000 936 93.6 20 26 29 31 33 35 38 41 43 46 48 51 58 35 44 51.3 1.09
1 milh = 1.61 km/h Note: All speed limits and vehicle speeds are shown in mi/h.
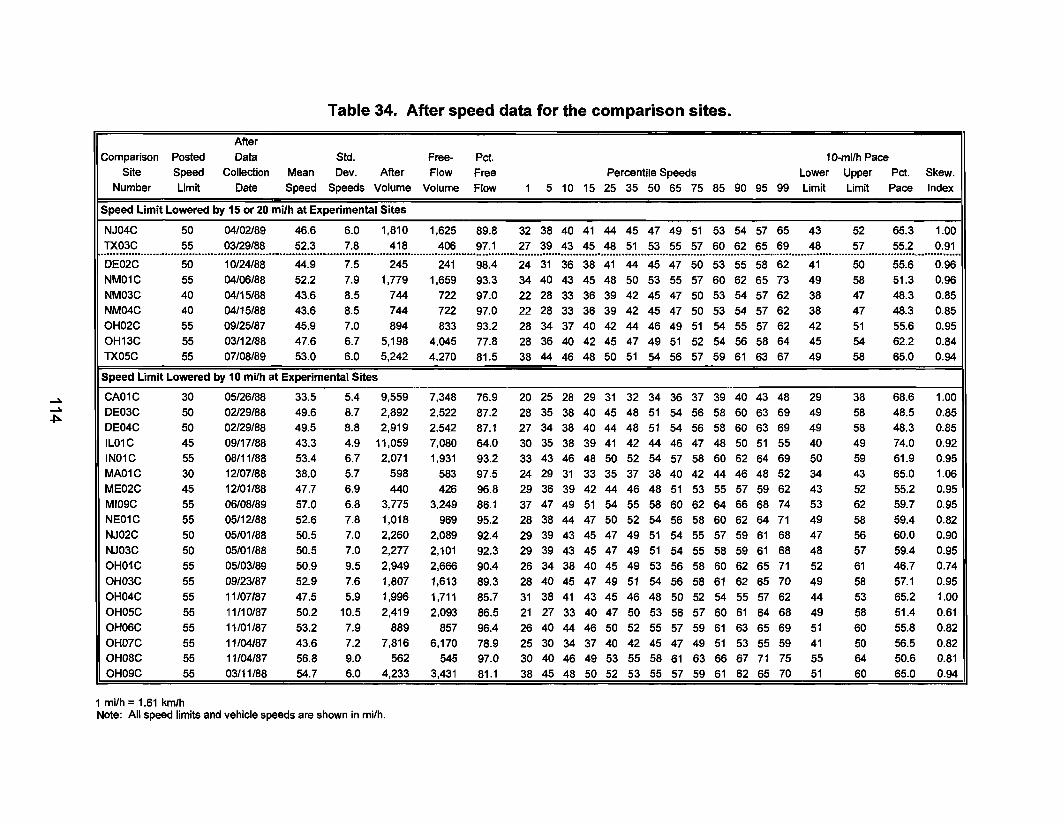
Table 34. After speed data for the comparison sites.
After Comparison Posted Data Std. Free- Pct. 10-mi/h Pace
Site Speed Collection Mean Dev. After Flow Free Percentile Speeds Lower Upper Pet. Skew. Number Limit Date Speed Speeds Volume Volume Flow 1 5 10 15 25 35 50 65 75 85 90 95 99 Limit Limit Pace Index
Speed Limit Lowered by 15 or 20 mi/h at Experimental Sites
NJ04C 50 04/02189 46.6 6.0 1.810 1.625 89.8 32 38 40 41 44 45 47 49 51 53 54 57 65 43 52 65.3 1.00 TX03C 55 03/29/88 52.3 7.8 418 406 97.1 27 39 43 45 48 51 53 55 57 60 62 65 69 48 57 55.2 0.91 ................................................................................ -.............. " ................................................................................................................................................................................................................ DE02C 50 10/24/88 44.9 7.5 245 241 98.4 24 31 36 38 41 44 45 47 50 53 55 58 62 41 50 55.6 0.96 NM01C 55 04/06/88 52.2 7.9 1.779 1.659 93.3 34 40 43 45 48 50 53 55 57 60 62 65 73 49 58 51.3 0.96 NM03C 40 04/15/88 43.6 8.5 744 722 97.0 22 28 33 36 39 42 45 47 50 53 54 57 62 38 47 48.3 0.85 NM04C 40 04115188 43.6 8.5 744 722 97.0 22 28 33 36 39 42 45 47 50 53 54 57 62 38 47 48.3 0.85 OH02C 55 09/25/87 45.9 7.0 894 833 93.2 28 34 37 40 42 44 46 49 51 54 55 57 62 42 51 55.6 0.95 OH13C 55 03/12/88 47.6 6.7 5.198 4.045 77.8 28 36 40 42 45 47 49 51 52 54 56 58 64 45 54 62.2 0.84 TX05C 55 07/08/89 53.0 6.0 5,242 4.270 81.5 38 44 46 48 50 51 54 56 57 59 61 63 67 49 58 65.0 0.94
Speed Limit Lowered by 10 mi/h at Experimental Sites
CA01C 30 05/26/88 33.5 5.4 9.559 7,348 76.9 20 25 28 29 31 32 34 36 37 39 40 43 48 29 38 68.6 1.00 DE03C 50 02129188 49.6 8.7 2,892 2.522 87.2 28 35 38 40 45 48 51 54 56 58 60 63 69 49 58 48.5 0.85 DE04C 50 02/29/88 49.5 8.8 2.919 2.542 87.1 27 34 38 40 44 48 51 54 56 58 60 63 69 49 58 48.3 0.85 IL01C 45 09/17/88 43.3 4.9 11.059 7.080 64.0 30 35 38 39 41 42 44 46 47 48 50 51 55 40 49 74.0 0.92 IN01C 55 08/11/88 53.4 6.7 2.071 1.931 93.2 33 43 46 48 50 52 54 57 58 60 62 64 69 50 59 61.9 0.95 MA01C 30 12/07/88 38.0 5.7 598 583 97.5 24 29 31 33 35 37 38 40 42 44 46 48 52 34 43 65.0 1.06 ME02C 45 12/01/88 47.7 6.9 440 426 96.8 29 36 39 42 44 46 48 51 53 55 57 59 62 43 52 55.2 0.95 MI09C 55 06/08/89 57.0 6.8 3,775 3,249 86.1 37 47 49 51 54 55 58 60 62 64 66 68 74 53 62 59.7 0.95 NE01C 55 05/12188 52.6 7.8 1,018 969 95.2 28 38 44 47 50 52 54 56 58 60 62 64 71 49 58 59.4 0.82 NJ02C 50 05/01/88 50.5 7.0 2.260 2,089 92.4 29 39 43 45 47 49 51 54 55 57 59 61 68 47 56 60.0 0.90 NJ03C 50 05/01/88 50.5 7.0 2.277 2,101 92.3 29 39 43 45 47 49 51 54 55 58 59 61 68 48 57 59.4 0.95 OH01C 55 05/03/89 50.9 9.5 2.949 2.666 90.4 26 34 38 40 45 49 53 56 58 60 62 65 71 52 61 46.7 0.74 OH03C 55 09/23/87 52.9 7.6 1,807 1.613 89.3 28 40 45 47 49 51 54 56 58 61 62 65 70 49 58 57.1 0.95 OH04C 55 11/07/87 47.5 5.9 1.996 1.711 85.7 31 38 41 43 45 46 48 50 52 54 55 57 62 44 53 65.2 1.00 OH05C 55 11110/87 50.2 10.5 2,419 2.093 86.5 21 27 33 40 47 50 53 56 57 60 61 64 68 49 58 51.4 0.61 OH06C 55 11/01/87 53.2 7.9 889 857 96.4 26 40 44 46 50 52 55 57 59 61 63 65 69 51 60 55.8 0.82 OH07C 55 11/04/87 43.6 7.2 7.816 6.170 78.9 25 30 34 37 40 42 45 47 49 51 53 55 59 41 50 56.5 0.82 OH08C 55 11/04/87 56.8 9.0 562 545 97.0 30 40 46 49 53 55 58 61 63 66 67 71 75 55 64 50.6 0.81 OH09C 55 03/11/88 54.7 6.0 4,233 3,431 81.1 38 45 48 50 52 53 55 57 59 61 62 65 70 51 60 65.0 0.94
1 mi/h = 1.61 km/h Note: All speed limits and vehicle speeds are shown in mi/h.

Table 34. After speed data for the comparison sites (continued).
After Comparison Posted Data Std. Free- Pct. 10-milh Pace
Site Speed Collection Mean Dev. After Flow Free Percentile Speeds Lower Upper Pct. Skew.
Number Limit Date Speed Speeds Volume Volume Flow 1 5 10 15 25 35 50 65 75 85 90 95 99 Limit Limit Pace Index
Speed Limit Lowered by 10 mi/h at Experimental Sites (continued)
OH10C 55 03/11/88 54.7 6.0 4,233 3,431 81.1 38 45 48 50 52 53 55 57 59 61 62 65 70 51 60 65.0 0.94
OH11C 50 11/10/87 41.6 6.2 1,513 1,431 94.6 24 31 35 36 38 40 42 44 46 48 50 52 56 38 47 63.2 1.00
OH12C 55 05/03/88 52.3 6.8 2,153 1,970 91.5 33 41 45 46 49 51 53 55 57 59 61 63 69 50 59 59.3 0.95
OK01C 45 07109/89 47.6 6.4 6,794 6,309 92.9 27 37 41 43 45 46 48 50 52 54 55 58 62 44 53 64.1 1.00
OK04C 35 03/27/88 31.7 5.6 6,937 5,524 79.6 18 22 25 27 29 30 32 34 36 38 39 41 46 28 37 67.2 1.00
TX02C 55 03/29/88 52.3 7.8 418 406 97.1 27 39 43 45 48 51 53 55 57 60 62 65 69 48 57 55.2 0.91
TX04C 55 04/04/88 51.3 7.3 1,526 1,420 93.1 33 40 43 45 47 49 52 55 57 59 61 63 69 48 57 53.5 0.95
VA01C 55 08/07/87 46.0 5.9 9,407 6,547 69.6 30 37 40 41 43 45 47 49 50 52 53 56 60 42 51 65.0 0.88
VA03C 55 11/16/87 45.8 8.4 1,154 1,073 93.0 21 30 35 38 42 44 48 50 52 54 56 58 62 45 54 50.9 0.72
VA04C 55 11/16/87 45.8 8.4 1,154 1,073 93.0 21 30 35 38 42 44 48 50 52 54 56 58 62 45 54 50.9 0.72
VA05C 55 06/26/88 46.8 8.1 1,111 1,052 94.7 20 33 37 40 43 45 48 51 53 55 56 59 62 46 55 50.8 0.87
VA07C 55 10/27/87 50.2 8.3 2,150 1,940 90.2 29 37 40 42 45 48 51 54 57 59 61 64 67 47 56 45.7 0.92
WV03C 45 11107/87 38.7 8.9 707 648 91.7 18 23 26 29 34 37 40 43 46 48 50 52 57 38 47 46.1 0.81
Speed Limit Lowered by 5 mi/h at Experimental Sites
AZ01C 45 04/09/88 46.7 6.3 1,735 1,614 93.0 29 37 40 41 43 45 47 50 51 53 55 57 62 43 52 62.5 1.00
CT02C 45 12/06/88 40.3 9.0 5,050 4,072 80.6 21 24 26 29 35 39 43 45 47 49 51 53 58 41 50 49.7 0.67
CT05C 45 12/03/88 49.4 5.6 3,885 3,210 82.6 36 41 43 45 46 48 50 52 53 55 57 59 65 45 54 67.0 1.07
DE01C 40 10/28/88 34.1 7.4 531 502 94.5 18 22 24 27 30 32 35 37 40 42 44 47 52 29 38 51.4 0.96
ID01C 55 10104/88 51.6 5.7 3,550 2,765 77.9 37 43 46 47 49 50 52 54 56 57 59 61 66 48 57 67.8 1.00
ID02C 55 10104/88 51.6 5.7 3,550 2,765 77.9 37 43 46 47 49 50 52 54 56 57 59 61 66 48 57 67.8 1.00
IL02C 45 09117188 43.3 4.9 11,059 7,080 64.0 30 35 38 39 41 42 44 46 47 48 50 51 55 40 49 74.0 0.92
IN05C 45 03/24/88 48.1 6.1 1,311 1,197 91.3 32 38 41 43 45 47 49 51 53 54 56 58 62 45 54 62.9 0.89
IN06C 50 08/09/88 51.2 6.5 5,351 4,495 84.0 33 40 44 45 48 50 52 54 56 58 59 62 66 48 57 59.5 0.95
IN07C 50 08/09/88 51.2 6.5 5,351 4,495 84.0 33 40 44 45 48 50 52 54 56 58 59 62 66 48 57 59.5 0.95
MA03C 30 12108188 37.6 6.5 638 615 96.4 21 27 30 32 34 36 39 40 42 44 46 49 52 34 43 60.3 0.90
ME01C 45 12/01/88 47.7 6.9 440 426 96.8 29 36 39 42 44 46 48 51 53 55 57 59 62 43 52 55.2 0.95
NJ01C 40 04/03/89 44.0 6.0 2,594 2,248 86.7 24 35 38 39 41 43 45 47 48 50 51 54 58 40 49 66.1 0.94
NM02C 55 04/06/88 52.2 7.9 1,779 1,659 93.3 34 40 43 45 48 50 53 55 57 60 62 65 73 49 58 51.3 0.96
1 milh = 1.61 krn/h Note: All speed limits and vehicle speeds are shown in milh.
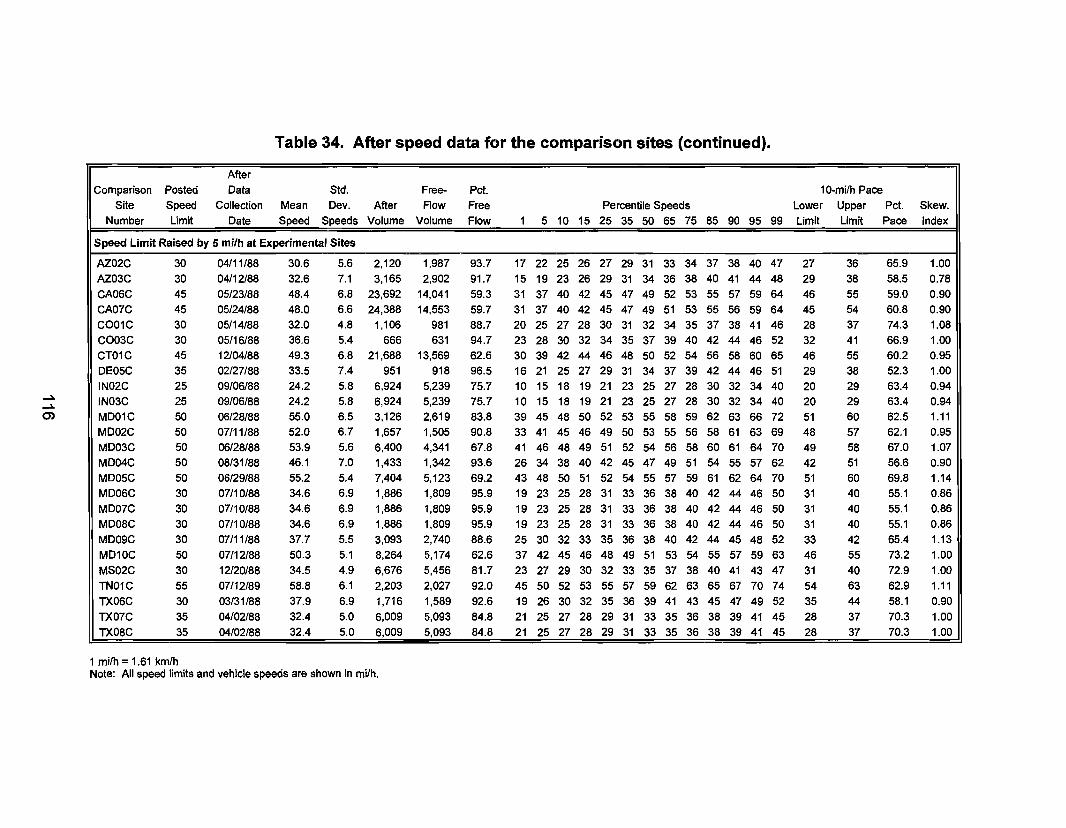
Table 34. After speed data for the comparison sites (continued).
After Comparison Posted Data Std. Free- Pet. 10-mi/h Pace
Site Speed Collection Mean Oev. After Flow Free Percentile Speeds Lower Upper Pct. Skew. Number Limit Date Speed Speeds Volume Volume Flow 1 5 10 15 25 35 50 65 75 85 90 95 99 Limit Limit Pace Index
Speed Limit Raised by 5 milh at Experimental Sites
AZ02C 30 04/11/88 30.6 5.6 2,120 1,987 93.7 17 22 25 26 27 29 31 33 34 37 38 40 47 27 36 65.9 1.00 AZ03C 30 04/12/88 32.6 7.1 3,165 2,902 91.7 15 19 23 26 29 31 34 36 38 40 41 44 48 29 38 58.5 0.78 CA06C 45 05/23/88 48.4 6.8 23,692 14,041 59.3 31 37 40 42 45 47 49 52 53 55 57 59 64 46 55 59.0 0.90 CA07C 45 05/24/88 48.0 6.6 24,388 14,553 59.7 31 37 40 42 45 47 49 51 53 55 56 59 64 45 54 60.8 0.90 COO1C 3D 05/14/88 32.0 4.8 1,106 981 88.7 20 25 27 28 30 31 32 34 35 37 38 41 46 28 37 74.3 1.08 C003C 30 05/16/88 36.6 5.4 666 631 94.7 23 28 30 32 34 35 37 39 40 42 44 46 52 32 41 66.9 1.00 CT01C 45 12/04/88 49.3 6.8 21,688 13,569 62.6 30 39 42 44 46 48 50 52 54 56 58 60 65 46 55 60.2 0.95 OE05C 35 02/27/88 33.5 7.4 951 918 96.5 16 21 25 27 29 31 34 37 39 42 44 46 51 29 38 52.3 1.00 IN02C 25 09/06/88 24.2 5.8 6,924 5,239 75.7 10 15 18 19 21 23 25 27 28 30 32 34 40 20 29 63.4 0.94 IN03C 25 09/06/88 24.2 5.8 6,924 5,239 75.7 10 15 18 19 21 23 25 27 28 30 32 34 40 20 29 63.4 0.94 MOO1C 50 06/28/88 55.0 6.5 3,126 2,619 83.8 39 45 48 50 52 53 55 58 59 62 63 66 72 51 60 62.5 1.11 M002C 50 07/11/88 52.0 6.7 1,657 1,505 90.8 33 41 45 46 49 50 53 55 56 58 61 63 69 48 57 62.1 0.95
M003C 50 06/28/88 53.9 5.6 6,400 4,341 67.8 41 46 48 49 51 52 54 56 58 60 61 64 70 49 58 67.0 1.07 M004C 50 08/31/88 46.1 7.0 1,433 1,342 93.6 26 34 38 40 42 45 47 49 51 54 55 57 62 42 51 56.6 0.90 M005C 50 06/29/88 55.2 5.4 7,404 5,123 69.2 43 48 50 51 52 54 55 57 59 61 62 64 70 51 60 69.8 1.14 M006C 30 07/10/88 34.6 6.9 1,886 1,809 95.9 19 23 25 28 31 33 36 38 40 42 44 46 50 31 40 55.1 0.86 M007C 30 07/10/88 34.6 6.9 1,886 1,809 95.9 19 23 25 28 31 33 36 38 40 42 44 46 50 31 40 55.1 0.86 M008C 30 07/10/88 34.6 6.9 1,886 1,809 95.9 19 23 25 28 31 33 36 38 40 42 44 46 50 31 40 55.1 0.86 M009C 30 07111/88 37.7 5.5 3,093 2,740 88.6 25 30 32 33 35 36 38 40 42 44 45 48 52 33 42 65.4 1.13
M010C 50 07/12/88 50.3 5.1 8,264 5,174 62.6 37 42 45 46 48 49 51 53 54 55 57 59 63 46 55 73.2 1.00
MS02C 30 12/20/88 34.5 4.9 6,676 5,456 81.7 23 27 29 30 32 33 35 37 38 40 41 43 47 31 40 72.9 1.00 TN01C 55 07/12/89 58.8 6.1 2,203 2,027 92.0 45 50 52 53 55 57 59 62 63 65 67 70 74 54 63 62.9 1.11
TX06C 30 03/31/88 37.9 6.9 1,716 1,589 92.6 19 26 30 32 35 36 39 41 43 45 47 49 52 35 44 58.1 0.90
TX07C 35 04/02/88 32.4 5.0 6,009 5,093 84.8 21 25 27 28 29 31 33 35 36 38 39 41 45 28 37 70.3 1.00
TX08C 35 04/02/88 32.4 5.0 6,009 5,093 84.8 21 25 27 28 29 31 33 35 36 38 39 41 45 28 37 70.3 1.00
1 mi/h = 1.61 km/h Note: All speed limits and vehicle speeds are shown in mi/h.

Table 34. After speed data for the comparison sites (continued).
Comparison Site
Number
Posted Speed Limit
After Data
Collection Date
Std. Free-Mean Dev. After Flow Speed Speeds Volume Volume
Speed Limit Raised by 10 or 15 mi/h at Experimental Sites
Pct. Free Flow
Percentile Speeds 5 10 15 25 35 50 65 75 85 90 95 99
10-mi/h Pace Lower Upper Pet. Limit Limit Pace
Skew. Index
C002C 30 05/14/88 32.0 4.8 1,106 981 88.7 20 25 27 28 30 31' 32 34 35 37 38 41 46 28 37 74.3 1.08 ID03C 20 10103/88 21.3 4.8 401 390 97.3 10 13 15 17 19 20 22 24 25 26 27 28 35 18 27 73.6 0.86 ID04C 20 10/03/88 21.3 4.8 401 390 97.3 10 13 15 17 19 20 22 24 25 26 27 28 35 18 27 73.6 0.86 ID05C 20 10103/88 21.3 4.8 401 390 97.3 10 13 15 17 19 20 22 24 25 26 27 28 35 18 27 73.6 0.86 ID06C 25 09/30/88 27.2 4.3 8,091 6,287 77.7 15 20 23 24 25 26 28 29 30 32 33 34 38 23 32 80.1 0.92 ID07C 25 09/30/88 27.2 4.3 8,091 6,287 77.7 15 20 23 24 25 26 28 29 30 32 33 34 38 23 32 80.1 0.92 ID08C 35 10101188 32.6 5.8 489 465 95.1 19 22 26 27 30 31 33 35 37 38 40 43 47 29 38 64.9 0.89 MA02C 30 12/07/88 38.0 5.7 598 583 97.5 24 29 31 33 35 37 38 40 42 44 46 48 52 34 43 65.0 1.06 ME03C 35 11/30/88 42.8 7.6 705 674 95.6 21 30 34 36 39 41 44 46 48 50 53 55 60 40 49 55.0 0.91 MS01C 35 12/19/88 45.1 7.6 3,378 3,025 89.6 26 32 36 38 41 43 46 48 51 53 55 57 64 42 51 53.1 0.91
.~~~~~ ............... ~.~ .......... ~~~~~~~~ ... _ ..... ~~:~ .. _ ...... ~:~ ....... ~:~~~ ....... ~:.~~? ....... ~~:~ ....... ~~ ... ~~ ... ~~ ... ~~ ... ~~ ... ~~ ... ~.~ ... ~~ ... ~~ ... ~~ ... ~~ ... ~~ ... ~~ ....... ~.? ........ :~~ .......... ~~'.? ........ ~:9~ .. CA04C 30 05/21188 38.8 7.1 5,066 4,722 93.2 23 26 29 32 35 37 40 42 44 46 48 50 55 36 45 56.4 0.82 IN04C 30 04/18/88 35.8 7.4 593 574 96.8 15 20 28 30 33 35 37 39 40 43 45 47 51 31 40 59.2 0.82 TX01C 40 12/16/88 36.8 7.3 906 889 98.1 22 25 28 30 32 34 37 40 42 44 46 49 57 32 41 53.0 1.00
1 mi/h = 1.61 km/h Note: All speed limits and vehicle speeds are shown in milh.

Table 35. Differences in speed characteristics for the comparison sites.
Comparison Posted Std. Free- Pct. 10-mUh Pace Site Speed Mean Dev. Total Flow Free Percentile Speeds Lower Upper Pet. Skew.
Number Limit Speed Speeds Volume Volume Flow 1 5 10 15 25 35 50 65 75 85 90 95 99 Limit Limit Pace Index
Speed Limit Lowered by 15 or 20 mi/h at Experimental Sites
NJ04C 50 -1.0 0.5 370 346 1.0 -1 -1 -2 -2 -1 -1 -1 -1 0 -1 -1 0 4 0 0 -2.9 -0.07 TX03C 55 2.7 -2.6 -41 -41 -0.3 8 11 5 4 3 3 2 0 0 1 0 1 -2 0 0 10.7 0.05
...................................................................................................... , ....................... _ ............................. _.0 ....................... ........... ~ ••••• _ ........................... _ ................ .......................................................... 00 ................
DE02C 50 0.4 0.6 32 31 -0.2 -1 -1 0 -1 -1 1 0 0 1 2 2 2 3 -1 -1 -5.8 0.05 NM01C 55 0.0 0.2 283 252 -0.8 1 0 0 0 0 0 1 0 0 0 0 0 -1 1 1 -2.8 -0.08 NM03C 40 -0.6 -1.3 167 163 0.1 2 3 2 1 -1 0 -1 -2 -1 -1 -3 -3 -5 -3 -3 2.0 0.08 NM04C 40 -0.6 -1.3 167 163 0.1 2 3 2 1 -1 0 -1 -2 -1 -1 -3 -3 -5 -3 -3 2.0 0.08 OH02C 55 -0.7 -0.2 226 191 -2.9 -1 -1 -1 0 -1 -1 -1 -1 -1 -1 -2 -2 -1 -1 -1 3.1 -0.05 OH13C 55 0.1 0.5 -1,319 -789 3.6 -2 -2 -1 0 0 1 1 1 0 0 1 0 1 2 2 -2.7 -0.10 TX05C 55 0.4 -0.4 961 743 -0.9 5 1 0 1 0 0 1 0 0 0 0 0 -1 0 0 1.7 -0.06
Speed Limit Lowered by 10 mi/h at Experimental Sites
CA01C 30 -0.5 -0.2 870 568 -1.1 -1 0 1 0 0 0 0 0 -1 -1 -2 -1 -1 -1 -1 3.9 -0.06 DE03C 50 0.1 0.1 -113 -110 -0.4 0 0 0 0 0 0 0 0 0 0 0 1 0 0 0 0.6 0.05 DE04C 50 0.2 0.1 -86 -82 -0.2 0 0 0 0 0 1 0 0 0 0 0 1 0 0 0 1.0 0.05 IL01C 45 -0.3 -0.7 1,851 782 -4.4 3 2 1 0 0 -1 0 0 -1 -1 -1 -1 -1 0 0 4.9 0.04 IN01C 55 0.5 0.1 78 70 -0.2 -1 1 1 1 0 1 0 1 0 0 1 1 0 0 0 2.1 0.06 MA01C 30 0.1 -0.6 17 20 0.6 1 2 1 1 1 1 -1 -1 0 -1 0 -1 -1 1 1 5.3 0.11 ME02C 45 1.2 -0.6 76 70 -1.0 0 3 3 3 2 1 0 1 1 1 1 0 0 -2 -2 2.1 0.17 MI09C 55 0.3 -0.4 595 430 -2.5 0 2 1 1 1 0 0 0 0 0 1 -1 0 0 0 1.4 0.09 NE01C 55 0.5 -0.5 197 185 -0.3 2 1 2 2 1 1 0 0 1 1 0 0 3 0 0 0.2 0.15 NJ02C 50 -0.1 -0.9 99 75 -0.8 1 2 2 1 0 0 -1 0 -1 -2 -1 -2 -1 1 1 8.1 0.03 NJ03C 50 0.3 -0.7 232 187 -1.3 1 1 2 2 1 1 0 0 -1 0 -1 -1 -1 1 1 6.8 0.04 OH01C 55 -0.7 0.1 -771 -586 3.0 0 -1 0 -1 -2 -1 -1 -1 0 -1 0 0 -1 0 0 -2.9 0.03 OH03C 55 0.0 -0.1 316 254 -1.8 -1 0 1 0 -1 -1 0 0 0 0 0 0 0 0 0 -0.1 0.00 OH04C 55 0.7 0.0 -830 -455 9.1 -1 1 1 2 1 0 0 1 1 1 1 0 -1 1 1 0.0 0.18 OH05C 55 0.2 -0.6 -352 -319 -0.5 1 0 2 3 0 0 -1 0 -1 1 0 0 -2 -1 -1 -2.0 0.13 OH06C 55 0.5 0.5 35 34 0.0 -8 0 1 0 2 2 2 1 1 0 1 0 0 1 1 4.5 -0.14 OH07C 55 -0.2 -1.2 1,282 823 -2.9 2 1 2 2 1 0 -1 -1 -1 -1 -1 -1 -3 -2 -2 6.4 0.10 OH08C 55 0.4 0.5 8 20 2.2 0 2 0 -1 0 -1 0 1 1 1 1 3 3 1 1 -4.8 0.06 OH09C 55 0.3 -0.4 1,276 807 -7.6 1 1 1 1 0 0 0 0 1 0 0 0 -1 1 1 -0.3 -0.06 OH10C 55 0.3 -0.4 1,276 807 -7.6 1 1 1 1 0 0 0 0 1 0 0 0 -1 1 1 -0.3 -0.06
1 mi/h = 1.61 km/h Note: All speed limits and vehicle speeds are shown in mi/h.

Table 35. Differences in speed characteristics for the comparison sites (continued).
Comparison Posted Std. Free- Pet. 10-mVh Pace
Site Speed Mean Dev. Total Flow Free Percentile Speeds Lower Upper Pet. Skew.
Number Limit Speed Speeds Volume Volume Flow 1 5 10 15 25 35 50 65 75 85 90 95 99 Limit Limit Pace Index
Speed Limit Lowered by 10 mi/h at Experimental Sites (continued)
OH11C 50 0.0 -0.2 186 173 -0.2 1 -2 0 0 0 0 0 -1 0 0 0 0 -1 0 0 2.1 -0.06
OH12C 55 -1.0 -0.6 318 256 -1.9 1 -1 0 -1 -1 -1 -1 -2 -1 -2 -1 -2 -2 0 0 1.7 -0.05
OK01C 45 1.0 -0.6 338 347 0.6 3 1 2 2 2 1 1 0 1 0 0 0 ·1 1 1 4.0 -0.05
OK04C 35 -0.3 0.1 -321 -19 3.2 1 -1 -1 0 0 -1 -1 -1 0 0 0 0 1 -1 -1 -1.9 0.12
TX02C 55 2.7 -2.6 -41 -41 -0.3 8 11 5 4 3 3 2 0 0 1 0 1 -2 0 0 10.7 0.05
TX04C 55 0.8 -1.3 923 845 -2.3 1 3 3 2 2 1 1 1 1 0 -1 -2 -4 2 2 6.7 -0.09
VA01C 55 1.3 -0.2 1,434 655 -4.3 3 2 2 2 1 2 1 1 1 1 0 2 2 1 1 2.0 -0.06
VA03C 55 0.6 1.7 187 157 -1.7 -7 -4 -2 -1 1 1 2 2 2 1 2 1 1 4 4 -4.3 . -0.23
VA04C 55 0.6 1.7 187 157 -1.7 -7 -4 -2 -1 1 1 2 2 2 1 2 1 1 4 4 -4.3 -0.23
VA05C 55 1.6 1.4 144 136 0.0 -8 -1 0 1 2 2 2 3 3 2 2 2 1 5 5 -4.4 -0.08
VA07C 55 0.8 0.2 6 15 0.4 3 1 1 0 0 0 0 1 2 2 2 2 0 1 1 -4.9 0.14
WV03C 45 -0.3 1.1 -328 -318 -1.6 -2 -2 -3 -2 -1 0 0 0 1 1 1 0 0 2 2 -4.8 -0.11
Speed Limit Lowered by 5 mi/h at Experimental Sites
AZ01C 45 -0.2 -0.2 -22 -23 -0.2 -1 0 1 0 -1 0 -1 0 0 -1 0 -1 -1 0 0 2.1 0.05 CT02C 45 -0.4 0.2 289 178 -1.2 3 2 -3 -3 -2 -1 0 -1 0 0 0 0 0 1 1 -2.0 0.00
CT05C 45 1.1 0.0 423 352 0.0 0 0 1 2 1 1 2 2 1 1 1 1 1 2 2 -1.1 -0.06
DE01C 40 0.9 1.2 -74 -71 -0.2 1 -1 -2 -1 0 0 1 1 2 2 3 3 5 1 1 -8.8 0.07
ID01C 55 0.1 -0.9 1,042 545 -10.6 3 2 2 1 1 0 0 0 0 -1 -1 -1 -3 0 0 6.5 0.00
ID02C 55 0.1 -0.9 1,042 545 -10.6 3 2 2 1 1 0 0 0 0 -1 -1 -1 -3 0 0 6.5 0.00
IL02C 45 -0.3 -0.7 1,851 782 -4.4 3 2 1 0 0 -1 0 0 -1 -1 -1 -1 -1 0 0 4.9 0.04
IN05C 45 0.1 -0.5 -10 -38 -2.2 2 1 1 1 1 0 0 0 0 -1 0 -1 0 1 1 4.4 -0.01
IN06C 50 0.2 -0.1 758 608 -0.6 0 0 1 0 0 0 0 0 0 0 0 0 1 0 0 0.2 0.05
IN07C 50 0.2 -0.1 758 608 -0.6 0 0 1 0 0 0 0 0 0 0 0 0 1 0 0 0.2 0.05
MA03C 30 0.0 -0.3 6 -5 -1.7 0 1 1 1 0 0 1 -1 0 -1 0 -1 -1 0 0 3.4 -0.05
ME01C 45 1.2 -0.6 76 70 -1.0 0 3 3 3 2 1 0 1 1 1 1 0 0 -2 -2 2.1 0.17
NJ01C 40 -0.4 -0.3 -153 -109 0.9 -1 0 1 0 0 0 0 0 -1 -1 -1 -1 -2 0 0 2.7 -0.06
NM02C 55 0.0 0.2 283 252 -0.8 1 0 0 0 0 0 1 0 0 0 0 0 -1 1 1 -2.8 -0.08
1 mi/h = 1.61 krnlh Note: All speed limits and vehicle speeds are shown in mVh.

Table 35. Differences in speed characteristics for the comparison sites (continued).
Comparison Posted Std. Free- Pet. 10-mi/h Pace Site Speed Mean Oev. Total Flow Free Percentile Speeds Lower Upper Pet. Skew.
Number Limit Speed Speeds Volume Volume Flow 1 5 10 15 25 35 50 65 75 85 90 95 99 Limit Limit Pace Index
Speed Limit Raised by 5 mi/h at Experimental Sites
AZ02C 30 -0.4 -0.1 20 41 1.0 -1 0 0 0 -1 0 0 0 -1 -1 -1 -1 1 0 0 1.7 -0.06 AZ03C 30 0.5 0.2 450 419 0.2 1 0 -1 0 0 0 1 1 1 1 0 1 0 0 0 -2.7 -0.08 CA06C 45 -1.5 -0.1 1,969 300 -4.0 2 -2 -2 -2 -1 -1 -2 -1 -2 -2 -2 -2 -2 0 0 1.6 -0.05 CA07C 45 -1.9 -0.3 2,665 812 -3.6 2 -2 -2 -2 -1 -1 -2 -2 -2 -2 -3 -2 -2 -1 -1 3.4 -0.05 C001C 30 0.0 0.1 352 273 -5.2 -2 0 0 0 1 0 0 0 0 0 0 1 0 0 0 0.0 0.00 C003C 30 -0.8 -0.2 94 79 -1.8 -1 -1 -1 0 0 -1 ·1 -1 -2 -1 -1 -1 0 -1 -1 1.5 0.00 CT01C 45 0.1 0.2 3,264 1,376 -3.6 4 0 0 0 0 0 0 0 0 0 1 1 1 0 0 -1.6 0.01 OE05C 35 -0.5 -0.3 13 8 -0.5 0 -1 0 0 -1 -1 0 0 0 0 0 -2 -2 0 0 1.3 -0.04 IN02C 25 -1.0 0.1 419 258 -0.9 -2 -1 -1 -1 -1 -1 -1 -1 -1 -1 -1 -1 -1 -1 -1 -1.0 0.00 IN03C 25 -1.0 0.1 419 258 -0.9 -2 -1 -1 -1 -1 -1 -1 -1 -1 -1 -1 -1 -1 -1 -1 -1.0 0.00 M001C 50 0.5 -0.1 183 111 -1.4 4 2 1 1 1 0 -1 1 0 1 0 1 2 0 0 0.8 0.27 M002C 50 -0.5 0.2 92 95 0.7 -4 -2 -1 ·1 0 -1 0 0 -1 -1 0 -1 -1 0 0 1.0 -0.05 M003C 50 0.9 -0.1 277 6 -3.0 0 1 1 1 1 1 1 1 1 2 1 1 -1 1 1 -1.9 -0.06 M004C 50 1.4 0.1 182 155 -1.3 -1 0 1 1 1 3 2 1 1 2 1 0 2 2 2 0.4 -0.20 M005C 50 1.4 -0.5 877 438 -2.6 6 3 2 2 1 2 1 1 1 1 1 1 2 1 1 3.3 0.14 M006C 30 -0.3 -0.3 156 159 0.5 1 1 0 0 0 0 0 0 0 0 0 0 -1 -2 -2 -0.4 0.04 M007C 30 -0.3 -0.3 156 159 0.5 1 1 0 0 0 0 0 0 0 0 0 0 -1 -2 -2 -0.4 0.04 M008C 30 -0.3 -0.3 156 159 0.5 1 1 0 0 0 0 0 0 0 0 0 0 -1 -2 -2 -0.4 0.04 M009C 30 0.5 -0.5 13 14 0.1 2 2 2 1 1 1 0 0 0 0 0 0 0 0 0 4.9 0.13 M010C 50 0.2 -0.1 -298 -114 0.8 1 0 1 0 0 0 0 1 0 0 0 1 1 0 0 1.3 0.14 MS02C 30 0.1 -0.3 247 259 0.9 1 0 0 0 0 0 0 0 0 0 0 0 -1 1 1 3.3 0.00 TN01C 55 -0.4 0.0 498 422 -2.1 1 0 0 -1 -1 0 -1 0 0 -1 0 0 -1 -1 -1 0.7 0.11 TX06C 30 1.4 -0.3 -18 23 2.3 2 2 2 2 2 1 2 1 1 1 1 1 0 2 2 4.2 -0.05 TX07C 35 -0.6 -0.3 -36 -66 -0.5 1 0 0 0 -1 -1 0 -1 -1 -1 -1 -1 -2 -1 -1 2.1 -0.07 TX08C 35 -0.6 -0.3 -36 -66 -0.5 1 0 0 0 -1 -1 0 -1 -1 -1 -1 -1 -2 -1 -1 2.1 -0.07
Speed Limit Raised by 10 or 15 mi/h at Experimental Sites
C002C 30 0.0 0.1 352 273 -5.2 -2 0 0 0 1 0 0 0 0 0 0 1 0 0 0 0.0 0.00 I003C 20 0.0 -0.5 -33 -41 -2.0 0 0 0 0 1 0 0 0 0 -2 -2 -2 -1 1 1 6.3 -0.07 I004C 20 0.0 -0.5 -33 -41 -2.0 0 0 0 0 1 0 0 0 0 -2 -2 -2 -1 1 1 6.3 -0.07 I005C 20 0.0 -0.5 -33 -41 -2.0 0 0 0 0 1 0 0 0 0 -2 -2 -2 -1 1 1 6.3 -0.07
1 mi/h = 1.61 km/h Note: All speed limits and vehicle speeds are shown in mi/h.
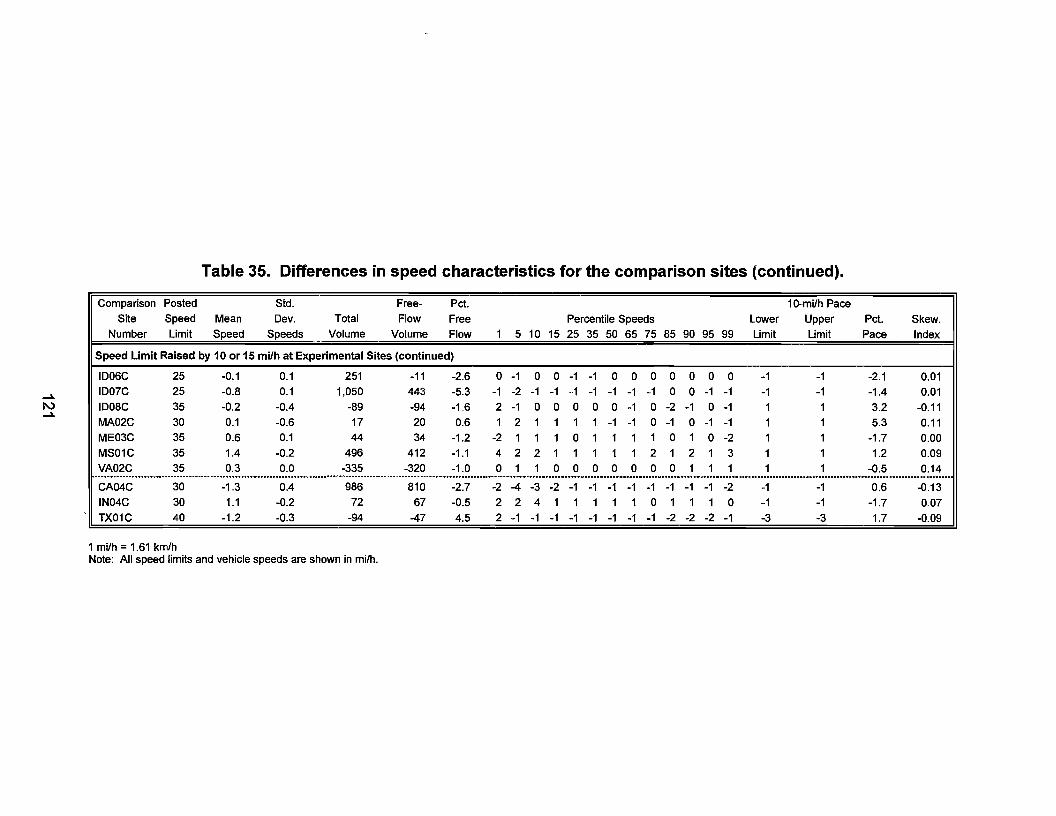
Table 35. Differences in speed characteristics for the comparison sites (continued).
Comparison Posted Std. Free- Pct. 10-mi/h Pace Site Speed Mean Dev. Total Flow Free Percentile Speeds Lower Upper Pet. Skew.
Number Limit Speed Speeds Volume Volume Flow 1 5 10 15 25 35 50 65 75 85 90 95 99 Limit Limit Pace Index
Speed Limit Raised by 10 or 15 mi/h at Experimental Sites (continued)
ID06C 25 -0.1 0.1 251 -11 -2.6 0 -1 0 0 -1 -1 0 0 0 0 0 0 0 -1 -1 -2.1 0.01
....... ID07C 25 -0.8 0.1 1,050 443 -5.3 -1 -2 -1 -1 -1 -1 -1 -1 -1 0 0 -1 -1 -1 -1 -1.4 0.01 N ID08C 35 -0.2 -0.4 -89 -94 -1.6 2 -1 0 0 0 0 0 -1 0 -2 -1 0 -1 1 1 3.2 -0.11 .......
MA02C 30 0.1 -0.6 17 20 0.6 1 2 1 1 1 1 -1 -1 0 -1 0 -1 -1 1 1 5.3 0.11 ME03C 35 0.6 0.1 44 34 -1.2 -2 1 1 1 0 1 1 1 1 0 1 0 -2 1 1 -1.7 0.00 MS01C 35 1.4 -0.2 496 412 -1.1 4 2 2 1 1 1 1 1 2 1 2 1 3 1 1 1.2 0.09 VA02C 35 0.3 0.0 -335 -320 -1.0 0 1 1 0 0 0 0 0 0 0 1 1 1 1 1 -0.5 0.14
•• _ .......... _ ............................................................. a ...... " ................... _ ............................. _ ••••••••• o .... u .......................................................... a ....................................................................................................................... oo
CA04C 30 -1.3 0.4 986 810 -2.7 -2 -4 -3 -2 -1 -1 -1 -1 -1 -1 -1 -1 -2 -1 -1 0.6 -0.13 IN04C 30 1.1 -0.2 72 67 -0.5 2 2 4 1 1 1 1 1 0 1 1 1 0 -1 -1 -1.7 0.07 TX01C 40 -1.2 -0.3 -94 -47 4.5 2 -1 -1 -1 -1 -1 -1 -1 -1 -2 -2 -2 -1 -3 -3 1.7 -0.09
1 mi/h = 1.61 km/h Note: All speed limits and vehicle speeds are shown in mi/h.

Table 36. Average changes in speed characteristics for the comparison site groups.
Speed Limit Pet. Std. 10-milh Pace
Change 24-h Free Mean Dev. Percentile Speeds Lower Upper Pet. Skew Coeff. Group Factor Volume Flow Speed Speeds 1 5 10 15 25 35 50 65 75 85 90 95 99 Limit Limit Pace Index Var.
-15 & -20 Before 1,803 91.7 47.7 7.8 26.9 33.9 38.4 40.8 44.2 45.9 48.4 51.2 53.0 55.6 57.7 60.2 65.9 44.2 53.2 55.7 0.9 16.4 After 1,897 91.7 47.7 7.3 28.3 35.3 39.0 41.2 44.0 46.2 48.6 50.7 52.8 55.4 57.0 59.7 65.1 43.7 52.7 56.3 0.9 15.5
Mean Diff. 94 -0.0 0.1 -0.4 1.4 1.4 0.6 0.4 -0.2 0.3 0.1 -0.6 -0.2 -0.1 -0.7 -0.6 -0.8 -0.6 -0.6 0.6 -0.0 -0.9 Std. Dev. 603 1.7 1.1 1.1 3.3 4.0 2.1 1.7 1.3 1.2 1.2 1.0 0.7 1.1 1.7 1.7 3.1 1.7 1.7 4.9 0.1 2.5 No. Sites 9
-10 Before 2,866 89.5 47.8 7.5 27.5 34.9 38.5 40.8 44.0 46.2 48.9 51.3 53.0 55.3 56.9 59.5 64.8 44.8 53.8 56.4 0.9 15.7 After 3,150 88.6 48.1 7.3 27.4 35.6 39.3 41.6 44.6 46.6 49.1 51.5 53.4 55.5 57.1 59.6 64.4 45.4 54.4 57.7 0.9 15.3
Mean Diff. 284 -0.9 0.4 -0.2 -0.1 0.7 0.9 0.8 0.5 0.4 0.2 0.3 0.4 0.2 0.2 0.1 -0.4 0.7 0.7 1.2 0.0 -0.4 Std. Dev. 621 3.0 0.7 0.9 3.4 2.5 1.6 1.4 1.1 1.0 1.0 1.0 1.0 1.0 1.0 1.2 1.5 1.5 1.5 4.1 0.1 1.9 No. Sites 32
-5 Before 2,897 88.3 46.2 6.7 28.6 34.9 38.0 40.1 42.7 44.9 46.9 49.1 50.9 53.1 54.6 57.2 61.9 42.6 51.6 59.8 0.9 14.8 After 3,345 85.9 46.4 6.5 29.6 35.8 38.7 40.4 42.9 44.9 47.2 49.3 51.1 52.9 54.6 57.0 61.6 42.9 51.9 61.1 0.9 14.3
Mean Diff. 448 -2.4 0.2 -0.2 1.0 0.9 0.7 0.4 0.2 0.0 0.3 0.1 0.1 -0.2 0.1 -0.2 -0.3 0.3 0.3 1.3 0.0 -0.4 Std. Dev. 576 3.7 0.5 0.5 1.5 1.2 1.5 1.4 1.0 0.6 0.7 0.8 0.8 1.0 1.1 1.1 2.0 0.9 0.9 4.1 0.1 1.3 No. Sites 14
+5 Before 5,566 84.1 40.5 6.2 24.6 30.5 33.3 35.0 37.2 38.9 41.1 43.2 45.0 47.0 48.6 50.8 55.9 36.7 45.7 62.3 1.0 16.2 After 6,051 83.1 40.4 6.1 25.3 30.6 33.4 35.0 37.2 38.8 41.0 43.2 44.7 46.8 48.4 50.6 55.5 36.4 45.4 63.2 1.0 16.0
Mean Diff. 485 -1.0 -0.1 -0.1 0.7 0.1 0.0 0.0 -0.0 -0.0 -0.1 -0.0 -0.3 -0.2 -0.2 -0.2 -0.4 -0.2 -0.2 1.0 0.0 -0.2 Std. Dev. 862 1.9 0.9 0.2 2.2 1.3 1.1 1.0 0.9 1.0 1.0 0.8 0.9 1.1 1.0 1.0 1.3 1.1 1.1 1.9 0.1 0.7 No. Sites 25
+10 & +15 Before 2,236 93.4 32.9 6.0 18.1 23.0 25.8 27.8 29.8 31.4 33.6 35.6 37.0 39.5 40.8 42.8 48.2 29.1 38.1 64.9 0.9 18.8 After 2,425 91.8 32.9 5.8 18.4 22.9 26.1 27.8 30.0 31.4 33.6 35.5 37.0 38.8 40.4 42.3 47.7 29.2 38.2 66.5 0.9 18.1
Mean Diff. 189 -1.6 -0.0 -0.2 0.3 -0.1 0.3 0.0 0.2 0.0 -0.1 -0.1 0.0 -0.7 -0.4 -0.5 -0.5 0.1 0.1 1.7 -0.0 -0.7 Std. Dev. 406 2.4 0.8 0.3 1.8 1.7 1.6 0.9 0.9 0.8 0.7 0.8 0.8 1.1 1.3 1.2 1.3 1.3 1.3 3.2 0.1 1.3 No. Sites 14
1 milh = 1.61 km/h Note: All speed limits and vehicle speeds are shown in mi/h.
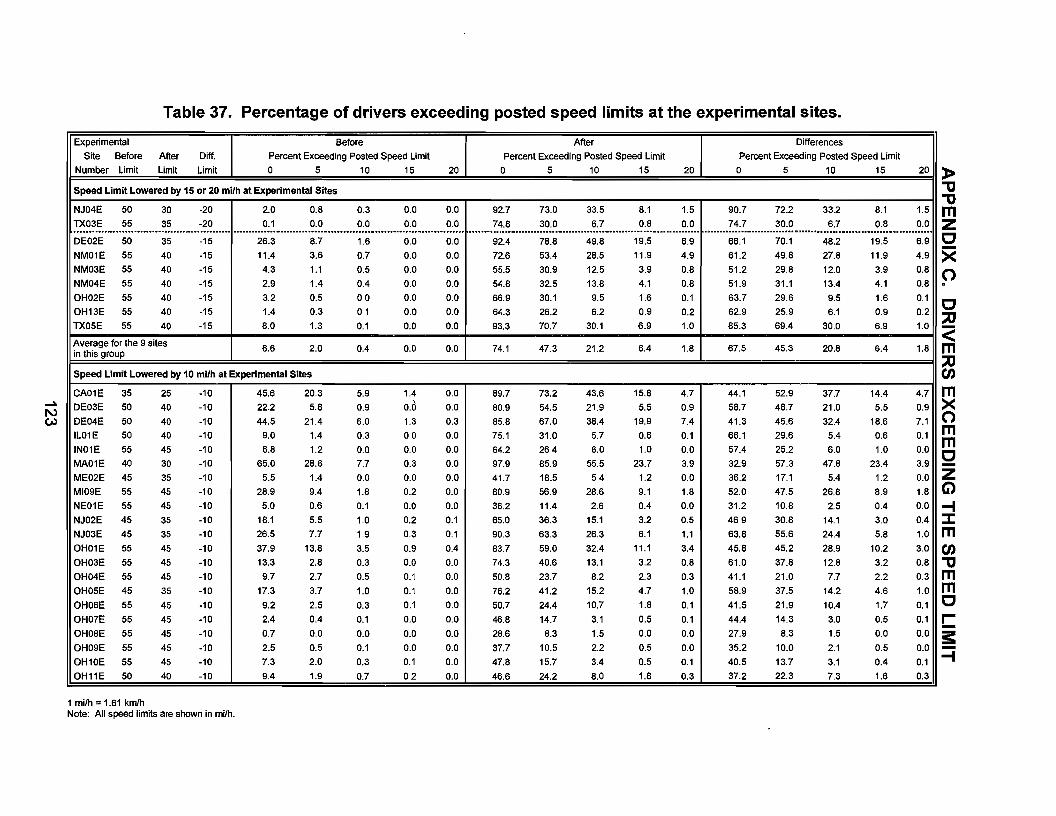
Table 37. Percentage of drivers exceeding posted speed limits at the experimental sites.
Experimental Before After Differences Site Before After Diff. Percent Exceeding Posted Speed Limit Percent Exceeding Posted Speed Limit Percent Exceeding Posted Speed Limit
Number Limit limit Limit 0 5 10 15 20 0 5 10 15 20 0 5 10 15 20
Speed Limit Lowered by 15 or 20 mi/h at Experimental Sites
NJ04E 50 30 -20 2.0 0.8 0.3 0.0 0.0 92.7 73.0 33.5 8.1 1.5 90.7 72.2 33.2 8.1 1.5 TX03E 55 35 -20 0.1 0.0 0.0 0.0 0.0 74.8 30.0 6.7 0.8 0.0 74.7 30.0 6.7 0.8 0.0 ........... _ .......................................... .............................. -.............. "' .................................... ...................................................................................... ................ _ ............................................................... DE02E 50 35 -15 26.3 8.7 1.6 0.0 0.0 92.4 78.8 49.8 19.5 6.9 66.1 70.1 48.2 19.5 6.9 NM01E 55 40 -15 11.4 3.6 0.7 0.0 0.0 72.6 53.4 28.5 11.9 4.9 61.2 49.8 27.8 11.9 4.9 NM03E 55 40 -15 4.3 1.1 0.5 0.0 0.0 55.5 30.9 12.5 3.9 0.8 51.2 29.8 12.0 3.9 0.8 NM04E 55 40 -15 2.9 1.4 0.4 0.0 0.0 54.8 32.5 13.8 4.1 0.8 51.9 31.1 13.4 4.1 0.8 OH02E 55 40 -15 3.2 0.5 00 0.0 0.0 66.9 30.1 9.5 1.6 0.1 63.7 29.6 9.5 1.6 0.1 OH13E 55 40 -15 1.4 0.3 01 0.0 0.0 64.3 26.2 6.2 0.9 0.2 62.9 25.9 6.1 0.9 0.2 TX05E 55 40 -15 8.0 1.3 0.1 0.0 0.0 93.3 70.7 30.1 6.9 1.0 85.3 69.4 30.0 6.9 1.0
Average for the 9 sites 6.6 2.0 0.4 0.0 0.0 74.1 47.3 21.2 6.4 1.8 67.5 45.3 20.8 6.4 1.8 in this group
Speed Limit Lowered by 10 mi/h at Experimental Sites
CA01E 35 25 -10 45.6 20.3 5.9 1.4 0.0 89.7 73.2 43.6 15.8 4.7 44.1 52.9 37.7 14.4 4.7 DE03E 50 40 -10 22.2 5.8 0.9 0.0 0.0 80.9 54.5 21.9 5.5 0.9 58.7 48.7 21.0 5.5 0.9 DE04E 50 40 -10 44.5 21.4 6.0 1.3 0.3 85.8 67.0 38.4 19.9 7.4 41.3 45.6 32.4 18.6 7.1 IL01E 50 40 -10 9.0 1.4 0.3 00 0.0 75.1 31.0 5.7 0.6 0.1 66.1 29.6 5.4 0.6 0.1 IN01E 55 45 -10 6.8 1.2 0.0 0.0 0.0 64.2 264 6.0 1.0 0.0 57.4 25.2 6.0 1.0 0.0 MA01E 40 30 -10 65.0 28.6 7.7 0.3 0.0 97.9 85.9 55.5 23.7 3.9 32.9 57.3 47.8 23.4 3.9 ME02E 45 35 -10 5.5 1.4 0.0 0.0 0.0 41.7 18.5 54 1.2 0.0 36.2 17.1 5.4 1.2 0.0 MI09E 55 45 -10 28.9 9.4 1.8 0.2 0.0 80.9 56.9 28.6 9.1 1.8 52.0 47.5 26.8 8.9 1.8 NE01E 55 45 -10 5.0 0.6 0.1 0.0 0.0 36.2 11.4 2.6 0.4 0.0 31.2 10.8 2.5 0.4 0.0 NJ02E 45 35 -10 18.1 5.5 1.0 0.2 0.1 65.0 36.3 15.1 3.2 0.5 469 30.8 14.1 3.0 0.4 NJ03E 45 35 -10 26.5 7.7 1.9 0.3 0.1 90.3 63.3 26.3 6.1 1.1 63.8 55.6 24.4 5.8 1.0 OH01E 55 45 -10 37.9 13.8 3.5 0.9 0.4 83.7 59.0 32.4 11.1 3.4 45.8 45.2 28.9 10.2 3.0 OH03E 55 45 -10 13.3 2.8 0.3 0.0 0.0 74.3 40.6 13.1 3.2 0.8 61.0 37.8 12.8 3.2 0.8 OH04E 55 45 -10 9.7 2.7 0.5 0.1 0.0 50.8 23.7 8.2 2.3 0.3 41.1 21.0 7.7 2.2 0.3 OH05E 45 35 -10 17.3 3.7 1.0 0.1 0.0 76.2 41.2 15.2 4.7 1.0 58.9 37.5 14.2 4.6 1.0 OH06E 55 45 -10 9.2 2.5 0.3 0.1 0.0 50.7 24.4 10.7 1.8 0.1 41.5 21.9 10.4 1.7 0.1 OH07E 55 45 -10 2.4 0.4 0.1 0.0 0.0 46.8 14.7 3.1 0.5 0.1 44.4 14.3 3.0 0.5 0.1 OH08E 55 45 -10 0.7 0.0 0.0 0.0 0.0 28.6 8.3 1.5 0.0 0.0 27.9 8.3 1.5 0.0 0.0 OH09E 55 45 -10 2.5 0.5 0.1 0.0 0.0 37.7 10.5 2.2 0.5 0.0 35.2 10.0 2.1 0.5 0.0 OH10E 55 45 -10 7.3 2.0 0.3 0.1 0.0 47.8 15.7 3.4 0.5 0.1 40.5 13.7 3.1 0.4 0.1 OH11E 50 40 -10 9.4 1.9 0.7 02 0.0 46.6 24.2 8.0 1.8 0.3 37.2 22.3 7.3 1.6 0.3
1 milh = 1.61 kmlh Note: All speed limits are shown in mi/h.
» -0 -0 m Z C X o . c :;0
<: m :;0 en m X o m m c -z G)
-I ::J: m en -0 m m c C s: --I

Table 37. Percentage of drivers exceeding posted speed limits at the experimental sites (continued).
Experimental Before After Differences
Site Before After Diff. Percent Exceeding Posted Speed Limit Percent Exceeding Posted Speed Limit Percent Exceeding Posted Speed Limit
Number Limit Limit Limit 0 5 10 15 20 0 5 10 15 20 0 5 10 15 20
Speed Limit Lowered by 10 mi/h at Experimental Sites (continued)
OH12E 55 45 -10 7.2 1.7 00 0.0 0.0 47.7 19.7 6.7 2.0 0.3 40.5 18.0 6.7 2.0 0.3
OK01E 45 35 -10 6.7 1.0 0.1 0.0 0.0 60.7 24.8 5.9 1.0 0.2 54.0 23.8 5.8 1.0 0.2
OK02E 35 25 -10 10.4 1 0 02 0.1 0.0 88.6 49.0 11.3 1.4 0.2 78.2 48.0 11.1 1.3 0.2
OK03E 35 25 -10 78.4 45.1 16.2 3.1 0.5 99.3 95.8 84.3 55.3 22.3 20.9 50.7 68.1 52.2 21.8
OK04E 45 35 -10 35.2 8.0 1.2 0.2 0.0. 89.5 67.5 35.1 8.6 1.5 54.3 59.5 33.9 8.4 1.5
TX02E 55 45 -10 13.9 3.2 08 0.2 0.0 66.5 30.0 9.7 2.0 0.5 52.6 26.8 8.9 1.8 0.5
TX04E 55 45 -10 3.1 1.1 03 0.0 0.0 32.9 10.9 2.2 0.6 0.1 29.8 9.8 1.9 0.6 0.1
VA01E 55 45 -10 12.1 2.6 0.5 0.1 0.0 64.3 28.2 8.1 1.4 0.2 52.2 25.6 7.6 1.3 0.2
VA03E 55 45 -10 3.8 0.8 0.1 0.0 0.0 48.6 18.4 4.9 0.4 0.0 44.8 17.6 4.8 0.4 0.0
VA04E 55 45 -10 1.6 0.2 0.0 0.0 0.0 27.8 7.2 1.4 0.0 0.0 26.2 7.0 1.4 0.0 0.0
VA05E 55 45 -10 10.6 2.3 0.0 0.0 0.0 51.9 25.4 9.0 1.9 0.0 41.3 23.1 9.0 1.9 0.0
VA07E 55 45 -10 5.0 0.7 01 0.0 0.0 64.7 29.2 8.6 1.4 0.0 59.7 28.5 8.5 1.4 0.0
WV03E 45 35 -10 43.6 19.2 6.0 1.3 0.0 93.0 75.8 50.9 24.3 8.4 49.4 56.6 44.9 23.0 8.4
Average for the 34 sites 182 6.5 1.7 0.3 0.0 64.3 37.3 17.2 6.3 1.8 46.1 30.8 15.5 6.0 1.7 in this group
Speed Limit Lowered by 5 mi/h at Experimental Sites
AZ01E 50 45 -5 15.1 3.5 0.8 0.2 0.0 42.0 11.3 2.4 0.6 0.2 26.9 7.8 1.6 0.4 0.2
CT02E 45 40 -5 17.7 2.8 0.4 0.0 0.0 50.7 16.9 2.5 0.3 0.0 33.0 14.1 2.1 0.3 0.0
CT05E 45 40 -5 47.8 12.1 2.5 0.6 0.1 86.7 54.4 16.2 3.4 0.7 38.9 42.3 13.7 2.8 0.6
DE01E 40 35 -5 74.1 50.8 25.7 12.3 5.7 93.7 78.2 47.0 22.0 9.0 19.6 27.4 21.3 9.7 3.3
ID01E 55 50 -5 19.4 5.5 1.0 0.4 0.2 40.6 11.8 2.3 0.4 0.1 21.2 6.3 1.3 0.0 -0.1
ID02E 55 50 -5 18.3 3.5 0.5 0.1 0.1 57.9 19.0 3.2 0.4 0.1 39.6 15.5 2.7 0.3 0.0
IL02E 50 45 -5 13.2 2.1 0.2 0.0 0.0 42.8 10.5 1.9 0.3 0.0 29.6 8.4 1.7 0.3 0.0
IN05E 45 40 -5 33.6 12.5 2.0 0.0 0.0 56.0 29.1 9.5 1.4 0.2 22.4 16.6 7.5 1.4 0.2
IN06E 50 45 -5 25.0 6.0 0.6 0.0 0.0 54.3 20.2 3.9 0.4 0.0 29.3 14.2 3.3 0.4 0.0
IN07E 50 45 -5 17.8 3.7 0.3 0.0 0.0 55.7 20.2 4.0 0.7 0.0 37.9 16.5 3.7 0.7 0.0
MA03E 30 25 -5 76.5 41.3 16.3 3.3 0.0 92.8 75.5 43.1 17.3 4.9 16.3 34.2 26.8 14.0 4.9
ME01E 45 40 -5 11.2 2.0 0.3 0.0 0.0 30.6 10.7 1.6 0.3 0.0 19.4 8.7 1.3 0.3 0.0
NJ01E 40 35 -5 37.2 10.0 2.2 0.5 0.1 77.8 38.4 11.3 2.6 0.6 40.6 28.4 9.1 2.1 0.5
NM02E 55 50 -5 44.4 24.0 9.0 2.8 0.9 70.8 48.0 25.7 10.4 4.4 26.4 24.0 16.7 7.6 3.5
Average for the 14 Sites 32.2 12.8 4.4 1.4 0.5 60.9 31.7 12.5 4.3 1.4 28.7 18.9 8.1 2.9 0.9 in this group
1 mi/h = 1.61 kmlh Note: All speed limits are shown in milh.

Table 37. Percentage of drivers exceeding posted speed limits at the experimental sites (continued).
Experimental Before After Differences Site Before After Diff. Percent Exceeding Posted Speed Limit Percent Exceeding Posted Speed Limit Percent Exceeding Posted Speed Limit
Number Limit Limit Limit 0 5 10 15 20 0 5 10 15 20 0 5 10 15 20
Speed Limit Raised by 5 milh at Experimental Sites
AZ02E 25 30 5 89.3 61.0 28.8 7.0 1.4 63.8 27.3 6.6 1.0 0.5 -25.5 -33.7 -22.2 -6.0 -0.9 AZ03E 30 35 5 68.2 30.9 9.0 1.7 0.3 35.3 7.1 1.2 0.2 0.0 -32.9 -23.8 -7.8 -1.5 -0.3 CA06E 45 50 5 73.8 42.3 15.9 4.4 0.8 29.0 8.4 2.0 0.4 0.0 -44.8 -33.9 -13.9 -4.0 -0.8 CAD7E 45 50 5 92.6 70.7 36.1 11.5 3.0 58.9 25.5 7.2 1.7 0.3 -33.7 -45.2 -28.9 -9.8 -2.7 C001E 30 35 5 97.1 81.2 38.1 9.7 1.7 8.3 1.1 0.2 00 0.0 -88.8 -80.1 -37.9 -9.7 -1.7 C003E 40 45 5 68.8 36.4 15.9 6.3 2.3 39.0 12.8 2.6 1.4 0.2 -29.8 -23.6 -13.3 -4.9 -2.1 CT01E 46 60 6 96.6 82.9 67.6 27.8 10.3 86.3 60.7 31.0 11.0 3.5 -9.2 -22.2 -26.6 -16.8 -6.8 CT04E 30 35 5 95.4 87.8 69.1 41.2 16.2 87.8 69.4 40.4 14.7 3.4 -7.6 -18.4 -28.7 -26.5 -12.8 DE05E 36 40 6 64.0 37.2 19.1 6.7 1.0 37.7 15.9 4.8 09 0.0 -26.3 -21.3 -14.3 -5.8 -1.0 IN02E 25 30 5 71.9 34.8 7.8 1.1 0.1 16.8 3.2 0.4 0.1 0.0 -55.1 -31.6 -7.4 -1.0 -0.1 IN03E 25 30 5 68.9 28.3 5.3 0.7 0.0 25.7 4.4 0.4 0.0 0.0 -43.2 -23.9 -4.9 -0.7 0.0 MD01E 50 55 5 80.5 49.7 17.2 4.6 1.2 60.6 24.9 7.1 2.0 0.4 -19.9 -24.8 -10.1 -2.6 -0.8 MD02E 50 55 5 59.0 22.5 5.1 0.9 0.3 27.3 5.9 1.1 0.3 0.0 -31.7 -16.6 -4.0 -0.6 -0.3 MD03E 50 55 5 60.9 27.1 7.6 1.9 0.5 26.7 8.4 2.2 0.7 0.2 -34.2 -18.7 -5.4 -1.2 -0.3 MD04E 50 65 5 71.9 40.3 13.0 2.7 0.7 42.6 15.3 3.4 0.6 0.1 -29.3 -25.0 -9.6 -2.1 -0.6 MD05E 50 55 5 75.3 41.6 14.0 3.1 0.6 47.8 18.2 5.0 16 0.5 -27.5 -23.4 -9.0 -1.5 -0.1 MD06E 30 35 5 96.4 82.5 54.1 23.1 6.0 84.4 53.8 22.8 6.7 1.7 -12.0 -28.7 -31.3 -16.4 -4.3 MD07E 30 36 6 83.9 55.1 22.6 6.6 1.0 57.1 21.8 5.7 1.4 0.2 -26.8 -33.3 -16.9 -5.2 -0.8 MD08E 30 35 5 56.5 22.0 4.8 0.9 0.2 38.3 10.4 2.3 0.3 0.0 -18.2 -11.6 -2.5 -0.6 -0.2 MD09E 30 35 5 85.9 53.3 15.4 2.6 0.2 59.0 16.8 2.5 0.1 0.0 -26.9 -36.5 -12.9 -2.5 -0.2 MD10E 50 55 5 80.6 39.2 9.1 1.6 0.2 42.6 10.6 1.7 04 0.0 -38.0 -28.6 -7.4 -1.2 -0.2 MS02E 30 35 5 74.2 45.5 17.7 4.8 1.0 61.2 30.8 8.8 1.6 0.4 -13.0 -14.7 -8.9 -3.2 -0.6 TN01E 50 55 5 88.6 61.0 27.2 8.4 2.3 61.2 27.2 7.8 2.1 0.6 -27.4 -33.8 -19.4 -6.3 -1.7 TX06E 30 35 5 67.5 40.7 15.6 4.1 0.5 39.4 13.6 4.7 0.5 0.0 -28.1 -27.1 -10.9 -3.6 -0.5 TX07E 40 45 5 17.3 2.6 0.3 0.1 0.0 2.9 0.4 0.0 0.0 0.0 -14.4 -2.2 -0.3 -0.1 0.0 TX08E 30 35 5 55.5 15.9 2.4 0.4 0.0 27.5 4.7 0.5 0.0 0.0 -28.0 -11.2 -1.9 -0.4 0.0
Average for the 26 sites 74.6 45.9 20.3 7.1 2.0 44.9 19.2 6.6 1.9 0.5 -29.7 -26.7 -13.7 -5.2 -1.5 in this group
1 milh = 1.61 kmlh Note: All speed limits are shown in milh.

Table 37. Percentage of drivers exceeding posted speed limits at the experimental sites (continued).
Experimental Before After Differences Site Before After Diff. Percent Exceeding Posted Speed Limit Percent Exceeding Posted Speed Limit Percent Exceeding Posted Speed Limit
Number Limit Limit Limit 0 5 10 15 20 0 5 10 15 20 0 5 10 15 20
Speed Limit Raised by 10 or 15 mi/h at Experimental Sites
C002E 30 40 10 97.3 86.2 55.4 22.3 5.5 68.3 30.0 6.6 1.0 0.1 -29.0 -56.2 -48.8 -21.3 -5.4 CT03E 30 40 10 98.0 91.9 75.7 49.2 23.1 80.1 54.1 23.0 6.1 1.8 -17.9 -37.8 -52.7 -43.1 -21.3 ID03E 20 30 10 80.1 44.9 10.0 1.2 0.2 12.5 1.3 0.0 0.0 0.0 -67.6 -43.6 -10.0 -1.2 -0.2 ID04E 20 30 10 75.8 40.4 9.5 1.6 0.2 12.7 1.2 0.0 0.0 0.0 -63.1 -39.2 -9.5 -1.6 -0.2 ID05E 20 30 10 62.8 34.8 11.5 2.8 0.4 8.8 1.6 0.2 0.0 0.0 -54.0 -33.2 -11.3 -2.8 -0.4 ID06E 25 35 10 85.4 43.2 7.8 1.0 0.2 18.3 1.5 0.1 0.0 0.0 -67.1 -41.7 -7.7 -1.0 -0.2 ID07E 25 35 10 72.6 20.9 2.3 0.2 0.0 4.7 0.3 0.0 0.0 0.0 -67.9 -20.6 -2.3 -0.2 0.0 ID08E 35 45 10 76.9 40.4 15.5 4.3 0.7 21.4 4.5 1.0 0.0 0.0 -55.5 -35.9 -14.5 -4.3 -0.7 MA02E 30 40 10 96.3 89.9 64.0 29.3 7.7 63.6 29.3 7.0 1.1 0.1 -32.7 -60.6 -57.0 -28.2 -7.6 ME03E 35 45 10 95.3 85.4 59.3 30.7 11.6 61.6 26.1 7.5 1.7 0.3 -33.7 -59.3 -51.8 -29.0 -11.3 MS01E 35 45 10 73.6 40.4 17.7 5.3 1.2 36.1 10.3 2.2 0.4 0.0 -37.5 -30.1 -15.5 -4.9 -1.2 VA02E 35 45 10 84.8 48.4 15.7 2.8 0.4 32.9 7.7 1.5 0.6 0.0 -51.9 -40.7 -14.2 -2.2 -0.4 ••••••••••• _ ............................... n .............. ................................................................................. ........................................ - ................................................... ...................... "" ...................................................... CA04E 30 45 15 99.4 94.8 72.6 37.2 12.2 27.9 7.0 1.5 0.3 0.0 -71.5 -87.8 -71.1 -36.9 -12.2 IN04E 30 45 15 93.8 82.1 61.5 32.6 13.8 42.5 14.3 2.3 0.0 0.0 -51.3 -67.8 -59.2 -32.6 -13.8 TX01E 40 55 15 80.9 64.7 39.3 18.9 7.8 15.2 4.9 0.5 0.0 0.0 -65.7 -59.8 -38.8 -18.9 -7.8
Average for the 15 sites 84.9 60.6 34.5 16.0 5.7 33.8 12.9 3.6 0.7 0.2 -51.1 -47.6 -31.0 -15.2 -5.5 in this group
1 milh = 1.61 krnlh Note: All speed limits are shown in mi/h.

Table 38. Percentage of drivers exceeding posted speed limits at the comparison sites.
Comparison Before After Differences
Site Posted Percent Exceeding Posted Speed Limit Percent Exceeding Posted Speed Limit Percent Exceeding Posted Speed Limit
Number Limit 0 5 10 15 20 0 5 10 15 20 0 5 10 15 20
Speed Limit Lowered by 15 or 20 mi/h at Experimental Sites . NJ04C 50 29.6 9.2 1.3 0.0 0.0 25.1 6.9 2.0 0.9 01 -4.5 -2.3 0.7 0.9 0.1
TX03C 55 30.0 12.5 3.6 1.3 0.4 35.0 15.0 4.9 0.7 0.0 5.0 2.5 1.3 -0.6 -0.4 ......................... ......................................................................................... ................................................................ a ......................... ........................................................................................ DE02C 50 20.0 6.2 0.0 0.0 0.0 23.7 9.1 1.7 0.0 0.0 3.7 2.9 1.7 0.0 0.0
NM01C 55 32.3 13.7 4.8 1.8 0.6 34.4 14.4 5.0 1.7 0.6 2.1 0.7 0.2 -0.1 0.0
NM03C 40 72.3 50.4 25.9 11.6 4.1 69.8 44.9 21.6 8.0 2.4 -2.5 -5.5 -4.3 -3.6 -1.7
NM04C 40 72.3 50.4 25.9 11.6 4.1 69.8 44.9 21.6 8.0 2.4 -2.5 -5.5 -4.3 -3.6 -1.7
OH02C 55 14.0 3.0 0.0 0.0 0.0 8.5 2.0 0.1 0.0 0.0 -5.5 -1.0 0.1 0.0 0.0
OH13C 55 8.4 2.4 0.5 0.2 0.0 10.3 2.4 0.6 0.0 0.0 1.9 0.0 0.1 -0.2 0.0
TX05C 55 35.1 10.5 2.2 0.3 0.1 36.6 10.0 1.8 05 0.0 1.5 -0.5 -0.4 0.2 -0.1
Average for the 34.9 17.6 7.1 3.0 1.0 34.8 16.6 6.6 2.2 0.6 -0.1 -1.0 -0.5 -0.8 -0.4 9 sites
Speed Limit Lowered by 10 mi/h at Experimental Sites
CA01C 30 77.4 41.5 13.7 3.0 0.4 76.4 38.5 9.8 2.0 0.5 -1.0 -3.0 -3.9 -1.0 0.1
DE03C 50 52.0 26.2 8.6 2.2 0.5 53.3 27.0 9.2 2.6 0.7 1.3 0.8 0.6 0.4 0.2
DE04C 50 51.4 26.2 86 2.2 0.5 52.6 26.5 9.1 26 0.7 1.2 0.3 0.5 0.4 0.2
IL01C 45 41.7 10.3 1.3 0.0 0.0 36.6 6.5 0.8 0.1 0.0 -5.1 -3.8 -0.5 0.1 0.0
IN01C 55 38.2 12.6 2.0 0.5 0.0 40.9 13.6 3.2 0.7 0.2 2.7 .. 1.0 1.2 0.2 0.2
MA01C 30 89.3 68.9 36.8 12.3 3.0 91.6 73.4 34.0 10.5 14 2.3 4.5 -2.8 -1.8 -1.6
ME02C 45 62.9 32.6 11 2 3.1 0.0 68.1 37.1 14.8 3.3 0.0 5.2 4.5 3.6 0.2 0.0
MI09C 55 62.6 33.7 9.3 2.6 0.5 63.2 32.1 10.6 2.5 0.8 0.6 -1.6 1.3 -0.1 0.3
NE01C 55 36.9 12.5 2.9 0.8 0.4 37.8 12.6 3.2 1.3 0.1 0.9 0.1 0.3 0.5 -0.3
NJ02C 50 55.8 27.5 9.6 27 0.6 56.2 23.6 62 16 0.3 0.4 -3.9 -3.4 -1.1 -03
NJ03C 50 53.0 25.8 8.5 2.0 0.6 56.4 24.2 6.2 1.7 0.3 3.4 -1.6 -2.3 -0.3 -0.3
OH01C 55 41.2 15.1 4.3 1.3 0.3 37.3 15.0 4.1 1.1 0.2 -3.9 -0.1 -0.2 -0.2 -0.1
OH03C 55 39.0 15.6 49 0.7 0.0 37.8 15.2 4.2 0.7 0.0 -1.2 -0.4 -0.7 0.0 0.0
OH04C 55 6.8 1.6 0.4 0.0 0.0 8.9 1.9 0.1 0.0 00 2.1 0.3 -0.3 0.0 0.0
OH05C 55 36.9 12.0 3.0 0.9 0.1 36.3 12.7 2.5 0.3 0.0 -0.6 0.7 -0.5 -0.6 -0.1
OH06C 55 38.6 16.8 4.4 0.5 0.0 44.5 16.5 4.9 0.5 0.0 5.9 -0.3 0.5 0.0 0.0
OH07C 55 5.9 1.5 0.2 0.1 0.0 3.5 0.6 0.0 0.0 0.0 -2.4 -0.9 -0.2 -0.1 0.0
OH08C 55 66.1 34.5 11.8 2.1 0.0 64.4 37.8 16.3 5.1 0.9 -1.7 33 4.5 3.0 0.9
OH09C 55 45.0 15.4 4.1 1.1 0.5 48.1 16.6 3.8 0.8 0.0 3.1 1.2 -0.3 -0.3 -0.5
OH10C 55 45.0 154 4.1 1.1 0.5 48.1 16.6 3.8 0.8 0.0 3.1 1.2 -0.3 -0.3 -0.5
OH11C 50 8.3 1.5 0.1 0.0 0.0 7.5 1.3 0.0 0.0 0.0 -0.8 -0.2 -0.1 0.0 0.0
1 milh = 1.61 kmlh Note: All speed limits are shown in mi/h.

~
N 00
Table 38. Percentage of drivers exceeding posted speed limits at the comparison sites (continued).
Comparison Before After Differences Site Posted Percent Exceeding Posted Speed Limit Percent Exceeding Posted Speed Limit Percent Exceeding Posted Speed Limit
Number Limit 0 5 10 15 20 0 5 10 15 20 0 5 10 15
Speed Limit Lowered by 10 mi/h at Experimental Sites (continued)
OH12C 55 39.5 15.3 4.7 1.3 0.5 35.0 10.9 2.5 0.4 0.0 -4.5 -4.4 -2.2 -0.9
OK01C 45 62.8 29.8 9.3 2.1 0.3 71.4 34.0 9.9 1.6 0.2 8.6 4.2 0.6 -0.5
OK04C 35 28.0 5.3 0.9 0.1 0.0 26.1 6.3 1.1 0.1 0.0 -1.9 1.0 0.2 0.0 TX02C 55 30.0 12.5 3.6 1.3 0.4 35.0 15.0 4.9 0.7 0.0 5.0 2.5 1.3 -0.6 TX04C 55 28.2 12.7 5.0 1.6 0.9 30.0 11.1 2.8 0.7 0.1 1.8 -1.6 -2.2 -0.9
VA01C 55 3.3 0.5 0.1 0.0 0.0 5.1 07 0.1 0.0 0.0 1.8 0.2 0.0 0.0
VA03C 55 6.3 1.1 0.0 0.0 0.0 103 2.4 0.0 0.0 0.0 4.0 1.3 0.0 0.0
VA04C 55 6.3 1.1 0.0 0.0 0.0 10.3 2.4 0.0 0.0 0.0 4.0 1.3 0.0 0.0 VA05C 55 6.3 1.1 0.0 0.0 0.0 12.9 2.5 0.0 0.0 0.0 6.6 1.4 0.0 0.0
VA07C 55 23.6 6.5 1.7 0.5 0.1 29.2 11.7 2.1 0.2 0.0 5.6 5.2 0.4 -0.3 1JIN03C 45 21.1 7.5 1.7 0.2 0.0 25.5 7.9 1.9 0.5 0.0 4.4 0.4 0.2 0.3
Average for the 37.8 16.9 5.5 1.4 0.3 39.4 17.3 5.4 1.3 0.2 1.6 .. 0.4 -0.1 -0.1 32 sites
Speed limit Lowered by 5 mi/h at Experimental Sites
AZ01C 45 63.2 29.5 9.6 2.4 0.4 62.5 28.2 8.4 1.5 0.4 -0.7 -1.3 -1.2 -0.9
CT02C 45 35.1 10.6 2.1 0.3 0.0 34.7 10.3 2.3 0.4 0.1 -0.4 -0.3 0.2 0.1 CT05C 45 72.9 33.8 10.6 2.9 0.5 80.6 43.3 14.0 4.0 0.8 7.7 9.5 3.4 1.1
DE01C 40 12.9 2.4 0.2 0.0 0.0 20.7 7.2 1.8 0.2 0.0 7.8 4.8 16 0.2 ID01C 55 28.0 7.5 2.0 0.8 0.2 25.1 5.9 1.3 0.3 0.0 -2.9 -1.6 -0.7 -0.5
ID02C 55 28.0 7.5 2.0 0.8 0.2 25.1 5.9 1.3 0.3 0.0 -2.9 -1.6 -0.7 -0.5
IL02C 45 41.7 10.3 1.3 0.0 0.0 36.6 6.5 0.8 0.1 0.0 -5.1 -3.8 -0.5 0.1
IN05C 45 70.0 39.8 12.2 2.6 0.1 72.9 38.2 10.6 1.7 0.2 2.9 -1.6 -1.6 -0.9 (N06C 50 58.7 26.6 7.5 1.0 0.0 60.0 26.9 7.3 1.2 0.0 1.3 0.3 -0.2 0.2
IN07C 50 58.7 26.6 7.5 1.0 0.0 60.0 26.9 7.3 1.2 0.0 1.3 0.3 -0.2 0.2
MA03C 30 87.4 66.5 36.1 12.9 4.0 87.8 68.3 34.5 10.6 2.6 0.4 1.8 -1.6 -2.3
ME01C 45 62.9 32.6 11.2 3.1 0.0 68.1 37.1 14.8 3.3 0.0 5.2 4.5 3.6 0.2
NJ01C 40 79.2 47.5 16.0 4.2 0.8 78.7 45.2 12.8 2.5 0.1 -0.5 -2.3 -3.2 -1.7
NM02C 55 32.3 13.7 4.8 1.8 0.6 34.4 14.4 5.0 1.7 0.6 2.1 0.7 0.2 -0.1
Average for the 52.2 25.4 8.8 2.4 0.5 53.4 26.0 8.7 2.1 0.3 1.2 0.7 -0.1 -0.3 14 sites . 1 mi/h = 1.61 kmlh Note: All speed limits are shown in milh.
20
-0.5
-0.1
0.0
-0.4
-0.8
0.0 0.0
0.0 0.0
-0.1 0.0
-0.1
0.0
0.1
0.3
0.0
-0.2
-0.2 0.0
0.1
0.0
0.0
-1.4
0.0
-0.7
0.0
-0.1

Table 38. Percentage of drivers exceeding posted speed limits at the comparison sites (continued).
Comparison Before After Differences
Site Posted Percent Exceeding Posted Speed Limit Percent Exceeding Posted Speed Limit Percent Exceeding Posted Speed Limit
Number Limit 0 5 10 15 20 0 5 10 15 20 0 5 10 15 20
Speed Limit Raised by 5 mi/h at Experimental Sites
AZ02C 30 56.5 23.1 5.9 1.1 01 53.9 20.3 4.8 1.3 0.2 -2.6 -2.8 -1.1 0.2 0.1
AZ03C 30 67.4 32.6 10.9 2.7 0.3 70.1 38.2 12.5 2.5 0.3 2.7 5.6 1.6 -0.2 0.0
CA06C 45 79.0 50.9 21.6 6.2 1.2 73.3 41.8 14.4 3.6 0.5 -5.7 -9.1 -7.2 -2.6 -0.7 CA07C 45 79.0 50.9 21.6 6.2 1.2 71.8 38.4 12.1 3.1 0.6 -72 -12.5 -9.5 -3.1 -0.6
C001C 30 66.4 23.7 4.1 1.1 0.3 68.8 23.8 5.1 1.3 0.0 24 0.1 1.0 0.2 -0.3
C003C 30 90.6 67.0 32.1 7.4 1.6 89.4 61.0 24.1 5.5 1.3 -12 -6.0 -8.0 -1.9 -0.3 CT01C 45 77.9 46.2 16.1 3.9 0.6 77.8 47.2 17.5 4.3 0.7 -0.1 1.0 1.4 0.4 0.1
DE05C 35 44.0 20.7 7.3 2.6 0.5 41.5 19.0 5.8 1.2 0.2 -2.5 -1.7 -1.5 -1.4 -0.3 IN02C '25 50.2 18.8 4.5 1.0 0.0 44.0 14.6 3.6 0.8 0.1 -6.2 -4.2 -0.9 -0.2 0.1
IN03C 25 50.2 18.8 45 1.0 0.0 44.0 14.6 3.6 0.8 0.1 -6.2 -4.2 -0.9 -0.2 0.1 MD01C 50 79.4 50.4 17.7 4.9 0.6 81.6 49.5 19.0 6.3 1.5 2.2 -0.9 1.3 1.4 0.9
MD02C 50 66.0 32.8 12.2 3.5 0.8 64.8 29.2 10.7 2.9 0.7 -1.2 -3.6 -1.5 -0.6 -0.1 MD03C 50 70.2 30.8 9.7 3.1 1 1 76.2 39.9 12.3 3.2 0.8 6.0 9.1 2.6 0.1 -0.3
M004C 50 21.8 7.2 1.0 0.3 0.0 27.5 9.1 1.5 0.1 0.0 5.7 1.9 0.5 -0.2 0.0 MD05C 50 77.2 41.7 11.9 2.7 0.6 86.1 49.1 16.3 3.8 1.0 8.9 7.4 4.4 1.1 0.4 M006C 30 77.4 52.9 23.5 6.3 1.4 76.1 50.9 21.0 5.5 0.8 -1.3 -2.0 -2.5 -0.8 -0.6
MD07C 30 77.4 52.9 23.5 6.3 1.4 76.1 50.9 21.0 5.5 0.8 -1.3 -2.0 -2.5 -0.8 -0.6 M008C 30 77.4 52.9 23.5 6.3 1.4 76.1 50.9 21.0 5.5 0.8 -1.3 -2.0 -2.5 -0.8 -0.6
M009C 30 89.8 63.8 31.6 9.8 2.0 93.4 68.6 32.0 9.6 1.6 3.6 4.8 0.4 -0.2 -0.4 MD10C 50 53.4 14.7 2.2 0.2 0.0 52.7 14.7 2.7 0.3 0.0 -0.7 0.0 0.5 0.1 0.0
MS02C 30 81.6 45.3 12.8 2.3 0.5 84.5 45.3 11.7 1.9 0.2 29 0.0 -1.1 -0.4 -0.3
TN01C 55 76.4 44.4 15.8 4.4 0.9 74.6 41.8 14.1 3.6 0.6 -1.8 -2.6 -1.7 -0.8 -0.3 TX06C 30 84.1 60.9 31.3 10.9 2.0 88.5 69.8 39.4 13.4 2.5 4.4 8.9 8.1 2.5 0.5
TX07C 35 351 8.1 1.5 0.3 0.0 28.7 6.6 0.9 0.1 0.0 -6.4 -1.5 -0.6 -0.2 0.0
TX08C 35 35.1 8.1 1.5 0.3 0.0 28.7 6.6 0.9 0.1 0.0 -64 -1.5 -0.6 -0.2 0.0
Average for the 66.5 36.8 13.9 3.8 0.7 66.0 36.1 13.1 3.4 0.6 -0.5 -0.7 -0.8 -0.3 -0.1 25 sites
1 mi/h = 1.61 km/h Note: All speed limits are shown in mi/h.

Table 38. Percentage of drivers exceeding posted speed limits at the comparison sites (continued).
Comparison Before After Differences
Site Posted Percent Exceeding Posted Speed Limit Percent Exceeding Posted Speed Limit Percent Exceeding Posted Speed Limit Number Limit 0 5 10 15 20 0 5 10 15 20 0 5 10 15 20
Speed Limit Raised by 10 or 15 mi/h at Experimental Sites
C002C 30 66.4 23.7 4.1 1.1 0.3 68.8 23.8 5.1 1.3 0.0 2.4 0.1 1.0 0.2 -0.3 ID03C 20 58.0 23.0 4.6 1.4 0.0 63.1 19.7 3.1 0.5 0.0 5.1 -3.3 -1.5 -0.9 0.0 ID04C 20 58.0 23.0 4.6 1.4 0.0 63.1 19.7 3.1 0.5 0.0 5.1 -3.3 -1.5 -0.9 0.0 IDOSC 20 58.0 23.0 4.6 1.4 0.0 63.1 19.7 3.1 0.5 0.0 5.1 -3.3 -1.5 -0.9 0.0 ID06C 25 76.4 22.7 3.0 0.3 0.0 74.6 22.7 2.9 0.3 0.0 -1.8 0.0 -0.1 0.0 0.0 ID07C 25 81.3 29.0 4.0 0.5 0.1 74.6 22.7 2.9 0.3 0.0 -6.7 -6.3 -1.1 -0.2 -0.1 ID08C 35 35.4 11.6 2.3 0.7 0.4 32.7 7.7 2.4 0.6 0.0 -2.7 -3.9 0.1 -0.1 -0.4 MA02C 30 89.3 68.9 36.8 12.3 3.0 91.6 73.4 34.0 10.5 1.4 2.3 4.5 -2.8 -1.8 -1.6 ME03C 35 84.8 63.8 32.3 13.3 4.7 87.2 68.1 38.3 13.5 4.6 2.4 4.3 6.0 0.2 -0.1 MS01C 35 87.9 72.1 467 202 5.1 90.2 77.7 52.5 25.1 7.8 2.3 5.6 5.8 4.9 2.7 VA02C 35 86.5 53.2 16.3 3.5 0.5 87.9 54.4 18.8 3.8 0.9 1.4 1.2 2.5 0.3 0.4 .......................... ••••••• 0 ............................................... , ... >D •••••• u ................ ............................................................... " .......................... • ................... " ... 0 ....................................................... 0.0 ............................
CA04C 30 93.7 78.4 50.3 22.6 6.3 87.2 74.5 45.5 18.1 4.6 -6.5 -3.9 -4.8 -4.5 -1.7 IN04C 30 80.9 53.1 22.7 6.1 1.4 84.1 60.3 249 8.0 1.7 3.2 7.2 2.2 1.9 0.3 TX01C 40 37.6 16.9 5.7 1.8 0.4 30.9 11.5 3.6 1.8 0.7 -6.7 -5.4 -2.1 0.0 0.3
Average for the 71.0 40.2 17.0 6.2 1.6 71.4 39.7 17.2 6.1 1.6 0.3 -0.5 0.2 -0.1 -0.0 14 sites
1 mi/h = 1.61 kmlh Note: All speed limits are shown in mi/h.

Table 39. Repeated speed measurements for the experimental sites where speed limits were lowered.
Data Std. Free- Pet. 10-mi/h Pace
Site Before After Date Limit Colleetion Mean Dev. 24-h Flow Free Percentile Speeds Lower Upper Pet. Number Limit Limit Posted Period Date Speed Speeds Volume Volume Flow 1 5 10 15 25 35 50 65 75 85 90 95 99 Limit Limit Pace
Lower Speed Limit Sites
DE01E 40 35 11/04/86 Before 09/26/86 45.3 8.4 986 946 95.9 27 33 35 37 40 42 46 48 51 54 57 62 67 40 49 48.8 DE01E After 1 12/12/86 47.1 7.6 565 553 97.9 31 36 38 40 43 45 47 50 52 55 58 61 66 43 52 51.9 DE01E After 10/28/88 45.1 7.1 775 742 95.7 30 34 37 39 41 43 45 47 50 53 55 58 65 41 50 56.2 IN07E 50 45 12/29/86 Before 12117186 44.1 7.4 5,743 4,750 82.7 20 29 35 38 41 43 46 48 49 51 52 55 58 42 51 61.7 IN07E After 1 04/18/88 44.8 6.9 5,893 4,800 81.5 22 33 38 40 42 44 46 48 50 51 53 55 59 41 50 62.7 IN07E After 08/09/88 44.7 7.3 5,954 4,947 83.1 21 30 36 39 42 44 46 48 50 52 53 55 60 42 51 62.7 OH01E 55 45 09/07/86 Before 06/25/86 53.0 7.0 3,948 3,380 85.6 34 42 45 47 50 51 54 56 58 60 62 64 70 50 59 57.9 OH01E After 1 10101/86 50.9 7.0 3,386 2,903 85.7 31 40 44 46 48 49 51 54 56 58 60 63 69 47 56 60.6 OH01E After 2 07/15/87 51.8 6.4 4,045 3,468 85.7 35 42 45 46 48 50 52 55 56 58 60 63 67 49 58 60.4 OH01E After 05/03/89 51.7 7.4 3,192 2,836 88.8 32 40 43 45 48 50 52 55 57 59 61 64 70 48 57 54.1 OH05E 45 35 12/10/86 Before 10/19/86 38.7 7.6 3,909 3,452 88.3 14 25 31 33 35 37 40 42 44 46 47 50 55 36 45 57.0
OH05E After 1 01/25/87 39.1 6.5 3,391 3,044 89.8 23 28 31 33 36 37 40 42 44 46 48 50 55 36 45 60.3 OH05E After 11/10/87 38.8 6.6 3,458 3,047 88.1 20 28 31 34 36 37 39 41 43 46 47 50 55 35 44 62.3 VA05E 55 45 09/09/87 Before 07/30/86 44.8 8.5 927 869 93.7 23 28 35 38 40 42 46 49 51 54 56 58 62 40 49 45.8
VA05E After 1 11119187 45.0 8.2 978 917 93.8 19 32 36 37 40 43 46 49 51 54 56 58 62 42 51 47.2 VA05E After 06/26/88 45.0 7.7 1,066 1,022 95.9 24 32 36 38 41 43 46 49 51 53 55 57 62 43 52 50.6
1 mi/h = 1.61 kmlh Note: All speed limits and vehicle speeds are shown in mi/h.
Skew. Index
1.04 1.13 1.14 0.73 0.84 0.76 0.90 1.05 1.00 1.05 0.86 0.95 1.05 0.88 0.96 0.96
l> ." ." m Z C X ~
:::c m ." m l> -I m C en ." m m c s: m l> en c :::c m s: m z -I en
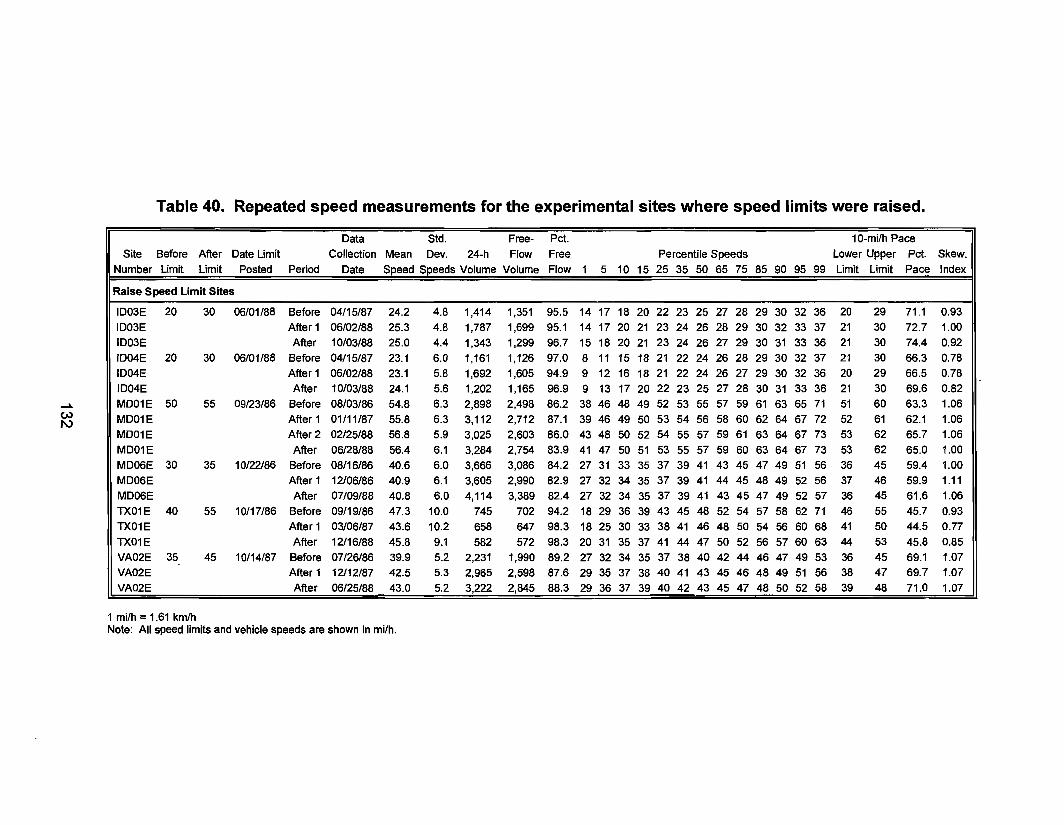
Table 40. Repeated speed measurements for the experimental sites where speed limits were raised.
Data Std. Free- Pet. 10-mi/h Pace
Site Before After Date Limit Collection Mean Dev. 24-h Flow Free Percentile Speeds Lower Upper Pet. Skew.
Number Limit Limit Posted Period Date Speed Speeds Volume Volume Flow 1 5 10 15 25 35 50 65 75 85 90 95 99 Limit Limit Pace Index
Raise Speed Limit Sites
ID03E 20 30 06/01/88 Before 04/15/87 24.2 4.8 1,414 1,351 95.5 14 17 18 20 22 23 25 27 28 29 30 32 36 20 29 71.1 0.93
ID03E After 1 06/02/88 25.3 4.8 1,787 1,699 95.1 14 17 20 21 23 24 26 28 29 30 32 33 37 21 30 72.7 1.00
ID03E After 10103/88 25.0 4.4 1,343 1,299 96.7 15 18 20 21 23 24 26 27 29 30 31 33 36 21 30 74.4 0.92 ID04E 20 30 06/01/88 Before 04115187 23.1 6.0 1,161 1,126 97.0 8 11 15 18 21 22 24 26 28 29 30 32 37 21 30 66.3 0.78
ID04E After 1 06/02/88 23.1 5.8 1,692 1,605 94.9 9 12 16 18 21 22 24 26 27 29 30 32 36 20 29 66.5 0.78
JD04E After 10/03/88 24.1 5.6 1,202 1,165 96.9 9 13 17 20 22 23 25 27 28 30 31 33 36 21 30 69.6 0.82
MD01E 50 55 09/23/86 Before 08/03/86 54.8 6.3 2,898 2,498 86.2 38 46 48 49 52 53 55 57 59 61 63 65 71 51 60 63.3 1.06
MD01E After 1 01/11/87 55.8 6.3 3,112 2,712 87.1 39 46 49 50 53 54 56 58 60 62 64 67 72 52 61 62.1 1.06
MD01E After 2 02/25/88 56.8 5.9 3,025 2,603 86.0 43 48 50 52 54 55 57 59 61 63 64 67 73 53 62 65.7 1.06
MD01E After 06/28/88 56.4 6.1 3,284 2,754 83.9 41 47 50 51 53 55 57 59 60 63 64 67 73 53 62 65.0 1.00
MD06E 30 35 10/22/86 Before 08/16/86 40.6 6.0 3,666 3,086 84.2 27 31 33 35 37 39 41 43 45 47 49 51 56 36 45 59.4 1.00
MD06E After 1 12/06/86 40.9 6.1 3,605 2,990 82.9 27 32 34 35 37 39 41 44 45 48 49 52 56 37 46 59.9 1.11
MD06E After 07/09/88 40.8 6.0 4,114 3,389 82.4 27 32 34 35 37 39 41 43 45 47 49 52 57 36 45 61.6 1.06
TX01E 40 55 10117186 Before 09/19/86 47.3 10.0 745 702 94.2 18 29 36 39 43 45 48 52 54 57 58 62 71 46 55 45.7 0.93
TX01E After 1 03/06/87 43.6 10.2 658 647 98.3 18 25 30 33 38 41 46 48 50 54 56 60 68 41 50 44.5 0.77
TX01E After 12/16/88 45.8 9.1 582 572 98.3 20 31 35 37 41 44 47 50 52 56 57 60 63 44 53 45.8 0.85
VA02E 35 45 10/14/87 Before 07/26/86 39.9 5.2 2,231 1,990 89.2 27 32 34 35 37 38 40 42 44 46 47 49 53 36 45 69.1 1.07 VA02E After 1 12112187 42.5 5.3 2,965 2,598 87.6 29 35 37 38 40 41 43 45 46 48 49 51 56 38 47 69.7 1.07 VA02E After 06/25/88 43.0 5.2 3,222 2,845 88.3 29 36 37 39 40 42 43 45 47 48 50 52 58 39 48 71.0 1.07
1 mi/h :: 1.61 km/h Note: All speed limits and vehicle speeds are shown in mi/h.

Table 41. Crash data for the experimental sites.
Third Before Second Before First Before First After Second After Experimental Period Period Period Total Before Period Period Total After
Site Diff. Length, Before After B3 B3 B3 B2 B2 B2 B1 B1 B1 B B B A1 A1 A1 A2 A2 A2 A A A Number Limit Miles Volume Volume Total Injury Month Total Injury Month Total Injury Month Total Injury Month Total Injury Month Total Injury Month Total Injury Month
Speed Limit Lowered by 15 or 20 mi/h at Experimental Sites
NJ04E -20 1.03 408 633 2 1 10 5 4 10 5 3 10 12 8 30 1 1 10 1 1 10
TX03E -20 0.80 1,173 1,378 4 1 12 3 0 12 8 1 12 15 2 36 4 1 12 11 4 11 15 5 23
VA06E -20 8.42 1,660 1,805 7 3 12 6 4 12 13 7 24 6 1 12 4 1 12 10 2 24 .......................... -.............. " ............................... ....................................................................... 00" ....................................................... 0 •••••• ............................................................................................... DE02E -15 2.11 468 486 0 0 12 1 1 12 0 0 12 1 1 36 1 0 12 1 0 12 2 0 24
NM01E -15 0.58 571 867 1 1 12 0 0 12 2 0 12 3 1 36 2 1 12 1 0 8 3 1 20
NM03E -15 1.04 473 263 0 0 12 0 0 12 0 0 12 0 0 36 0 0 12 0 0 9 0 0 21
NM04E -15 1.39 620 374 0 0 12 0 0 12 3 1 12 3 1 36 1 1 12 1 0 9 2 1 21
OH02E -15 2.74 1,453 1,803 17 6 12 21 10 12 20 10 12 58 26 36 17 7 12 25 8 12 42 15 24 OH13E -15 1.00 4,201 3,749 15 10 12 11 5 12 9 5 12 35 20 36 10 5 12 6 2 6 16 7 18
TX05E -15 1.17 10,752 13,035 33 13 12 27 6 12 21 10 12 81 29 36 30 13 12 30 13 12
10 Sites 20.28 72 32 75 29 74 34 221 95 72 30 49 15 121 45
Speed Limit Lowered by 10 mi/h at Experimental Sites
DE03E -10 0.77 8,986 9,042 3 1 12 6 3 12 13 3 12 22 7 36 13 8 12 2 2 12 15 10 24
DE04E -10 1.38 393 375 2 0 12 0 0 12 1 0 12 3 0 36 0 0 12 1 0 12 1 0 24 IL01E -10 0.89 8,457 10,006 15 4 9 13 3 9 16 7 9 44 14 27 21 4 9 21 4 9 IN01E -10 0.40 2,279 2,168 1 0 12 2 1 12 3 1 24 0 0 12 1 0 12 1 0 24
MA01E -10 1.00 303 289 3 0 12 4 1 12 7 1 24 2 0 12 3 0 12 5 0 24
ME02E -10 1.40 375 345 1 1 12 1 0 12 2 1 12 4 2 36 0 0 12 1 1 7 1 1 19 MI09E -10 0.56 2,544 2,975 2 2 12 4 1 12 0 0 12 6 3 36 2 1 12 0 0 6 2 1 18
NE01E -10 0.66 3,847 4,666 3 1 12 0 0 12 3 2 12 6 3 36 2 1 12 1 0 8 3 1 20
NJ02E -10 0.56 7,295 7,526 3 1 10 10 4 10 6 3 10 19 8 30 7 2 10 7 2 10
NJ03E -10 0.63 7,594 10,268 9 5 10 5 2 10 12 5 10 26 12 30 8 0 10 8 0 10
OH01E -10 0.52 3,948 3,192 1 1 12 1 0 12 3 1 12 5 2 36 2 0 12 1 1 12 3 1 24 OH03E -10 7.26 3,835 4,278 63 21 12 58 26 12 44 15 12 165 62 36 54 13 12 58 21 11 112 34 23
OH04E -10 0.47 3,464 2,559 0 0 12 3 2 12 3 2 12 6 4 36 4 0 12 2 0 12 6 0 24
OH05E -10 0.83 3,909 3,458 6 1 12 3 1 12 6 5 12 15 7 36 6 1 12 8 1 12 14 2 24
OH06E -10 0.75 1,113 1,022 0 0 12 1 1 12 3 1 12 4 2 36 0 0 12 0 0 12 0 0 24
OH07E -10 0.64 7,695 8,256 7 2 12 5 0 12 5 2 12 17 4 36 3 2 12 3 2 12 6 4 24
1 mi = 1.61 km 1 milh = 1.61 km/h Note: All speed limits are shown in mi/h. Blanks indicate that crash data were not available for the period.
» "'tJ "'tJ m Z C >< m .

Table 41. Crash data for the experimental sites (continued).
Third Before Second Before First Before First After Second After Experimental Period Period Period Total Before Period Period Total After
Site Diff. Length, Before After B3 B3 B3 B2 B2 82 81 81 B1 B B B Ai Ai Ai A2 A2 A2 A A A Number Limit Miles Volume Volume Total Injury Month Total Injury Month Total Injury Month Total Injury Month Total Injury Month Total Injury Month Total Injury Month
Speed Limit Lowered by 10 mi/h at Experimental Sites (continued)
OH08E -10 0.74 596 675 2 0 12 2 0 12 3 0 12 7 0 36 0 0 12 0 0 10 0 0 22 OH09E -10 1.10 3,261 3,920 8 4 12 5 0 12 3 2 12 16 6 36 10 4 12 1 1 8 11 5 20 OH10E -10 0.70 4,152 5,083 12 4 12 13 6 12 10 5 12 35 15 36 14 5 12 5 3 7 19 8 19 OH11E -10 0.73 1,350 1,417 1 1 12 0 0 12 2 2 12 3 3 36 3 1 12 1 0 9 4 1 21 OH12E -10 1.33 2,608 3,227 3 3 12 3 1 12 2 0 12 8 4 36 6 2 12 6 2 12 OK01E -10 0.69 9,691 11,051 24 7 12 19 3 12 9 1 12 52 11 36 9 2 12 15 7 12 24 9 24 OK02E -10 0.74 11,47210,985 12 1 12 16 3 12 12 4 12 40 8 36 9 0 12 6 1 12 15 1 24 OK03E -10 0.30 6,283 5,734 12 2 12 7 1 12 10 2 12 29 5 36 5 3 12 6 3 12 11 6 24 OK04E -10 0.30 5,625 5,302 3 1 12 0 0 12 2 0 12 5 1 36 2 1 12 . 2 1 12 4 2 24 TX02E -10 1.75 2,233 2,343 6 2 12 7 2 12 7 3 12 20 7 36 5 1 12 8 4 11 13 5 23 TX04E -10 0.46 2,991 3,433 3 1 12 1 0 12 2 2 12 6 3 36 0 0 12 2 2 10 2 2 22 VA01E -10 1.47 8,425 8,605 14 5 12 9 6 12 23 11 24 15 8 12 15 8 12 30 16 24 VA03E -10 1.19 1,303 1,292 4 2 12 1 1 12 2 2 12 7 5 36 1 0 12 1 1 9 2 1 21 VA04E -10 1.63 533 498 0 0 12 0 0 12 0 0 24 1 0 12 0 0 12 1 0 24 VA05E -10 1.67 927 1,066 2 0 12 3 1 12 3 2 12 8 3 36 2 1 12 2 1 12 VA07E -10 2.25 4,551 4,266 9 4 12 3 1 12 4 2 12 16 7 36 5 3 12 5 3 12 WV01E -10 1.14 8,902 9,193 28 8 12 31 6 12 32 12 12 91 26 36 33 10 12 50 14 12 83 24 24 WV03E -10 1.96 2,170 1,219 2 1 12 7 1 12 8 3 12 17 5 36 0 0 12 4 3 12 4 3 24
34 Sites 38.87 246 81 246 74 243 97 735 252 244 73 197 76 441 149
Speed Limit Lowered by 5 mi/h at Experimental Sites
AZ01E -5 1.00 7,830 8,028 1 1 12 4 2 12 2 0 12 7 3 36 4 2 12 6 3 12 10 5 24 CT02E -5 1.01 13,64612,183 16 4 12 18 6 12 23 9 12 57 19 36 34 9 12 26 10 12 60 19 24 CT05E -5 1.09 9,658 11,966 13 4 12 12 6 12 5 2 12 30 12 36 11 1 12 5 3 12 16 4 24 DE01E -5 0.80 986 775 1 1 12 0 0 12 1 1 12 2 2 36 1 1 12 0 0 12 1 1 24 ID01E -5 2.68 4,357 5,120 9 6 9 4 2 9 8 3 9 21 11 27 7 3 9 7 3 9 ID02E -5 3.50 8,064 8,200 26 10 9 16 5 9 18 8 9 60 23 27 20 8 9 20 8 9 IL02E -5 1.04 9,481 10,380 14 6 9 12 1 12 26 7 21 16 4 12 24 9 12 40 13 24
1 mi = 1.61 km 1 mi/h = 1.61 km/h Note: All speed limits are shown in mi/h. Blanks indicate that crash data were not available for the period.

Table 41, Crash data for the experimental sites (continued).
Third Before Second Before First Before First After Second After Experimental Period Period Period Total Before Period Period Total After
Site Oiff. Length, Before After B3 B3 B3 B2 B2 B2 B1 B1 B1 B B B A1 A1 A1 A2 A2 Ai A A A
Number Limit Miles Volume Volume Total Injury Month Total Injury Month Total Injury Month Total Injury Month Total Injury Month Total Injury Month Total Injury Month
Speed Limit Lowered by 5 mi/h at Experimental Sites (continued)
IN05E -5 0.80 1,455 1,500 7 0 12 6 1 12 13 1 24 5 1 12 3 0 12 8 1 24
IN06E -5 1.02 8,528 8,721 9 6 12 14 7 12 8 4 12 31 17 36 10 6 12 15 7 12 25 13 24
IN07E -5 1.12 5,743 5,954 8 3 12 10 3 12 7 2 12 25 8 36 6 3 12 10 5 12 16 8 24
MA03E -5 0.68 371 314 1 0 12 0 0 12 1 0 24 1 0 12 0 0 12 1 0 24
ME01E -5 1.30 306 315 0 0 12 0 0 12 0 0 12 0 0 36 1 1 12 1 0 7 2 1 19
NJ01E -5 0.88 12,66912,450 8 1 10 3 1 10 6 4 10 17 6 30 7 1 10 7 1 10
NM02E -5 2.97 484 712 0 0 12 1 0 12 0 0 12 1 0 36 1 0 12 0 0 8 1 0 20
14 Sites 19.89 91 36 104 38 96 35 291 109 124 40 90 37 214 77
Speed Limit Raised by 5 mi/h at Experimental Sites
AZ02E 5 1.00 1,296 1,332 1 1 12 2 1 12 1 0 12 4 2 36 1 0 12 1 0 9 2 0 21
AZ03E 5 1.00 4,005 4,156 4 2 12 5 0 12 7 1 12 16 3 36 5 2 12 5 2 12
CA06E 5 0.89 12,917 13,017 4 0 12 13 5 12 10 6 12 27 11 36 13 9 12 13 9 12
CA07E 5 2.73 14,13217,054 25 8 12 31 13 12 31 17 12 87 38 36 40 13 12 40 13 12
C001E 5 1.05 2,975 3,528 4 3 12 6 4 12 6 5 12 16 12 36 4 3 12 4 3 12
C003E 5 4.23 491 602 4 3 12 5 1 12 6 4 12 15 8 36 4 2 12 4 2 12
CT01E 5 1.77 17,040 18,923 26 8 12 26 8 12 15 1 12 19 6 12 34 7 24
CT04E 5 0.47 1,762 1,884 0 0 12 0 0 12 1 0 12 1 0 36 1 1 12 1 0 12 2 1 24
OE05E 5 1.87 428 453 12 5 12 9 4 12 11 8 12 32 17 36 6 3 12 7 5 12 13 8 24
IN02E 5 0.38 8,170 8,608 22 4 12 24 6 12 46 10 24 18 4 12 26 4 12 44 8 24
IN03E 5 0.38 8,698 9,162 16 3 12 33 4 12 49 7 24 28 4 12 31 8 12 59 12 24
M001E 5 4.72 2,898 3,284 2 1 12 4 3 12 7 5 12 13 9 36 4 2 12 4 2 12 8 4 24
M002E 5 7.33 6,046 6,681 15 7 12 8 6 12 23 13 12 46 26 36 15 8 12 17 13 12 32 21 24
M003E 5 4.00 2,509 2,769 1 0 12 0 0 12 2 1 12 3 1 36 5 4 12 4 2 12 9 6 24
M004E 5 5.83 2,794 3,854 6 3 12 7 3 12 15 10 12 28 16 36 7 5 12 14 7 12 21 12 24
M005E 5 12.60 2,908 3,176 26 21 12 19 7 12 33 16 12 78 44 36 25 17 12 23 17 12 48 34 24
M006E 5 0.80 3,666 4,114 1 0 12 2 0 12 3 3 12 6 3 36 1 1 12 2 1 12 3 2 24
1 mi = 1.61 km 1 milh = 1.61 kmlh Note: All speed limits are shown in mi/h. Blanks indicate that crash data were not available for the period.
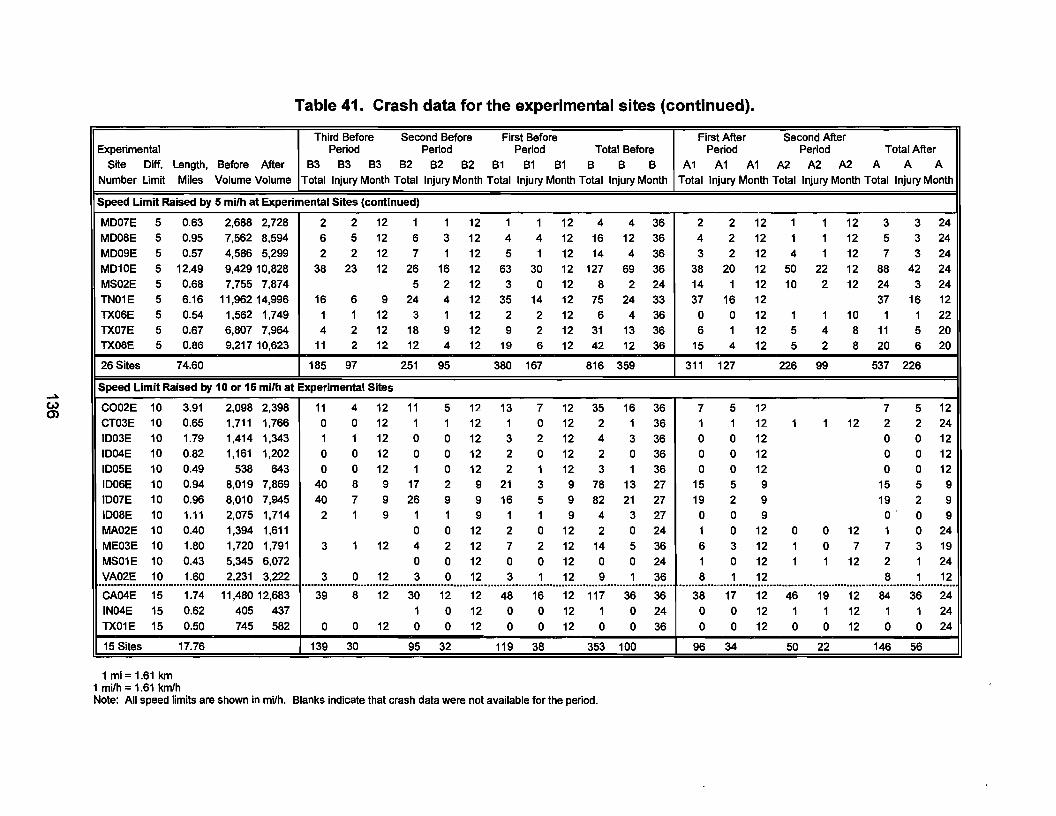
Table 41. Crash data for the experimental sites (continued).
Third Before Second Before First Before First After Second After Experimental Period Period Period Total Before Period Period Total After
Site Diff. Length, Before After B3 B3 B3 B2 B2 B2 B1 B1 B1 B B B A1 A1 A1 A2 A2 A2 A A A
Number Limit Miles Volume Volume Total Injury Month Total Injury Month Total Injury Month Total Injury Month Total Injury Month Total Injury Month Total Injury Month
Speed Limit Raised by 5 mi/h at Experimental Sites (continued)
MD07E 5 0.63 2,688 2,728 2 2 12 1 1 12 1 1 12 4 4 36 2 2 12 1 1 12 3 3 24
MD08E 5 0.95 7,562 8,594 6 5 12 6 3 12 4 4 12 16 12 36 4 2 12 1 1 12 5 3 24
M009E 5 0.57 4,586 5,299 2 2 12 7 1 12 5 1 12 14 4 36 3 2 12 4 1 12 7 3 24 M010E 5 12.49 9,429 10,828 38 23 12 26 16 12 63 30 12 127 69 36 38 20 12 50 22 12 88 42 24
MS02E 5 0.68 7,755 7,874 5 2 12 3 0 12 8 2 24 14 1 12 10 2 12 24 3 24 TN01E 5 6.16 11,962 14,996 16 6 9 24 4 12 35 14 12 75 24 33 37 16 12 37 16 12
TX06E 5 0.54 1,562 1,749 1 1 12 3 1 12 2 2 12 6 4 36 0 0 12 1 1 10 1 1 22
TX07E 5 0.67 6,807 7,964 4 2 12 18 9 12 9 2 12 31 13 36 6 1 12 5 4 8 11 5 20 TX08E 5 0.86 9,21710,623 11 2 12 12 4 12 19 6 12 42 12 36 15 4 12 5 2 8 20 6 20
26 Sites 74.60 185 97 251 95 380 167 816 359 311 127 226 99 537 226
Speed Limit Raised by 10 or 15 mi/h at Experimental Sites
C002E 10 3.91 2,098 2,398 11 4 12 11 5 12 13 7 12 35 16 36 7 5 12 7 5 12
CT03E 10 0.65 1,711 1,766 0 0 12 1 1 12 1 0 12 2 1 36 1 1 12 1 1 12 2 2 24
ID03E 10 1.79 1,414 1,343 1 1 12 0 0 12 3 2 12 4 3 36 0 0 12 0 0 12 ID04E 10 0.82 1,161 1,202 0 0 12 0 0 12 2 0 12 2 0 36 0 0 12 0 0 12
I005E 10 0.49 538 643 0 0 12 1 0 12 2 1 12 3 1 36 0 0 12 0 0 12 ID06E 10 0.94 8,019 7,869 40 8 9 17 2 9 21 3 9 78 13 27 15 5 9 15 5 9 ID07E 10 0.96 8,010 7,945 40 7 9 26 9 9 16 5 9 82 21 27 19 2 9 19 2 9 I008E 10 1.11 2,075 1,714 2 1 9 1 1 9 1 1 9 4 3 27 0 0 9 O' 0 9 MA02E 10 0.40 1,394 1,611 0 0 12 2 0 12 2 0 24 1 0 12 0 0 12 1 0 24 ME03E 10 1.80 1,720 1,791 3 1 12 4 2 12 7 2 12 14 5 36 6 3 12 1 0 7 7 3 19 MS01E 10 0.43 5,345 6,072 0 0 12 0 0 12 0 0 24 1 0 12 1 1 12 2 1 24 VA02E 10 1.60 2,231 3,222 3 0 12 3 0 12 3 1 12 9 1 36 8 1 12 8 1 12 ........................ -............................ -............. ................................. " •••••••••••••••••••••••••••••••••••••••••••••• a ....................... " ................... .......................................... 0 ..........................................................
CA04E 15 1.74 11,48012,683 39 8 12 30 12 12 48 16 12 117 36 36 38 17 12 46 19 12 84 36 24
IN04E 15 0.62 405 437 1 0 12 0 0 12 1 0 24 0 0 12 1 1 12 1 1 24 TX01E 15 0.50 745 582 0 0 12 0 0 12 0 0 12 0 0 36 0 0 12 0 0 12 0 0 24
15 Sites 17.76 139 30 95 32 119 38 353 100 96 34 50 22 146 56
1 mi = 1.61 km 1 milh = 1.61 kmlh Note: All speed limits are shown in mi/h. Blanks indicate that crash data were not available for the period.

Table 42. Crash data for the comparison sites.
Third Before Second Before First Before First After Second After Comparison Period Period Period Total Before Period Period Total After
Site Posted Length, Before After B3 B3 B3 B2 B2 B2 B1 B1 B1 B B B A1 A1 A1 A2 A2 A2 A A A
Number Limit Miles Volume Volume Total Injury Month Total Injury Month Total Injury Month Total Injury Month Total Injury Month Total Injury Month Total Injury Month
Speed Limit Lowered by 15 or 20 mi/h at Experimental Sites
NJ04C 50 1.66 1,440 1,810 2 2 10 0 0 10 0 0 10 2 2 30 0 0 10 0 0 10 TX03C 55 2.39 459 418 3 2 12 3 1 12 2 1 12 8 4 36 1 0 12 6 2 11 7 2 23
VA06C 55 2.85 983 1,220 2 1 12 0 0 12 2 1 24 3 1 12 5 2 12 8 3 24 ............. _ ...................................................... .................................................................... 0 .....................................................................• ~ •••••••••• ................................................................................................... " ............ DE02C 50 2.62 213 245 3 2 12 1 0 12 0 0 12 4 2 36 1 0 12 0 0 12 1 0 24 NM01C 55 3.31 1,496 1,779 2 0 12 3 1 12 4 0 12 9 1 36 4 3 12 1 1 8 5 4 20 NM03C 40 1.70 577 744 3 0 12 7 1 12 12 5 12 22 6 36 6 5 12 7 3 9 13 8 21 OH02C 55 3.00 668 894 7 2 12 5 1 12 2 0 12 14 3 36 5 2 12 8 3 12 13 5 24 OH13C 55 1.00 6,517 5,198 7 2 12 13 9 12 9 5 12 29 16 36 5 0 12 7 4 6 12 4 18 TX05C 55 1.17 4,281 5,242 7 3 12 6 4 12 2 1 12 15 8 36 0 0 12 0 0 12
9 Sites 19.70 34 13 40 18 31 12 105 43 25 11 34 15 59 26
Speed Limit Lowered by 10 mi/h at Experimental Sites
DE03C 50 1.58 3,005 2,892 5 3 12 4 0 12 8 2 12 17 5 36 3 2 12 4 1 12 7 3 24 DE04C 50 1.58 3,005 2,919 5 3 12 4 0 12 8 2 12 17 5 36 3 2 12 4 1 12 7 3 24 IL01C 45 1.15 9,208 11,059 14 5 9 7 4 9 13 6 9 34 15 27 11 3 9 11 3 9 IN01C 55 0.45 1,993 2,071 0 0 12 0 0 12 0 0 24 1 0 12 2 0 12 3 0 24 MA01C 30 0.99 581 598 0 0 12 1 0 12 1 0 24 2 1 12 0 0 12 2 1 24 ME02C 45 2.15 364 440 1 0 12 0 0 12 1 0 12 2 0 36 0 0 12 0 0 7 0 0 19 MI09C 55 0.82 3,180 3,775 1 0 12 4 2 12 6 2 12 11 4 36 0 0 12 0 0 6 0 0 18
NE01C 55 0.62 821 1,018 2 1 12 0 0 12 0 0 12 2 1 36 1 1 12 0 0 8 1 1 20
NJ02C 50 0.78 2,161 2,260 2 1 10 3 2 10 0 0 10 5 3 30 2 ;2 10 2 2 10
NJ03C 50 0.78 2,045 2,277 2 1 10 3 2 10 0 0 10 5 3 30 2 2 10 2 2 10
OH01C 55 0.59 3,720 2,949 2 1 12 1 0 12 3 1 12 6 2 36 2 0 12 0 0 12 2 0 24 OH03C 55 6.37 1,491 1,807 24 14 12 22 9 12 36 16 12 82 39 36 39 20 12 38 17 11 77 37 23 OH04C 55 0.37 2,826 1,996 3 1 12 3 1 12 0 0 12 6 2 36 1 1 12 0 0 12 1 1 24
1 mi = 1.61 km 1 mi/h = 1.61 kmlh Note: All speed limits are shown in mi/h. Blanks indicate that crash data were not available for the period.

Table 42. Crash data for the comparison sites (continued).
Third Before Second Before First Before First After Second After Comparison Period Period Period Total Before Period Period Total After
Site Posted Length, Before After B3 B3 B3 B2 B2 B2 B1 B1 B1 B B B Ai Ai Ai A2 A2 A2 A A A
Number Limit Miles Volume Volume Total Injury Month Total Injury Month Total Injury Month Total Injury Month Total InjurY Month Total Injury Month Total Injury Month
Speed Limit Lowered by 10 mi/h at Experimental Sites (continued)
OH05C 55 1.12 2,771 2,419 4 1 12 3 0 12 5 3 12 12 4 36 4 0 12 1 0 12 5 0 24
OH06C 55 0.96 854 889 0 0 12 1 0 12 0 0 12 1 0 36 1 1 12 0 0 12 1 1 24
OH07C 55 0.74 6,534 7,816 6 4 12 2 1 12 6 4 12 14 9 36 5 0 12 2 1 12 7 1 24
OH08C 55 1.16 554 562 0 0 12 4 1 12 2 1 12 6 2 36 1 0 12 1 1 10 2 1 22
OH09C 55 1.04 2,957 4,233 4 2 12 2 1 12 1 0 12 7 3 36 8 6 12 2 1 8 10 7 20
OH10C 55 1.04 2,957 4,233 4 2 12 2 1 12 1 0 12 7 3 36 8 6 12 1 1 7 9 7 19
OH11C 50 0.83 1,327 1,513 0 0 12 2 1 12 1 0 12 3 1 36 6 2 12 0 0 9 6 2 21
OH12C 55 1.58 1,835 2,153 1 1 12 2 1 12 1 0 12 4 2 36 3 1 12 3 1 12
OK01C 45 0.76 6,456 6,794 6 3 12 4 2 12 6 2 12 16 7 36 5 4 12 6 2 12 11 6 24
OK04C 35 0.50 7,258 6,937 7 3 12 12 6 12 10 6 12 29 15 36 8 0 12 11 4 12 19 4 24
TX02C 55 2.39 459 418 3 2 12 3 1 12 2 1 12 8 4 36 1 0 12 6 2 11 7 2 23
TX04C 55 0.55 603 1,526 1 0 12 4 0 12 1 0 12 6 0 36 0 0 12 0 0 10 0 0 22
VA01C 55 1.55 7,973 9,407 13 9 12 9 6 12 22 15 24 7 5 12 11 6 12 18 11 24
VA03C 55 1.72 967 1,154 0 0 12 0 0 12 3 1 12 3 1 36 0 0 12 0 0 9 0 0 21
VA04C 55 1.72 967 1,154 0 0 12 0 0 12 0 0 24 3 1 12 0 0 12 3 1 24
VA05C 55 1.72 967 1,111 0 0 12 0 0 12 3 1 12 3 1 36 0 0 12 0 0 12
VA07C 55 2.04 2,144 2,150 3 2 12 5 4 12 0 0 12 8 6 36 2 1 12 2 1 12
WV03C 45 2.55 1,035 707 3 0 12 7 3 12 4 0 12 14 3 36 6 2 12 3 1 12 9 3 24
31 Sites 42.20 103 50 117 51 131 54 351 155 135 63 92 38 227 101
1 mi = 1.61 km 1 mi/h = 1.61 kmlh Note: All speed limits are shown in milh. Blanks indicate that crash data were not available for the period.
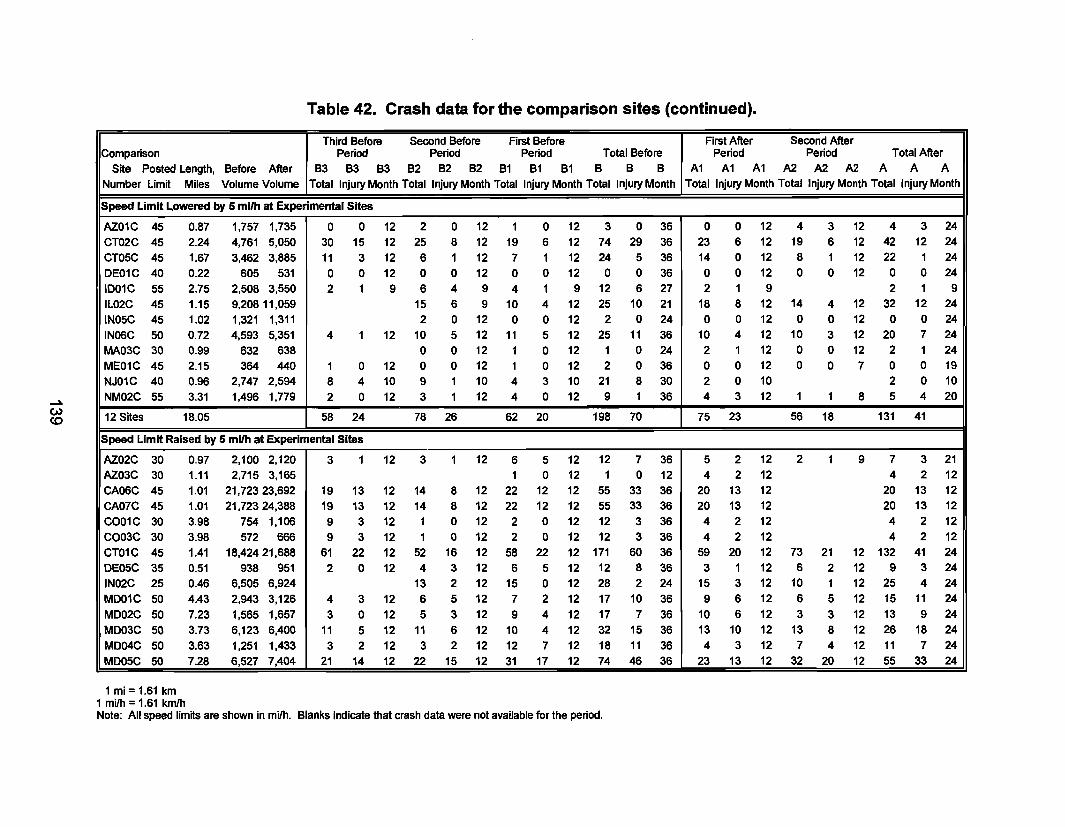
Table 42. Crash data for the comparison sites (continued).
Third Before Second Before First Before First After Second After Comparison Period Period Period Total Before Period Period Total After
Site Posted Length, Before After 83 B3 B3 B2 B2 82 81 B1 B1 B B B A1 A1 A1 A2 A2 A2 A A A
Number Limit Miles Volume Volume Total Injury Month Total Injury Month Total Injury Month Total Injury Month Total Injury Month Total Injury Month Total Injury Month
Speed Limit L.owered by 5 mi/h at Experimental Sites
AZ01C 45 0.87 1,757 1,735 0 0 12 2 0 12 1 0 12 3 0 36 0 0 12 4 3 12 4 3 24
CT02C 45 2.24 4,761 5,050 30 15 12 25 8 12 19 6 12 74 29 36 23 6 12 19 6 12 42 12 24
CT05C 45 1.67 3,462 3,885 11 3 12 6 1 12 7 1 12 24 5 36 14 0 12 8 1 12 22 1 24
DE01C 40 0.22 605 531 0 0 12 0 0 12 0 0 12 0 0 36 0 0 12 0 0 12 0 0 24
ID01C 55 2.75 2,508 3,550 2 1 9 6 4 9 4 1 9 12 6 27 2 1 9 2 1 9
I L02C 45 1.15 9,208 11,059 15 6 9 10 4 12 25 10 21 18 8 12 14 4 12 32 12 24
IN05C 45 1.02 1,321 1,311 2 0 12 0 0 12 2 0 24 0 0 12 0 0 12 0 0 24
IN06C 50 0.72 4,593 5,351 4 1 12 10 5 12 11 5 12 25 11 36 10 4 12 10 3 12 20 7 24
MA03C 30 0.99 632 638 0 0 12 1 0 12 1 0 24 2 1 12 0 0 12 2 1 24
ME01C 45 2.15 364 440 1 0 12 0 0 12 1 0 12 2 0 36 0 0 12 0 0 7 0 0 19
NJ01C 40 0.96 2,747 2,594 8 4 10 9 1 10 4 3 10 21 8 30 2 0 10 2 0 10
NM02C 55 3.31 1,496 1,779 2 0 12 3 1 12 4 0 12 9 1 36 4 3 12 1 1 8 5 4 20
12 Sites 18.05 58 24 78 26 62 20 198 70 75 23 56 18 131 41
Speed Limit Raised by 5 mi/h at Experimental Sites
AZ02C 30 0.97 2,100 2,120 3 1 12 3 1 12 6 5 12 12 7 36 5 2 12 2 1 9 7 3 21
AZ03C 30 1.11 2,715 3,165 1 0 12 1 0 12 4 2 12 4 2 12
CA06C 45 1.01 21,72323,692 19 13 12 14 8 12 22 12 12 55 33 36 20 13 12 20 13 12
CA07C 45 1.01 21,72324,388 19 13 12 14 8 12 22 12 12 55 33 36 20 13 12 20 13 12
C001C 30 3.98 754 1,106 9 3 12 1 0 12 2 0 12 12 3 36 4 2 12 4 2 12
C003C 30 3.98 572 666 9 3 12 1 0 12 2 0 12 12 3 36 4 2 12 4 2 12
CT01C 45 1.41 18,42421,688 61 22 12 52 16 12 58 22 12 171 60 36 59 20 12 73 21 12 132 41 24 DE05C 35 0.51 938 951 2 0 12 4 3 12 6 5 12 12 8 36 3 1 12 6 2 12 9 3 24 IN02C 25 0.46 6,505 6,924 13 2 12 15 0 12 28 2 24 15 3 12 10 1 12 25 4 24
MD01C 50 4.43 2,943 3,126 4 3 12 6 5 12 7 2 12 17 10 36 9 6 12 6 5 12 15 11 24
M002C 50 7.23 1,565 1,657 3 0 12 5 3 12 9 4 12 17 7 36 10 6 12 3 3 12 13 9 24
M003C 50 3.73 6,123 6,400 11 5 12 11 6 12 10 4 12 32 15 36 13 10 12 13 8 12 26 18 24
M004C 50 3.63 1,251 1,433 3 2 12 3 2 12 12 7 12 18 11 36 4 3 12 7 4 12 11 7 24
M005C 50 7.28 6,527 7,404 21 14 12 22 15 12 31 17 12 74 46 36 23 13 12 32 20 12 55 33 24
1 mi = 1.61 km 1 milh = 1.61 kmlh Note: All speed limits are shown in milh. Blanks indicate that crash data were not available for the period.

Table 42. Crash data for the comparison sites (continued).
Third Before Second Before First BeforeComparison
First After Second AfterPeriod Period Period Total Before Period Period Total After
Site Posted Length, Before After B3 B3 B3 B2 B2 B2 Bl Bl Bl B B B Al Al Al A2 A2 A2 A A Alumber Limit Miles Volume Volume Total Injury Month Total Injury Month Total Injury Month Total Injury Month Total Injury Month Total Injury Month Total Injury Month
‘peed Limit Raised by 5 mi/h at Experimental Sites (continued)
12 2 0 12 5 1 24
ID03C 20 4 0 12ID06C 25 20 5 9ID07C 25 20 5 9ID08C 35 2 1 9MA02C 30ME03C 35MS01C 35
10 3 12
IN04C 30 3 0 12 1 0 12 4
1 mi=1.61 km1 mi/h = 1.61 km/hNote: All speed limits are shown in mi/h. Blanks indicate that crash data were not available for the period.

APPENDIX F. CRASH ANALYSIS PROCEDURE
An example of the procedure used to analyze the crash data is provided in this appendix. For purposes of illustration, the analysis described below is for total crashes that were reported by the police on 41 experimental sites where speed limits were raised and on their corresponding comparison sites.
The four methods used to estimate safety effects were the multiple before and after analyses with paired comparison ratios, cross-product ratio, EBEST, and before and after analyses using the weighted average logit. The null hypothesis tested was that the observed crashes after treatment, i.e., installation of the new speed limit signs, were equal to the expected crashes after treatment. All statistical analyses were conducted at the 0.05 significance level (0). Rejection of the null hypothesis required a probability or p-value < 0.05.
Procedure
The first step in the analysis was to determine if the crash history for the comparison group was comparable to the crash history for the experimental group during the before period and during the after period. As an excellent discussion of the comparability procedure is provided by Griffin, only a brief summary is included below.135]
To address the comparability question, the goodness-of-fit test was applied using the likelihood ratio chi-square (G) test as shown below:
where:
rii .. G = -2 L L x .. In _IJ
IJ i J xlj
xij = observed crash frequency in cell ij, row (i) and column 0)
Shown in table 43 are total crashes listed by year for the before and after periods for the raised speed limit experimental and comparison sites. It should be noted that at most sites, the before data covered a 3-yr period and the after data were for a 2-yr period. As crash data were not available for all of the sites for all years, direct comparison of the before and after totals is misleading and inappropriate.
Applying the above formula to the three before periods and to the two after periods shown in table 43 produces the following results:
Gbefore = 6.82 GAfter = 0.51
Gcomparability = 7.33
141

Table 43. Crash summary by year for the siteswhere speed limits were raised.
Number of Total CrashesYear Experimental Comparison
Before PeriodB3 - Third 324 280B2 - Second 346 256B1 - First 499 325
Treatment Period (New Speed Limits Posted)
After PeriodAl - First 407 329A2 - Second 276 205
As a G-value of 7.33 with three degrees of freedom is not statistically significant(G = 7.82, a = 0.05) there is little reason to doubt the comparability of the comparisongroup. In other words, during the 3-yr before period and, again, during the 2-yr afterperiod, crashes at the comparison and experimental sites changed at a similar rate.
It should be noted, however, that the rate of change in crashes fro m B1 (theyear before the speed limit change) to Al (the year after the change) is less for theexperimental sites than it is for the comparison sites (4071499 = 0.82 compared to3291325 = 1 .01). This suggests that crashes at the experimental sites may havedecreased following implementation of the higher posted speed limits.
As crash histories during the multiple before and after periods at the experi-mental and comparison sites were comparable, the next step in the analysis was toestimate the change in crashes following implementation of the new speed limits. Thepaired comparison ratios method described by Griffin, and the classical cross-productratio were used to estimate the safety effects.
In cases where the crash histories at the comparison sites were not comparablewith the crash histories at the experimental sites, i.e., the G-value is statisticallysignificant, only a before-and-after analysis was conducted. When the crash historiesare not comparable, it is not appropriate to use the comparison sites to estimate safetyeffects.
The paired comparison ratios method estimates the overall effect of the speedlimit changes on crashes using a weighted average log odds ratio based upon theindividual log odds ratios of the crash counts at each treatment location. In this study,the comparison ratios included the crash counts, traffic volumes, and crash repotting
142
periods. It was assumed that the crash reporting periods were known without error. Itwas also assumed that the crash counts and traffic volumes were known with error.Accordingly, the weighting coefficient was calculated using the reciprocals of the beforeand after crashes, and before and after traffic volumes for the experimental andcomparison sites. In addition, a chi-square test of homogeneity was used to determineif the treatment effects were consistent among the locations studied. The test ofhomogeneity is applied only when statistically significant treatment effects are found.
Shown in table 44 is the application of the method for the sites where speedlimits were raised. The data presented in table 44 contain all of the raised speed limitsites and corresponding comparison sites. In a few cases, when two experimental siteswere in close proximity and two suitable comparison locations were not available, speedand crash data were collected at one comparison site. In the crash analyses, duplicatecomparison sites were not used.
Several of the experimental and comparison sites had zero crashes in either thebefore and/or after periods. Because the natural logarithm of zero is undefined, a valueof 0.5 was substituted for zero so the analysis could proceed. In cases where theexperimental site did not have a corresponding comparison site, the comparison ratiosand corresponding odds ratios were calculated using only the crash counts, trafficvolumes, and time periods for the experimental sites.
Excellent summaries of the paired comparison ratios method with examples aregiven by Griffin . [36,37] Both Griffin and Pendleton provide good examples of the cross-product ratio . [35,38] The EBEST methodology is not presented in this report as anexcellent discussion is provided b y Pendleton.[38]
The results of the paired comparison ratios analyses, shown in table 44,indicated that there was no significant difference in total crashes after speed limits wereraised at the 41 experimental sites, Z = -1.37. The cross-product or odds ratio methodand the EBEST estimate also indicated that there was no significant difference in totalcrashes. In this report, the safety estimate (in percent), the Z-value, and the level ofsignificance are presented along with the 95 percent confidence limits.
As the reference group size required by EBEST could not be obtained for thisanalysis, the EBEST estimates are not valid. The EBEST method was employed in thisanalysis to obtain an indication of regression-to-the-mean bias present in th e dataset,because the paired comparison ratios method does not specifically account forregression-to-the-mean bias.
For the crash dataset, the EBEST method indicated that the average shrinkagewas 0.10, which suggests little regression-to-the-mean bias. Average shrinkage factorsrange from 0 (no regression-to-the-mean bias) to 1.0, indicating substantial bias. Afactor of 0.10 suggests that the posted speed limit increases made in this study werenot conducted primarily at high-crash locations, or perhaps using multiple years of datain the analysis minimized the effect. Due to the low shrinkage factor, it was felt thatregression-to-the-mean bias had little effect on the safety estimates obtained.
143

Table 44. Example of paired comparison ratios method using raised speed limit sites.
Experimental Comparison Comp.Site Crashes Crashes Ratios Percent
Number Before After Before After C B* Change Z L W wL (L-Lt)2 w(L-Lt)2 wL2
AZ02E 4 2 12 7 0.59 2.38 -15.8 -0.17 -0.1721 1.0218 -0.1758 0.0027 0.0028 0.0303AZ03E 16 5 1 4 1.19 18.99 -73.7 -1.08 -1.3345 0.6606 -0.8816 1 .4759 0.9750 1.1765CA06E 27 13 55 20 0.34 9.07 43.3 0.84 0.3598 5.4829 1.9726 0.2298 1.2601 0.7097CA07E 87 40 55 20 0.39 34.01 17.6 0.50 0.1623 9.5336 1.5478 0.0795 0.7581 0.2513CO01E 16 4 12 4 0.27 4.31 -7.2 -0.09 -0.0751 1.5416 -0.1157 0.0020 0.0031 0.0087CO03E 15 4 12 4 0.35 5.27 -24.0 -0.34 -0.2748 1.5222 -0.4183 0.0241 0.0367 0.1150CT01E 26 34 171 132 2.18 56.80 -40.1 -1.80 -0.5132 12.2686 -6.2962 0.1549 1.9003 3.2312CT04E 1 2 0.5 0.5 0.71 0.71 180.6 0.44 1.0317 0.1818 0.1875 1.3255 0.2410 0.1935DE05E 32 13 12 9 0.78 25.05 -48.1 -1.18 -0.6561 3.2333 -2.1214 0.2878 0.9306 1.3919IN02E 46 44 28 25 0.88 40.65 8.2 0.23 0.0791 8.2838 0.6551 0.0395 0.3271 0.0518IN03E 49 59 0.5 0.5 1.05 51.61 14.3 0.07 0.1337 0.2477 0.0331 0.0642 0.0159 0.0044MD01E 13 8 17 15 0.94 12.24 -34.6 -0.74 -0.4251 3.0421 -1.2931 0.0933 0.2838 0.5496MDO2E 46 32 17 13 0.80 36.71 -12.8 -0.31 -0.1374 5.2550 -0.7220 0.0003 0.0017 0.0992MD03E 3 9 32 26 0.86 2.57 249.7 1.74 1.2519 1.9409 2.4298 1.8811 3.6509 3.0418MD04E 28 21 18 11 0.74 20.61 1.9 0.04 0.0190 4.3120 0.0819 0.0192 0.0829 0.0016MD05E 78 48 74 55 0.72 55.82 -14.0 -0.59 -0.1509 15.0838 -2.2755 0.0010 0.0147 0.3433MD06E 6 3 0.5 5 10.29 61.76 -95.1 -1.84 -3.0247 0.3701 -1.1196 8.4393 3.1238 3.3864MDO7E 4 3 0.5 5 9.31 37.24 -91.9 -1.51 -2.5187 0.3590 -0.9043 5.7555 2.0665 2.2777MD08E 16 5 1 4 4.17 66.72 -92.5 -2.11 -2.5910 0.6606 -1.7115 6.1078 4.0346 4.4347MD09E 14 7 4 8 2.30 32.22 -78.3 -1.99 -1.5266 1 .6939 -2.5860 1.9795 3.3532 3.9477MD10E 127 88 13 11 1.01 127.86 -31.2 -0.86 -0.3736 5.3332 -1.9923 0.0645 0.3439 0.7443MS02E 8 24 6 26 4.24 33.90 -29.2 -0.57 -0.3453 2.6856 -0.9272 0.0509 0.1367 0.3201TN01E 75 37 18 11 0.59 44.47 -16.8 -0.42 -0.1839 5.3335 -0.9808 0.0041 0.0220 0.1803TX06E 6 1 0.5 0.5 1.13 6.79 -85.3 -0.84 -1.9153 0.1935 -0.3705 3.2243 0.6238 0.7097TX07E 31 11 41 16 0.46 14.24 -22.7 -0.56 -0.2581 4.7469 -1.2250 0.0192 0.0910 0.3161TX08E 42 20 0.5 0.5 0.64 26.89 -25.6 -0.15 -0.2961 0.2455 -0.0727 0.0311 0.0076 0.0215CO02E 35 7 0.5 0.5 0.38 13.33 -47.5 -0.32 -0.6445 0.2397 -0.1545 0.2755 0.0660 0.0995CT03E 2 2 0.5 0.5 0.69 1.38 45.3 0.17 0.3738 0.2000 0.0747 0.2435 0.0487 0.0279

Table 44. Example of paired comparison ratios method using raised speed limit sites (continued).
Experimental Comparison Compo Site Crashes Crashes Ratios Percent
Number Before After Before After C B* Change Z L w wL (L-LW w(L-LW WL2
ID03E 4 0.5 3 4 1.37 5.48 -90.9 -1.42 -2.3947 0.3522 -0.8433 5.1759 1.8228 2.0195
ID04E 2 0.5 0.5 0.5 0.35 0.69 -27.6 -0.13 -0.3224 0.1538 -0.0496 0.0411 0.0063 0.0160
ID05E 3 0.5 0.5 0.5 0.40 1.20 -58.2 -0.35 -0.8714 0.1578 -0.1375 0.5652 0.0892 0.1198 ID06E 78 15 69 20 0.28 21.50 -30.2 -0.95 -0.3599 6.9212 -2.4909 0.0577 0.3995 0.8964
ID07E 82 19 69 20 0.25 20.52 -7.4 -0.21 -0.0768 7.7020 -0.5912 0.0018 0.0142 0.0454
ID08E 4 0.5 7 2 0.28 1.12 -55.2 -0.47 -0.8028 0.3451 -0.2770 0.4667 0.1610 0.2224
MA02E 2 1 1 2 2.25 4.49 -77.7 -0.87 -1.5021 0.3328 -0.4999 1.9113 0.6361 0.7509 ME03E 14 7 4 0.5 0.12 1.71 309.7 0.90 1.4103 0.4051 0.5713 2.3407 0.9483 0.8058
MS01E 0.5 2 7 6 0.83 0.42 381.5 0.94 1.5717 0.3558 0.5592 2.8607 1.0178 0.8789 VA02E 9 8 32 10 0.49 4.43 80.7 0.97 0.5917 2.7127 1.6051 0.5060 1.3726 0.9497
..................................................................................................................................................... _ .......................................................... _ ..................... - ............................................................... CA04E 117 84 62 35 0.50 58.77 42.9 1.39 0.3572 15.2067 5.4322 0.2274 3.4580 1.9405
IN04E 1 1 4 3 0.71 0.71 40.6 0.21 0.3411 0.3858 0.1316 0.2123 0.0819 0.0449
TX01E 0.5 0.5 4 1 0.22 0.11 363.9 0.67 1.5345 0.1903 0.2920 2.7361 0.5207 0.4481
Total 1,170.0 685.5 866.0 538.5 964.72 130.8945 -15.6595 34.9306 36.8040
Comparison Ratios = Ratio of comparison site after crashes to before crashes, and ratio of before and after time periods and ratio of before and after traffic volumes at the comparison and experimental sites.
B* = Experimental site before crashes multiplied by the comparison ratios. Change = Percent change in experimental site crashes from before to after.
L = Log Odds Ratio = In(after experimental site crashes divided by the before experimental site crashes multiplied by the comparison ratios). w = Weighting Coefficient = 1 divided by the reciprocals of the before and after crashes and traffic volumes for the experimental and
comparison sites. Lt = Weighted average log odds ratio = ~wL + ~w = -0.1196
Lse = Standard error of the weighted average Log Odds Ratio = 1 + ..[~w = 0.0874 Et = Apparent change in crashes at the experimental sites in percent = -11.28 Z = Standard Normal Z-test = LtlLse = -1.37
Lower Limit = 95% Lower confidence limit in percent = -25.24 Upper Limit = 95% Upper confidence limit in percent = 5.30
Chi-square summary to assess the homogeneity of treatment effect:
Source Treatment Homogeneity Total
X2
Lt2(~W) = 1.87 ~w(L-LW = 34.93 ~WL2 = 36.80
Degrees of Freedom 1
40 41

When the comparability tests indicated the experimental and comparison siteswere not comparable, the before-and-after design employing the weighted averag e logitwas used to estimate the safety effect. The calculations for this procedure were similarto the ones illustrated in table 44; however, the comparison site data were not used inthe analysis.
When the treatment effect is significant, the paired comparison ratios methodand the before-and-after weighted average logit method permit the analyst to estimatethe consistency of the treatment effect across all sites. The question posed is-Werethe changes in crashes consistent or similar for all treatment sites? As reflected intable 44, a chi-square test of homogeneity is used to determine the consistency of thetreatment effect. In the analyses conducted in this study, the treatment effects were notsignificant and the chi-square tests were not significant.
146

APPENDIX G. EFFECTS ON A SAMPLE OF INTERSTATE SECTIONS
When this research was initiated in October 1985, the maximum speed limit onlimited access highways was 5 5 mi/h (89 km/h). Consequently, the initial experimentaldesign for the study did not include these special high-spee d facilities.[10] In April 1987,near the end of the site-selection phase of the study, Congress permitted States toraise the speed limit on selected limited access facilities to 6 5 mi/h (105 km/h). Afterenactment of the legislation, four Interstate experimental sites where the speed limitswere raised and three comparison sites and three nearby sites where the speed limitswere not changed were selected for study. Available funding and time constraints didnot permit the random selection of a representative sample of Interstate sites nor theintensive collection of speed and crash data that would be required to draw conclusionsconcerning the effects of raising speed limits on driver behavior and the effects oncrashes on these facilities.
Before and after speed and crash data were collected to obtain an indication ofthe effects of raising the speed limit at the study sites. A summary of the effects ofraising the speed limit on vehicle speeds and crashes for this limited number of sites isgiven in this appendix.
Site Characteristics
Shown in table 45 are the general characteristics of the experimental sites. Thecharacteristics of the comparison and nearby sites are shown in table 46. Site selectionfor the experimental locations was limited to States that were planning to raise speedlimits on Interstate facilities, and to locations where existing inductive loops, buried inthe pavement, could be used to collect before and after speed data. Four experimentalsites, representing 94 mi (151 km), were selected in California, Michigan, and Virginia.Comparison sites were selected in California and Michigan. A comparison site for theVirginia experimental sites was selected in Maryland, a State that retained th e 55-mi/h(89-km/h) speed limit.
The experimental four-lane sites were located in rural areas and carried 24-htraffic volumes ranging from 14,000 to 34,000 vehicles. As shown in table 45, the65-mi/h (105-km/h) speed limits on these sections were posted between June 1987 andJuly 1988. The speed limit for trucks remained at 5 5 mi/h (89 km/h) on these sections.
Vehicle Speed Results
Before and after 24-h free-flow vehicle (a vehicle with a headway of 4 s or more)speed data, as well as the differences in the speed characteristics for the experimentalsites, are shown in tables 47 through 49. Speed data for the comparison and nearbysites are given in tables 50 through 52. The data were collected between April 1987and August 1989. The volume and speed data for the Michigan sites include vehiclesfor both directions of travel; however, because inductive loops were only installed in onedirection of travel, the data for the other Interstate sites are for one direction of travel.
147

Table 45. Interstate experimental site characteristics.
InterstateSite
Number Jurisdiction
CA08E Colusa CountyMI08E Livingston & lngham Cos.VA08E Fauquier County
Route
l-5 near Williamsl-96 near Fowlervillel-66 E. of Marshall
Before After Date Intersections DrivewaysLength, No. Speed Speed New Limit Signalized No Signal Comm. Resid.
Area Miles Lanes Limit Limit Posted Per Mile
Rural 24.76 4 55 65 06103187 Not ApplicableRural 15.83 4 55 65 11129187 Not ApplicableRural 21.93 4 55 65 07/01/88 Not Applicable
VA09EE Rockbridge County l-81 S. of Lexington Rural 31.73 4 55 65 07/01/88 Not Applicable
4 Sites 94.27 Miles
1 mi= 1.61 km1 mi/h = 1.61 km/hNote: All speed limits are shown in mi/h.
Table 46. Interstate comparison and nearby site characteristics.
ComparisonSite
Number Jurisdiction
CA08C Sacramento CountyMI08C Genesee CountyMD70C Frederick & Washington Cos.CA08P Sacramento CountyMI81P lngham CountyMI82P Washtenaw County
1 mi= 1.61 km1 mi/h = 1.61 km/hNote: All speed limits are shown in mi/h.
Route Area
99 at Grant Line Road Rurall-69 near Flint UrbanI-70 W. of Frederick RuralI-5 in Sacramento Urban52 S. of l-96 RuralRt. 52 S. of l-94 Rural
Posted Intersections DrivewaysLength, No. Speed Signalized No Signal Comm. Resid.Miles Lanes Limit Per Mile
19.61 4 55 Not Applicable19.91 4 55 Not Applicable28.31 4 55 Not Applicable21.72 8 55 Not Applicable13.12 2 55 0.00 2.59 0.15 11.139.18 2 55 0.00 1.31 1.85 10.35

Table 47. Before speed data for the Interstate experimental sites.
BeforeExperimental Data Std. Free- Pct.
Site Before After Diff. Date Limit Collection Mean1 0-mi/h Pace
Dev. Before Flow FreeNumber Limit Limit Limit Posted
Percentile Speeds Lower Upper Pct. Skew.Date Speed Speeds Volume Volume Flow 1 5 10 155 25 35 50 65 75 85 90 95 99 Limit Limit Pace Index
CA08E 55 65 10 06/03/87 04/28/87 64.7 6.6 6,839 5,674 83.0 45 54 58 60 62 64 66 67 69 71 72 74 81 61 70MI08E
65.555 65
0.8210 11/29/87 1 O/08/87 64.8 6.3 34,399 20,392 59.3 51 56 58 59 61 63 65 67 69 71 73 76 82 60
VA08E69 61.0 1.11
55 65 10 07/01/88 06/29/88 62.2 6.2 11,133 7,720 69.3 50 54 56 57 59 60 62 64 66 68 70 73 81 58VA09E
67 64.755 65
1.1810 07/01/88 06/29/88 66.2 5.3 12,092 8,109 67.1 55 59 60 62 63 64 66 68 70 72 73 76 81 62 71 69.7 1.20
1 mi/h = I.61 km/hNote: All speed limits and vehicle speeds are shown in mi/h.
Table 48. After speed data for the Interstate experimental sites.
AfterExperimental Data Std. Free- Pct.
Site Before After Diff. Date Limit Collection MeanI 0-mi/h Pace
Dev. After Flow FreeNumber Limit Limit Limit Posted
Percentile Speeds Lower Upper Pct. Skew.Date Speed Speeds Volume Volume Flow I 5 10 155 25 35 50 65 75 85 90 95 99 Limit Limit Pace Index
CA08E 55 65 IO 06/O3/87 06/06/88 65.2 6.8 8,662 7,132 82.3 46 54 57 59 62 64 66 68 70 72 74 76 81 62MI08E
71 58.055 65
0.95IO 11/29/87 1 0/1 3/88 65.9 5.9 37,365 21,676 58.0 52 56 59 61 63 65 67 69 70 72 73 76 81 62 71
VA08E63.8
55 650.89
IO 07/01/88 08/02/89 64.5 5.3 11,521 8,141 70.7 51 56 58 60 62 63 65 67 68 70 71 73 79 61 70VA09E
68.955 65
0.93IO 07/O1/88 08/02/89 66.4 5.2 12,197 8,703 71.4 55 58 60 62 64 65 67 69 70 72 73 75 81 62 71 70.2 0.93
I mi/h = 1.61 km/hNote: All speed limits and vehicle speeds are shown in mi/h.
Table 49. Differences in speed characteristics for the Interstate experimental sites.Experimental Std. Free- Pct. 1 0-mi/h Pace
Site Diff. Mean Dev. Total Flow Free Percentile Speeds Lower Upper Pct.Number
Skew.Limit Speed Speeds Volume Volume Flow 1 5 10 15 25 35 50 ’65 75 85 90 95 99 Limit Limit Pace Index
CA08E IO 0.5 0.2 1,823 1,458 -0.7 I 0 -1 -I 0 0 0 I 1 1 2 2 0 I 1MI08E
-7.5 0.13IO I.1 -0.4 2,966 1,284 -1.3 1 0 1 2 2 2 2 2 1 1 0 0 - 1 2 2
VA08E2.8 -0.22
10 2.3 -0.9 388 421 I.4 1 2 2 3 3 3 3 3 2 2 1 0 - 2 3 3VA09E
4.2 -0.25IO 0.2 -0.1 105 594 4.3 0 -1 0 0 I 1 I I 0 0 0 -1 0 0 0 0.5 -0.27
1 ml/h = 1.61 km/hNote: All speed limits and vehicle speeds are shown in ml/h.

Table 50. Before speed data for the Interstate comparison and nearby sites.
BeforeComparison Posted Data Std. Free- Pct. 10-mi/h Pace
Site Speed Collection Mean Dev. Before Flow Free Percentile Speeds Lower Upper Pet. S k e w .Number Limit Date Speed Speeds Volume Volume Flow 1 5 10 15 25 35 50 65 75 85 90 95 99 Limit Limit Pace Inde x
CA08C 55 04/28/87 61.6 4.9 13,346 9,007 67.5 51 55 56 58 59 60 62 64 65 67 68 70 75 57 66 74.6 1.08Ml08C 55 1 0/08/87 65.5 6.7 39,713 24,413 61.5 51 56 58 59 62 63 66 68 70 72 74 77 84 62 71 58.1 1.05MD70C 55 06/29/88 65.3 5.5 14,490 7,795 53.8 53 58 59 61 62 64 66 67 69 71 72 75 80 60 69 68.0 1.00
CA08P 55 04/29/87 62.5 5.7 41,214 21,040 51.1 51 55 57 58 59 61 83 65 66 69 70 73 79 58 67 66.4 1.13Ml81 P 55 lO/O8/87 60.6 7.9 3,057 2,662 87.1 39 47 51 54 57 59 62 64 66 68 70 73 79 57 66 57.6 0.82Ml82P 55 lO/O8/87 56.6 6.4 4,369 3,498 80.1 41 47 50 51 53 55 57 59 61 63 65 67 73 53 62 60.2 1 .oo
1 milh = 1.61 kmlhNote: All speed limits and vehicle speeds are shown in milh.
Table 51. After speed data for the Interstate comparison and nearby sites.
AfterComparison Posted Data Std. Free- Pct. 10-mi/h Pace
Site Speed Collection Mean Dev. After Flow Free Percentile Speeds L o w e r U p p e r Pct. Skew.Number Limit Date Speed Speeds Volume Volume Flow 1 5 10 15 25 35 50 65 75 85 90 95 99 Limit Limit Pace Index
CA08C 55 06/O6/88 61.3 4.8 14,717 9,943 67.6 50 54 56 57 59 60 62 63 65 66 68 70 75 57 66 74.5 1 .ooMl08C 55 1O/13/88 65.8 6.4 33,281 20,181 60.6 51 56 58 60 62 64 66 69 71 73 74 77 82 62 71 57.6 1.00MD70C 55 08/02/89 65.8 5.5 15,631 8,137 52.1 54 58 60 61 63 64 66 68 70 72 73 75 81 61 70 68.0 1.13
CA08P 55 06/O6/88 62.2 5.8 49,486 21,752 44.0 49 54 56 57 59 60 62 65 66 68 70 72 77 58 67 64.3 1.13Ml81 P 55 1O/13/88 60.2 6.8 3,392 2,994 88.3 42 49 52 54 57 59 61 63 65 67 69 71 76 57 66 58.9 0.90Ml82P 55 10/13/88 58.1 5.8 5,208 3,932 75.5 44 49 52 53 55 57 58 61 62 64 65 68 75 54 63 66.2 1.06
1 milh = 1.61 kmlhNote: All speed limits and vehicle speeds are shown in milh.

Table 52. Differences in speed characteristics for the Interstate comparison and nearby sites.
Comparison Posted Std. Free- Pct. 1 0-mi/h PaceSite Speed Mean Dev. Total Flow Free Percentile Speeds Lower Upper Pct. Skew.
Number Limit Speed Speeds Volume Volume Flow 1 5 IO 15 25 35 50 65 75 85 90 95 99 Limit Limit Pace Index
CA08C 55 -0.3 -0.1 1,371 936 0.1 -1 -1 0 -1 0 0 0 -1 0 -1 0 0 0 0 0 -0.1 -0.08Ml08C 55 0.3 -0.3 -6,432 -4,232 -0.9 0 0 0 1 0 1 0 1 1 1 0 0 - 2 0 0 -0.5 -0.05MD70C 55 0.5 0.0 1,141 342 -1.7 1 0 1 0 1 0 0 1 1 1 1 0 1 1 1 0.0 0.13
CA08P 55 -0.3 0.1 8,272 712 -7.1 -2 -1 -1 -1 0 -1 -1 0 0 -1 0 -1 -2 0 0 -2.1 0.00Ml81 P 55 -0.4 -1.1 335 332 1.2 3 2 1 0 0 0 -1 -1 -1 -1 -1 -2 -3 0 0 1.3 0.08Ml82P . 55 1.5 -0.6 839 434 -4.6 3 2 2 2 2 2 1 2 1 1 0 1 2 1 1 6 .0 0.06
I milh = 1.61 km/hNote: All speed limits and vehicle speeds are shown in mi/h.

Shown in figure 44 are the before and after 24-h cumulative speed distributions for free-flowing vehicles measured at California experimental site CAOSE. The differences in the before and after percentile speeds at this site ranged from a decrease of 1 mi/h (1.6 km/h) at the 10th and 15th percentile speeds to a 2-mi/h (3.2-km/h) increase at the 90th and 95th percentile speeds.
Changes in the before and after 24-h percentile speeds for free-flowing vehicles for each of the four sites where speed limits were raised to 65 mi/h (105 km/h) are shown in figure 45. Examination of figure 45 reveals that driver speeds at these sites increased between 1 and 3 mi/h (1.6 and 4.S km/h). Figure 45 also reveals that the 99th percentile speed, which contains the highest speed drivers, either did not change or was 1 to 2 mi/h (1.6 to 3.2 km/h) lower after the speed limit was raised to 65 mi/h (105 km/h) at the experimental sites.
As shown in figure 46, changes in the before and after percentile speeds at the comparison sites, where the 55-mi/h (S9-km/h) speed limit remained in effect, were generally less than 2 mi/h (3.2 km/h).
Shown in figure 47 are the changes in the 24-h mean speed and the standard deviation of speeds at each rural Interstate experimental site. While there was an increase in the mean speed, there was a reduction in the standard deviation of speeds at three of the sites. As shown in table 52, changes in the mean speed and standard deviation of speeds were less than 0.5 mi/h (O.S km/h) at the comparison sites.
99
95
90
85
'E 75
~ 65 a. ~ 50
§ 35 :J E
<3 25
15
10
5
Posted Speed Limit Raised at CA08E
/ ..... 55 mi/h - Before --t::r- 65 mi/h - After
30 35 40 45 50 55 60 65 70 75 80 85 90
1 mi/h = 1.61 km/h Speed, mi/h
Figure 44. Before and after cumulative speed distributions at a rural Interstate experimental site in California.
152

5~ __ ~======================~ ____ ~ 4 I ~ CA08E --- MI08E ....... VA08E -6;- VA09E I
-4
25 35 50 65 75 85 90 95 99
1 mi/h = 1.61 km/h Percentile Speed
Figure 45. Changes in the percentile speeds for four selected rural Interstate experimental sites after the speed limit was raised.
5T-------------------------------------------~
4 1 ___ CA08C -6;- CA08P ~ MI08C ...... MD70C I
-4
5 10 15 25 35 50 65 75 85 90 95 99
1 mi/h = 1.61 km/h Percentile Speed
Figure 46. Changes in the percentile speeds for four selected Interstate comparison sites after the speed limit was raised at the experimental sites.
153

CA08E Ml08E VA08E VA09E
1 mi/h = 1.61 km/h Site Number
Figure 47. Changes in the mean and standard deviationof speeds at four selected rural Interstate experimental sites.
The percentages of drivers exceeding posted speed limits at the experimentaland comparison sites are shown in tables 53 and 54, respectively.
As expected, raising the speed limit reduced the number and percentage ofdrivers exceeding the posted speed limit. For the four experimental sites, the averagereduction in drivers exceeding the speed limit was 39 percent. In addition, there was a41 percent reduction in drivers exceeding the speed limit by 10 mi/h (16 km/h), and a4 percent reduction in drivers exceeding the speed limit by 2 0 mi/h (32 km/h). Whilethese are average values, the findings are similar at each of the four sites, as shown intable 53.
It should be noted that these figures do not necessarily represent a change indriver behavior, but instead reflect a change in how noncompliance is measured, i.e.,from the posted speed limit.
Before the speed limit was raised, more than 90 percent of the drivers exceeded55 mi/h (89 km/h) at the experimental sites. After the speed limit was raised to 6 5 mi/h(105 km/h), more than 50 percent of the drivers exceeded the posted limit.
154

-lo.
CJl CJl
Table 53. Percentage of drivers exceeding posted speed limits at the Interstate experimental sites.
Experimental Before After Differences
Site Before After Diff. Percent Exceeding Posted Speed Limit Percent Exceeding Posted Speed Limit Percent Exceeding Posted Speed Limit
Number Limit Limit Limit 0 5 10 15 20 0 5 10 15 20 0 5 10 15 20
Speed Limit Raised from 55 to 65 milh at Experimental Sites
CA08E 55 65 10 93.0 82.9 50.0 17.4 3.7 53.5 24.3 5.7 1.2 0.3 -39.5 -58.6 -44.3 -16.2 -3.4
MI08E 55 65 10 95.2 79.1 47.4 19.0 5.6 58.5 22.8 5.1 1.2 0.3 -36.7 -56.3 -42.3 -17.8 -5.3
VA08E 55 65 10 90.8 63.1 27.7 9.i 2.7 47.1 13.4 2.6 0.6 0.1 -43.7 -49.7 -25.1 -8.5 -2.6
VA09E 55 65 10 98.9 89.7 56.7 21.8 5.2 61.5 22.3 4.4 1.1 0.3 -37.4 -67.4 -52.3 -20.7 -4.9
1 milh = 1.61 kmlh Note: All speed limits are shown in milh.
Table 54. Percentage of drivers exceeding posted speed limits at the Interstate comparison and nearby sites.
Comparison Before After Differences
Site Posted Percent Exceeding Posted Speed Limit Percent Exceeding Posted Speed Limit Percent Exceeding Posted Speed Limit
Number Limit 0 5 10 15 20 0 5 10 15 20 0 5 10 15 20
Speed Limit Raised from 55 to 65 milh at Experimental Sites
CA08C 55 93.0 63.0 21.1 4.2 0.9 92.1 60.8 19.4 3.9 0.7 -0.9 -2.2 -1.7 -0.3 -0.2
MI08C 55 95.3 80.2 51.8 23.0 7.8 95.5 81.6 56.0 25.8 7.0 0.2 1.4 4.2 2.8 -0.8
M070C 55 97.8 85.2 50.7 17.3 3.7 98.3 88.0 53.4 20.1 4.9 0.5 2.8 2.7 2.8 1.2
CA08P 55 93.3 65.5 29.0 9.6 2.7 90.7 64.4 29.6 7.9 1.8 -2.6 -1.1 0.6 -1.7 -0.9
MI81P 55 81.3 58.6 26.7 8.8 2.4 80.8 53.0 22.8 6.3 1.1 -0.5 -5.6 -3.9 -2.5 -1.3
MI82P 55 60.1 28.3 8.1 2.1 0.7 72.1 35.8 9.9 2.6 0.7 12.0 7.5 1.8 0.5 0.0
1 milh = 1.61 kmIh Note: All speed limits are shown in milh.

Repeated Speed Measurements
Speed measurements were conducted before the speed limits were changed,and repeated at 3-month intervals thereafter for a 12-month period at the Virginia ruralInterstate sites and the Maryland comparison site. Shown in figure 48 are changesover time in the 85th percentile speeds for these sites. The data indicate that the85th percentile speeds increased from 1 to 3 mi/h (1.16 to 4.8 km/h) during the measure-ment periods at these locations.
Effects on a Contiguous section
Data were collected to provide an indication of whether raising the speed limit ona rural interstate site increased vehicle speeds on a contiguous urban Interstatesection. Before and after 24-h free-flow speed data were collected on a section of ruralInterstate (California site CA08E) where the speed limit was raised, on a contiguousurban Interstate (CA08P), and on a rural limited access highwa y (CA08C) where theposted speed limit remained at 55 mi/h (89 km/h).
Before and after data showing the effects of raising the speed limit on the85th percentile speeds at these sites are given in figure 49. Although the number ofsections sampled is too small to draw conclusions, it does not appear that the85th percentile speeds increased on both of th e 55-mi/h (89-km/h) sections after thespeed limit was raised at the experimental site.
Spillover Effects on Nearby Rural Two-Lane Highways
One concern often expressed about raising rural Interstate speed limits is thespillover effect, which suggests that speeds may increase on nearby rural two-lanehighways. To examine this effect, a rural two-lane site located 1 mi (1.6 km) from aninterchange in Michigan was selected for speed measurement. In addition, data werecollected 3 mi (4.8 km) from another rural interchange, also located in Michigan. Thespeed limit on the Interstate section was raised to 6 5 mi/h (105 km/h), while the speedlimit on the rural two-lane highways remained at 55 mi/h (89 km/h).
The mean speeds for the Interstate sections, as well as the two-lane sections,are presented in figure 50. While the mean speed on the rural Interstate increased by2 mi/h (3.2 km/h) 1 yr after the 65-mi/h (105-km/h) speed limit was posted, there was a0.4-mi/h (0.6-km/h) decrease in the mean speed at the site located within 1 mi (1.6 km)from the interchange. The mean speed at the site located 3 mi (4.8 km) from the inter-change fluctuated over the year. At the end of the I-yr after period, the mean speed atthis site was 1.5 mi/h (2.4 km/h) higher than it was prior to the speed limit change onthe Interstate section.
156

80~ ______________________________________________ ~
Posted Speed Limit Raised at VA08E and VA09E to 65 mi/h
75
.c
~ -- ~ ·e 70 "C CD CD Co
CJ) CD 65 ...... :a c Rural Interstate • VA08E CD ~ ....... CD a.. 60 .c Rural Interstate • VA09E iO co ~
55 Rural Comparison· MD70C
~ After Period ---------I~~ 50~ __ ~ ________ ~ ________ ~ ________ ~ ________ ~ __ ~
Before 3 Months 6 Months 9 Months 12 Months
Before and After Periods 1 mi/h = 1.61 km/h
Figure 48. Before and after 85th percentile speeds at rural Interstate sites.
80
71 72
70
:E 60 ·e -g 50 CD Co
CJ) CD 40 :s c CD ~ 30 CD a.. :5 20 10 co
10
0-+-__ _ Before After
1 mi/h = 1.61 km/h Before and After Periods
II Rural Interstate • CA08E II Urban Interstate· CA08P Rural 55 mi/h • CA08C
Figure 49. Before and after 85th percentile speeds at three California limited access sites.
157

70 Posted Speed Limit Raised at MI08E to 65 mi/h
65 I ... !f I: 1&
60 • • • • • u .().
S 55 '""'<.J
E -0 -!!r- Rural- MI08E
m 50 Interstate D-en c --- Urban - MI08C m 45
Interstate :2
40 ....... Rural - MI81 P
1 mi Downstream
35 -0- Rural - MI82P
3 mi Downstream ..... ~ After Period 30
Before 3 Months 6 Months 9 Months 12 Months
1 mi/h = 1.61 km/h Before and After Periods 1 mi = 1.61 km
Figure 50. Before and after mean speeds at a rural Interstate site, an urban Interstate site, and two nearby rural two-lane highway locations.
Crash Results
As mentioned in the introduction to this appendix, before and after crash data were collected for four Interstate sites where speed limits were raised to 65 mi/h (105 km/h) , and for three comparison sites and three nearby sites where speed limits were not changed. Due to funding and time constraints, data collection was limited to these sites, which were not randomly selected. Furthermore, only 1 year of crash data for the after period was available. Crash data for this limited number of sites were collected to obtain general information and the results apply only to these locations.
Before and after police-reported total crash and fatal and injury crash data were collected for the Interstate experimental, comparison, and nearby locations. As shown in tables 55 through 57, reported total crashes and injury crashes were obtained for a 3-yr before period and a 1-yr after period at each site, except for the California sites, where a 21-month period of after data was available.
158

Table 55. Crash data for the Interstate experimental sites.
Third Before Second Before First Before First After Second AfterExperimental Period Period Period Total Before Period Period Total After
Site Diff. Length, Befor e After B3 B3 B3 B2 B2 B2 B1 B1 B1 B B B Al Al Al A2 A2 A2 A A ANumber Limit Miles Volume Volume Total Injury Month Tota l Injury Month Tota l Injury Month Tota l Injury Month Total Injury Month Tota l Injury Month Total Injury Month
Speed Limit Raised from 55 to 6 5 mi/h at Experimental SitesCA08E 10 24.78 13,676 17,324 74 23 12 71 29 12 64 20 12 229 72 36 92 30 12 56 25 9 150 55 21Ml08E 10 15.63 34,399 37,365 145 32 12 157 36 12 136 31 12 436 99 36 219 44 12 219 44 12VA08E 10 21.93 22,266 23,042 50 22 12 50 16 12 57 15 12 157 53 36 66 42 12 66 42 12VA09E 10 31.73 24,184 24,394 109 47 12 152 63 12 130 59 12 391 169 36 169 66 12 169 66 12
4 Sites 94.27 376 124 430 144 407 125 1,215 393 566 184 56 25 624 209
1 mi= 1.6 1 km1 mi/h = 1.61 km/hNote: All speed limits are shown in mi/h. Blanks indicate that crash data were not available for the period.
Table 56. Crash data for the Interstate comparison sites.
Third Before Second Before First Before First After Second AfterComparison Period Period Period Total Before Period Period Total After
Site Posted Length, Before After B3 B3 B3 B2 B2 B2 Bl Bl Bl B B B Al Al Al A2 A2 A2 A A ANumber Limit Miles Volume Volume Total Injury Month Total Injury Month Total Injury Month Total Injury Month Total Injury Month Total Injury Month Tota l Injury Month
Speed Limit Raised from 55 to 6 6 mi/h at Experimental SitesCA08C 55 19.61 26,492 29,434 166 60 12 197 82 12 210 67 12 573 249 36 235 112 12 151 71 9 366 183 21Ml08C 55 19.91 39,713 33,261 435 122 12 458 129 12 390 107 12 1,263 356 36 432 133 12 432 133 12MD70C 55 26.31 34.555 42.631 160 77 12 156 61 12 205 91 12 523 249 36 211 106 12 211 106 12
3 Sites 67.83 761 279 613 292 605 285 2,379 656 876 353 151 71 1,029 424
1 mi= 1.61 km1 mi/h = 1.61 km/hNote: All speed limits are shown in mi/h. Blanks indicate that crash data were not available for the period
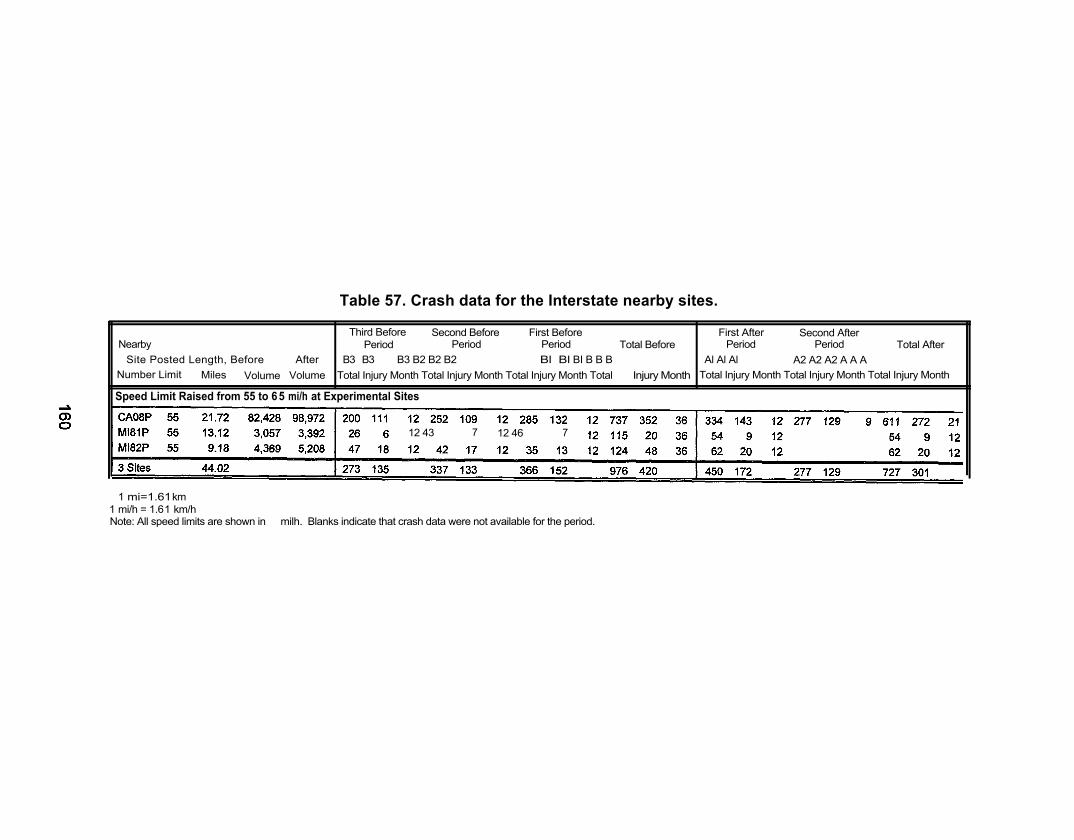
Table 57. Crash data for the Interstate nearby sites.
Third Before Second Before First BeforeNearby
First After Second AfterPeriod Period Period Total Before Period Period Total After
Site Posted Length, Before After B3 B3 B3 B2 B2 B2 Bl Bl BI B B B Al Al Al A2 A2 A2 A A ANumber Limit Miles Volume Volume Total Injury Month Total Injury Month Total Injury Month Total Injury Monthh Total Injury Month Total Injury Month Total Injury Month
Speed Limit Raised from 55 to 65 mi/h at Experimental Sites
12 43 7 12 46 7
1 mi=1.61 km1 mi/h = 1.61 km/hNote: All speed limits are shown in milh. Blanks indicate that crash data were not available for the period.

The crash data were analyzed using the paired comparison ratio and the beforeand after analysis methods as discussed in appendix F. The first step in the analysiswas to examine the comparability of the before crash data at the comparison sites tothe before crash data at the experimental sites. The crash histories of the comparisonand experimental sites were not comparable in the before periods, i.e., G = 11.14, withthree degrees of freedom, which is significant a t a= 0.05. Accordingly, only the before-and-after method is appropriate to estimate the overall safety effects of raising speedlimits for this group of experimental sites.
The before-and-after analysis utilized comparison ratios to account for differ-ences in before and after traffic volumes and unequal before and after time periods.The analysis indicated that total crashes at the study sites increased by 25 percent,Z = 4.51 . Injury crashes, defined as a crash where one or more persons were killed orinjured, appeared to have increased by 30 percent, based on the before-and-afteranalysis, Z = 3.07.
These results are statistically significant; however, the findings must be viewedwith caution due to the limitations of the before-anti-after method, i.e., no control forextraneous factors, regression-to-the-mean, etc. In addition, the nonrandom method ofsite selection, the small sample of sites, and the short after time period (1 year) preventthe drawing of inferences from these data and applying them to other similar freewayfacilities. No general statements are appropriat e from this analysis.
Site-by-Site Analysis
On an individual site basis, the G-test revealed that the crash histories at thecomparison sites were comparable with the cras h changes at the experimental sites forthree of the four locations. The Virginia site , VA09E, was not comparable to theMaryland comparison site. Accordingly, the paire d comparison ratio method was usedto estimate the safety effects at site s CA08E, Ml08E, and VA08E. The before-and-aftermethod was used at the VA09E site. The compariso n ratios used to estimate theseeffects utilized before and after crash counts , traffic volumes, and unequal time periods.
A summary of the results for total crashes at each ‘site is shown in table 58.There were no significant differences (aa = 0.05) in total crashes at the California orMichigan sites; however, there was a significant increase in total crashes at the twoVirginia sites.
The summary of the findings for injury crashe s i s given in table 59. Based on ananalysis of injury crashes, the only statistically significant difference occurred at Virginiasite VA08E, where injury crashes increased by 118 percent . It should be noted that thenumber of injury crashes at this site was small (53 in the 3-yr before period and 42 inthe 1 -yr after period).
161
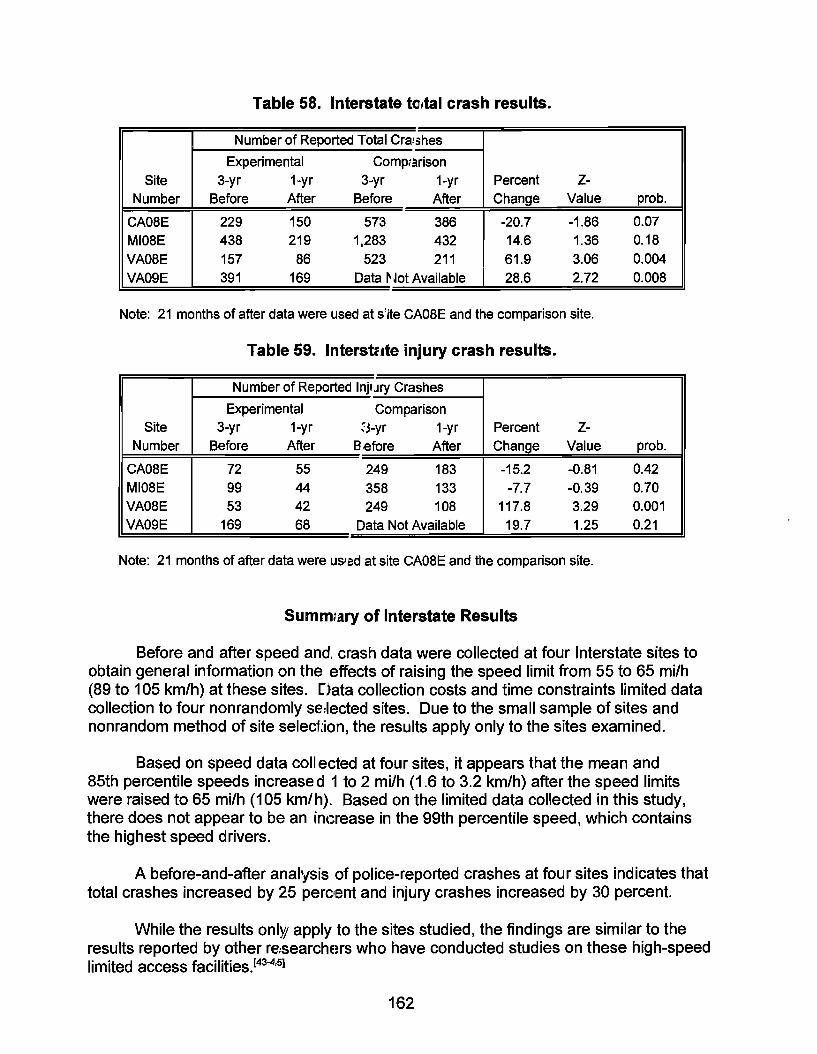
Table 58. Interstate to Ita I crash results.
Number of Reported Total Crarshes
Experimental Compi arison Site 3-yr 1-yr 3-yr 1-yr Percent z-
Number Before After Before After Change Value prob.
CA08E 229 150 573 386 -20.7 -1.86 0.07 MI08E 438 219 1,283 432 14.6 1.36 0.18 VA08E 157 86 523 211 61.9 3.06 0.004 VA09E 391 169 Data ~ Jot Available 28.6 2.72 0.008
Note: 21 months of after data were used at s'jte CA08E and the comparison site.
Table 59. Interstnte injury crash results.
Number of Reported Injury Crashes
Experimental Comparison Site 3-yr 1-yr ::3-yr 1-yr Percent z-
Number Before After B,efore After Change Value prob.
CA08E 72 55 249 183 -15.2 -0.81 0.42 MI08E 99 44 358 133 -7.7 -0.39 0.70 VA08E 53 42 249 108 117.8 3.29 0.001 VA09E 169 68 Data Not Available 19.7 1.25 0.21
Note: 21 months of after data were us/ad at site CA08E and the comparison site.
Summlary of Interstate Results
Before and after speed and, crash data were collected at four Interstate sites to obtain general information on the effects of raising the speed limit from 55 to 65 mi/h (89 to 105 km/h) at these sites. Data collection costs and time constraints limited data collection to four nonrandomly se:lected sites. Due to the small sample of sites and nonrandom method of site selection, the results apply only to the sites examined.
Based on speed data coli ected at four sites, it appears that the mean and 85th percentile speeds increase d 1 to 2 mi/h (1.6 to 3.2 km/h) after the speed limits were raised to 65 mi/h (105 km/h). Based on the limited data collected in this study, there does not appear to be an increase in the 99th percentile speed, which contains the highest speed drivers.
A before-and-after analysis of police-reported crashes at four sites indicates that total crashes increased by 25 perc1ent and injury crashes increased by 30 percent.
While the results onl)1 apply to the sites studied, the findings are similar to the results reported by other re:searChE!rS who have conducted studies on these high-speed limited access facilities. [43-4,5)
162

1. Kent B. Joscelyn and Patricia A. Elston , Maximum Speed Limits - Volume II: TheDevelopment of Speed Limits: A Review of the Literature, Institute for Research inPublic Safety, Indiana University, Bloomington, Indiana, October 1970.
2. John W. English and Steven H. Levin, “Traffic Speed Limit Laws in the UnitedStates,” Traffic Laws Commentary, Vol. 7, No. 1, National Committee on Uniform
Traffic Laws and Ordinances, Washington, DC, January 1978.
3. M. R. Parker, Jr. , Synfhesis of Speed Zoning Procedures, Publication No. FHWA-RD-85-096, Federal Highway Administration, Washington, DC, July 1985.
4. David Solomon, Accidents on Main Rural Highways Related to Speed, Driver, andVehicle, Federal Highway Administration, Washington, DC, 1964 (Reprinted 1974).
5. J. M. Munden, “The Relation Between a Driver’s Speed and His Accident Rate,”Road Research Laboratory Report LR88, Road and Research Laboratory,Crowthorne, United Kingdom, 1967.
6. L. B. West, Jr. and W. J. Dunn, “‘Accidents, Speed Deviation, and Speed Limits,”Traffic Engineering, Institute of Traffic Engineers, Washington, DC, July 1971.
7. D. L. Harkey, H. D. Robertson, and S. E. Davis, “Assessment of Current SpeedZoning Criteria,” Transportation Research Record 7287, Transportation ResearchBoard, Washington, DC, 1990.
8. Institute of Transportation Engineers, Transportation and Traffic EngineeringHandbook, Second Edition, Washington, DC, 1982.
9. Davey L. Warren, “Chapter 17 - Speed Zoning and Control,” Synfhesis of SafetyResearch Related fo Traffic Control and Roadway Elements, Volume 2, PublicationNo. FHWA-TS-82-233, Federal Highway Administration, Washington, DC,December 1982.
10. M. R. Parker, Jr., Fundamental Studies on Speed Zoning and Control - Task CExperimental Plan, Federal Highway Administration, Washington, DC, April 1986.
11. Transportation Research Board, Highway Capacity Manual, Special Report 209,Washington, DC, 1985.
12. Joseph W. Guyton and A. K. Stonecipher, ‘Sampling Procedures for DeterminingSpeed Characteristics at Rural Locations: A Progress Report, ” Highway ResearchBoard Bulletin 208, Washington, DC, 1959.
13. Marvin Fields, “Speed Regulation,” Traffic Engineering Handbook, Institute ofTraffic Engineers, Washington, DC, 1965.
163

14.
15.
16.
17.
18.
19.
20.
21
22
23
24.
25.
26.
REFERENCES (continued)
Fred R. Hanscom, Improved Techniques for Collecting Speed Data - Final Report,Federal Highway Administration, Washington, DC, November 1984.
M. Ross Palmer, “The Development of Traffic Congestion,” Quality and Theory ofTraffic Flow, Bureau of Highway Traffic, New Haven, Connecticut, 1961.
Sarasota Automation, Inc., VC1900 Operators Handbook, Software Issue V8,Sarasota, Florida, undated.
Dominic Zaal, Traffic Law Enforcement: A Review of the Literature, ReportNumber 53, Monash University Accident Research Centre, Clayton, Victoria,Australia, April 1994.
Federal Highway Administration, FHWA Study Tour for Speed Management andEnforcement Technology, Washington, DC, February 1996.
R. F. Crowther and R. P. Shumate, Sampling Design for Fixed-Point SpeedMeasurements, Project No. R-l 8, Traffic Institute, Northwestern University,Evanston, Illinois, 1960.
Fred R. Hanscom, An Assessment of Speed Measurement Techniques andPractices: A Literature Review, Federal Highway Administration, Washington, DC,1983.
M. R. Parker, Jr., Comparison of Speed Zoning Procedures and Their Effective-ness, Final Report, prepared for the Michigan Department of Transportation,Lansing, Michigan, September 1992.
Eugene V. Avery, “Effect of Raising Speed Limits on Urban Arterial Streets,”Highway Research Board Bulletin 244, Washington, DC, 1960.
Curt M. Elmberg, Effects of Speed Zoning in Suburban Areas, Report No. 9, JointHighway Research Project, Purdue University, Lafayette, Indiana, June 1960.
T. Ogawa, E. S. Fisher, and J. C. Oppenlander, “Driver Behavior Study-Influenceof Speed Limits on Spot Speed Characteristics in a Series of Contiguous Rural andUrban Areas,” Highway Research Board Bulletin 347, Washington, DC, 1962.
Robert R. Roberts, “The Influence of Speed Limits on Urban Speed DistributionParameters,” Traffic Engineering, Vol. 38, No. 3, Institute of Traffic Engineers,Washington, DC, December 1967.
S. Spitz, “Speed Versus Speed Limits in California Cities,” ITE Journal, Vol. 54,No. 4, Institute of Transportation Engineers, Washington, DC, May 1984.
164
REFERENCES (continued)
27. Conrad L. Dudek and Gerald L . Ullman, Speed Zoning and Control, ResearchReport 334-l F, Texas Transportation Institute, College Station, Texas, September1986.
28. W. L. Kessler, “The Effect of Speed Zone Modifications Occasioned by the IllinoisSpeed Law,” Traffic Engineering, Vol. 29, No. 10, Institute o f Traffic Engineers,Washington, DC, July 1959.
29. Neilon J. Rowan and Charles J. Keese, “A Study of Factors Influencing TrafficSpeed,” Highway Research Board Bulletin 347, Washington, DC, 1962.
30. Traffic Engineering Operations and Safety Unit, Special Speed Study, PublicationNo. 2053, Massachusetts Department of Public Works, Boston, Massachusetts,1966.
31. Minnesota Department of Transportation, “Experimental Studies,” Attachment 9,Transmittal Letter from R. J. McDonald to Jim Barnett, St. Paul, Minnesota,May 17, 1984.
32. Washington State Department of Transportation, “Speed Zoning Before and AfterStudy,” Transmittal Letter from Wayne T. Gruen to Jim Barnett, Olympia,Washington, July 11, 1984.
33. Michigan Department of Transportation, “Before and After Speed Studies,”Exhibit 9 enclosed with the AASHTO Survey of Speed Zoning Practices, Lansing,Michigan, June 1984.
34. James O’Day, “Accident Data Quality,” NCHRP Synthesis 792, TransportationResearch Board, Washington, DC, 1993.
35. L. I. Griffin, Three Procedures for Evaluating Highway Safety ImprovementPrograms, Texas Transportation Institute, College Station, Texas, October 29,1982.
36. L. I. Griffin, A Systematic Framework for Analyzing Categorical, Before-and-AfterData, Texas Transportation Institute, College Station, Texas, April 1989.
37. L. I. Griffin, Using the Before and After Design With Yoked Comparisons toEstimate the Effectiveness of Accident Countermeasures Implemented at MultipleTreatment Locations, Texas Transportation Institute, College Station, Texas, May1990.
38. 0. J. Pendleton, Application of New Accident Analysis Methodologies-Volume 7 -Genera/ Methodology, Publication No. FHWA-RD-90-091, Federal HighwayAdministration, Washington, DC, September 1991.
165

REFERENCES (continued)
39. L. I. Griffin, Using Before and After Data to Estimate the Effectiveness of AccidentCountermeasures Implemented at Several Treatment Sites, Texas TransportationInstitute, College Station, Texas, December 1989.
40. Ezra Hauer, “Should Stop Yield? Matters of Method in Safety Research, ” ITEJournal, Vol. 61, No. 9, Institute of Transportation Engineers, Washington, DC,September 1991.
41. D. M. Wenger, Effects of Revising Urban Speed Limits, St. Paul Department ofPublic Works, St. Paul, Minnesota, June 1960.
42. P. T. McCoy, B. A. Moen, G. Pesti, and M. Moussavi, Evaluation of Lower SpeedLimits on Urban Highways, Research Report TRP-02-26-92, University ofNebraska, Lincoln, Nebraska, May 1993.
43. J. A. McKnight and T. M. Klein, “Relationship of 65-mph Limit to Speeds and FatalAccidents,” Transportation Research Record 7287, Transportation ResearchBoard, Washington, DC, 1990.
44. M. Freedman and J. R. Esterlitz, “Effect of the 65-mph Speed Limit on Speeds inThree States,” Transportation Research Record 7287, Transportation ResearchBoard, Washington, DC, 1990.
45. G. Chang and J. F. Paniati, “Effects of 65-mph Speed Limit on Traffic Safety, ”Journal of Transportation Engineering, Vol. 116, No. 2, American Society of CivilEngineers, New York, New York, March/April 1990.
166
*U.S. GOVERNMENT PRINTING OFFICE 1996-418-103/65719