effects of pahs on microbial activity and diversity in
TRANSCRIPT

Proceedings of the 1998 Conference on Hazardous Waste Research 383
EFFECTS OF PAHS ON MICROBIALACTIVITY AND DIVERSITY IN FRESHLYCONTAMINATED AND WEATHERED SOILS
K. Rathbone1, J. Fuchs1, K. Anderson1, R. Karthikeyan2, and N. Nurhidayat3
1Department of Agronomy, 2Biological and Agricultural Engineering, 3Division of Biology,Kansas State University, Manhattan, KS 66506
Polycyclic aromatic hydrocarbon (PAH)-contaminated soils are of concern to the EnvironmentalProtection Agency (EPA) due to their mutagenic and carcinogenic nature. Bioremediation of PAHs is aimed atincreasing the overall rate of natural degradation. Microbial bioremediation promotes processes by whichmicroorganisms can take up and/or degrade organic molecules and their metabolites. Microorganisms can useorganic molecules for energy or convert them into cell biomass, ultimately releasing carbon dioxide and water tothe environment. Changes in microbial biomass and CO2 evolved are used as indices of degradation rates. Insitu bioremediation utilizes indigenous microorganisms and/or involves addition of specific microorganisms withenzymatic capabilities (such as enhanced oxidative functions) to establish conditions favorable to microbialdegradative activities. The overall goal of this study was to assess the biodegradation of the target PAHs,pyrene and phenanthrene, in rhizosphere soils. Comparisons of microbial diversity and activities due to PAHcontamination between a weathered loam and a clean sandy loam were made. Carbon substrate utilization wasthe estimate of microbial functional diversity used in this study. Functional diversity was evaluated using theBiolog® assay system. Results from the study show significant differences in substrate utilization and microbialdiversity between the two soil types and various treatments.
INTRODUCTION
Petroleum hydrocarbons are typically a complex mixture of aliphatic and aromatic organic
compounds. They can be fractionated by distillation into saturates, aromatics, asphaltenes, and
resins (Solomon, 1996). The saturates include n-alkanes, branched alkanes, and cycloalkanes.
Polycyclic Aromatic Hydrocarbons (PAHs) are organic molecules with two or more benzene rings
in which the number and arrangement of the rings result in diverse physical and chemical properties
(Leahy and Colwell, 1990).
PAHs are formed during combustion reactions. Contribution of petroleum hydrocarbons to
the environment results from burning of fossil fuels and subsequent atmospheric deposition, primarily
from industrialized countries (Sims and Overcash, 1983). Internal combustion engines produce
large amounts of petroleum hydrocarbon byproducts. In addition, many industrial activities associ-
ated with processing, production, and disposal of petroleum hydrocarbons contribute to the overall
environmental load. Some of these activities include liquefaction, heat and power generation using
fossil fuels, catalytic cracking procedures, carbon-black, coke, asphalt, and coal-tar production,
refining and distillation of crude oil, wood-treatment processes, accidents resulting from handling
and storage, open burning of tires, coal, etc., and other incineration processes (Bumpus et al., 1989;
Wilson and Jones, 1993).
Soils contaminated with petroleum are classified �hazardous� and are of great importance
because certain petroleum derivatives are potentially carcinogenic and mutagenic (Song and Bartha,
ABSTRACT
Key words: bioremediation, functional diversity, phenanthrene, pyrene

Proceedings of the 1998 Conference on Hazardous Waste Research384
1990; Wilson and Jones, 1993). Remediation of soils contaminated with petroleum hydrocarbons is
a global problem that consumes economic resources from both industrial and government coffers.
Some petroleum hydrocarbons are carcinogenic in lab animals and mutagenic in bacteria (Wilson
and Jones, 1993). Cancer induced in rabbits by injecting coal tar into dermis prompted toxicologi-
cal studies resulting in benzo[a]pyrene, a target PAH, being isolated as a carcinogen (Cook et al.,
1933). Other studies have confirmed that pyrene and phenanthrene, both PAHs, are mutagenic in
bacterial and animal cells as well as carcinogenic in rodents (Wilson and Jones, 1993).
Soils contaminated with PAHs are remediated using a diverse set of physical and chemical
methods that strip contaminants from the soil. In addition to physical and chemical treatment
methods, biodegradation has become more accepted over the last two decades. Biodegradation, in
general, is the decomposition of compounds by living organisms. Degradation of PAHs may be
accomplished by complete mineralization, cometabolic degradation, and/or radical oxidation
(Mahro et al., 1994). Complete mineralization is the total breakdown of organic compounds to
water and carbon dioxide. Complete mineralization is not achieved in practice with PAHs since
only two-thirds of the organic compound is mineralized and the remaining third is incorporated into
new cell biomass (Leisinger et al., 1981). Cometabolic degradation is a process by which a recalci-
trant compound is degraded in the presence of an analogous compound. The necessary enzymes
required to degrade the recalcitrant compound are induced by the analogous compound (Leisinger
et al., 1981). In mixed culture systems such as soils, cometabolic transformations may augment
degradation capabilities of other organisms. In pure cultures, cometabolism ceases without any
benefit to the organism (Atlas and Bartha, 1980). Radical oxidation can also occur and is a chemical
transformation of an organic compound which is tied to the activity of extracellular enzymes pro-
duced by soil biota.
Factors that affect biodegradation include pollutant concentration and pre-exposure time.
Microbial communities present in previously contaminated soil can metabolize PAHs at greater rates
than soil microbial communities found in uncontaminated soils. An acclimation period is required for
microbes after a contamination event before degradation processes commence. During this accli-
mation period, appropriate soil microbial communities are developed through growth and enzyme
induction. Many PAH-contaminated soils have been polluted for years. Increased residence time
may make the hydrocarbons unavailable to microorganisms for degradation because PAHs can be
strongly sorbed to the soil matrix. Bioavailability and other interactive effects of these PAHs on
microorganisms are important to know because these factors ultimately will determine the activity
and diversity of microorganisms. PAH bioavailability is reduced due to its hydrophobicity and
sorption onto soil minerals and soil organic matter (SOM). PAHs are relatively water insoluble and
may not be available for microbial degradation. In addition, they may diffuse into soil particle sites
that are inaccessible to microbes from the outside. Once inside, they are entrapped and/or continue

Proceedings of the 1998 Conference on Hazardous Waste Research 385
to be incorporated into SOM. Often, the sites in which they are entrapped have effective diameters
of less than 1.0 µm. Consequently, bacteria may not be able to access these sites for PAH degra-
dation to occur. Greater population density and diversity of microorganisms often result in increased
degradation rates of PAHs in soil. The soil micro biota is capable of producing many degradative
enzymes needed for mineralization of PAHs; however, a single microbial strain may not be able to
produce the necessary enzymes (Lappin et al., 1985). Biodegradation of recalcitrant compounds
such as PAHs is limited by soil properties, bioavailability, cometabolites, and microbial populations
with degrading capabilities (Gunther et al., 1996).
Comprehensive knowledge of the diversity of indigenous microbial communities and their
activities is considered important when assessing the strategy and outcome of bioremediation; yet,
little is known about the components of functional diversity responsible for degradation of PAHs in
field situations. Degradation of PAHs is facilitated by communities of numerous functional microbial
populations and, therefore, microbial composition determines the degradative potential and success
of any bioremediation project. A wide range of techniques is available to identify components of
microbial communities to examine morphological and physiological properties of isolated pure
cultures, but these methods do not describe functional diversity.
Diversity measures of the terrestrial environment are limited by methods and taxonomy.
Microbial communities can be considered functional units characterized by the sum of their meta-
bolic properties. Therefore, substrate utilization patterns of the entire community result from
taxonomic diversity and abundance of each taxon. The Automated Microbial Identification System,
developed by Biolog® Inc. (Hayward, CA) for rapid identification of laboratory cultures, has been
shown to be useful in the characterization and classification of heterotrophic microbial soil communi-
ties.
In this study, clean and contaminated soils were examined to test the effects of pyrene and
phenanthrene contamination on microbial activity and diversity. Effects of pyrene and phenanthrene
on microbial activity were assessed by measuring mineralized CO2-C and NO3-N. Microbial
diversity was assessed by substrate utilization patterns using Biolog® assay.
EXPERIMENTAL SECTION
Soil Microcosms
To study the effects of pyrene and phenanthrene contamination on soil microbial activity and
diversity, two soil types were selected. A sandy loam (SL) with no known history of petroleum
contamination was obtained near a greenhouse site affiliated with university grounds at Kansas State
University, Manhattan, Kansas. A loam (L) that had been previously contaminated with jet and
diesel fuels was obtained from a California naval base. This soil was weathered for two years prior
to our study. Both soils were ground and air-dried prior to the experiment and the chemical proper-
ties were determined (Table 1).

Proceedings of the 1998 Conference on Hazardous Waste Research386
Treatments
Treatment combinations consisted of contaminant(s) concentration of 230 mg kg-1 of dry soil
with the following amendments to the SL: pyrene at 230 mg kg-1 (A); phenanthrene at 230 mg kg-1
(B); a combination of pyrene and phenanthrene at 115 mg kg-1 each (AB); and an uncontaminated
control soil (C). Weathered-L treatments consisted of only pyrene and phenanthrene in combina-
tion at 115 mg kg-1 each (E) and a weathered-L control (F). The treatments were carried out in
triplicate. The contaminant solutions were prepared by dissolving pyrene (Sigma P-2146) and
phenanthrene (Sigma P-2528) in acetone. Each solution was applied uniformly to a thin layer of
pre-weighed soil kept in a shallow foil-lined tub using a spray bottle. The soil was continuously
mixed to facilitate uniform contamination. One hundred grams of each soil was weighed into 240
mL Qorpak® bottles and brought to optimum moisture content (already found in literature). The
samples were then placed in 940 mL Mason jars and the jars were sealed. Soils were incubated at
25 C in a humidified environmental chamber. At 0 (Time0), 21 (Time1), 42 (Time2), and 63
(Time3) days, triplicate samples from each treatment were allocated to mineralized CO2-C and
NO3-N, contaminant concentration, microbial biomass, and Biolog® assay determinations.
Determination of Mineralized CO2-C
Each day during the first week of the study and at least weekly thereafter, CO2-C evolved
from the microcosms was sampled, by taking 0.5 mL gas samples from the head space of sealed
mason jars containing the soil samples. The concentration of CO2-C was measured on a Shimadzu
Gas Chromatograph-8A (Shimadzu Inc., Kyoto, Japan). The gas chromatograph was equipped
with a thermal conductivity detector (TCD) and a 2-m Porapak column. Column temperature was
maintained at 70o C and Helium was used as the carrier gas at a constant flow rate of 14 mL min-1.
After head space gas sampling, jars were opened for approximately 15 min under a laminar flow
hood to allow samples to equilibrate with atmospheric CO2, then resealed and allowed to continue
incubation.
Determination of Mineralized NO3-N
Net nitrification rate was measured as an indicator of microbial stress and contaminant toxicity.
To evaluate this response at each sampling time, 25 g of soil from each treatment was weighed into
duplicate 160 mL serum bottles. Ammonium sulfate was added to one serum bottle at a concentra-
tion of 75 mg NH4-N kg-1 dry soil. The ammonium provided ample N to the microorganisms and
thus eliminated any N limitations to nitrification. Water was added to the other serum bottle as a
control. Samples were then sealed with parafilm and incubated for 7 days at 25 C. Ten g of soil
from each of these samples was extracted with 50 mL of 1M KCl and analyzed for NO3--N and
NH4+-N on an Alpkem Autoanalyzer (Alpkem Corp., Clackamas, Oregon) before and after
incubation. Net nitrification rates were determined by the difference between final and initial nitrate
concentrations and expressed on a per-day basis.

Proceedings of the 1998 Conference on Hazardous Waste Research 387
Determination of Contaminant Concentrations
To determine contaminant concentrations, 2.5 - 3.0 g of soil from each treatment was placed
(at each sampling time) in scintillation vials and spiked with 100 L of 1000 mg kg-1 tetracosane, a
matrix recovery standard. The samples were shaken with 10 mL of high-purity acetone for 30 min,
centrifuged for 10 min, and supernatants collected. These steps were repeated three times. An
aliquot of this extract was transferred to an analytical vial, spiked with 5 L of 1000 mg kg-1 5- -
androstane (an internal standard), and the vials were sealed and stored at -20oC until analyzed. The
samples were analyzed by an HPLC (Hewlett Packard 1080) set at 240 nm, 40 bw, using a C18
reverse phase column (Vydac) and diode array detector. Percent recovery for the contamination
procedure was calculated by comparing contaminant concentration recovered in extract to the initial
concentration.
Determination of Microbial Biomass C and N
Soil microbial biomass was determined using the chloroform fumigation-incubation technique
(Jenkinson and Powlson, 1976). Five grams of sample was weighed into duplicate 160 mL serum
bottles. Both samples were preincubated for 5 days at 25 C, after which one of the samples was
fumigated in a vacuum desiccator with ethanol-free chloroform. Soils were saturated with chloro-
form by applying vacuum three times, followed by equilibration with the atmosphere. Each time,
the chloroform was allowed to boil for 30 seconds. After the third evacuation, the desiccator valve
was closed and the chloroform was allowed to diffuse into the soil for 24 hours. The beaker filled
with chloroform was then removed from the desiccator. Desiccator with samples was evacuated
and equilibrated with atmospheric pressure eight times for 3 minutes each cycle to remove residual
chloroform. Samples were then removed, sealed tightly, and incubated for 10 days at 25 C. At
the end of the incubation period, CO2 -C concentrations from the head space of the serum bottles
were measured on a Shimadzu Gas Chromatograph-8A (Shimadzu Inc., Kyoto, Japan). After
measuring CO2, 25 mL of 1M KCl was added to the soil in each bottle and shaken for 30 min on
an orbital shaker. Samples were then centrifuged, filtered through nylon mesh, and analyzed for
NO3--N and NH4+-N on an Alpkem Autoanalyzer (Alpkem Corp., Clackamas, Oregon). Micro-
bial biomass carbon and nitrogen were calculated according to Voroney and Paul (1984):
C = (Fc -UFc)/Kc (1)
N = (FN - UFN)/KN (2)
where,
C = Microbial biomass carbon
N = Microbial biomass nitrogen
Fc = µg CO2 -C/g soil from the fumigated sample
UFc = µg CO2 -C/g soil from the unfumigated sample

Proceedings of the 1998 Conference on Hazardous Waste Research388
Kc = 0.41, the fraction of biomass C mineralized to CO2
FN = µg NH4-N & NO3-N/g soil from the fumigated sample
UFN = µg NH4-N & NO3-N/g soil from the unfumigated sample
KN = -0.014(FC /FN) + 0.39, the proportion of microbial N mineralized during the 10-day
incubation
Biolog Studies
Ten grams of each soil sample was suspended in 100 mL of 2% NaP4O7 on a rotary shaker
at 300 rpm for 1 hour. After 30 minutes to allow samples to settle, a 1 mL aliquot of supernatant
was diluted tenfold to obtain a final dilution of 10-3. A 150 µL aliquot of this suspension was added
to each well of both Biolog® G- and Biolog G+ microplates (Biolog Inc., Hayward, California). The
microplates were kept at 22o C in a controlled environment chamber. Absorbance at 595 nm was
measured for each well at 24, 48, 72, and 168 hours. Clean SL (C) from Time0 was used as
control to determine the optimal incubation time.
Activity was determined by Average Well Color Development (AWCD) according to Garland
and Mills (1991):
AWCD = (R � C)/X (3)
Number of utilized substrates = Number of substrates which (R-C) > AWCD (4)
Functional diversity = - pi(lnpi) (5)
where,
R = absorbance of responsive well
C = absorbance of control well
X = number of different substrates in both Biolog Gram Negative and Biolog Gram Positive; here
X = 190
pi = the ratio of activity in a particular substrate to the sum of activities on all substrates.
The AWCD, number of utilized substrates, and functional biodiversity data were used to perform
principal component analysis (PCA) to profile pattern differences of each treatment.
RESULTS AND DISCUSSION
Mineralized CO2-C
Upon wetting, both soil types (SL and L) and all treatments (A, B, C, AB, D, E, and F)
demonstrated a slight increase in net mineralized CO2-C rate during the first two days, followed by
a decline over the next two to five days (Figures 1 and 2). Net mineralized CO2-C for the control
SL (C) then declined over the remaining 58 days, except for an unexpected increase which was
detected on day 26 (Figure 1). Each of the treatments, pyrene (A)-, phenanthrene (B)-, and pyrene

Proceedings of the 1998 Conference on Hazardous Waste Research 389
+ phenanthrene (AB)-amended SL had similar patterns of response (Figure 1). After four or five
days, there was an increase in net CO2-C mineralization rate until day 19 and a decline throughout
the remainder of the incubation (Figure 1).
Net mineralized CO2-C from weathered L (E and F) showed a decline from the first day and
throughout the entire period (from ~0.058 mg C g-1 day-1 to <0.005 mg C g-1 day-1). Some short-
lived instances of increased CO2-C were noted on days 19, 35, and 49 (Figure 2). These short
increases may be due to experimental error or variation among samples, or may reflect some
changes in microbial populations. Unfortunately, these increases did not occur at times when
Biolog® assays were performed. Substrate utilization pattern changes at these sampling periods
may have pointed to microbial population functional shifts.
Net mineralized cumulative CO2 -C showed significant differences between control and pyrene-
amended, control and phenanthrene-amended, control and pyrene + phenanthrene-spiked, and
weathered and weathered-spiked (Figure 3, statistics not shown). There were large significant
differences seen between the clean and pyrene + phenanthrene-amended, and between weathered
and weathered-spiked soil treatments. There was also a significant difference between clean and
weathered soils (data not shown). This points to differences in microbial communities between the
two soil types.
Mineralized NO3--N
Nitrification is the biological conversion of ammonium to nitrite and nitrate. It is a two step
process carried out, primarily, by two groups of chemoautotrophic bacteria. Both groups use
inorganic forms of nitrogen as their source of energy and CO2 as their carbon source. The
Nitrosomonas spp. are the most common ammonium oxidizers:
2NH4+ + 3O
2 → 2NO
2- +2H
2O +4H+ + energy (6)
Nitrobacter spp. are then able to oxidize the nitrite into nitrate:
2NO3-+O
2 → 2 NO
3- + energy (7)
In this study, nitrification inhibition was examined as a potential indicator of more sensitive microor-
ganisms� (nitrifiers�) response to environmental stress, caused by pyrene and phenanthrene contami-
nation. Net nitrification rates (Figure 4, Table 2) indicated that all contaminated treatments signifi-
cantly inhibited nitrification activity throughout the experiment. No significant increase in net nitrifica-
tion rate was observed in contaminated vs. uncontaminated soils by day 42.
Decline in the net measured negative nitrification rate in uncontaminated weathered L (F) may
indicate a situation where immobilization is occurring faster than mineralization due to a high micro-
bial growth rate. The incubation time for the nitrification procedure outlined here was 7 days. This
may have been too long since it appears there was a proliferation of microorganisms utilizing the

Proceedings of the 1998 Conference on Hazardous Waste Research390
available nitrate. To minimize this effect, a shortened incubation period or an additional extraction
on day 14 may have improved the results. Using the difference between the 7-day and 14-day
extractions to calculate net nitrification might have helped determine when the microbial population
reached equilibrium.
Nitrification inhibition results in an increase in ammonium, which did not occur in any of the
treatments. Ammonium and nitrate values were negative (Tables 2 and 3). This reinforces the notion
that net immobilization of nitrogen occured. In the clean SL, this may be explained by increased
nitrifiers and microbial demands for ammonium when microbial populations increased. In the
contaminated SL treatments, the PAHs were the primary carbon source and ammonium stimulated
microbial populations.
Net nitrification rate was negligible in all contaminated soils, yet there was a positive response
in microbial activity. There was no significant difference in cumulative carbon respired between
clean and contaminated SL treatments. However, net nitrification rates were zero for contaminated
SL and > 3 µg N g-1 soil day-1 for clean SL. Therefore, despite indication of a stress response by
nitrifiers, no difference in microbial respiration activity was measured. A similar trend holds true for
the weathered L, except net nitrification rate was negligible for weathered L-spiked. Respiration in
weathered L-spiked was significantly greater than the weathered L-control.
Microbial Biomass
The microbial biomass procedure was not successful (data not shown). After fumigation and
incubation for 10 days, fumigated samples had not responded as much as unfumigated samples for
CO2 generation. This resulted in negative values for biomass carbon. Questions have arisen about
the fumigating technique since this response was consistent for both contaminated and uncontami-
nated samples. As a check, fumigation was performed by two authors in parallel analyses and the
results were similar. It is plausible that due to high soil water content, chloroform was not effectively
evacuated under the protocol used. A more intensive evacuation procedure or pre-drying the
samples to 25 % moisture content may have alleviated this problem. This issue was not a problem
with the L soil as much as with the weathered soil, since adequate aeration and soil structure were
maintained at 30% moisture content, thus enabling enough surface-to-air contact for seemingly good
evacuation of residual chloroform.
A more effective way to estimate microbial biomass in this situation may have been the chloro-
form fumigation-extraction method (Vance et al., 1987). This would overcome the need for micro-
bial response of the fumigated samples over unfumigated. Joergensen et al. (1995) successfully
employed this technique when measuring biomass in fuel-oil-contaminated soil. They measured
organic C by UV-persulfate oxidation to CO2 by IR-detection using a Dohrman DC 80 automated
system and ninhydrin-reactive N in the initial soil extracts. After fumigation, inorganic and organic N
and organic C were measured by fractional distillation.

Proceedings of the 1998 Conference on Hazardous Waste Research 391
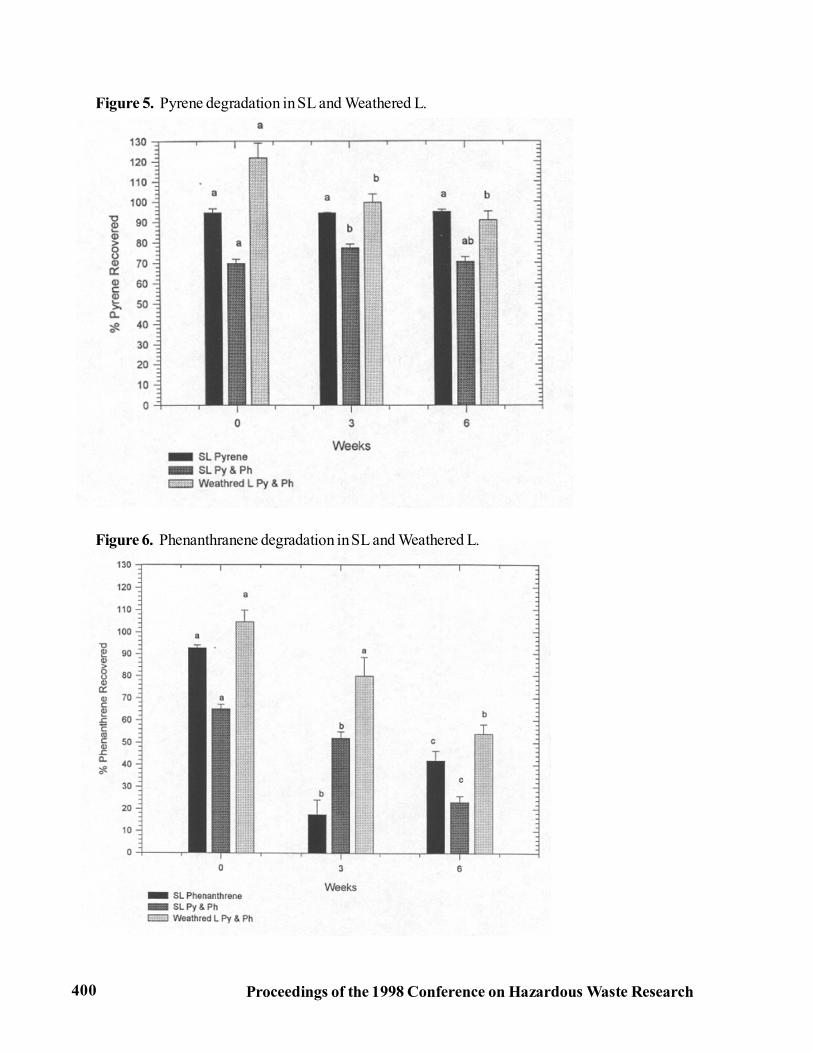
Degradation of Pyrene and Phenanthrene
Extractions from non-spiked, weathered L revealed no remaining pyrene or phenanthrene.
Pyrene degradation occurred more slowly than phenanthrene degradation (Table 4). After 42 days
incubation, pyrene degradation was significant only in the pyrene + phenanthrene-amended weath-
ered L. Pyrene concentrations remained statistically similar throughout the experiment in the other
two treatments. Results were inconclusive for degradation rate between soil types. The authors
were unable to tease out effects of texture, organic matter, cometabolism associated with degrada-
tion of lingering, aged PAHs, and acclimation effects from previous contamination. Previous
acclimation to hydrocarbon substrate enabled the weathered soil�s established community, which
was enzymatically ready and capable within 42 days to be effective at degrading added pyrene.
To conclude that acclimation effects were a factor to degradation requires soils of similar texture and
nutritional status.
Significant phenanthrene degradation was apparent only after 21 days in both SL treatments,
but did not occur until day 42 in the weathered L treatment. Occurrence of cometabolism in SL
cannot be concluded in this study. Given more time, differences in degradation rates between
treatment combinations may become apparent. Table 4 and Figures 5 and 6 are based on the
percentage of individual contaminant recovery by extraction compared to amount calculated,
assuming complete and homogeneous application to the soil.
Biolog Assay
The utilized substrates absorbance pattern of clean SL (C) indicated that 3 days after inocula-
tion was when the number of utilized substrates had reached a saturation and the Average Well
Color Development (AWCD) was still increasing. By that time, further incubation did not result in a
significant increase in number of utilized substrates. The absorbance of each substrate was propor-
tional to its degree of utilization (Kreitz and Anderson, 1997).
The PCA (Figure 7) shows distinct groupings according to soil type and treatment. Pyrene
and phenanthrene additions demonstrated stronger influence on substrate utilization patterns than soil
type; thus, functional profiles of contaminated soil were quite similar. The clean SL and weathered L
profiles developed distinctly after the 42-day incubation.
Mean comparison of AWCD, number of utilized substrates, and Shannon-Weaver diversity
index between the soil samples (Figure 8) indicated there was greater activity and substrate use in
the 42-day versus 21-day incubation. Microorganisms in weathered L were more active and utilized
more substrate than in the clean soils. Microbial activity, substrate utilization, and diversity in
contaminated soils were higher than in non-contaminated soils. However, no statistical differences
between the 21- and 42-day incubations were observed for functional diversity utilization patterns.
Detailed analysis of substrate use during those periods of time revealed that significant functional
diversity resulted in greater utilization of amino acids. Contaminated SL (AB) had greater diversity in
amino acid utilization than weathered L-spiked (Figure 9).

Proceedings of the 1998 Conference on Hazardous Waste Research392
The results of this study indicated that microbial communities exposed to pyrene- and phenan-
threne-contaminated soils produced distinctive patterns of Biolog® substrate utilization. The pat-
terns indicated differences in community structure which resulted in a change in decomposition
ability by soil microorganisms. The pyrene and phenanthrene may have induced changes in type and
amount of enzymes, or composition of the microbial population. The contaminants induced enzyme
response from the microorganisms under their influence. The production of aromatic ring
deoxygenase, one of the PAH-degrading enzymes, was induced by the presence of PAH (Dagher et
al., 1997).
The 42-day incubation allowed the microorganisms to adapt and flourish as indicated by the
increased microbial activity and number of utilized substrates. Microbial communities in the weath-
ered soils may have been selected for, or adapted to PAH exposures. The weathered soil had more
organic matter, which may have increased microbial activity and thus pyrene and phenanthrene
degradation rates (Kastner and Mahro, 1996).
However, organic matter did not appear to increase the population of known PAH-degrading
microorganisms as much as general heterotrophic microorganisms (Carmichael and Pfaender,
1997). PAH degradation capabilities are associated with members of certain taxa such as
Pseudomonas, Sphingomonas, and Burkholderia, independent of origin of the soil from which
bacteria were isolated (Mueller et al., 1997). Moreover, genes responsible for PAH degradation
are homologous and ordered (Dagher et al., 1997). These genetic characteristics restrict enzyme
diversity in microbial communities of pyrene- and phenanthrene-contaminated soils. Biosynthesis of
PAH-degrading enzymes also requires a large amount of specific enzymes for their production. The
biosynthesis increases the number of substrates utilized and leads to a more homologous expression
of enzymes within the community. This phenomenon might explain the insignificant differences in
overall Biolog® functional biodiversity at 21- and 42-day incubations.
The role of biosynthesis enzymes is confirmed by significant differences in utilization of amino
acids. The Biolog® amino acids were used as substrates for the biosynthesis of these enzymes.
Microorganisms in weathered L, used a less diverse array of Biolog® amino acids than those in
freshly contaminated weathered L presumably due to more amino acids already present in the
weathered L.
SUMMARY
The effects of pyrene and phenanthrene on microbial activity were determined in terms of
mineralized CO2-C and NO
3--N. Additions of pyrene, phenanthrene, and pyrene + phenanthrene
enhanced microbial activity in SL. Pyrene + phenanthrene enhanced activity in weathered L as well.
A wider range of amino acid substrates were utilized in weathered L-spiked compared to weath-
ered L.

Proceedings of the 1998 Conference on Hazardous Waste Research 393
ACKNOWLEDGMENT
We thank Dr. Charles W. Rice for providing financial support for major portions of this project
and allowing us to use laboratory instruments in soil microbiology lab.
REFERENCESAtlas, R.M., and R. Bartha. 1980. Microbial Ecology: Fundamentals and Applications, Addison-
Wesley, Reading, MA.
Bumpus, J.A., M. Tien, D. Wright, and S.D. Aust. 1985. Oxidation of Persistent EnvironmentalPollutants by a White Rot Fungus, Science, 228: 1434-1436.
Carmichael, L.M., and F.K. Pfaender. 1997. The Effect of Inorganic and Organic Supplements onthe Microbial Degradation of Phenanthrene and Pyrene in Soils, Biodegradation, 8(1): 1-13.
Cook, J.W., C.L. Hewert, and I. Hieher. 1933. The Isolation of a Cancer-Producing Hydrocarbonfrom Coal Tar, Journal of the Chemical Society, 00: 395.
Dagher, F., E. Deziel, P. Lirette, G. Paquette, J.G. Bisaillon, and R. Villemur. 1997. ComparativeStudy of Five Aromatic Hydrocarbon Degrading Bacterial Strains Isolated from Contami-nated Soils, Canadian Journal of Microbiology, 43(4): 368-77.
Garland, J.Y., and A.L. Mills. 1991. Classification and Characterization of Heterotrophic MicrobialCommunities on the Basis of Patterns of Community Level Sole Carbon Source Utilization,Applied and Environmental Microbiology, 57(8): 2351-2359.
Gunther, T., U. Dornberger, and W. Fristsche. 1996. Effects of Ryegrass on Biodegradation ofHydrocarbons in Soil, Chemosphere, 33: 203-215.
Jenkinson, D.S., and D.S. Powlson. 1976. The Effects of Biocidal Treatments on Metabolism inSoil. V. A Method for Measuring Soil Biomass, Soil Biology and Biochemistry, 8:209-213.
Joergensen, R. G., F. Schmaedeke, K. Windhorst, and B. Meyer. 1985. Biomass and Activity ofMicroorganisms in a Fuel Oil Contaminated Soil, Soil Biology and Biochemistry, 27:1137-1143.
Kastner, M., and B. Mahro. 1996. Microbial Degradation of Polycyclic Aromatic Hydrocarbon inSoils Affected by Organic Matrix of Compost, Applied Microbiology and Biotechnology,50: 668-675.
Kreitz, S., and T. H. Anderson. 1997. Subsurface Utilization Patterns of Extractable and Non-Extractable Bacterial Fraction in Neutral and Acidic Beech Forest Soils, In: MicrobialCommunities, H. Insan, Ed., Springer, Berlin.
Lappin, H. M., M. P. Greaves, and J. H. Slater. 1985. Degradation of the HerbicideMecopropionic Acid by a Synergistic Microbial Community, Applied and EnvironmentalMicrobiology, 49: 429-433.

Proceedings of the 1998 Conference on Hazardous Waste Research394
Leahy, J. G. and R. R. Colwell, 1990. Microbial Degradation of Hydrocarbons in the Environment,Microbiology Review, 54: 305-315.
Lesinger, T., A.M. Cook, J. Nuesch, and R. Hutter. 1981. Microbial Degradation of Xenobioticsand Recalcitrant Compounds, Academic Press, London.
Mahro, B., G. Schaefer, and M. Kastner. 1994. Pathways of Microbial Degradation of PAHs inSoil, In: Bioremediation of Chlorinated and PAH Compounds, R.E. Hinchee et al., Eds.,Lewis Publishers, Boco Raton, FL.
Mueller, J.G., R. Devereux, D.L. Santavy, S.E. Lantz, S.G. Willis, and P.H. Prichard. 1997. Phylo-genetic and Physiological Comparisons of PAH Degrading Bacteria from GeographicallyDiverse Soils, Antoine-Van-Leewnhoek, 7(4): 329-343.
Sims, R.C., and M. R. Overcash. 1983. Fate of Polynuclear Aromatic Compounds (PNAs) inSoil-Plant Systems, Residue Reviews, 88: 1-68.
Solomon, T.W.G. 1996. Organic Chemistry, 6th ed., John Wiley and Sons, New York, NY.
Song, H.X.W. and R. Bartha. 1990. Bioremediation Potential of Terrestrial Fuel Spills, Appliedand Environmental Microbiology, 56: 652-656.
Vance, E.D., P.C. Brookes, and D.S. Jenkinson. 1987. An Extraction Method for Soil MicrobialBiomass-C, Soil Biology and Biochemistry, 19: 703-707.
Voroney, R.P., and E.A. Paul. 1984. Determination of kC and kN in situ for Calibration of theChloroform Fumigation-Incubation Method, Soil Biology and Biochemistry, 16:9-14.
Wilson, S., and K. Jones. 1993. Bioremediation of Soil Contaminated with Polynuclear AromaticHydrocarbons (PAHs): A Review, Environmental Pollution, 81: 229-249.

Proceedings of the 1998 Conference on Hazardous Waste Research 395
erutxeT Hp MO% HN4
N- ON3
N- NlatoT CEC
)gk/gm( )g001/qem(
)LS(maoLydnaS 77.7 5.0 0.2 2.9 422 59.6
)LW(maoLderehtaeW 28.5 3.2 9.93 0.65 4821 92.02
Table 1. Chemical properties of the soils used.
tnemtaerT emiT0
emiT1
emiT2
(µµµµµ ONg3
gN- 1- yadliosyrd 1-
)A(eneryPLS 231.0 + a930.0 410- + a700.0 43.0- + a400.0
)B(enerhtnanehPLS 221.0 + a810.0 300.0 + a300.0 22.0- + a600.0
)BA(enerhtnanehP+eneryPLS 282.1- + d10.0 321.0 + b820.0 690.0 + b120.0
)C(LSnaelC 297.2 + c703.0 843.3 + c862.0 673.3 + c774.0
)E(enerhtnanehP+eneryhPLderehtaeW 287.0 + ba586.0 510.0 + a410.0 610.0- + a800.0
)F(LderehtaeWnaelC 324.1 + b030.0 102.0- + ba552.0 82.01- + a767.0
Table 2. Mean net nitrification rates derived from ammonium amended samples in nitrificationanalysis.
Statistical significance was calculated among treatments within each time period, p<0.05.

Proceedings of the 1998 Conference on Hazardous Waste Research396
tnemtaerT emiT0
emiT1
emiT2
(µµµµµ ONg3
gN- 1- yadliosyrd 1-
)A(eneryPLS 164.2 + 22.1 042.9- + 679.0 397.5- + 789.0
)B(enerhtnanehPLS 445.1 + 55.1 480.8- + 221.1 658.5- + 000.1
)BA(enerhtnanehP+eneryPLS 671.2- + 85.1 767.6- + 266.0 925.2- + 89.0
)C(LSnaelC 166.1- + 156.0 968.1- + 548.1 574.3- + 480.1
)E(enerhtnanehP+eneryhPLderehtaeW 820.1 + 278.1 321.51- + 713.0 843.9- + 119.0
)F(LderehtaeWnaelC 865.1- + 218.0 461.12- + 680.1 044.6- + 181.1
Table 3. Mean net nitrification production of ammonium, derived from ammonium sulfate amendedsamples in nitrification analysis.
)%(noitartnecnoCeneryPnaeM
tnemtaerT emiT0
emiT1
emiT2
)A(eneryPLS 935-49 + a400.2 525.49 + a142.0 601.59 + a279.0
)B(enerhtnanehPLS 876.96 + a331.2 562.77 + b609.1 805.07 + ba253.2
)E(enerhtnanehP+eneryhPLderehtaeW 107.121 + a943.7 526.99 + b651.4 759.09 + b632.4
)%(noitartnecnoCenerhtnanehPnaeM
)B(enerhtnanehPLS 456.29 + a783.1 263.71 + b096.6 788.14 + c434.4
)BA(enerhtnanehP+eneryPLS 989.46 + a211.2 449.15 + b830.3 511.32 + c927.2
)E(enerhtnanehP+eneryhPLderehtaeW 455.401 + a503.5 589.97 + a225.8 388.35 + b923.4
Table 4. Mean % of original contamination concentration recovered.

Proceedings of the 1998 Conference on Hazardous Waste Research 397
Figure 1. Daily CO2 respiration from Clean SL (1a), Pyrene (1b), Phenanthrene (1c), and Pyrene
and Phenanthrene (AB) Amended SL, obtained from University Grounds, Kansas State University,Manhattan, Kansas.

Proceedings of the 1998 Conference on Hazardous Waste Research398
Figure 2. Daily CO2 respiration from Clean (2a) and Pyrene and Phenanthrene (2b) Amended
Weathered L, obtained from California Naval Base.

Proceedings of the 1998 Conference on Hazardous Waste Research 399
Figure 3. Cumulative CO2 respiration from SL and Weathered L.
Figure 4. Nitrification Rates from SL and Weathered L.
Proceedings of the 1998 Conference on Hazardous Waste Research400
Figure 5. Pyrene degradation in SL and Weathered L.
Figure 6. Phenanthranene degradation in SL and Weathered L.

Proceedings of the 1998 Conference on Hazardous Waste Research 401
Figure 7. Substrate utilization pattern by principal component analysis.
Figure 8. Correlation of substrate utilization with time for SL and Weathered L.

Proceedings of the 1998 Conference on Hazardous Waste Research402
Figure 9. Microbial activity, substrate utilization, and functional biodiversity in SL andWeathered L.