effects of open access competition on prices and
TRANSCRIPT
HAL Id: halshs-02930864https://halshs.archives-ouvertes.fr/halshs-02930864
Preprint submitted on 4 Sep 2020
HAL is a multi-disciplinary open accessarchive for the deposit and dissemination of sci-entific research documents, whether they are pub-lished or not. The documents may come fromteaching and research institutions in France orabroad, or from public or private research centers.
L’archive ouverte pluridisciplinaire HAL, estdestinée au dépôt et à la diffusion de documentsscientifiques de niveau recherche, publiés ou non,émanant des établissements d’enseignement et derecherche français ou étrangers, des laboratoirespublics ou privés.
Effects of open access competition on prices andfrequencies on the interurban railway market: evidence
from EuropeFlorent Laroche, Ayana Lamatkhanova
To cite this version:Florent Laroche, Ayana Lamatkhanova. Effects of open access competition on prices and frequencieson the interurban railway market: evidence from Europe. 2020. �halshs-02930864�

Effects of open access competition on prices and frequencies on the interurban railway market:
Evidence from Europe – Laroche F. – Lamatkhanova A.
1
EFFECTS OF OPEN ACCESS COMPETITION ON PRICES AND FREQUENCIES ON THE
INTERURBAN RAILWAY MARKET: EVIDENCE FROM EUROPE
AUTHOR DETAILS:
Dr. Florent LAROCHE, [email protected] (corresponding author)
Associate professor, University of Lyon, LAET-ISH 14 avenue Berthelot, 69363 Lyon
Ayana LAMATKHANOVA, [email protected]
Phd Student, Transport Urban Planning and Economics Laboratory, LAET-ENTPE 3 rue Maurice
Audin, 69518 Vaulx-en-Velin
ACKNOWLEDGEMENTS:
The authors are grateful to the two anonymous reviewers for helpful discussions and useful comments.
ABSTRACT:
This paper explores the effect of competition on prices and frequencies for the Interurban rail market in
Europe. Intramodal competition is assessed by the Herfindahl-Hirschman Index (HHI). Intermodal
competition takes into account new types of service such as coach and carpooling services. The
originality of the analysis stems from the method and database used. The results show that intra-modal
competition has a significant impact on frequencies but not on economy class prices because of
oligopolistic organizations (duopoly). In addition, the effects of intermodal competition are limited
mainly because of considerable differences between services in terms of travel time, comfort and users’
preferences.
DATE OF FINAL VERSION: 17/02/2020
HIGHLIGHTS:
- Intramodal competition is significantly related to frequency when intermodal competition is
related to prices.
- Most of the time, competition is limited to the main routes and duopolies.
- Carpooling and coach services are more complementary than fully substitutable.
KEYWORDS: Market structure, Competition, Herfindhal Index, Oligopoly, regulation, trains
JEL Codes: L1, L110, L130, L5, L920
This research did not receive any specific grant from funding agencies in the public, commercial, or
not-for-profit sectors.
Effects of open access competition on prices and frequencies on the interurban railway market:
Evidence from Europe – Laroche F. – Lamatkhanova A.
2
EFFECTS OF OPEN ACCESS COMPETITION ON PRICES AND FREQUENCIES ON THE
INTERURBAN RAILWAY MARKET: EVIDENCE FROM EUROPE
1. Introduction:
The question of competition in the railway market is very sensitive for the media and governments
(Beria et al., 2012). It conveys a great deal of fear and apprehension in terms of quality of service and
prices while the European Commission considers it as a good lever for reducing costs and increasing
the competitiveness of rail transport (EC, 2011). This issue has been dealt with extensively by the
academic literature from the first theoretical approaches to the premises of competition on the European
network (Nash and Preston, 1992; Else and James, 1994), to the most recent developments based on
empirical case studies (Fröidh and Byström, 2013; Beria et al., 2016; Tomes et al., 2016). Nevertheless,
several limits can be identified and gaps remain to be filled by research. The first concerns the
transferability of the results from one case study to another around Europe. The implementation of
European guidelines on competition is heterogeneous, with countries whose markets have been
substantially opened such as the UK, Sweden and Germany as opposed to other cases like France (Nash
et al., 2016). Therefore, a diversity of experiences and empirical analysis based on specific lines
(Temple, 2015; Tomes et al., 2016) or countries (Nilsson et al., 2013; Nash et al. 2016) have emerged.
Other studies have been conducted on the European level to achieve better comparability, but the data
are very aggregated and the effects of competition on services are often difficult to isolate
(Alexandersson, 2009; Nash, 2010; Finger, 2014; EC, 2016; IRG-Rail, 2017). The second limit stems
from the evolution of intermodal competition and new challenges for railway networks driven by road
and air transport. Road transport has made large gains in productivity during the last ten years which
can be mainly explained by the liberalization of the coach market, starting from the pioneers in the 1980s
(UK in 1980; Sweden in 1989) to the latest developments in three important countries1 (White et al.,
2012; Grimaldi et al., 2017) and, most unexpectedly, by the development of carpooling throughout
Europe. Carpooling can be defined “as an arrangement where two or more people not belonging to the
same household share the use of a privately owned car for a trip (or a part of a trip), and the passengers
contribute to the driver’s expenses” (Delhomme and Gheorgiu, 2016). Air transport has also increased
its productivity by implementing the low-cost model. Studies testing the impact of intermodal
competition on prices and quality of service are few and mostly limited to competition in the air transport
sector (Bergantino and Capozza, 2015; Bergantino et al., 2015, EC, 2016; Zhang et al., 2019). Finally,
the final limit corresponds to the comparison with other modes in terms of analysis. In the case of coach
transport, the paper by Fageda and Sansano (2018) provided a major analysis of factors influencing
prices and frequencies in the interurban bus market based on disaggregated data collected in six
European countries. Regarding air transport, analogous studies have been conducted with more robust
results of the effect of competition on services (Adler et al., 2010; Carlsson, 2002; Chakrabarty and
Kutlu, 2014). There are no similar studies for the rail passenger market, taking into account the
specificities of the industry.
Considering the context, this paper explores the effects of intermodal and intramodal competition on
prices and frequencies in the interurban railway market. The method is based on an econometric model
and the cross-sectional regression applied by Fageda and Sansano (2018) for the coach market. Its
application to the rail market raises some challenges such as the adaptation of the equation to the
specificities of competition in the different rail markets, the establishment of a sufficiently large database
and the collection of data from competitors.
1 Germany in 2013, Italy in 2014 and France in 2015

Effects of open access competition on prices and frequencies on the interurban railway market:
Evidence from Europe – Laroche F. – Lamatkhanova A.
3
Therefore, the database contains 90 routes distributed between seven countries (France, Germany, Italy,
Netherlands, Sweden, Switzerland and UK). The data have been collected for one day of a week in
December 2017 (Tuesday exclusively) and the variables are grouped into three categories:
macroeconomic (population, GDP), rail supply (number of trains, time period of daytime service, ticket
price, number of competitors, etc.) and competitors (train, coach, carpooling, air).
The main results show that intra-modal competition has a significant impact on frequencies for long
distance train services but no significant effect on prices for the economy class because of duopoly
situations. Otherwise, the effects of intermodal competition are limited, mainly because of the
considerable differences between market structures in terms of travel time, comfort and users’
preferences. This is the case of coaches and carpooling, available when prices for trains tend to be high,
but not of air transport which can drive train operators to decrease their prices in the case of direct
competition for long distances.
The rest of the paper is organized as follows. In Section 2 we provide a more in-depth literature review
of the results expected from the model. In Section 3 we describe the database and present the descriptive
statistics of the variables used. In Section 4 the model itself is presented followed by a discussion of the
main results given in section 5. Finally, the results are discussed in section 6 before we conclude in
section 7.
2. Literature review
In section 2.1, we emphasize that the European railway market is highly fragmented in terms of
competition and practices compared to other modes. This specificity needs to be considered in the study.
A review is provided in section 2.2 of the results expected from the academic literature through
theoretical models and the empirical studies. Then, in section 2.3 the limits of these studies in terms of
data, perimeters and methods are presented.
2.1. Considerable heterogeneity on the European rail market for competition and practices
In spite of the European policy for harmonization and competition implemented by the European
Commission since 1991, the European rail market has remained highly fragmented in terms of
competition and practices (Beria et al., 2012; Nash et al., 2016; Perennes, 2017). Consequently, certain
facts deserve more detailed description.
First of all, two types of competition can be distinguished according to the market structure: “in the
market” and “for the market”. The competition “in the market”, or more commonly “in open access”, is
predominant for the profitable services where public subsidies are not requisite to ensure the services
provided. Most of the time, this type of competition has been adopted in Europe for rail freight and
interurban services (IC). Conversely, the competition “for the market” is more adapted to the non-
profitable services where access to track infrastructure is regulated by tendering. It is predominant for
the regional passenger services (R) and can also be adopted for specific interurban or freight services in
some European countries. This study focuses in particular on interurban services in “open access”.
Secondly, the evolution of the market from monopoly to competition varies from one country to another.
The fourth railway package fixes the deadline to open interurban services for 2019. The reality of the
situation shows contrasts exist with several forerunner countries that opened their markets in the 1990s
(Sweden, UK, Netherlands and Germany) and other countries that still permit monopolies (France,
Belgium, Switzerland). The UK opted for a specific organization of sharing its network in the form of
franchises awarded to operators after a competitive bidding process for a period from 7 to 15 years
(Preston et al., 1999). Only certain routes were open to access for competition (Smith and Wheat, 2012).
Also, in spite of the European deadline, in some countries the debate still remains whether it is really
advantageous to open their markets to competition for consumers (Beria et al., 2012), hence the need to
improve our knowledge using the experiences learned from precursor countries is evident.

Effects of open access competition on prices and frequencies on the interurban railway market:
Evidence from Europe – Laroche F. – Lamatkhanova A.
4
Lastly, the literature shows that liberalization does not automatically imply the entry of competitors
(Alexandersson, 2009; IRG-RAIL, 2017; Perennes, 2017). Barriers to entry are kept high regarding
several aspects (access to rolling stock, access charges, anticompetitive behavior from incumbents, etc.)
and most often, financial equilibrium is difficult to achieve for new operators (Nash, 2010; Johnson and
Nash, 2012). Consequently, the European study produced by the group of rail regulators (IRG-RAIL,
2017) showed that the market share of new operators is low: between 10 per cent and 25 per cent on the
most open markets (Austria, Germany, UK), and lower than 1 per cent in most European countries
(France, Spain, Belgium). However, Laroche et al. (2017) highlighted that the freight market had
evolved quickly, with new operators during the liberalization period (2000 – 2010). Ivaldi and Vides
(2008) found, in an analysis based on a game theory model for open access competition, that a small
number of competitors is enough to create a high degree of competition. A similar situation could occur
in the passenger sector around the European deadline (2020 – 2030).
2.2. Expected results of competition in the academic literature
The effects of competition on the rail market have been examined extensively in the literature. Some
studies are based on theoretical approaches while others are empirical.
Theoretical studies are mainly focused on the effects of competition in open access based on interurban
services, and assess its impact on social welfare as an equilibrium between the user’s surplus and the
operator’s surplus. Preston et al. (1999) showed that intra-modal competition does not automatically
entail a gain in welfare. It has not been fully demonstrated that the loss in profit for the incumbent is
compensated by gains of productivity or by consumer surplus. Nevertheless, they assumed that
competition can be beneficial in the case of strong product differentiation in terms of price (low-cost)
and quality of service. More recently, a study from Broman and Eliasson (2016) based on a duopoly
market situation pointed to a gain in total welfare. Their findings claimed that gains of consumers are
higher than the operator’s losses. The incitation to increase frequency for operators is one of the key
factors. Shah and Brueckner (2012) took it into account in their study when modeling price and
frequency competition among rail freight carriers, where the condition for maximizing their profit is to
balance prices, frequencies and vehicle capacity. The same balance can be considered for passengers,
especially for rail where on track capacity can be a major constraint. Lang et al. (2013) showed in a
game-theory model that competition in open access can increase the number of operators and
consequently frequency and traffic. They argued that the regulator should incite the network manager
to reduce access charges in order to increase the number of train-kilometers and decrease prices. They
concluded that the welfare effect of competition is still ambiguous and depends on the level of
competition. According to Johnson and Nash (2012) the reduction of access charges should be
considered with caution. Although it is a good way to support competition, there is a potential risk for
public finances due to the need for subsidies to cover the losses of the infrastructure manager. Elsewhere,
Cherbonnier et al. (2018) found that the introduction of competition for long distance services does not
induce a price reduction for passengers in an oligopolistic market. These effects are difficult to predict
and can vary from one line to another.
In spite of the ambiguity regarding competition effects from the theoretical standpoint, initial lessons
can be drawn from empirical studies. The literature is mainly based on experiences where markets have
been fully opened to competition “on the track”. The most common case studies are represented by the
UK, Sweden and Germany, countries where competition started earlier. Recently, they were
accompanied by the Italian case, after the entry of a new operator (Italo) on the Italian high-speed
network in 2012 (Finger et al., 2016). The main findings can be summarized as follows. Most of the
studies analyzed the impact of competition on price. Fröidh and Byström (2013) showed through an
analysis of passenger preferences between two different trains in Sweden, that prices and travel time are
key factors of consumer choice in the case of interurban services. Frequency was less important in their
findings. Consequently, as expected by theoretical models, prices for the economy class decrease with
the entry of a new operator. Variations differ according to case study. In Italy, Beria et al. (2016) found
a variation of -15 per cent for the incumbent after the entry of the new operator on the Milan – Ancona
route. Vigren (2016) found a similar result when considering the route between Stockholm – Goteborg,

Effects of open access competition on prices and frequencies on the interurban railway market:
Evidence from Europe – Laroche F. – Lamatkhanova A.
5
where the incumbent decreased its prices by 12.8 per cent after the entry of the new company MTR
Express in Sweden. On the contrary, effects can be more substantial. In the Czech Republic, Tomes et
al. (2016) witnessed a fall in price of -46 per cent between 2011 and 2014 due to the entry of two new
competitors on the Prague – Ostrava route. Nevertheless, the authors showed a negative impact on
operators’ profits and highlighted increasing stress weighing on their financial equilibrium.
Considering frequency, most of the studies found that it tends to increase in the case of competition.
Bergantino et al. (2015) showed that frequency increased by 30 per cent and 56 per cent on three HST
routes in open access in Italy. The results showed a greater variation in frequency than in prices.
Nevertheless, studies that take into account the impact of competition on frequency are rare, especially
since prices are usually considered as the main variable for competition “on the track”. It would be
interesting to investigate the impact of competition on frequency further.
To conclude, the empirical literature is line with the theoretical predictions on the effect of competition.
Prices mainly decrease because of the lower margin of incumbents while frequencies increase due to the
duplication of services (Preston et al., 1999). The impact on social surplus is more ambiguous because
of the difficulties faced by new operators in reaching financial equilibrium (Laroche et al., 2017; Nash,
2010) but also because of the loss of surplus to incumbents.
2.3. Limits of the literature review
The literature review underlines several limits in the analysis of competition effects. Three limits have
already been developed in the introduction: specific case studies, poor transferability of results, and
analysis limited to competition with air transport.
Other limits can be highlighted. Firstly, the impact of competition is assessed on price in priority and
less on frequency. This bias could understate the importance of frequency in the operator’s strategies
and the impact for users. Secondly, there are no studies comparing the impact of competition in different
markets and countries. The development of an econometric model based on a large set of routes could
fill this gap and provide trends in prices and frequencies.
Finally, it is interesting to compare the literature on the rail market to other transportation markets like
air and coach transport. For both of the latter, studies are more robust in terms of data and method.
Cattaneo et al. (2018) proposed an analysis of changes in frequencies and prices for a specific air
operator across Europe. Carlsson (2002) analyzed the price and frequency choice in aviation markets
using 172 city-pair markets in eight European countries. The literature on coach market competition
also provides interesting analysis frameworks. Other studies have raised the question of inter-modal
competition, mainly to show a significant impact of switching from coach to rail in terms of price
(Bataille and Steinmetz, 2013; Knorr and Lueg-Arndt, 2016). The study of Fageda and Sansano (2018)
explored a larger perimeter in which the authors collected data in six European countries (177 interurban
bus services) to assess factors influencing prices and frequencies in the interurban bus market. Using an
econometric approach, they showed that intra-modal competition is based on frequency while inter-
modal competition is based on prices.
The objective of this paper is to test an approach similar to the method developed by Fageda and Sansano
(2018), focused on comparing the interurban bus market to the rail passenger market.
3. Data
Data collection is challenging for the rail market. Most of the analyses in this field suffer from a lack of
data and sources. The study perimeter is defined in Section 3.1 then the data collection method is
presented in section 3.2. Finally, the main components of the database are described in section 3.3.
3.1. Study perimeter:
The study perimeter covers seven European countries. The main criterion used to select them is based
on the utilization rate of the network in terms of train-kilometers. Networks like those in the Netherlands,
Switzerland, United Kingdom (UK) and Germany are above the European average (IRG-RAIL, 2017)
Effects of open access competition on prices and frequencies on the interurban railway market:
Evidence from Europe – Laroche F. – Lamatkhanova A.
6
and are retained for the analysis. Three other countries, below the European average, but representative
of the European rail market have been selected: France, Sweden and Italy.
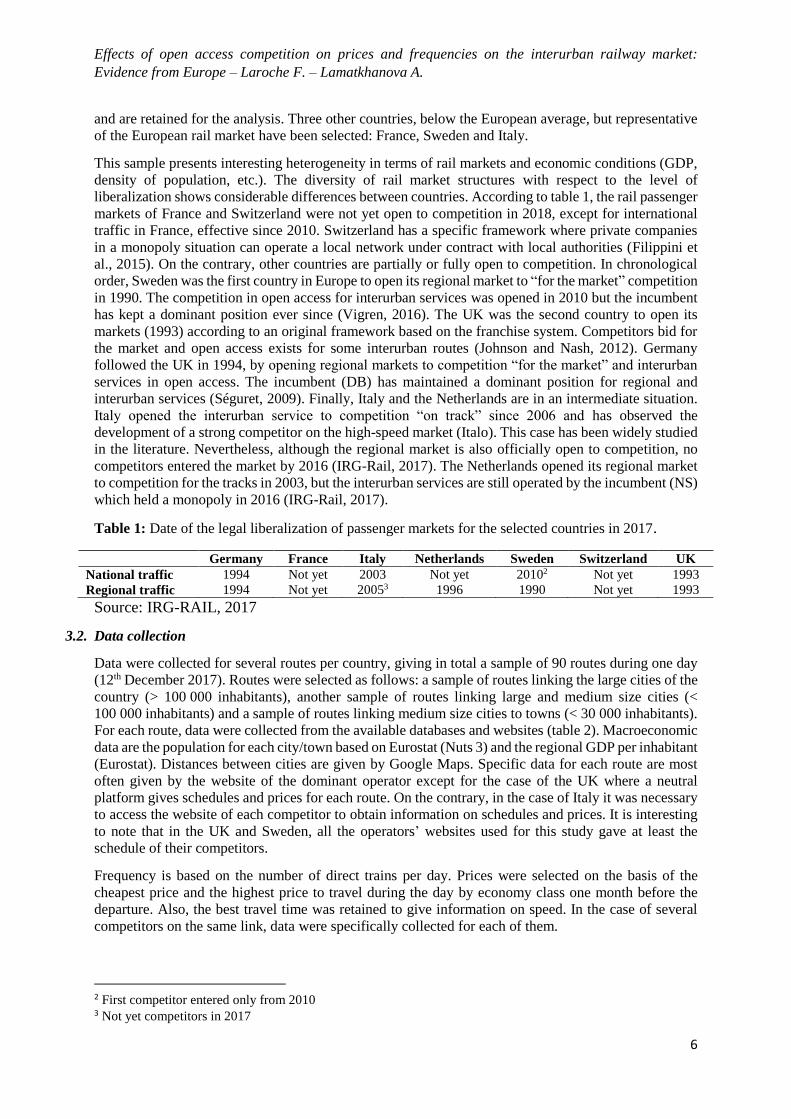
This sample presents interesting heterogeneity in terms of rail markets and economic conditions (GDP,
density of population, etc.). The diversity of rail market structures with respect to the level of
liberalization shows considerable differences between countries. According to table 1, the rail passenger
markets of France and Switzerland were not yet open to competition in 2018, except for international
traffic in France, effective since 2010. Switzerland has a specific framework where private companies
in a monopoly situation can operate a local network under contract with local authorities (Filippini et
al., 2015). On the contrary, other countries are partially or fully open to competition. In chronological
order, Sweden was the first country in Europe to open its regional market to “for the market” competition
in 1990. The competition in open access for interurban services was opened in 2010 but the incumbent
has kept a dominant position ever since (Vigren, 2016). The UK was the second country to open its
markets (1993) according to an original framework based on the franchise system. Competitors bid for
the market and open access exists for some interurban routes (Johnson and Nash, 2012). Germany
followed the UK in 1994, by opening regional markets to competition “for the market” and interurban
services in open access. The incumbent (DB) has maintained a dominant position for regional and
interurban services (Séguret, 2009). Finally, Italy and the Netherlands are in an intermediate situation.
Italy opened the interurban service to competition “on track” since 2006 and has observed the
development of a strong competitor on the high-speed market (Italo). This case has been widely studied
in the literature. Nevertheless, although the regional market is also officially open to competition, no
competitors entered the market by 2016 (IRG-Rail, 2017). The Netherlands opened its regional market
to competition for the tracks in 2003, but the interurban services are still operated by the incumbent (NS)
which held a monopoly in 2016 (IRG-Rail, 2017).
Table 1: Date of the legal liberalization of passenger markets for the selected countries in 2017.
Germany France Italy Netherlands Sweden Switzerland UK
National traffic 1994 Not yet 2003 Not yet 20102 Not yet 1993
Regional traffic 1994 Not yet 20053 1996 1990 Not yet 1993
Source: IRG-RAIL, 2017
3.2. Data collection
Data were collected for several routes per country, giving in total a sample of 90 routes during one day
(12th December 2017). Routes were selected as follows: a sample of routes linking the large cities of the
country (> 100 000 inhabitants), another sample of routes linking large and medium size cities (<
100 000 inhabitants) and a sample of routes linking medium size cities to towns (< 30 000 inhabitants).
For each route, data were collected from the available databases and websites (table 2). Macroeconomic
data are the population for each city/town based on Eurostat (Nuts 3) and the regional GDP per inhabitant
(Eurostat). Distances between cities are given by Google Maps. Specific data for each route are most
often given by the website of the dominant operator except for the case of the UK where a neutral
platform gives schedules and prices for each route. On the contrary, in the case of Italy it was necessary
to access the website of each competitor to obtain information on schedules and prices. It is interesting
to note that in the UK and Sweden, all the operators’ websites used for this study gave at least the
schedule of their competitors.
Frequency is based on the number of direct trains per day. Prices were selected on the basis of the
cheapest price and the highest price to travel during the day by economy class one month before the
departure. Also, the best travel time was retained to give information on speed. In the case of several
competitors on the same link, data were specifically collected for each of them.
2 First competitor entered only from 2010 3 Not yet competitors in 2017

Effects of open access competition on prices and frequencies on the interurban railway market:
Evidence from Europe – Laroche F. – Lamatkhanova A.
7
Finally, data for the intermodal competition were collected from the European trip comparator
www.goeuro.com. The data selected are similar to the train data, except that there are no disaggregated
data per operator when several competitors share the market for coach or air transport.
Table 2: Sources for the database.
Variables Sources Date of collection
Population Eurostat 2016/2017
Distance Google map 2018
GDP Eurostat 2015/2016
PPP OECD 2015/2016
Intermodal offer www.goeuro.com 12/12/2017
Train offer
Germany www.bahn.de
12/12/2017
France www.oui.sncf
Italy www.trenitalia.com
www.italotreno.it
Netherlands www.ns.nl
United Kingdom www.nationalrail.co.uk
Switzerland www.sbb.ch
Sweden www.sj.se
Source: authors
3.3. Data overview
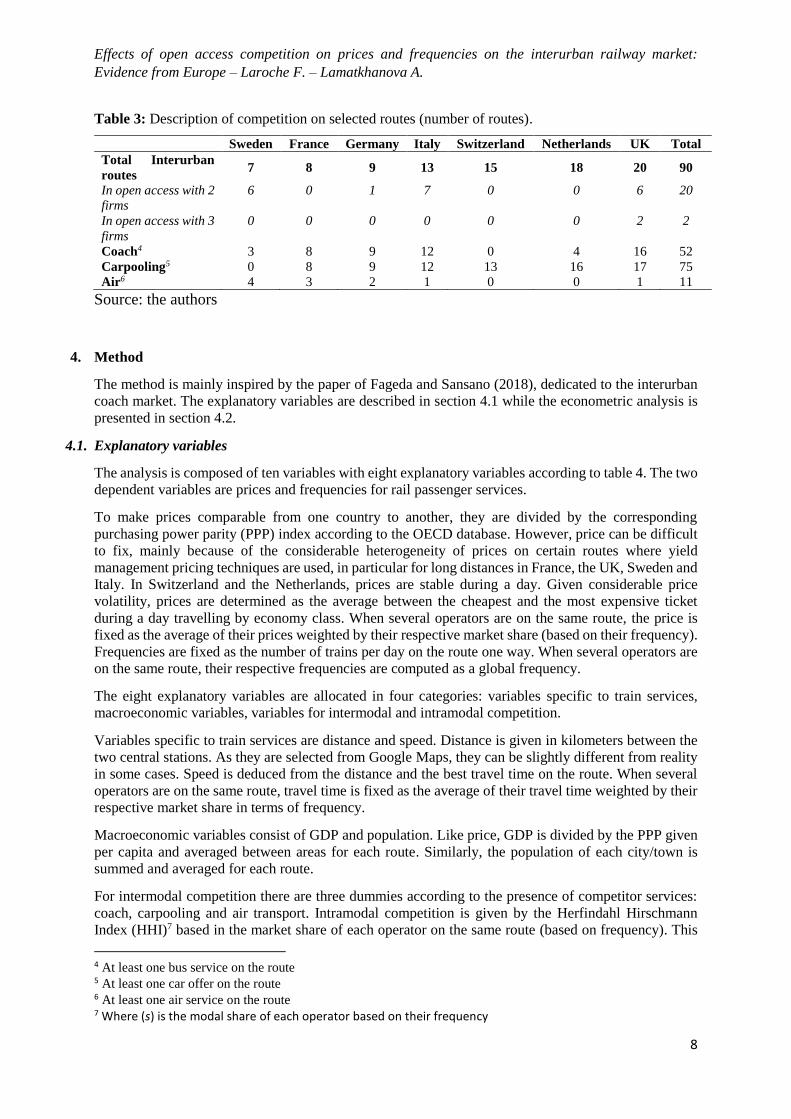
Table 3 allocates the number of routes per country concerned by competition. In this paper, we consider
only interurban services (IC) giving a sample of 90 routes.
To be more precise, none of the routes in France and Switzerland are open to competition. Each of their
operators is in a monopoly position because of restrictive regulations. In the UK, several routes have
more than one operator and two routes have three competitors (London – Birmingham; Leeds – York).
In Sweden and Germany, only a few routes have more than one competitor. Those observations are in
line with the literature which shows that competition in open access is relatively limited in Europe
(Alexandersson, 2009; Perennes, 2017). Thus, the Netherlands has no routes in open access, as expected,
and seven routes in Italy are shared between two competitors in open access. They are all focused on
HST and the competition between the national incumbent, Trenitalia, and Italo.
Finally, intermodal competition is mainly represented by carpooling, which is identified on the majority
of routes for each country except the UK and Sweden, where there are more routes with bus services
than with carpooling. Nevertheless, data for carpooling has to be considered with prudence. Services for
buses, trains and airplanes are planned and reproducible, which is not the case for carpooling. Therefore,
competition on a route can exist only for one day, one event or a season. In addition, many drivers make
offers only few days before their departure. Consequently, it is highly volatile and demand is difficult
to measure.
Effects of open access competition on prices and frequencies on the interurban railway market:
Evidence from Europe – Laroche F. – Lamatkhanova A.
8
Table 3: Description of competition on selected routes (number of routes).
Source: the authors
4. Method
The method is mainly inspired by the paper of Fageda and Sansano (2018), dedicated to the interurban
coach market. The explanatory variables are described in section 4.1 while the econometric analysis is
presented in section 4.2.
4.1. Explanatory variables
The analysis is composed of ten variables with eight explanatory variables according to table 4. The two
dependent variables are prices and frequencies for rail passenger services.
To make prices comparable from one country to another, they are divided by the corresponding
purchasing power parity (PPP) index according to the OECD database. However, price can be difficult
to fix, mainly because of the considerable heterogeneity of prices on certain routes where yield
management pricing techniques are used, in particular for long distances in France, the UK, Sweden and
Italy. In Switzerland and the Netherlands, prices are stable during a day. Given considerable price
volatility, prices are determined as the average between the cheapest and the most expensive ticket
during a day travelling by economy class. When several operators are on the same route, the price is
fixed as the average of their prices weighted by their respective market share (based on their frequency).
Frequencies are fixed as the number of trains per day on the route one way. When several operators are
on the same route, their respective frequencies are computed as a global frequency.
The eight explanatory variables are allocated in four categories: variables specific to train services,
macroeconomic variables, variables for intermodal and intramodal competition.
Variables specific to train services are distance and speed. Distance is given in kilometers between the
two central stations. As they are selected from Google Maps, they can be slightly different from reality
in some cases. Speed is deduced from the distance and the best travel time on the route. When several
operators are on the same route, travel time is fixed as the average of their travel time weighted by their
respective market share in terms of frequency.
Macroeconomic variables consist of GDP and population. Like price, GDP is divided by the PPP given
per capita and averaged between areas for each route. Similarly, the population of each city/town is
summed and averaged for each route.
For intermodal competition there are three dummies according to the presence of competitor services:
coach, carpooling and air transport. Intramodal competition is given by the Herfindahl Hirschmann
Index (HHI)7 based in the market share of each operator on the same route (based on frequency). This
4 At least one bus service on the route 5 At least one car offer on the route 6 At least one air service on the route 7 Where (s) is the modal share of each operator based on their frequency
Sweden France Germany Italy Switzerland Netherlands UK Total
Total Interurban
routes 7 8 9 13 15 18 20 90
In open access with 2
firms
6 0 1 7 0 0 6 20
In open access with 3
firms
0 0 0 0 0 0 2 2
Coach4 3 8 9 12 0 4 16 52
Carpooling5 0 8 9 12 13 16 17 75
Air6 4 3 2 1 0 0 1 11
Effects of open access competition on prices and frequencies on the interurban railway market:
Evidence from Europe – Laroche F. – Lamatkhanova A.
9
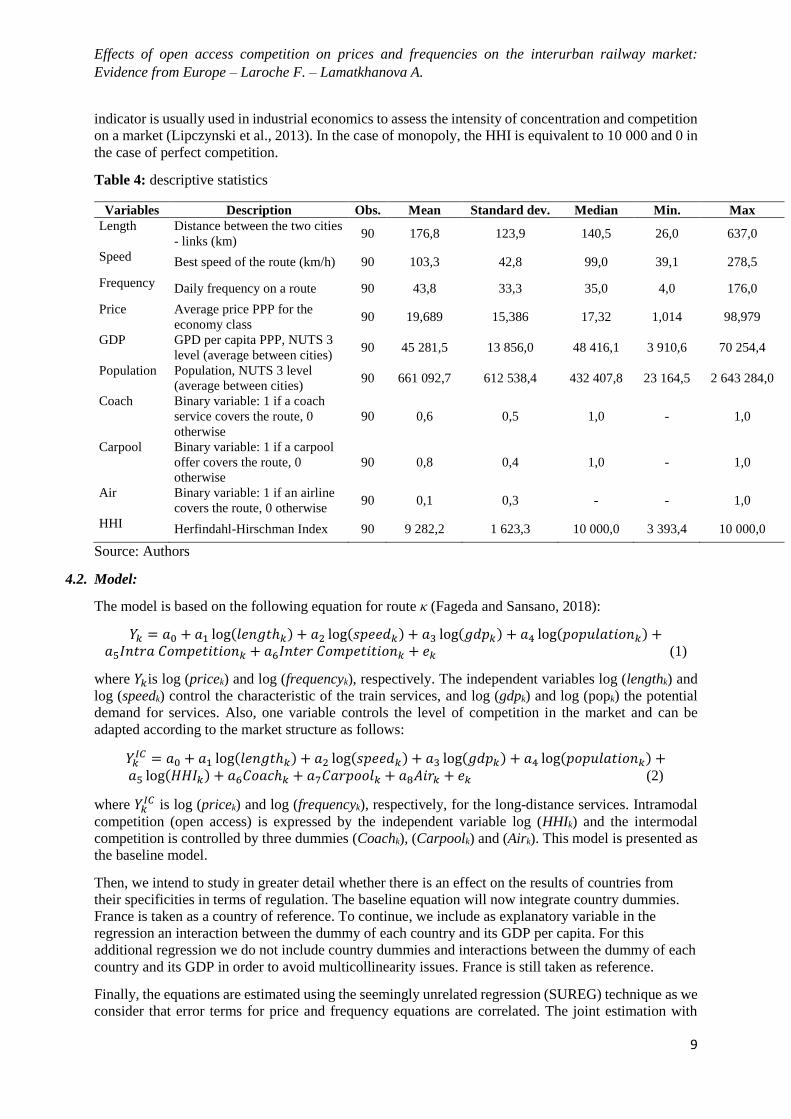
indicator is usually used in industrial economics to assess the intensity of concentration and competition
on a market (Lipczynski et al., 2013). In the case of monopoly, the HHI is equivalent to 10 000 and 0 in
the case of perfect competition.
Table 4: descriptive statistics
Variables Description Obs. Mean Standard dev. Median Min. Max
Length Distance between the two cities
- links (km) 90 176,8 123,9 140,5 26,0 637,0
Speed Best speed of the route (km/h) 90 103,3 42,8 99,0 39,1 278,5
Frequency Daily frequency on a route 90 43,8 33,3 35,0 4,0 176,0
Price Average price PPP for the
economy class 90 19,689 15,386 17,32 1,014 98,979
GDP GPD per capita PPP, NUTS 3
level (average between cities) 90 45 281,5 13 856,0 48 416,1 3 910,6 70 254,4
Population Population, NUTS 3 level
(average between cities) 90 661 092,7 612 538,4 432 407,8 23 164,5 2 643 284,0
Coach Binary variable: 1 if a coach
service covers the route, 0
otherwise
90 0,6 0,5 1,0 - 1,0
Carpool Binary variable: 1 if a carpool
offer covers the route, 0
otherwise
90 0,8 0,4 1,0 - 1,0
Air Binary variable: 1 if an airline
covers the route, 0 otherwise 90 0,1 0,3 - - 1,0
HHI Herfindahl-Hirschman Index 90 9 282,2 1 623,3 10 000,0 3 393,4 10 000,0
Source: Authors
4.2. Model:
The model is based on the following equation for route κ (Fageda and Sansano, 2018):
𝑌𝑘 = 𝑎0 + 𝑎1 log(𝑙𝑒𝑛𝑔𝑡ℎ𝑘) + 𝑎2 log(𝑠𝑝𝑒𝑒𝑑𝑘) + 𝑎3 log(𝑔𝑑𝑝𝑘) + 𝑎4 log(𝑝𝑜𝑝𝑢𝑙𝑎𝑡𝑖𝑜𝑛𝑘) +𝑎5𝐼𝑛𝑡𝑟𝑎 𝐶𝑜𝑚𝑝𝑒𝑡𝑖𝑡𝑖𝑜𝑛𝑘 + 𝑎6𝐼𝑛𝑡𝑒𝑟 𝐶𝑜𝑚𝑝𝑒𝑡𝑖𝑡𝑖𝑜𝑛𝑘 + 𝑒𝑘 (1)
where 𝑌𝑘is log (pricek) and log (frequencyk), respectively. The independent variables log (lengthk) and
log (speedk) control the characteristic of the train services, and log (gdpk) and log (popk) the potential
demand for services. Also, one variable controls the level of competition in the market and can be
adapted according to the market structure as follows:
𝑌𝑘𝐼𝐶 = 𝑎0 + 𝑎1 log(𝑙𝑒𝑛𝑔𝑡ℎ𝑘) + 𝑎2 log(𝑠𝑝𝑒𝑒𝑑𝑘) + 𝑎3 log(𝑔𝑑𝑝𝑘) + 𝑎4 log(𝑝𝑜𝑝𝑢𝑙𝑎𝑡𝑖𝑜𝑛𝑘) +
𝑎5 log(𝐻𝐻𝐼𝑘) + 𝑎6𝐶𝑜𝑎𝑐ℎ𝑘 + 𝑎7𝐶𝑎𝑟𝑝𝑜𝑜𝑙𝑘 + 𝑎8𝐴𝑖𝑟𝑘 + 𝑒𝑘 (2)
where 𝑌𝑘𝐼𝐶 is log (pricek) and log (frequencyk), respectively, for the long-distance services. Intramodal
competition (open access) is expressed by the independent variable log (HHIk) and the intermodal
competition is controlled by three dummies (Coachk), (Carpoolk) and (Airk). This model is presented as
the baseline model.
Then, we intend to study in greater detail whether there is an effect on the results of countries from
their specificities in terms of regulation. The baseline equation will now integrate country dummies.
France is taken as a country of reference. To continue, we include as explanatory variable in the
regression an interaction between the dummy of each country and its GDP per capita. For this
additional regression we do not include country dummies and interactions between the dummy of each
country and its GDP in order to avoid multicollinearity issues. France is still taken as reference.
Finally, the equations are estimated using the seemingly unrelated regression (SUREG) technique as we
consider that error terms for price and frequency equations are correlated. The joint estimation with

Effects of open access competition on prices and frequencies on the interurban railway market:
Evidence from Europe – Laroche F. – Lamatkhanova A.
10
SUREG can be used to address such correlations. The correlation matrix shows that there is no
potentially high correlation between regressors that prevent the risk of multicollinearity (Annex 1).
Otherwise, standard errors are robust to heteroscedasticity.
5. Results
The results are split into two subsections based on the different explanatory variables. The effect of
competition on price is presented in section 5.1, then the impact on frequency is dealt with in section
5.2.
5.1. Effect on prices
Table 5 shows that GDP per inhabitant and length are the most significant factors for explaining prices
for long distances. There is a positive relation between GDP and prices (prices increase by 0.8 per cent
when GDP increases by 1 per cent) and between length and prices (prices increase by 0.55 per cent when
length increases by 1 per cent). This highlights the impact of the wealth effect through the cost of living
and the production cost.
The non-significance of intramodal competition on prices is surprising when compared to the rest of the
literature and empirical case studies based on specific lines. The fact that prices are lower or higher than
on other lines is not due to competition in the market. Nevertheless, according to the literature,
competition can have a positive impact on prices when specific lines or services are considered over a
time period.
The impact of intermodal competition is more consistent with the literature. Competition from air
transport has a significant impact on prices by decreasing them, all other things being equal. There is
direct competition between rail and air transport when distances or travel times are long enough to make
air services profitable.
Finally, the effects of intermodal competition from coach transport and carpooling are rather more
unclear. The likelihood of finding a coach or carpooling service is higher when train prices tend to be
high. The main explanation might be that these services can be considered as an alternative to train
services by some travelers (for leisure purposes) when train fares are high. Nevertheless, they do not
seem substitutable for train services and train operators remain in the position of price makers.
Table 5: Estimation for “price” for long distance train services.
Price Baseline
Intercept -11.80 (2.67) ***
Length 0.55 (0.12) ***
Speed 0.02 (0.16)
GDP 0.81 (0.11) ***
Population -0.09 (0.06)
HHI 0.43 (0.27)
COACH 0.34 (0.13) *
CAR 0.34 (0.17) .
AIR -0.49 (0.17) **
N 90
Adjusted R² 0,700
Significance level: ' 0 ‘***’ 0.001 ‘**’ 0.01 ‘*’ 0.05 ‘.’ 0.1 ‘ ’ 1
Standard errors in parentheses
Source: Authors
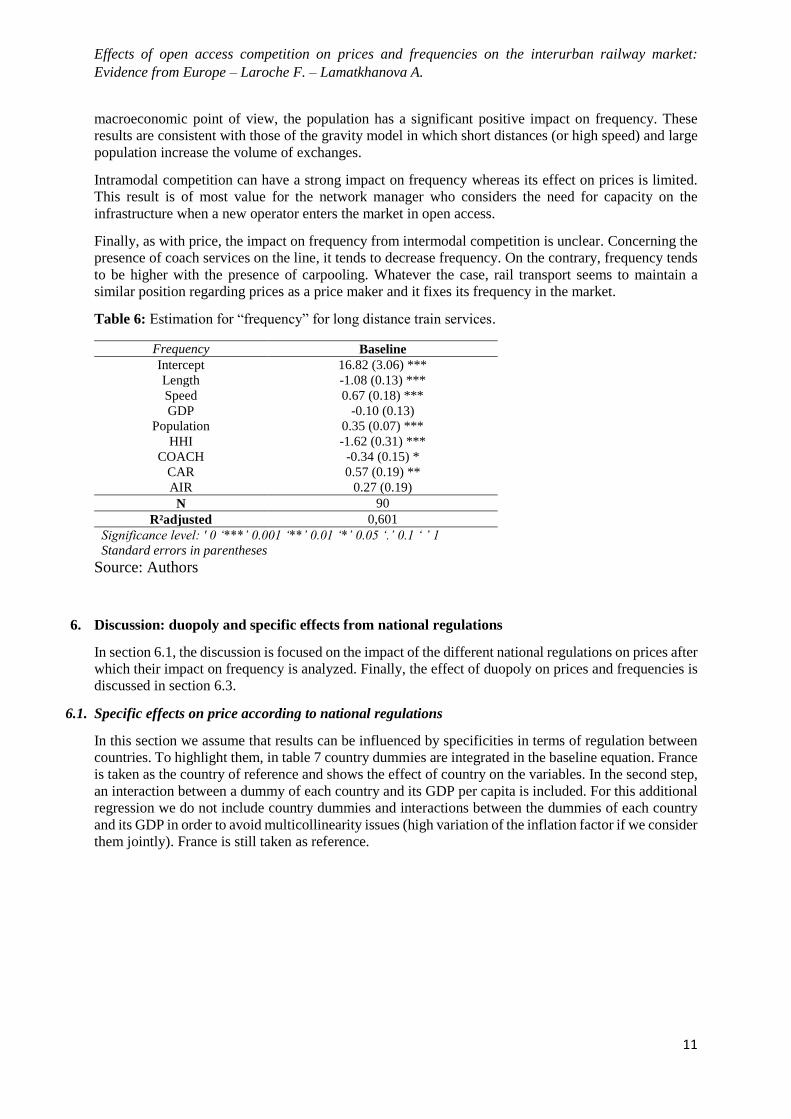
5.2. Effects on frequencies
Explanatory factors of frequency show that length and speed have a strong impact on it (table 6). As
expected, frequency increases with short distance and higher speed and vice versa. From a
Effects of open access competition on prices and frequencies on the interurban railway market:
Evidence from Europe – Laroche F. – Lamatkhanova A.
11
macroeconomic point of view, the population has a significant positive impact on frequency. These
results are consistent with those of the gravity model in which short distances (or high speed) and large
population increase the volume of exchanges.
Intramodal competition can have a strong impact on frequency whereas its effect on prices is limited.
This result is of most value for the network manager who considers the need for capacity on the
infrastructure when a new operator enters the market in open access.
Finally, as with price, the impact on frequency from intermodal competition is unclear. Concerning the
presence of coach services on the line, it tends to decrease frequency. On the contrary, frequency tends
to be higher with the presence of carpooling. Whatever the case, rail transport seems to maintain a
similar position regarding prices as a price maker and it fixes its frequency in the market.
Table 6: Estimation for “frequency” for long distance train services.
Frequency Baseline
Intercept 16.82 (3.06) ***
Length -1.08 (0.13) ***
Speed 0.67 (0.18) ***
GDP -0.10 (0.13)
Population 0.35 (0.07) ***
HHI -1.62 (0.31) ***
COACH -0.34 (0.15) *
CAR 0.57 (0.19) **
AIR 0.27 (0.19)
N 90
R²adjusted 0,601
Significance level: ' 0 ‘***’ 0.001 ‘**’ 0.01 ‘*’ 0.05 ‘.’ 0.1 ‘ ’ 1
Standard errors in parentheses
Source: Authors
6. Discussion: duopoly and specific effects from national regulations
In section 6.1, the discussion is focused on the impact of the different national regulations on prices after
which their impact on frequency is analyzed. Finally, the effect of duopoly on prices and frequencies is
discussed in section 6.3.
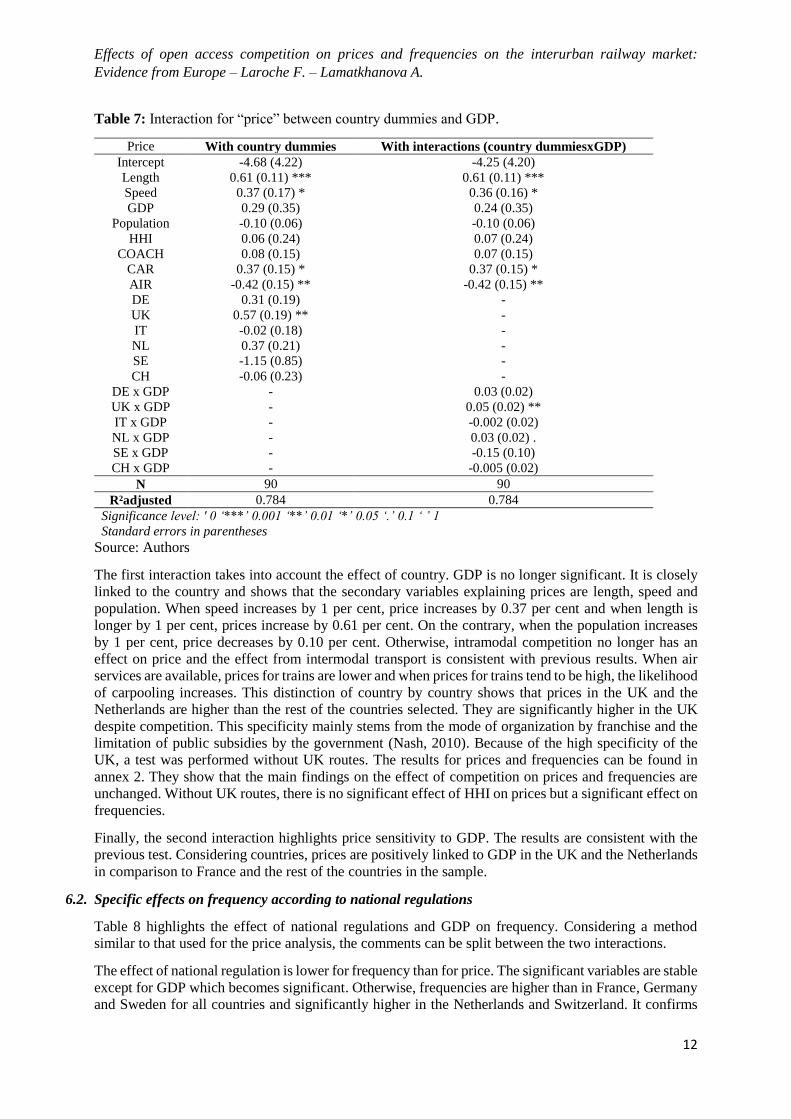
6.1. Specific effects on price according to national regulations
In this section we assume that results can be influenced by specificities in terms of regulation between
countries. To highlight them, in table 7 country dummies are integrated in the baseline equation. France
is taken as the country of reference and shows the effect of country on the variables. In the second step,
an interaction between a dummy of each country and its GDP per capita is included. For this additional
regression we do not include country dummies and interactions between the dummies of each country
and its GDP in order to avoid multicollinearity issues (high variation of the inflation factor if we consider
them jointly). France is still taken as reference.
Effects of open access competition on prices and frequencies on the interurban railway market:
Evidence from Europe – Laroche F. – Lamatkhanova A.
12
Table 7: Interaction for “price” between country dummies and GDP.
Source: Authors
The first interaction takes into account the effect of country. GDP is no longer significant. It is closely
linked to the country and shows that the secondary variables explaining prices are length, speed and
population. When speed increases by 1 per cent, price increases by 0.37 per cent and when length is
longer by 1 per cent, prices increase by 0.61 per cent. On the contrary, when the population increases
by 1 per cent, price decreases by 0.10 per cent. Otherwise, intramodal competition no longer has an
effect on price and the effect from intermodal transport is consistent with previous results. When air
services are available, prices for trains are lower and when prices for trains tend to be high, the likelihood
of carpooling increases. This distinction of country by country shows that prices in the UK and the
Netherlands are higher than the rest of the countries selected. They are significantly higher in the UK
despite competition. This specificity mainly stems from the mode of organization by franchise and the
limitation of public subsidies by the government (Nash, 2010). Because of the high specificity of the
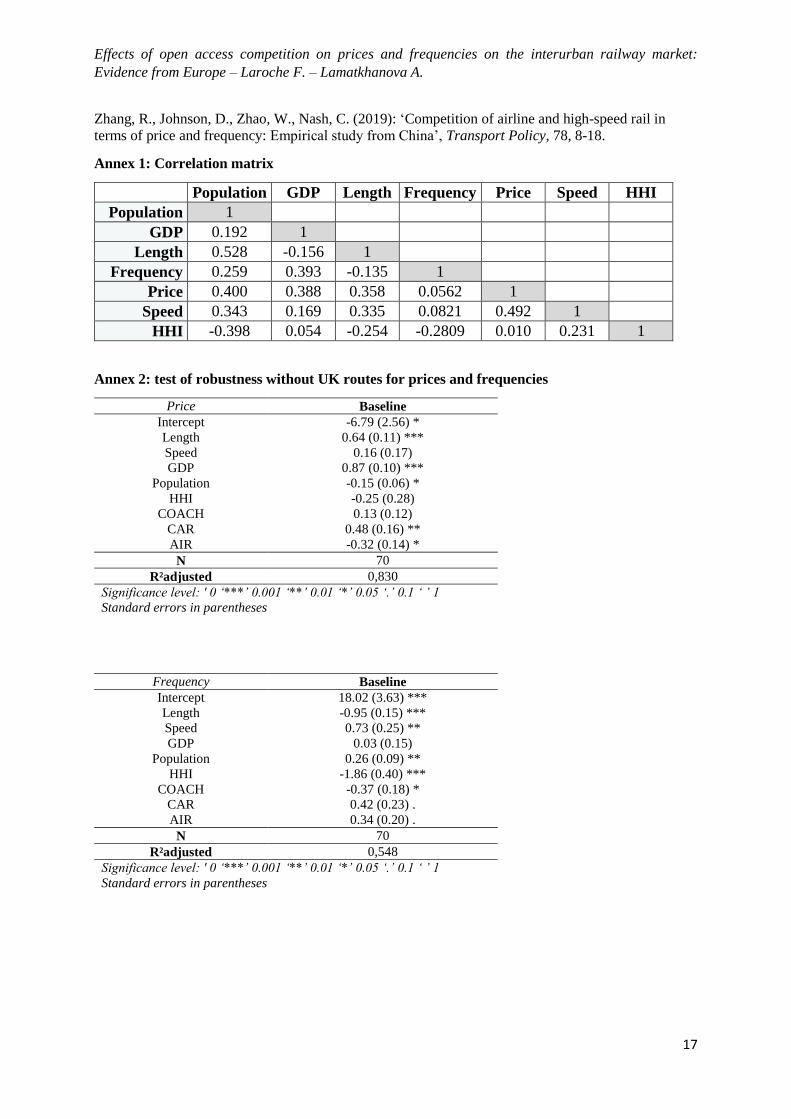
UK, a test was performed without UK routes. The results for prices and frequencies can be found in
annex 2. They show that the main findings on the effect of competition on prices and frequencies are
unchanged. Without UK routes, there is no significant effect of HHI on prices but a significant effect on
frequencies.
Finally, the second interaction highlights price sensitivity to GDP. The results are consistent with the
previous test. Considering countries, prices are positively linked to GDP in the UK and the Netherlands
in comparison to France and the rest of the countries in the sample.
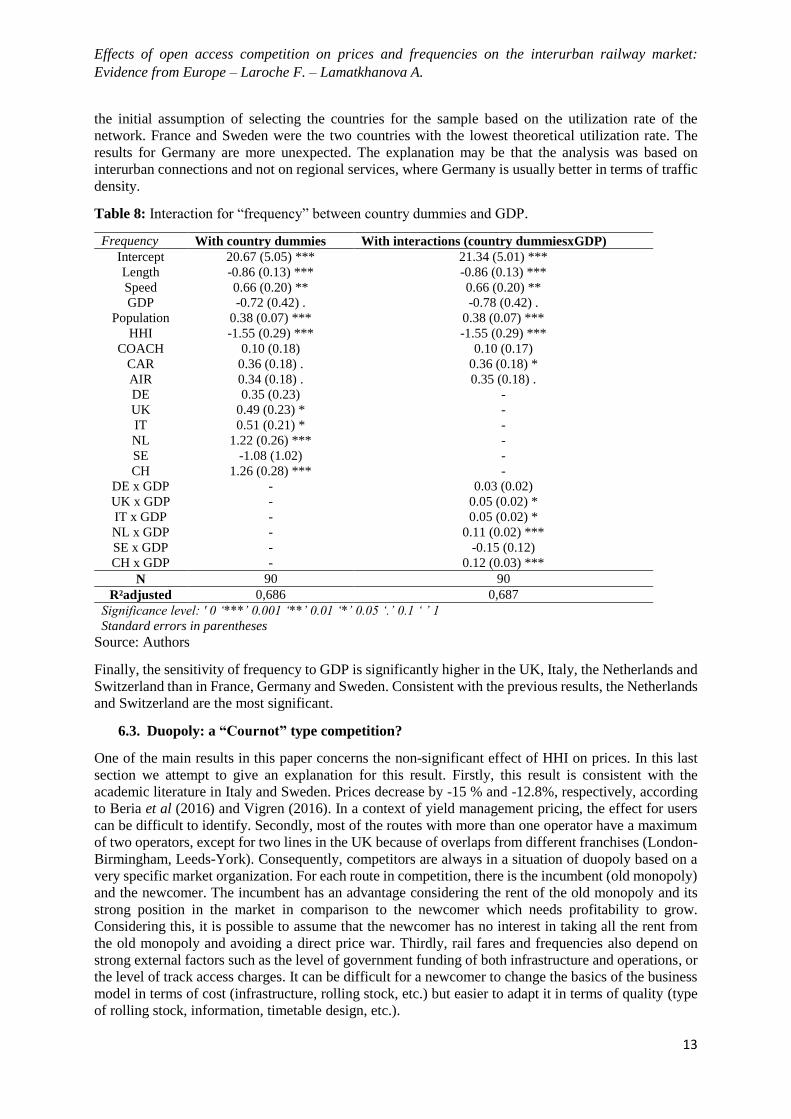
6.2. Specific effects on frequency according to national regulations
Table 8 highlights the effect of national regulations and GDP on frequency. Considering a method
similar to that used for the price analysis, the comments can be split between the two interactions.
The effect of national regulation is lower for frequency than for price. The significant variables are stable
except for GDP which becomes significant. Otherwise, frequencies are higher than in France, Germany
and Sweden for all countries and significantly higher in the Netherlands and Switzerland. It confirms
Price With country dummies With interactions (country dummiesxGDP)
Intercept -4.68 (4.22) -4.25 (4.20)
Length 0.61 (0.11) *** 0.61 (0.11) ***
Speed 0.37 (0.17) * 0.36 (0.16) *
GDP 0.29 (0.35) 0.24 (0.35)
Population -0.10 (0.06) -0.10 (0.06)
HHI 0.06 (0.24) 0.07 (0.24)
COACH 0.08 (0.15) 0.07 (0.15)
CAR 0.37 (0.15) * 0.37 (0.15) *
AIR -0.42 (0.15) ** -0.42 (0.15) **
DE 0.31 (0.19) -
UK 0.57 (0.19) ** -
IT -0.02 (0.18) -
NL 0.37 (0.21) -
SE -1.15 (0.85) -
CH -0.06 (0.23) -
DE x GDP - 0.03 (0.02)
UK x GDP - 0.05 (0.02) **
IT x GDP - -0.002 (0.02)
NL x GDP - 0.03 (0.02) .
SE x GDP - -0.15 (0.10)
CH x GDP - -0.005 (0.02)
N 90 90
R²adjusted 0.784 0.784
Significance level: ' 0 ‘***’ 0.001 ‘**’ 0.01 ‘*’ 0.05 ‘.’ 0.1 ‘ ’ 1
Standard errors in parentheses
Effects of open access competition on prices and frequencies on the interurban railway market:
Evidence from Europe – Laroche F. – Lamatkhanova A.
13
the initial assumption of selecting the countries for the sample based on the utilization rate of the
network. France and Sweden were the two countries with the lowest theoretical utilization rate. The
results for Germany are more unexpected. The explanation may be that the analysis was based on
interurban connections and not on regional services, where Germany is usually better in terms of traffic
density.
Table 8: Interaction for “frequency” between country dummies and GDP.
Frequency With country dummies With interactions (country dummiesxGDP)
Intercept 20.67 (5.05) *** 21.34 (5.01) ***
Length -0.86 (0.13) *** -0.86 (0.13) ***
Speed 0.66 (0.20) ** 0.66 (0.20) **
GDP -0.72 (0.42) . -0.78 (0.42) .
Population 0.38 (0.07) *** 0.38 (0.07) ***
HHI -1.55 (0.29) *** -1.55 (0.29) ***
COACH 0.10 (0.18) 0.10 (0.17)
CAR 0.36 (0.18) . 0.36 (0.18) *
AIR 0.34 (0.18) . 0.35 (0.18) .
DE 0.35 (0.23) -
UK 0.49 (0.23) * -
IT 0.51 (0.21) * -
NL 1.22 (0.26) *** -
SE -1.08 (1.02) -
CH 1.26 (0.28) *** -
DE x GDP - 0.03 (0.02)
UK x GDP - 0.05 (0.02) *
IT x GDP - 0.05 (0.02) *
NL x GDP - 0.11 (0.02) ***
SE x GDP - -0.15 (0.12)
CH x GDP - 0.12 (0.03) ***
N 90 90
R²adjusted 0,686 0,687
Significance level: ' 0 ‘***’ 0.001 ‘**’ 0.01 ‘*’ 0.05 ‘.’ 0.1 ‘ ’ 1
Standard errors in parentheses
Source: Authors
Finally, the sensitivity of frequency to GDP is significantly higher in the UK, Italy, the Netherlands and
Switzerland than in France, Germany and Sweden. Consistent with the previous results, the Netherlands
and Switzerland are the most significant.
6.3. Duopoly: a “Cournot” type competition?
One of the main results in this paper concerns the non-significant effect of HHI on prices. In this last
section we attempt to give an explanation for this result. Firstly, this result is consistent with the
academic literature in Italy and Sweden. Prices decrease by -15 % and -12.8%, respectively, according
to Beria et al (2016) and Vigren (2016). In a context of yield management pricing, the effect for users
can be difficult to identify. Secondly, most of the routes with more than one operator have a maximum
of two operators, except for two lines in the UK because of overlaps from different franchises (London-
Birmingham, Leeds-York). Consequently, competitors are always in a situation of duopoly based on a
very specific market organization. For each route in competition, there is the incumbent (old monopoly)
and the newcomer. The incumbent has an advantage considering the rent of the old monopoly and its
strong position in the market in comparison to the newcomer which needs profitability to grow.
Considering this, it is possible to assume that the newcomer has no interest in taking all the rent from
the old monopoly and avoiding a direct price war. Thirdly, rail fares and frequencies also depend on
strong external factors such as the level of government funding of both infrastructure and operations, or
the level of track access charges. It can be difficult for a newcomer to change the basics of the business
model in terms of cost (infrastructure, rolling stock, etc.) but easier to adapt it in terms of quality (type
of rolling stock, information, timetable design, etc.).

Effects of open access competition on prices and frequencies on the interurban railway market:
Evidence from Europe – Laroche F. – Lamatkhanova A.
14
Finally, cases of competition are still limited in Europe. Nevertheless, the results seem to show that
prices are not the only variable in competition (‘Bertrand’ competition), volume and quality (‘Cournot’
competition) can also be strategic variables in the rail passenger market where the incumbent has a
strong competitive advantage (dominant position) and the external factors (infrastructure and public
policy) have a strong influence on the business model of operators.
7. Conclusion:
This paper explored the effect of competition on prices and frequencies for the interurban rail market.
Considering the existing literature, the analysis is original since it extends its perimeter of study to seven
European countries and a total of 90 routes, whereas usual analyses consider specific routes or countries.
The method is based on an econometric analysis (Sureg) and cross-sectional regression, which is broadly
used for other modes (air, coach), but never before applied to the European rail market and its
specificities in terms of competition. For the long-distance market, competition in open access can be
formalized through the Herfindahl-Hirschman Index (HHI), usually used in industrial economics to
assess the level of concentration on a market and competition between firms.
The main findings highlighted a non-significant impact of intra-modal competition on prices but a
significant impact on frequencies. This may indicate that intramodal competition in open access is not
only based on price, but also on volume and quality due to a strong situation of oligopoly (duopoly).
Otherwise, the results for intermodal competition highlighted specificities according to the type of
services. Air services decrease prices for trains, assuming that air transport is substitutable to rail
transport. However, the probability of finding carpooling and coach services increases when train prices
are high. This leads to the assumption that these new alternatives are more complementary than
substitutable for a large portion of train customers (business). This may be explained by structural
differences between the markets in terms of travel time, capacity, comfort and users’ preferences. This
last point will be dealt with in greater depth in future research. Due to a lack of data, dummy variables
were used to assess intermodal competition in this study. Undoubtedly, this is not sufficient to provide
an accurate picture of the intensity of competition in the market.
Finally, the results raise interesting policy implications. Firstly, it is unlikely that a “big bang” will occur
in the market after liberalization. Less than 50 per cent of the routes potentially in competition have
more than one operator. Most of the time, competition is limited to the main routes and duopolies (no
more than 3 operators). Secondly, when intramodal competition exists, the effect on frequency is
significant. Each operator has to provide a minimal offer to be visible in spite of the risk of duplication.
Consequently, the daily number of trains increases and infrastructure managers are obliged to anticipate
an increase in traffic and adjust capacity on their main lines. Additionally, the public authorities should
plan the investments required for the entry of a newcomer.
References:
Adler, N., Pels, E., Nash, C. (2010): ‘High-speed rail and air transport competition: Game engineering
as tool for cost-benefit analysis’, Transportation Research Part B, 44, 812-833.
Alexandersson, G. (2009): ‘Rail privatization and competitive tendering in Europe’, Built
Environment, 35, 43-58.
Bataille, M., Steinmetz, A. (2013): ‘Intermodal competition on some routes in transportation
networks: the case of inter urban buses and railways’, Working papers, 19.
Bergantino, A.S., Capozza, C. (2015) : ‘One price for all? Price discrimination and market captivity:
Evidence from the Italian city-pair markets’, Transportation Research Part A, 75, 231-244.
Bergantino, A.S., Capozza, C., Capurso, M. (2015): ‘The impact of open access on intra- and inter-
modal rail competition. A national level analysis in Italy’, Working Paper SIET, 33.

Effects of open access competition on prices and frequencies on the interurban railway market:
Evidence from Europe – Laroche F. – Lamatkhanova A.
15
Beria, P., Quinet, E., de Rus, G., Schulz, C. (2012): ‘A comparison of rail liberalisation levels across
four European countries’, Research in Transportation Economics, 36, 110-120.
Beria, P., Redondi, R., Malighetti, P. (2016): ‘The effect of open access competition on average rail
prices. The case of Milan – Ancona’, Journal of Rail Transport Planning & Management, 6, 271-283.
Broman, E., Eliasson, J. (2016): ‘Market dynamics in on-rail competition’, Transportation Research
Procedia, 22, 232-244.
Carlsson, F. (2002): ‘Price and frequency choice under monopoly and competition in aviation
markets’, Working papers in Economics, 71, 18.
Cattaneo, M., Malighetti, P., Redondi, R., Salanti, A. (2018): ‘Changes in frequencies and price
variations on point-to-point routes: The case of EasyJet’, Transportation Research Part A, 112, 60-70.
Chakrabarty, D., Kutlu, L. (2014): ‘Competition and price dispersion in the airline markets’, Applied
Economics, 46, 3421-3436.
Cherbonnier, F., Ivaldi, M., Muller-Vibes, C., Van Der Straeten, K. (2018): ‘Competition For Versus
In the Market of Long-Distance Passenger Rail Services’, Working paper, 28.
Delhomme, P., Gheorghiu, A. (2016): ‘Comparing French carpoolers and non-carpoolers: Which
factors contribute the most to carpooling?’, Transportation Research Part D: Transport and
Environnement, 42, 1-15.
Desmaris, C., Croccolo, F. (2018): ‘The HSR competition in Italy: How are the regulatory design and
practices concerned?’, Research in Transportation Economics, 69, 290-299.
European Commission (ed.) (2011): Roadmap to a Single European Transport Area - Towards a
competitive and resource efficient transport system, White paper, Brussel.
European Commission (ed.) (2016): Study on the prices and quality of rail passenger services,
European Commission Directorate General for Mobility and Transport, Brussel.
Else, P.K., James, T.J. (1994): ‘Will the fare be fair? An examination of the pricing effects of the
privatization of rail services’, International Review of Applied Economics, 8, 291-302.
Fageda, X., Sansano, S. (2018): ‘Factors influencing prices and frequencies in the interurban bus
market: Evidence from Europe’, Transportation Research Part A, 111, 266-276.
Filippini, M., Koller, M., Masiero, G. (2015): ‘Competitive tendering versus performance-based
negotiation in Swiss public transport’, Transportation Research Part A, 82, 158-168.
Finger, M. (2014): ‘Governance of competition and performance in European railways: An analysis of
five cases’, Utilities Policy, 31, 278-288.
Finger, M., Kupfer, D., Montero-Pascual, J-J. (ed.) (2016): ‘Competition in the railway passenger
market’, European University Institute: research project report, Florence.
Fröidh, O., Byström, C. (2013): ‘Competition on the tracks – Passenger’s response to deregulation of
interregional rail services’. Transportation Research Part A, 56, 1-10.
Grimaldi, R., Augustin, K., Beria, P. (2017): ‘Intercity coach liberalization. The cases of Germany and
Italy’, Transportation Research Procedia, 25, 474-490.
IRG-Rail (ed.) (2017): ‘Fifth Annual Market Monitoring Report. Independent Regulator’s Group –
Rail’, Brussel.
Ivaldi, M., Vides, C. (2008): ‘Price Competition in the Intercity Passenger Transport Market: A
Simulation Model’, Journal of Transport Economics and Policy, 42, 225-254.

Effects of open access competition on prices and frequencies on the interurban railway market:
Evidence from Europe – Laroche F. – Lamatkhanova A.
16
Johnson, D., Nash, C. (2012): ‘Competition and the provision of rail passenger services: A simulation
exercise’, Journal of Rail Transport Planning & Management, 2, 14-22.
Knorr, A., Lueg-Arndt, A. (2016): ‘Intercity bus deregulation in Germany – Intramodal and
intermodal effects after two years’, Research in Transportation Economics, 59, 1-7.
Lalive, R., Schmutzler, A. (2008): ‘Exploring the effects of competition for railway markets’,
International Journal of Industrial Organization, 26, 443-458.
Lang, M., Laperrouza, M., Finger M. (2013): ‘Competition effects in a liberalized railway market’,
Journal of Industry Competition and Trade, 13, 375-398.
Laroche, F., Sys, C., Vanelslander, T., Van de Voorde, E. (2017): ‘Imperfect competition in a network
industry: The case of the European rail freight market’, Transport Policy, 58. 53-61.
Lipczynski, J., Wilson, J., Goddard, J. (ed.) (2013): ‘Industrial organization: competition, strategy and
policy’, Pearson, 4th edition.
Nash, C.A, Preston, P.M. (1992): ‘Barriers to entry in the railway industry’, Working paper, 354. 16.
Nash, C. (2010): ‘European rail reform and passenger services – the next steps’, Research in
Transportation Economics, 29, 204-211.
Nash, C., Crozet, Y., Link, H., Nilsson, J-E., Smith, A. (ed.) (2016): ‘Liberalisation of passenger rail
services’, Centre of Regulation in Europe, Project report, Brussel.
Nilsson, J-E., Pyddoke, R., Hulten, S., Alexandersson, G. (2013): ‘The liberalization of railway
passenger transport in Sweden’, Journal of Transport Economics and Policy, 47, 307-312.
Perennes, P. (2017): ‘Open access for rail passenger services in Europe: lesson learnt from forerunner
countries’, Transportation Research Procedia, 25, 358-367.
Preston, J., Whelan, G., Wardman, M. (1999): ‘An analysis of the potential for on-track competition in
the British passenger rail industry’, Journal of Transport Economics and Policy, 33, 77-94.
Savignat, M.G., Nash, C. (1999): ‘The case for rail reform in Europe-evidence from studies of
production: Characteristics of the rail industry’, International Journal of Transport Economics, 26,
201-217.
Séguret, S. (2009): ‘Is competition on track a real alternative to Competitive tendering in the railway
industry? Evidence from Germany’, 11th conference on competition and ownership in land Passenger
transport, Deflt, 20-25 september 2009.
Shah, N., Brueckner, J.K. (2012): ‘Price and frequency competition in freight transportation’,
Transportation Research Part A, 46, 938-953.
Smith, A., Wheat, P. (2012): ‘Evaluating Alternative Policy Responses to Franchise Failure: Evidence
from the Passenger Rail Sector in Britain’, Journal of Transport Economics and Policy, 46, 25-49.
Temple, S. (2015): ‘Open access long distance passenger rail services in the United Kingdom: The
grand central experience’, Transportation Research Procedia, 8, 114-124.
Tomes, Z., Kvizda, M., Jandova, M., Rederer, V. (2016): ‘Open access passenger rail competition in
the Czech Republic’, Transport Policy, 47, 203-211.
Vigren, A. (2016): ‘Competition in Swedish passenger railway: entry in an open-access market’, CTS
Working Paper 2016:18, 37.
White, P., Robbins, D. (2012): ‘Long-term development of express coach services in Britain’,
Research in Transportation Economics, 36, 30-38.
Effects of open access competition on prices and frequencies on the interurban railway market:
Evidence from Europe – Laroche F. – Lamatkhanova A.
17
Zhang, R., Johnson, D., Zhao, W., Nash, C. (2019): ‘Competition of airline and high-speed rail in
terms of price and frequency: Empirical study from China’, Transport Policy, 78, 8-18.
Annex 1: Correlation matrix
Population GDP Length Frequency Price Speed HHI
Population 1
GDP 0.192 1
Length 0.528 -0.156 1
Frequency 0.259 0.393 -0.135 1
Price 0.400 0.388 0.358 0.0562 1
Speed 0.343 0.169 0.335 0.0821 0.492 1
HHI -0.398 0.054 -0.254 -0.2809 0.010 0.231 1
Annex 2: test of robustness without UK routes for prices and frequencies
Price Baseline
Intercept -6.79 (2.56) *
Length 0.64 (0.11) ***
Speed 0.16 (0.17)
GDP 0.87 (0.10) ***
Population -0.15 (0.06) *
HHI -0.25 (0.28)
COACH 0.13 (0.12)
CAR 0.48 (0.16) **
AIR -0.32 (0.14) *
N 70
R²adjusted 0,830
Significance level: ' 0 ‘***’ 0.001 ‘**’ 0.01 ‘*’ 0.05 ‘.’ 0.1 ‘ ’ 1
Standard errors in parentheses
Frequency Baseline
Intercept 18.02 (3.63) ***
Length -0.95 (0.15) ***
Speed 0.73 (0.25) **
GDP 0.03 (0.15)
Population 0.26 (0.09) **
HHI -1.86 (0.40) ***
COACH -0.37 (0.18) *
CAR 0.42 (0.23) .
AIR 0.34 (0.20) .
N 70
R²adjusted 0,548
Significance level: ' 0 ‘***’ 0.001 ‘**’ 0.01 ‘*’ 0.05 ‘.’ 0.1 ‘ ’ 1
Standard errors in parentheses