effects of online shopping on vehicular traffic
TRANSCRIPT

Mineta Transportation InstituteSan Jos é State University
San Jose, CA 95192-0219
Norman Y. MinetaInternational Institute forSurface Transportation Policy StudiesCreated by Congress in 1991
MTI Report 01-20
EFFECTS OF ONLINE SHOPPING ONVEHICULAR TRAFFIC

a publication of the
Mineta Transportation InstituteCollege of Business
San José State UniversitySan Jose, CA 95192-0219
Created by Congress in 1991
MTI Report 01-20
EFFECTS OF ONLINE SHOPPING ONVEHICULAR TRAFFIC
October 2001
J. GiglieranoMalu Roldan

1. Report No.
4. Title and Subtitle
7. Authors
9. Performing Organization Name and Address
15. Supplementary Notes
12. Sponsoring Agency Name and Address
16. Abstract
17. Key Words
19. Security Classif. (of this report) 20. Security Classif. (of this page) 21. No. of Pages 22. Price
18. Distribution Statement
14. Sponsoring Agency Code
13. Type of Report and Period Covered
11. Contract or Grant No.
10. Work Unit No.
8. Performing Organization Report No.
6. Performing Organization Code
5. Report Date
3. Recipient’s Catalog No.2. Government Accession No.
Mineta Transportation InstituteCollege of Business—BT500San José State UniversitySan Jose, CA 95129-0219
California Department of TransportationSacramento, CA 95819
U.S. Department of TransportationResearch and Special Programs Administration400 7th Street, SWWashington, DC 20590-0001
No restrictions. This document is available to the public
through the National Technical Information Service,Springfield, VA 22161
Unclassified Unclassified
Final Report
Technical Report Documentation Page
Form DOT F 1700.7 (8-72)
FHWA/CA/OR-2001/35
Effects of Online Shopping on Vehicular Traffic
J. Giglierano; Malu Roldan
This research project was financially sponsored by the U.S Department of Transportation's Researchand Special Programs Administration and by the California Department of Transportation (Caltrans).
The purpose of this research was to assess and project the effects of online shopping on vehiculartraffic. It was anticipated that as more people purchased goods and services online. short-distancetraffic would be reduced.
The method of study was personal interviews following a literature review of this subject. Effortswere focused on consumers’ shopping behaviors and the resulting effects on short-distance traffic.Survey data were combined with forecasts of online shopping volume from eMarketer, and estimatesof total trip savings were made for the years 2000 and 2004.
The results were not encouraging. We estimated that online shopping reduced total short-distancevehicle traffic by only 0.31 percent in 2000, and in 2004, the reduction in short-distance vehicle trafficwill be about 0.93%.
The implications are that online shopping cannot be counted on for significant reduction in vehiculartraffic in the short to immediate term. However, this conclusion will change if technologydevelopment moves ahead to the point of making online shopping more attractive for the majority ofshoppers.
Purchasing; traffic forecasting; tripdistribution; trip estimation.
October 2001
01-20
65W136
75 $15.00

To order this publication, please contact the following:
Mineta Transportation Institute
College of Business BT-550
San José State University
San Jose, CA 95192-0219
Tel (408) 924-7560
Fax (408) 924-7565
E-mail: [email protected]
http://transweb.sjsu.edu
Copyright © 2001 by MTI
All rights reserved
Library of Congress Catalog Card Number:2001095387

ACKNOWLEDGMENTS
The MTI Project Team consisted of Joe Giglierano, Principal Investigator, and Malu Roldan.Student assistants Olga Bokhonovskaya and Mike Hathaway contributed greatly to this project.Kate Kalygina also contributed assistance in data analysis.
The Project Team wishes to thank our students who tested our questionnaires and conductedinterviews with online shoppers as part of class assignments.
We would also like to thank MTI staff, including Research Director Trixie Johnson, PublicationsAssistant Sonya Cardenas, Graphic Designers Shun Nelson and Cedric Howard, Editor IreneRush, and Editorial Associate Catherine Frazier for editing and publishing assistance.
Effects of Online Shopping on Vehicular Traffic
Mineta Transportation Institute
i
TABLE OF CONTENTS
EXECUTIVE SUMMARY . . . . . . . . . . . . . . . . . . . . . . . . . . 1
INTRODUCTION . . . . . . . . . . . . . . . . . . . . . . . . . . . . . . . . . 3
METHODOLOGY . . . . . . . . . . . . . . . . . . . . . . . . . . . . . . . . 5CONCEPTUAL DEVELOPMENT OF THE PROJECTIONS . . . . . 6EXPLORATORY RESEARCH . . . . . . . . . . . . . . . . . . . . . . . . . . . . . 8USE OF ONLINE SURVEY TECHNIQUE . . . . . . . . . . . . . . . . . . . . 9
First Survey Questionnaire . . . . . . . . . . . . . . . . . . . . . . . . . . . . . 11Lessons from the First Survey Leading to the Second Survey . . 12Survey 2 . . . . . . . . . . . . . . . . . . . . . . . . . . . . . . . . . . . . . . . . . . . . 13
CALCULATING TRIP SAVINGS FOR 2000 . . . . . . . . . . . . . . . . . 13TRIP SAVINGS IN 2004 . . . . . . . . . . . . . . . . . . . . . . . . . . . . . . . . . 14
RESULTS . . . . . . . . . . . . . . . . . . . . . . . . . . . . . . . . . . . . . . . 17TRIP SAVINGS IN 2000 . . . . . . . . . . . . . . . . . . . . . . . . . . . . . . . . . 17
Single-Product Purchases and Trip Savings in 2000 . . . . . . . . . . 17Combination Purchases and Trip Savings in 2000 . . . . . . . . . . . 18Trips Saved from Offline Purchases, 2000 . . . . . . . . . . . . . . . . . 19Trip Savings from Online Shopping Resulting in
No Purchases, 2000 . . . . . . . . . . . . . . . . . . . . . . . . . . . . . . . . 20Total Trip Savings from Online Shopping, 2000 . . . . . . . . . . . . 21
ESTIMATES FOR 2004 . . . . . . . . . . . . . . . . . . . . . . . . . . . . . . . . . . 22
DISCUSSION, CONCLUSIONS, AND IMPLICATIONS 27
BIBLIOGRAPHY . . . . . . . . . . . . . . . . . . . . . . . . . . . . . . . . 31
PRE-PUBLICATION PEER REVIEW . . . . . . . . . . . . . . . 33
ABOUT THE AUTHORS . . . . . . . . . . . . . . . . . . . . . . . . . . 35
ACRONYMS AND ABBREVIATIONS . . . . . . . . . . . . . . 37
Effects of Online Shopping on Vehicular Traffic
Mineta Transportation Institute
ii
A. EXPLORATORY QUESTIONSOnline Shopping Experiences . . . . . . . . . . . . . . . . . . . . . . . . . . A-1Shopping Behavior . . . . . . . . . . . . . . . . . . . . . . . . . . . . . . . . . . A-2Projections . . . . . . . . . . . . . . . . . . . . . . . . . . . . . . . . . . . . . . . . . A-2
B. FIRST ONLINE SURVEY AND RATIONALERationale . . . . . . . . . . . . . . . . . . . . . . . . . . . . . . . . . . . . . . . . . . B-6
C. SURVEY 2 AND RATIONALERationale . . . . . . . . . . . . . . . . . . . . . . . . . . . . . . . . . . . . . . . . . . C-5
D. FREQUENCIES AND MEANS FOR SURVEYS
E. THE MODEL FOR PROJECTING TRIP SAVINGSCalculation of 2000 Trip Savings . . . . . . . . . . . . . . . . . . . . . . . E-1Calculation of the Number of Transactions Made
Online in 2000 . . . . . . . . . . . . . . . . . . . . . . . . . . . . . . . . . . . E-4Calculation for Trip Savings from Online Shopping Resulting
in Offline Purchases or in No Purchases . . . . . . . . . . . . . . . E-5Calculation for Trip Savings from Online Shopping,
Projected to 2004 . . . . . . . . . . . . . . . . . . . . . . . . . . . . . . . . . E-7

Executive Summary
Mineta Transportation Institute
1
EXECUTIVE SUMMARY
The purpose of this research was to assess and project the effects of onlineshopping on vehicular traffic. As more people purchased more goods andservices online, we anticipated that short-distance traffic would be reduced.Working against this trend would be the increase in traffic accruing to short-distance delivery of products purchased online. However, the result should be anet reduction in traffic as short-distance shopping is replaced with moreefficient short-distance shipping. Another expected effect was the reduction inneed for parking at shopping centers, which might eventually have land useimplications.
This study began with a series of personal interviews, after we discovered ascarcity of prior research on this topic. We quickly discovered that parkingconcerns and short-distance shipping concerns had not been impacted visiblyyet. The booming economy in early 2000 had washed out any effects we mighthave observed otherwise.
Accordingly, we focused our efforts on consumers’ shopping behavior and theresulting effects on short-distance traffic.
After learning more about the context of online shopping from our interviews,we created a questionnaire and tested it with business students. We ran therevised questionnaire and a second improved questionnaire onInsightExpress’s online research service. We used the online research servicebecause it offered numerous advantages over the mall intercept method we hadoriginally intended to use. Most important, it offered an efficient means ofaccessing our target respondents—online shoppers.
We combined the survey data with forecasts of online shopping volume fromeMarketer, a firm specializing in market research on Internet-related industries.The survey data gave us estimates of trip savings for shopping activity;eMarketer gave us estimates of the volume of shopping activity. We thencalculated estimates of total trip savings for 2000 and 2004.
Trip savings in 2004 were projected based on assumptions concerning a shift inthe distribution of shoppers from early adopters to a balance between earlyadopters and later adopters.

Executive Summary
Mineta Transportation Institute
2
Data from the U.S. Department of Transportation Federal HighwayAdministration (US DOT FHWA) provided the basis for projecting short-distance vehicular traffic for 2000 and 2004. We were then able to compare ourestimates of trip savings with these projections of total vehicle traffic.
The results were not encouraging. We estimated that online shopping reducedtotal short-distance vehicle traffic by only about 0.31 percent in 2000. In 2004,we project the reduction in short-distance traffic will be about 0.93 percent.
We increased the estimates for trip savings per transaction by about twostandard deviations. Even using these extreme estimates, we could only projectabout a 2.7 percent reduction in short-distance traffic in 2004.
The implications are that online shopping will not reduce vehicular trafficgreatly in the short to intermediate term. This conclusion would change iftechnology development moved ahead to the point of making online shoppingmuch more attractive for the majority of shoppers.

Introduction
Mineta Transportation Institute
3
INTRODUCTION
Transportation and environmental policy makers have questioned whether theonset of online shopping will have an effect on transportation congestion andrelated systems, such as air pollution and land use. The hope is that onlineshopping will result in fewer trips being made, thus contributing to relief ofcongestion, reduction in air pollution, and fewer demands for retail andparking space. While online shopping is still in its infancy, the rapid increase inWeb shopping suggested that the real impact might be felt in the near future.
With this as background, the current study was launched to attempt to assessthe current and future impact of online shopping on transportation patterns.The study relied on consumers’ self-reports of behavior changes. While this isnot the most reliable way to assess behavior changes, it enables changes to belinked to reports of consumer motives and consumers’ procilivities to adoptinnovations. This kind of research thus enhances insight into the adoptionprocess, so that future trends in behavior changes can be better anticipated.Without such insights, quantitative modeling efforts (such as using the Bassmodel or others) would need to rely on few data points and would makeforecasts with limited confidence.
The findings we present in this report suggest that the current effects of onlineshopping are minimal. Over the next few years, the impacts are likely toremain “under the radar” until a critical mass of trip savings is achieved.Further, as more online shopping occurs, the effects on trip savings arediminished — trip savings per dollar spent appear to decrease as morepurchases are combined in each “shopping event.” As online shopping isadopted more readily, more shopping events will constitute multiple purchaseevents. Another disappointing result is the apparent lack of impact on peakcongestion periods. It appears that weekend traffic is reduced more thanweekday peak commute traffic.
Accordingly, the policy implications of these findings would appear to have anegative hue. For the near and middle term, more impacts can be expectedfrom other electronic activities. Telecommuting comes to mind as the Web-related activity with the highest likelihood of reducing commute-time trafficcongestion.

Introduction
Mineta Transportation Institute
4

Methodology
Mineta Transportation Institute
5
METHODOLOGY
We began this research with three guiding elements in mind. First was theoverall purpose of the research—to investigate the effects of online shoppingon transportation and traffic. One key goal of this research was to project orforecast any savings in physical trips resulting from online shopping.
The second guiding element was our rudimentary expectation of the findingsthat would result from our research efforts. We realized that our expectationswere based on little more than our own experiences with online shopping.Accordingly, we started with a set of working hypotheses, which we laid out inthe original proposal for this research. These working hypotheses wereexpressed as a set of findings expected as online shopping is adopted:
1. A decrease in peak-time shopping trips
2. A decrease in the number of shopping trips
3. A decrease in the duration of shopping trips
4. An increase in traffic congestion stemming from increased delivery ofonline product orders.
We recognized that our working hypotheses were naïve and that we knew littleabout how online shopping translated into changes in physical shoppingbehavior. We also suspected, as was quickly borne out, that other investigatorshad done little relevant research. Given a lack of theory and data to build upon,we expected that we would need to begin our research with an exploratorycomponent. The method of assessing transportation impacts and projecting theeffects would be designed as the research progressed.
Our third guiding element was that we needed to obtain data directly fromindividuals if we were to understand relationships and make reasonableprojections. Therefore, we anticipated interviewing shoppers and using somekind of questionnaire to obtain usable data.
As the interview portion of the research unfolded, we learned that the changesin shopping trip duration would be difficult to separate from other trends. Also,changes in traffic congestion from product delivery increases were negligible,as we learned in discussions with a UPS executive. Accordingly, weconcentrated on the first two working hypotheses, refining our focus to

Methodology
Mineta Transportation Institute
6
projecting the effect of online shopping on the number of physical shoppingtrips and on peak-time demand.
In our proposal, we had stated that hypotheses for seasonal traffic changes andmodal usage shifts would be developed during the exploratory phase of theresearch. As our interviews progressed, we saw that the largest seasonal effectswould be differences between the holiday season and the rest of the year.Modal shifts were beyond the insight of the research team at the time theproject began, but we expected to make appropriate hypotheses during theexploratory phase. As we learned later, it is too early in the adoption of onlineshopping to be able to tease out modal shifts or seasonal traffic changes. Thetiming of the data collection also made it difficult to anticipate changes inphysical shopping at holiday time, because the data were collected in May andSeptember. This was too late for those interviewed to remember accuratelywhat they had done in November and December of 1999 and too early toanticipate actual behavior for the holiday season of 2000.
As a result of these factors, the research focused on determining how onlineshopping affects the number of physical trips shoppers take to retail outlets andthe timing of those trips.
CONCEPTUAL DEVELOPMENT OF THE PROJECTIONS
We did not find any prior research or theoretical articles that concerned theconversion of online shopping activity into changes in physical shopping.Therefore, we were left with the need to perform exploratory research.
The key concept that helped us formulate our thinking on how to projectshopping behavior into the future was the idea of segmentation in the diffusionof innovations. Rogers has found that first-time adoption of an innovationdiffers in timing and circumstances for different types of users.1 Adopters fallinto five categories or segments: innovators, early adopters, early majority, latemajority, and laggards. The number of adopters is distributed roughly normallyaround the mean time to first adoption (see Figure 1). Innovators are roughlythree standard deviations from the mean; at two standard deviations, the earlyadopters category starts; the early majority begins at one standard deviationfrom the mean and accounts for roughly a third of new adopters; the latemajority begins at the mean and extends one standard deviation behind themean, accounting for another third of adopters; laggards begin one standard
1 Rogers, Everett M. Diffusion of Innovations, 4th ed., New York: Free Press, 1995.

Methodology
Mineta Transportation Institute
7
deviation past the mean and account for all other adopters, about one sixth ofthe number of adopters.
Figure 1. Types of New Adopters
Geoffrey Moore has observed this same distribution for adopters of high-technology new products and has developed extensive managerial implicationsbased on the distribution.2 Although Rogers and Moore differ on someelements of the characteristics of the adopter groups, the differences are notimportant for this research.
This concept of different segments of adopters, adopting at different times, canbe used in projecting future trip savings. Rogers argues that the personalcharacteristics of adopter groups make their behavior largely consistent: If agroup acts as innovators for one type of new product they will tend to beinnovators for other products; if they are late majority adopters for oneproduct, they are likely to be late majority adopters for other products; and soon. In this research, we asked respondents to characterize their own adoptiontendencies and, in effect, categorize themselves. We then were able to changethe weight given to each adoption group to reflect Rogers’ ideal distribution ofadopter categories. Instead of equal weighting of respondents’ answers, the
2 Moore, Geoffrey. Crossing the Chasm, New York: HarperCollins, 1991; Inside the Tornado,New York: HarperCollins, 1995; Living on the Fault Line, New York: HarperCollins, 2000.
EarlyMajority
LateMajority
Laggards
NewAdopters
Time
Innovators EarlyAdopters

Methodology
Mineta Transportation Institute
8
shopping behavior and trip-saving characteristics would be weighted by theiradopter category membership, to be included in the calculation of the 2004projections. The mechanics for accomplishing this are described fully inAppendix E, “The Model for Projecting Trip Savings.”
EXPLORATORY RESEARCH
The first phase in performing the research was to obtain a deeperunderstanding of how online shopping translated into changes in travelbehavior. We did this through a short series of exploratory interviews. Theapproach taken was consistent with a grounded theory approach. It was notimportant to obtain a great number of interviews; we only needed enough toget a sense of context, language, and likely relationships. We prepared a shortseries of open-ended questions focusing on the respondent’s most recent onlineshopping experience. The questions are shown in Appendix A. These questionswere a guideline for questioning; the interviewer asked add-on questions asappropriate. The idea was to let the respondent talk about his or her experiencein online shopping and then talk about how he or she would have shopped forthe same products or services offline. These qualitative data then wouldbecome the basis for designing a survey to address our working hypothesesand the forecasting issues we faced. The questions dealt with the followingtopics:
• The shopping process
• Motivations for shopping online
• The number of trips taken, why, and when
• The number of trips saved and when they would have occurred, if taken
• Factors that would likely affect shopping behavior, such as type ofproducts, price range, importance, familiarity with the products andmerchants
• Satisfaction with the experience and the likelihood of shopping online inthe future.
Sixteen people were interviewed over four weeks. At first we recorded theinterviews, but this was cumbersome; taking notes was found to suffice for ourpurposes. Over the exploratory period, we met several times to discuss ourinterviews. We refined some lines of questioning, but found that the originalscript was workable.

Methodology
Mineta Transportation Institute
9
At the end of April 2000, we summarized the relationships and factors weexpected to be relevant. These were:
• The type of product has an effect on the travel saved by online shopping.
• The range of shopping trip combinations was vast—people often shoppedfor multiple items online. Of course, people often combine shopping tripsoffline, as well.
• Peoples’ experience with a product category can influence the number oftrips saved. However, sometimes this will actually be negative savings—shopping online will induce more trips than would have been takenotherwise.
• Key reasons for shopping online were convenience, time savings,selection, prices, and access to retailers and products that otherwise wouldnot be accessible. The respondent could calculate trip savings fairly easilywhen time savings, convenience, and price comparisons were keymotivators. Trips savings were less easily calculated when the Web offeredaccess to products or retailers that a consumer normally could not find.
• Physical trips often were thought to be required when shopping for itemsthat the consumer felt needed inspection or trial. Online shopping couldreduce these trips, but not eliminate them.
• The number of trips saved also was affected by whether the consumer wasshopping for a single item (or type of item, if was to be bought in quantity)or for several types of items.
Other factors that might affect trip savings included demographic differences,prices of the products sought, and familiarity with products or brands sought.
The initial questionnaire and succeeding versions of it were tested with threeclasses of business students at San José State University. The tests involvedstudents filling out the questionnaires and making comments as to whether itwas readable and understandable. Based on these comments, we furtherrefined the questionnaire.
USE OF ONLINE SURVEY TECHNIQUE
The original proposal for this research called for respondents to be recruitedfrom stores in shopping malls. While the exploratory research was being donein early 2000, an Internet phenomenon emerged: Research companies beganoffering do-it-yourself online questionnaire research. We investigated two
Methodology
Mineta Transportation Institute
10
providers of online surveys, InsightExpresss (www.insightexpress.com) andZoomerang (www.zoomerang.com). QuickTake.com also was evaluated, butleft the market before we were ready to choose a vendor. (They reentered themarket in 2001.)
We evaluated the cost and capability of each and chose to use InsightExpress.Zoomerang’s sampling process and cost were not communicated clearly, butInsightExpress’s cost was understandable and reasonable. Also, InsightExpressoffered direct access to respondents who were prequalified as online shoppers.
We needed to adapt the questionnaire to InsightExpress’s online format. Wesubmitted the questionnaire and InsightExpress staff examined it, madesuggestions, and approved a revised version for posting.
Use of the online survey was judged to have numerous advantages withacceptable methodological shortcomings. The principal negative aspect of theonline questionnaire approach was the choice of a sample. InsightExpressrecruits respondents through banner advertisements placed on Web sites withvisitors known to fit the sample frame. The banner ad asked for onlineshoppers willing to give an opinion. Of those who clicked on the ad, about halfcompleted the questionnaire.
The concern is whether this is a random sample. We believed the threat torandom selection was similar to that posed by other methods of respondentrecruitment. In all survey methods, there is a stage at which the potentialrespondent makes a choice of whether or not to respond. The difference is thatrespondents who have opted into a research panel may be systematicallydifferent in some way from those who decide to answer a questionnaire on aone-time basis. As long as the opt-in method casts a wide net and as long as apenchant for answering questionnaires does not skew results, there should beno difference in the survey outcome. In this case, respondents in our qualitativeinterviews reported trip savings very close to the average number of tripsreported saved by survey respondents. Therefore, we believed that any biasthat existed was likely to have minimal effect.
The advantages of using online surveying were numerous. The cost differenceallowed us to collect data from 600 respondents instead of 100 to 200. Thesampling process used by InsightExpress ensured that we received responsesfrom people who were within our sample frame and that these respondentswere recruited efficiently. Collecting data through mall or store interceptinterviews, as we originally proposed, would have been less efficient in that we

Methodology
Mineta Transportation Institute
11
would have had to approach many potential respondents who had not donemuch online shopping.
The online survey also provided data quickly, accurately, and in usable form.We had no expense or time taken for entering data or checking to ensure thatdata were entered accurately. We were able to analyze the data relativelyquickly and revise the questionnaire in time to launch another survey.
The advantages of cost and timeliness seemed to outweigh the drawbacks. Thenegative effects appear to be minimized, given the situation. Since we neededto represent the population of online shoppers, reaching them via the Internetwas not only appropriate but also more efficient than trying to reach themthrough store intercept interviews. The method by which the respondents wereobtained created a sample of people who have opted in to the process. Mallintercepts would have obtained a sample that in itself was opt-in as well, so itwas judged that little was lost in the selection process.
Once the data were obtained from the surveys, two classes of marketingundergraduate students interviewed respondents of their own choosing in orderto validate the results from the online surveys. The data they obtained wereconsistent with the data we received from the surveys. The students alsoobtained data on when during the week respondents thought trips were savedthrough online shopping.
First Survey Questionnaire
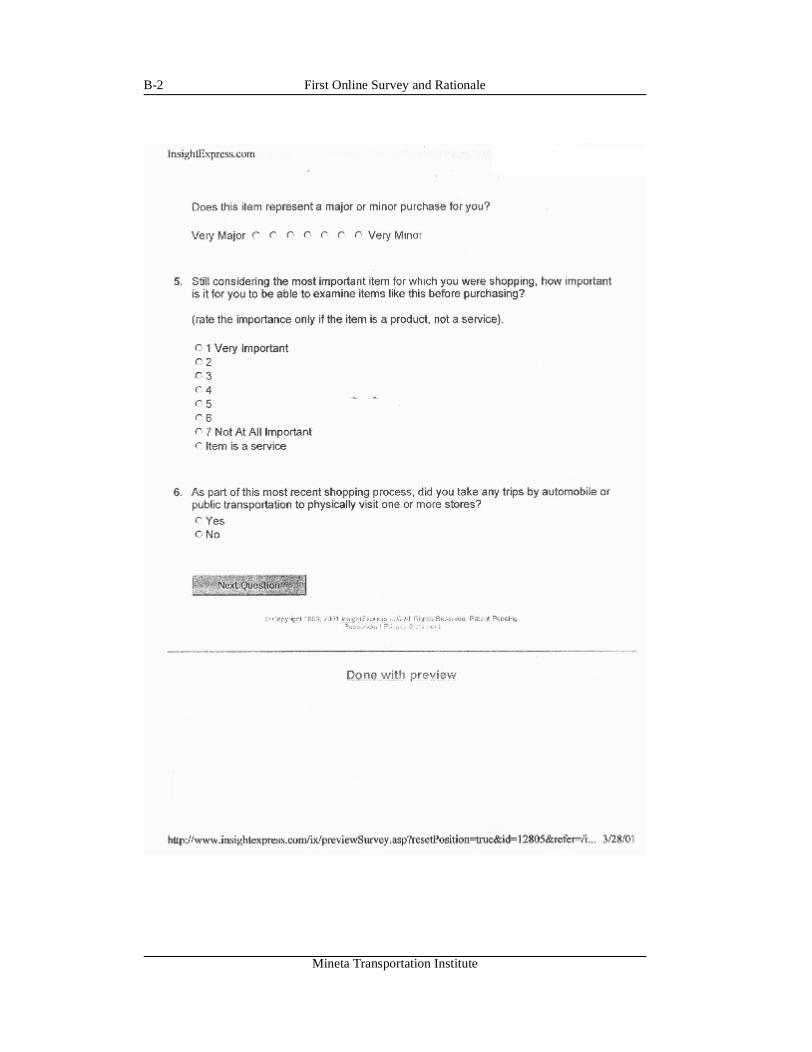
The first survey, shown in Appendix B, was intended to assess trip savingsassociated with any kind of online shopping activity, whether it led to an onlinepurchase, offline purchase, combination purchase, or no purchase. It asked therespondent to recall his or her most recent shopping experience in which someshopping was done online. We chose this as our shopping event of interestbecause interviews indicated this was the event that people could best recalland because it included all kinds of online shopping.
InsightExpress administered the first survey on July 7 and 8, 2000. Datacollection ceased as soon as the contracted number of completed surveys wasreceived. Of the 548 persons who responded to the banner ads by clickingthrough to the Web page for the survey, 301 responses were received—anominal response rate of 54.9 percent. The data were delivered to us in anExcel file. We examined the data and removed the obvious outliers—respondents who said that they had saved more than 15 trips in their latest
Methodology
Mineta Transportation Institute
12
online shopping experience. This was an arbitrary cutoff point, made becausethere was a break in the frequency distribution for this question. Based on ourinterviews, we suspected the accuracy, and even the motives, of anyonereporting trip savings as high as 15 for a given online shopping session. It isentirely possible that we eliminated some respondents who indeed saved anextraordinary number of trips by shopping online. We think it is more likelythat we included a few respondents who inflated the number of trips saved forwhatever reason, but whose inflated number was still below our cutoff point.In the “Discussion, Conclusions, and Implications” chapter, we discuss morethoroughly the ramifications of the inaccuracy of respondents’ reported tripsavings. After eliminating the outliers, we were left with 278 usable responses.
Lessons from the First Survey Leading to the Second Survey
Results of Survey 1 are included in the analysis leading to projections of tripsavings. The most important outcome of the first survey was the proportion ofshopping activity that led to offline purchases or no purchases.
Along with these data, we learned a great deal from the first survey that helpedsharpen our thinking on calculating trip projections. Concurrently, we found auseful projection of online shopping activity from the research companyeMarketer, which is discussed beginning on page 13.
We had grouped categories based on similarities in buying behavior andexpected to find a third-party projection of online shopping with productcategories that would translate well into ours. In retrospect, we would havebeen better served to ask open-ended questions such as, “What kinds ofproducts did you shop for?” We had tried to avoid open-ended questions toboost response rate, but this was probably not as great a problem as weanticipated because of the opt-in nature of the responding audience.
To project trip savings, we needed to match our data to the product categoriesused by eMarketer. We had expected to find projections with categories moregranular than our own. Instead, we found that projections available at the timewere about the same granularity as ours, but in somewhat different categories.Therefore, we had to ask respondents to categorize their purchases using thesame categories that eMarketer used.
We also had expected that market research firms would forecast the number oftransactions or dollars spent per transaction. (We had seen such a projectionseveral months before, but were unable to find an updated version). We

Methodology
Mineta Transportation Institute
13
discovered that no one was projecting the number of transactions, only thedollar amounts. If we were going to project trip savings, we needed to projecttrips saved per transaction. This way we could translate from a projection ofmarket activity to trips saved. With no reporting of numbers of transactions, weneeded to estimate dollars per transaction so we could get from dollars (whichwere already projected) to trips saved. Therefore, we had to ask about actualpurchases, not just online shopping sessions. We also needed a way todistinguish single-product transactions from those involving several purchases.
While we collected data on several variables that might be related to buyerbehavior, we found that most of these were not useful in projecting ahead to2004. We had no empirical or theoretical means for using them to projectchanged buying behavior and hence purchases and trip savings. The onlyconcept that gave us a theoretical structural change over time was the idea ofdifferent groups of people based on differences in adoption categories. As weexplain beginning on page 14, we used a theoretical future distribution to assistin making projections of trips saved.
Survey 2
In this survey, shown in Appendix C, we focused on the most recent onlinepurchase made by the respondent. This would allow us to translate theeMarketer dollar projections directly into trips with the data we obtained fromthe survey.
InsightExpress administered the second survey October 12 through 14, 2000.Data collection ceased as soon as the contracted number of completed surveyswas received. Of the 665 respondents who responded to the banner ads, 300responses were received for a nominal response rate of 45.1 percent. After weeliminated the outliers with trip savings greater than 15, we had 275 usableresponses. For most of the calculations, we also eliminated respondents whocompleted the survey but had not made a purchase of any kind, leaving 259responses.
Upon completion of the second survey, we had sufficient data to calculate tripsavings and project it to 2004.
CALCULATING TRIP SAVINGS FOR 2000
Several research firms have conducted studies attempting to assess the amountof online shopping done in the United States in 2000 and beyond. Rather than
Methodology
Mineta Transportation Institute
14
try to come up with our own forecast of this activity, we rely on these otherfirms for the baseline forecast of online purchasing activity. We used theforecast done by eMarketer because their forecast is based on an evaluation ofall these other forecasts. eMarketer does not collect data directly, but performsmeta analysis on the forecasts done by other research firms to arrive at its ownforecasts. eMarketer analysts use enough judgment and evaluation that theirforecasts can be said to be their own work, not simply a composite of theworks of the others.
Our task was to translate these forecasts into changes in the number of physicalshopping trips taken by U.S. consumers, based on the surveys.
All the forecasts by research companies state the amount of online purchaseactivity in terms of dollars spent. We had hoped that a research firm wouldstate their forecast in terms of number of transactions, as well. However, as ofAugust 1, 2000, none had done their forecasts in this format (nor have anydone so to date), so we had to estimate the number of transactions. This wasnecessary because shopping trips are related more to a shopping session than tonumber of products or items purchased. Accordingly, we had to estimate whatproportion of the amount spent online was spent on single-purchasetransactions and what was spent on combination purchases. Then wedetermined how many transactions were single purchase and how manyinvolved combination purchases, based on the average amount spent for eachtype of transaction. Once we had the number of each type of transaction, wemultiplied these by the average number of trips saved per type of transactionand added the products together. Single-purchase transactions were made morecomplex by calculating transactions and trips saved for each product category.
Equations for these calculations are presented in Appendix E, “The Model forProjecting Trip Savings,” which shows the forecasting model.
TRIP SAVINGS IN 2004
The following things can change in the next few years:
• The number of people buying online
• The distribution of products and services that are purchased
• The amounts individuals spend online

Methodology
Mineta Transportation Institute
15
• The familiarity that consumers have with products offered online, thecompanies offering products online, and the process of shopping online
• The distribution of innovation adopter categories that online consumers fallwithin
• The distribution of items purchased singly and in combinations in onlinepurchasing sessions.
To anticipate the trips saved, we will approximate these effects, as describedbelow.
The increase in the number of people shopping online and the amount beingspent online is taken from the forecast made by eMarketer in November,2000.3 The eMarketer forecasts are stated in terms of dollars spent by producttype. It is not important to try to anticipate how many buyers actuallyparticipate, since we do not care whether a trip savings number comes fromfew or many drivers. Nor is it important to try to account for the effect ofincreased familiarity, since the eMarketer forecasts implicitly take this intoaccount.
Given the eMarketer forecasts by product category for 2004, we must attemptto translate these into number of transactions. Once given a number oftransactions, we must estimate the types of transactions these represent andthen determine the trip savings from each type. In the 2000 estimate, we candivide transactions into single purchases and combination purchases based onthe distribution reported in our survey, as explained above. In projecting futuretransaction types, we would anticipate more transactions to be combinationrather than single purchase. As people buy more items online and shift more oftheir purchasing online, more online shopping sessions will be for multipleitems. The data we have to help approximate this shift in transaction typescomes from the distribution of innovation adopter types.
All temporally driven shifts in this forecast will come from a shift in thedistribution of adopter types. As will be seen in the chapter “Discussion,Conclusions, and Implications,” the adopter types in 2000 were weightedheavily toward the innovator, early adopter, and early majority types. In 2004,we will assume the following distribution of purchasers, based on Rogers’ideal distribution of adopter categories:4
3 eMarketer. The eCommerce: B2C Report, November 2000.4 Rogers. op. cit., pp. 257-256.

Methodology
Mineta Transportation Institute
16
• 16 percent are innovators and early adopters.
• 34 percent are early majority adopters.
• 34 percent are late majority adopters.
• 16 percent are laggard adopters.
For each category of adopter type, the average amounts spent in singlepurchases and in combination purchases will be determined, as well as theaverage trip savings for each type of transaction within each type of adoptercategory. Total trip savings, then, will be a sum of the linear combination of thesavings by adopter type, adjusted for the proportions of single and combinationtransactions. The equation for this calculation is presented in Appendix E.
This leaves two factors unaccounted for in the trip savings projection model:familiarity and comfort level. As familiarity increases the number of itemsbeing bought by each household, more items will be shopped for andpurchased in combination. At the same time, the comfort level of consumerswill start to rise and they will be less inclined to make shopping trips tophysically inspect and try the merchandise or service. We have no way ofanticipating how either of these trends will progress. Even though we tooksamples at two points in time, these two surveys occurred only months apart,so there was not enough time to observe trends. Because the surveys were notdone as repeated measures on the same respondents, the ability to spot trends isfurther weakened. For now, we consider these two trends to be offsetting. Morecombination purchases will tend to reduce the overall number of trips saved;more familiarity will tend to increase trips saved. We leave it to future researchefforts to track these effects.
A third factor unaccounted for in these estimates is the different trip savingsfor each product category. The problem here is the sample size. With a largeenough sample, we could calculate estimates of the trips saved by each adoptercategory for each single-purchase product category. Given four adoptercategories and 11 product categories, we did not have enough data points tocalculate reliable means for each of the 44 category combinations. Therefore,we treated single purchases as a single category.

Results
Mineta Transportation Institute
17
RESULTS
As discussed in the previous section, we estimated total trip savings bybreaking the estimate into components. Components for the 2000 estimate andfor the 2004 estimate were somewhat different, as described in Appendix E. Inthis section, we first discuss the components of the 2000 estimate and thenreport the components of the 2004 estimate.
TRIP SAVINGS IN 2000
Trip savings in 2000 were estimated for the following components:
• Single-product purchases
• Multiple-product purchases
• Offline purchases in which some of the shopping effort was performedonline
• Shopping that resulted in a decision not to purchase anything.
Single-Product Purchases and Trip Savings in 2000
The first set of results pertains to trip savings from single-product purchases onthe Web. The components of the calculation, for each product category, are:
• Dollars purchased, 2000, estimated, from eMarketer
• Dollars per transaction, from the second survey
• Number of transactions, calculated by dividing total dollars by dollars pertransaction
• Average number of trips saved, per transaction, from the second survey
• Total trips saved, by product category, calculated by multiplying totalnumber of transactions by the average number of trips saved
• Total trips saved, summed across categories.
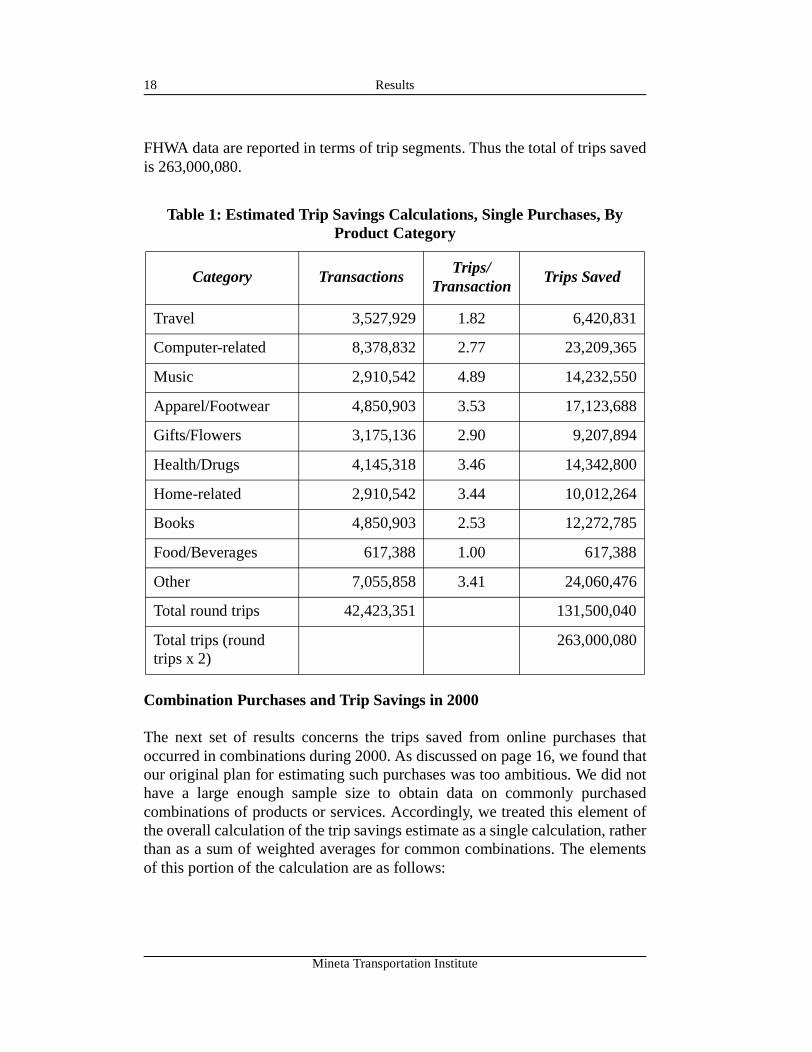
Table 1 shows these calculations. The total number of trips saved from singleonline purchases in 2000 is estimated to be 131,500,040. To make thiscalculation consistent with Federal Highway Administration (FHWA) data,discussed later in this chapter, we multiplied this number by 2. Ourrespondents were indicating trips saved in terms of round trips, while the
Results
Mineta Transportation Institute
18
FHWA data are reported in terms of trip segments. Thus the total of trips savedis 263,000,080.
Combination Purchases and Trip Savings in 2000
The next set of results concerns the trips saved from online purchases thatoccurred in combinations during 2000. As discussed on page 16, we found thatour original plan for estimating such purchases was too ambitious. We did nothave a large enough sample size to obtain data on commonly purchasedcombinations of products or services. Accordingly, we treated this element ofthe overall calculation of the trip savings estimate as a single calculation, ratherthan as a sum of weighted averages for common combinations. The elementsof this portion of the calculation are as follows:
Table 1: Estimated Trip Savings Calculations, Single Purchases, ByProduct Category
Category TransactionsTrips/
TransactionTrips Saved
Travel 3,527,929 1.82 6,420,831
Computer-related 8,378,832 2.77 23,209,365
Music 2,910,542 4.89 14,232,550
Apparel/Footwear 4,850,903 3.53 17,123,688
Gifts/Flowers 3,175,136 2.90 9,207,894
Health/Drugs 4,145,318 3.46 14,342,800
Home-related 2,910,542 3.44 10,012,264
Books 4,850,903 2.53 12,272,785
Food/Beverages 617,388 1.00 617,388
Other 7,055,858 3.41 24,060,476
Total round trips 42,423,351 131,500,040
Total trips (roundtrips x 2)
263,000,080

Results
Mineta Transportation Institute
19
• Dollars purchased in combination purchases, 2000, estimated, fromeMarketer;
• Dollars per online combination purchase, from the second survey;
• Number of online combination purchases, calculated by dividing totaldollars by dollars per transaction;
• Average number of trips saved, per transaction, from the second survey;
• Total trips saved, calculated by multiplying total number of transactions bythe average number of trips saved;
Table 2 shows the data obtained and used in the calculation. The total tripssaved from online combination purchases in 2000 were estimated to be169,074,740. Again, adjustments were made to account for differencesbetween our data and FHWA data. For combination purchases, we assumedthat trip chaining would result in three trip segments for each round trip saved.Thus the total number of trips saved from combination purchases is507,224,220.
Trips Saved from Offline Purchases, 2000
After accounting for shopping trips saved from purchases made online, thecalculation of total trips saved must include savings from purchases madeoffline. For many products, the consumer needs to see and try the merchandiseor talk directly with a retail sales person. For other purchases, the consumerdoes not want to wait for shipping. After performing some search andcomparison online, the consumer then completes the process offline. Trips are
Table 2: Estimated Trip Savings Calculation, Combination Purchases
A. Total Dollars Spent in Combined Purchases $27,676,00,000
B. Average $ per Transaction $640.03
C. Total Transactions, Combined Purchases (A/B) 43,241,622
D. Average Trips Saved per Combined PurchaseTransaction
3.91
E. Total Round Trips Saved in Combined Purchases,2000 (C*D)
169,074,740
F. Total Trips Saved (round trips x 3) 507,224,220
Results
Mineta Transportation Institute
20
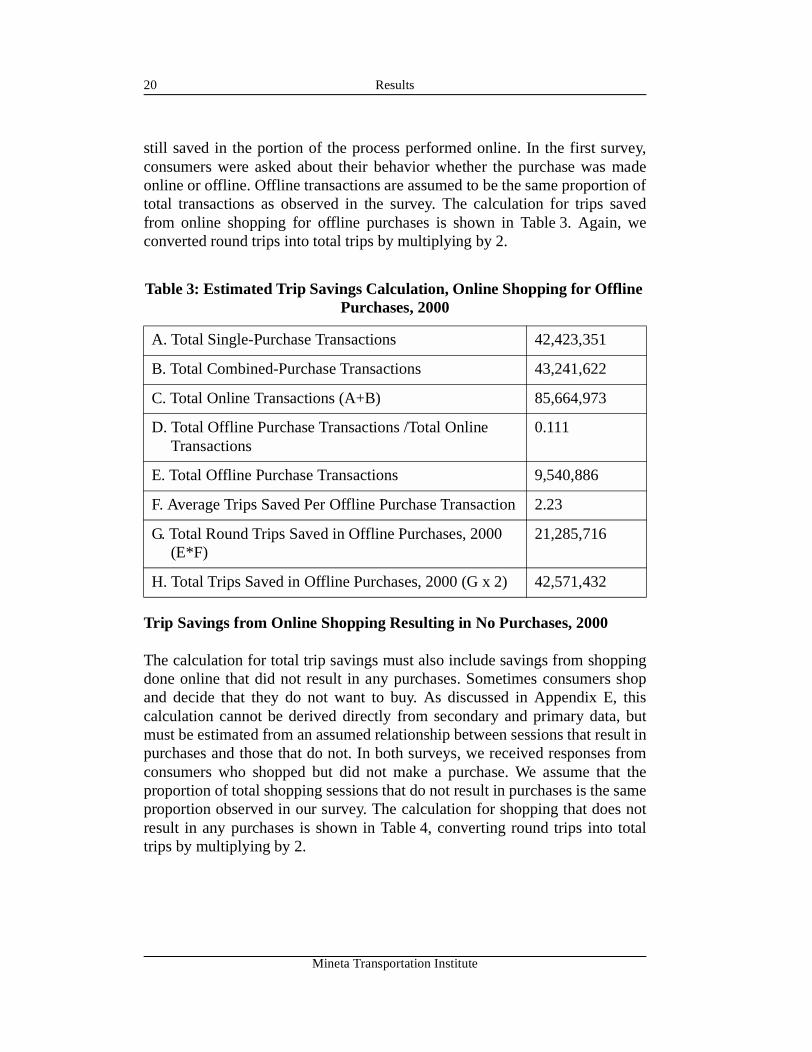
still saved in the portion of the process performed online. In the first survey,consumers were asked about their behavior whether the purchase was madeonline or offline. Offline transactions are assumed to be the same proportion oftotal transactions as observed in the survey. The calculation for trips savedfrom online shopping for offline purchases is shown in Table 3. Again, weconverted round trips into total trips by multiplying by 2.
Trip Savings from Online Shopping Resulting in No Purchases, 2000
The calculation for total trip savings must also include savings from shoppingdone online that did not result in any purchases. Sometimes consumers shopand decide that they do not want to buy. As discussed in Appendix E, thiscalculation cannot be derived directly from secondary and primary data, butmust be estimated from an assumed relationship between sessions that result inpurchases and those that do not. In both surveys, we received responses fromconsumers who shopped but did not make a purchase. We assume that theproportion of total shopping sessions that do not result in purchases is the sameproportion observed in our survey. The calculation for shopping that does notresult in any purchases is shown in Table 4, converting round trips into totaltrips by multiplying by 2.
Table 3: Estimated Trip Savings Calculation, Online Shopping for OfflinePurchases, 2000
A. Total Single-Purchase Transactions 42,423,351
B. Total Combined-Purchase Transactions 43,241,622
C. Total Online Transactions (A+B) 85,664,973
D. Total Offline Purchase Transactions /Total OnlineTransactions
0.111
E. Total Offline Purchase Transactions 9,540,886
F. Average Trips Saved Per Offline Purchase Transaction 2.23
G. Total Round Trips Saved in Offline Purchases, 2000(E*F)
21,285,716
H. Total Trips Saved in Offline Purchases, 2000 (G x 2) 42,571,432

Results
Mineta Transportation Institute
21
Total Trip Savings from Online Shopping, 2000
Adding these four elements together yields the estimate of number of tripssaved in 2000 as 832,807,232.
The question then is, what proportion of the total number of automobile tripstaken does this represent? Total vehicle trips less than 100 miles (one-way) inthe United States in 1995 was reported as 229,745,000,000 by the U.S. DOT5.Making a straight-line projection of the increase in trips (based on the averageannual increase in auto trips reported by U.S. DOT from 1977 to 1995 of3.4 percent per year) brings the estimate of total vehicle trips in 2000 to271,549,350,000. Thus the percentage of automobile trips reduced by onlineshopping in 2000 is estimated to be 0.084 percent. This information issummarized in Table 5.
Table 4: Estimated Trip Savings Calculation, Online Shopping forNonpurchases, 2000
A. Total Single-Purchase Transactions 42,423,351
B. Total Combined-Purchase Transactions 43,241,622
C. Total Online Transactions (A+B) 85,664,973
D. Nonpurchases /Total Online Transactions 0.073
E. Total Nonpurchase Sessions (D*C) 6,292,925
F. Average Trips Saved Per Nonpurchase Session 1.59
G. Total Trips Saved in Nonpurchase Sessions, 2000(E*F)
10,005,750
H. Total Trips Saved in Offline Purchases, 2000 (G x 2) 20,011,500
5 U.S. Department of Transportation, Federal Highway Administration. National PersonalTravel Survey, 1997.

Results
Mineta Transportation Institute
22
ESTIMATES FOR 2004
To estimate trip savings for 2004, we used eMarketer’s estimates of onlineconsumer purchases for 2004 as the base volume. They estimated that U.S.consumers would spend $125,600 million online in 2004. To translate this intotrips saved from online shopping, we again broke the total into amounts forsingle purchases and combination purchases. We expect, however, thatcombination purchases will increase over time. As discussed in the“Methodology” section, we used the idea that segments exist based on thepropensity of people to adopt innovations. As shown in Appendix E, weassumed a distribution of adopter categories that reflected a maturing marketrather than a new market. We used the same transaction sizes and trip savingsfigures, as well as the original distribution of single purchases and combinationpurchases, for each adopter category. We simply changed the weights foradopter categories in determining total trips saved.
Table 6 shows the conversion of adopter category weights from 2000 to 2004.
Table 5: Estimated Trip Savings from Online Shopping in the U.S. in 2000,Compared to Estimated Total Automobile Trips (Less than 50 Miles in
Length)
Total Trips Saved from Online Shopping 832,807,232
Single-Purchase Trip Savings 263,000,080
Combination-Purchase Trip Savings 507,224,220
Offline-Purchase Trip Savings 42,571,432
Nonpurchase Trip Savings 20,011,500
Total Short-Distance Automobile Trips Taken in 2000, est. 271,549,350,000
Percentage Reduction in Total Short-Distance AutomobileTrips, 2000, est.
0.307 %

Results
Mineta Transportation Institute
23
The first column shows the percentage of respondents in each of the categories.The respondents fall more toward the early categories in the adoption cycle,but not by a large amount. Similarly, the first two adoption categories show asomewhat higher concentration of combination purchases than do theremaining two categories. The second column shows that the highestconcentration of dollar purchases is in the combination-purchase categorieswithin the first two adopter categories. Mean dollars per transaction and tripssaved per transaction are shown in the last two columns. The biggest surprise isthe large transaction size for combination purchases among innovators. Itshould be noted that the sample size in this category was large enough that thisstatistic is not an aberration due to a small cell size. Another unexpected resultis the trips saved per transaction shown for combination purchases in the earlymajority category. This is smaller than the average trips saved for the single-purchase category. Although the rank order is reversed from what might beexpected, the mean trips saved are not out of an acceptable range.
Table 7 shows how these statistics are used in the calculation of projected tripsavings in 2004. Calculations shown are for round trips.
Table 6: Conversion of Adopter Categories’ Weights from2000 to 2004—Elements for Calculation from Sample Data
Category% of totalsample,
2000
% of total$ volumein sample
Mean $per trans-
action
Tripssaved pertransac-
tion
Innovators/Early AdoptersSingle PurchaseCombination Purchase
16.99%06.18%10.81%
43.21%01.72%41.48%
1171610
1.6254.643
Early MajoritySingle PurchaseCombination Purchase
38.61%19.31%19.31%
32.30%09.14%23.16%
199503
3.7803.300
Late MajoritySingle PurchaseCombination Purchase
25.10%14.29%10.81%
20.01%11.98%08.03%
352312
2.9734.214
LaggardsSingle PurchaseCombination Purchase
19.31%11.20%08.11%
04.49%02.35%02.14%
88111
2.8973.952

Results
Mineta Transportation Institute
24
The first column of data shows the assumed distribution of the population ofonline shoppers after the market has adjusted to the relative newness ofshopping online. By adjusting for this difference in weighting, a differentdistribution of dollar purchases is achieved, as shown in the second column.By multiplying these proportions by the total amount projected to be spent, thetotal amount per category is obtained. Dividing by the dollars per transactionfor each grouping obtains the number of transactions, shown in the thirdcolumn of data. Multiplying these by the average number of trips saved obtainsthe projection of trips saved (round trips) for each category. Before adding allthe trips saved together, we again have to convert to trip segments to makethese compatible with FHWA data. We used a factor of 2 for single-purchasetransactions and a factor of 3 for combination purchases. For offline purchasesand no-purchase situations, we used a factor of 2.
These are added up and compared to the total number of trips expected to betaken in 2004. As can be seen in Table 8, the expected level of online shoppingyields a 0.9 percent decline in overall trips taken in 2004.
Table 7: Adopter Categories Converted from 2000 to 2004—Calculations of Trip Savings
Category
Assumed% of
shoppersin 2004
% of total$ volumein 2004
2004trans-actions
(millions)
Roundtrips
saved,2004
(millions)
Innovators/Early AdoptersSingle PurchaseCombination Purchase
16.00%05.81%10.18%
40.69%01.62%39.07%
17.4330.48
28.32141.51
Early MajoritySingle PurchaseCombination Purchase
34.00%17.00%17.00%
28.44%08.05%20.39%
50.7950.92
191.97168.04
Late MajoritySingle PurchaseCombination Purchase
34.00%19.35%14.65%
27.11%16.23%10.87%
57.9343.78
172.22184.47
LaggardsSingle PurchaseCombination Purchase
16.00%09.28%06.72%
03.72%01.95%01.77%
27.8020.05
80.5579.23

Results
Mineta Transportation Institute
25
Implications of the small impact on total trips taken are explored in the nextsection of this report.
The impact is somewhat more pronounced when viewed by time of the week.In a follow-up survey, senior undergraduate students interviewed people whopurchased products through online shopping and found that 75 percent of thetrips saved would have been weekend trips. Assuming that 75 percent of tripssavings subtract from weekend traffic, trips saved for 2000 are shown inTable 9.
Table 8: Projection of Trips Saved Through Online Shopping in 2004
Total Trips Saved Through Online Single Purchases 946,114,800
Total Trips Saved Through Online CombinationPurchases
1,719,788,300
Total Trips Saved Through Online Shopping forOffline Purchases
148,107,600
Total Trips Saved Through Online Shopping, NoPurchase Made
69,449,570
Total Trips Saved, 2004 2,883,460,000
Total Short-Distance Round Trips Taken, Projected, for2004 310,406,580,000
Percentage of Trips Saved 0. 929 %
Table 9: Weekend Trips Saved, Percentage of Total WeekendShort-Distance Trips, 2000
Vehicle Trips, 2000, est. 271,549,350,000
Weekend Trips, 2000, est. (0.269 * Total Trips) 73,047,411,000
Trips Saved from Online Shopping, 2000 832,807,232
Weekend Trips Saved from Online Shopping, 2000(0.745 * Total Trips Saved)
620,441,388
Percentage of Weekend Trips Saved, 2000 0.849%
Results
Mineta Transportation Institute
26
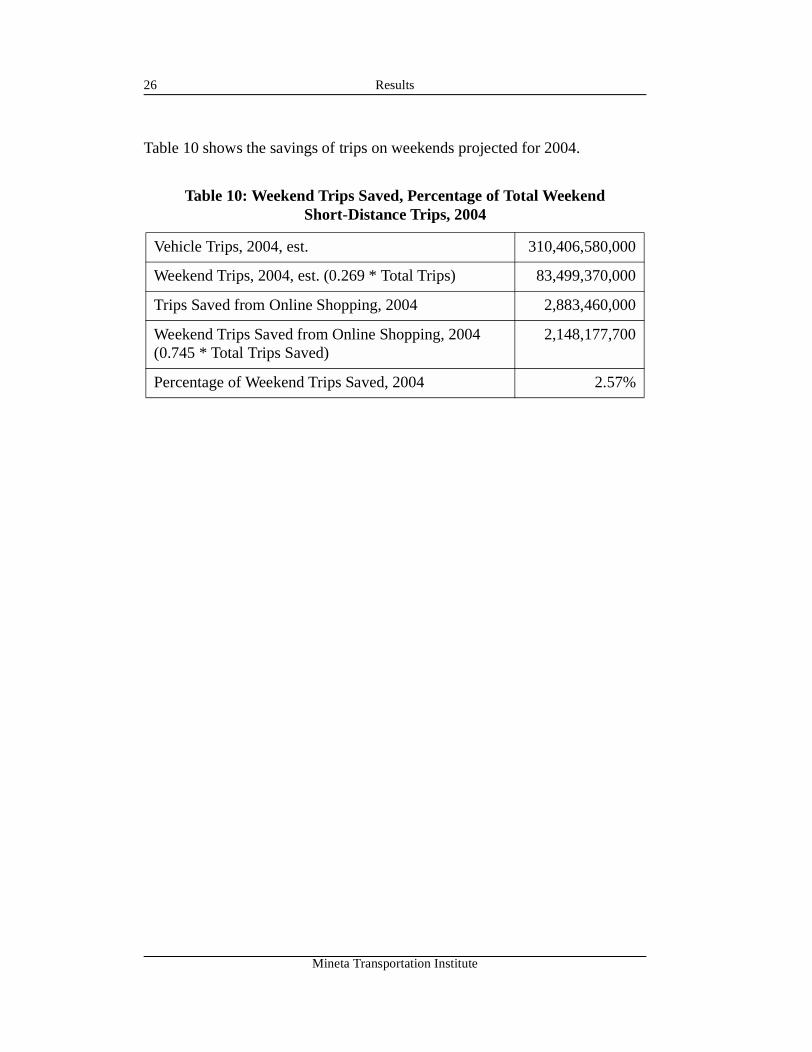
Table 10 shows the savings of trips on weekends projected for 2004.
Table 10: Weekend Trips Saved, Percentage of Total WeekendShort-Distance Trips, 2004
Vehicle Trips, 2004, est. 310,406,580,000
Weekend Trips, 2004, est. (0.269 * Total Trips) 83,499,370,000
Trips Saved from Online Shopping, 2004 2,883,460,000
Weekend Trips Saved from Online Shopping, 2004(0.745 * Total Trips Saved)
2,148,177,700
Percentage of Weekend Trips Saved, 2004 2.57%

Discussion, Conclusions, and Implications
Mineta Transportation Institute
27
DISCUSSION, CONCLUSIONS, AND IMPLICATIONS
When we began this research, we expected to find some level of noticeableimpact on traffic. The implication of the findings is that there will not be muchreduction in traffic from online shopping in the next few years. However, theremay be a noticeable, but still small, impact on weekend traffic by 2004.
This implies that large reductions in traffic congestion will have to come fromother sources. The obvious source for the most reduction in peak weekdaytraffic is telecommuting. People working from home one or more days a weekwould take sizable numbers of people off the road at times when thecongestion is worst. A similar method of traffic reduction is remote sitetelecommuting. In this method, people would travel a short distance to anoffice that offered Internet or some other networked capability for connectingto the home office.
Also note that exogenous events, such as the terrorist attacks of Fall, 2001,may have an impact on consumers’ decision processes, which may lead themto change their online shopping behavior.
With the type of projection done in this research, no reliable confidence levelcan be estimated — there are too many variables involved in the projectioncalculations to evaluate. More important, the key variable from which theestimates derive is eMarketer’s projection of online purchases, and eMarketerdoes not provide any confidence level of their estimate.
To put the estimate in perspective and to give a sense of a reasonable range forour estimates, we calculated an extreme estimate for trips saved using thestandard deviations (s.d.) of the distribution of responses for the trips savedvariables. Using t statistics for a 95 percent confidence interval, we assumedthat the mean trips saved for single-purchase, combination-purchase, offline-purchase, and no-purchase situations were t (95 percent, two-tailed) * s.d. fromthe sample means. Then using the numbers of transactions already calculatedfor these categories, we arrived at the estimates in Table 11.
The result shows that even with extremely high trip savings assumed, short-distance traffic still decreases only about 2.7 percent for the year. This will be anoticeable drop in high-congestion areas, but is still relatively minor inmagnitude.

Discussion, Conclusions, and Implications
Mineta Transportation Institute
28
Several limitations of the research need to be noted. First, we dropped theoutlier respondents from the analysis. This tends to lower the mean trip savingsmeasured in the samples. However, since the trip savings reported by theoutliers lacked credibility—typically well over 20 trips saved per shoppingsession — we believe accuracy is most likely improved rather than degraded.In a small sample study, the effect of a few outliers will tend to be exaggeratedin calculating estimates of population parameters, so it is better to remove theoutliers from the analysis than to leave them in and probably increase theinaccuracy of the estimates.
This gives rise to a more important question, that of the accuracy of the self-reported trip savings. Given our interviews and questionnaire tests, thereported trip savings seemed to be in a reasonable range. These statistics wouldbear validation from trip report data. Such validation, however, is expensive,tedious, time consuming, and beyond the scope of this project.
The sampling method introduced a potentially troubling bias. Since we askedrespondents to report on their most recent online shopping experience, we areassuming that frequency of purchase is fairly uniform across different groups.This is particularly important when we are projecting future trip savings bychanging the weighting of innovation adopter groups. There is reason tobelieve that earlier adopters may be inclined to buy online more frequentlythan would later adopters. This would be more of a concern if there were amuch more pronounced shift toward earlier adopter groups than actually
Table 11: Projection of Trips Saved Through Online Shopping in 2004,Extreme Case
Total Trips Saved Through Online Purchases 7,423,590,000
Total Trips Saved Through Online Shopping forOffline Purchases
555,669,300
Total Trips Saved Through Online Shopping, NoPurchase Made
265,550,400
Total Trips Saved, 2004 8,244,810,000
Total Short-Distance Round Trips Taken, Projected, for2004
310,406,580,000
Percentage of Trips Saved 2.66%

Discussion, Conclusions, and Implications
Mineta Transportation Institute
29
appears in the data. In that case, when we assumed an ideal distribution ofadopter categories in 2004, we would have shifted more of the weighting awayfrom the innovators and early majority. As it was, the shift in weights foradopter groups was relatively minor. The largest influence on the increase intrips saved came from eMarketer’s projected growth in retail sales.
The question of weighting shifts also would be more of a concern if the impactof online shopping on trip savings were larger. As it is, when we assumeextremely high trip savings in the calculations, the impact on traffic is stillminor. Even though the projection calculations did not allow for changes in thefrequency of purchase, any huge shifts in weighting by adopter group wouldstill have had minor impact.
Another area for reflection is the conversion of trip savings from round trips totrip segments. We discovered the need to make such a conversion late in theprocess. If we were to do this research again, we would try to obtain data tosupport our assumptions in this area. However, given the interview data, theability of respondents to make the conversion themselves is questionable.
The data raise an interesting question on Rogers’ innovation diffusion model.The distribution of innovation adopter types in both samples was quite close towhat we would expect in a more mature technology. One possible explanationwould be that online shopping is already approaching maturity, but this doesnot seem likely. The technology is still evolving and poses significantperceived risks for more conservative adopters. An alternative explanation isthat the adopter categories are not as well-defined as theory would tell us theyshould be. Rogers makes the case that individuals will tend to adopt newproducts in a fairly consistent manner: If they are in the early majority for oneproduct, they will tend to be for other products. However, in this case we seemto have a significant number of early adopters who normally would adopt laterin the adoption process. This suggests that either this technology is unique orthat people are not as consistent in their adoption patterns as theory implies.More inquiry would seem to be in order, both on adoption characteristics ofonline shopping and on the innovation diffusion model.
All in all, the results are somewhat disappointing. It would have been excitingto be able to say that online shopping was likely to have an appreciable impactin the near future on transportation resource allocations, but that seemsunlikely at this juncture. Over time, the adoption of online shopping probablywill have a significant impact. It is apparent, though, that for online shoppingto make a rapid change in shopping patterns, significant technology

Discussion, Conclusions, and Implications
Mineta Transportation Institute
30
breakthroughs must occur and be assimilated into the shopping infrastructurein the near future. This could well happen. The convergence betweentelevision, telecommunications, and the Internet may produce online shoppingexperiences that are far more useful and convenient than those produced bycurrent technology. The convergence between online retailing and physicalretailing also may begin shifting consumers’ shopping patterns. After thecurrent downturn in the economy, including the Internet economy, plays out,we may indeed see commercialization of radical technological advances thatbring about the impacts we were looking for.

Bibliography
Mineta Transportation Institute
31
BIBLIOGRAPHY
eMarketer, Inc. The eCommerce: B2C Report, New York: eMarketer, Inc.,November 2000.
Li, Hairong, Cheng Kuo, and Marth G. Russell. “The Impact of PerceivedChannel Utilities, Shopping Orientations, and Demographics on theConsumer’s Online Buying Behavior,” Journal of Computer-MediatedCommunication, Vol. 5, No. 2 (December 1999). Available at http://www.ascusc.org/jcmc/vol5/issue2/hairong.html
Moore, Geoffrey, Crossing the Chasm, New York: HarperCollins, 1991.
_____. Inside the Tornado, New York: HarperCollins, 1995.
_____. Living on the Fault Line, New York: HarperCollins, 2000.
Rogers, Everett M. Diffusion of Innovations, 4th ed., New York: Free Press,1995.
U.S. Department of Transportation, Federal Highway Administration. 1995National Personal Travel Survey. Washington, D.C.: USDOT, 1997.Available at http://www-cta.ornl.gov/npts/1995/Doc/

Bibliography
Mineta Transportation Institute
32

Pre-Publication Peer Review
Mineta Transportation Institute
33
PRE-PUBLICATION PEER REVIEW
San José State University, of the California State University system, and theMTI Board of Trustees have agreed upon a peer review process required for allresearch published by MTI. The purpose of the review process is to ensure thatthe results presented are based upon a professionally acceptable researchprotocol.
Research projects begin with the approval of a scope of work by thesponsoring entities, with in-process reviews by the MTI Research Director andthe project sponsor. Periodic progress reports are provided to the MTIResearch Director and the Research Associates Policy Oversight Committee(RAPOC). Review of the draft research product is conducted by the ResearchCommittee of the Board of Trustees and may include invited critiques fromother professionals in the subject field. The review is based on the professionalpropriety of the research methodology.
Pre-Publication Peer Review
Mineta Transportation Institute
34

About the Authors
Mineta Transportation Institute
35
ABOUT THE AUTHORS
Joseph Giglierano is a Professor of Marketing in the College of Business atSan José State University. He holds a B.A. in Political Science from theCollege of Wooster in Ohio, an M.P.A. from Ohio State University, and a Ph.D.in Business Administration from Ohio State University. His works have beenpublished in numerous periodicals and journals and presented at many forumsand symposia.
He currently teaches high-tech marketing, e-commerce marketing, andmarketing management at the graduate level, and e-commerce marketing andbuyer behavior at the undergraduate level.
Giglierano’s research interests include business strategy, entrepreneurship,electronic commerce, online marketing, business-to-business marketing, andmarketing management, as well as new technology development, marketing ofnew technology and concepts, demand management, and managementeducation for transportation.
Malu Roldan is an Assistant Professor of Marketing/MIS and DecisionSciences at San José State University. She earned her B.S. from the Universityof the Phillipines, an M.A. from UCLA, an M.B.A. from the University ofCalifornia, Irvine, and her Ph.D. from UCLA.
Roldan has had several works published and has presented at numerousconferences. Her research interests include new technologies, technologytransfer, international technology, and rural and urban transportation planning.

About the Authors
Mineta Transportation Institute
36

Acronyms and Abbreviations
Mineta Transportation Institute
37
ACRONYMS AND ABBREVIATIONS
DOT Department of Transportation
FHWA Federal Highway Administration
MTI Mineta Transportation Institute

Acronyms and Abbreviations
Mineta Transportation Institute
38

Exploratory Questions
Mineta Transportation Institute
A-1
APPENDIX A: EXPLORATORY QUESTIONS
Name
Age
Gender
Highest Education Degree Completed
Annual Family Income
How many people are there in your household?
How many vehicles do you have in your household?
How accessible is public transport for you?
How often do you use it (public transport)?
How long have you been using a computer?
How long have you been using a computer connected to a network?
How many years have you been using Internet?
How many hours per week do you use a computer at work? At home?
ONLINE SHOPPING EXPERIENCES
• Describe your most recent online shopping experience, time spent andprocess? Why did you decide to buy online?
• How would you have shopped for the same thing offline, time spent,process, trips? Would you do this offline again given your onlineexperiences?
• During the past week, how much time do you think you have spentshopping online? Was this week typical or did you spend more/less timethan usual?

Exploratory Questions
Mineta Transportation Institute
A-2
• What kinds of products or services do you think you will try shopping foronline in the near future? How will this affect time and trips spent shoppingfor these items? Why these?
• What is the online shopping site that you use most frequently? What doyou like/not like about it? Is this the first site you go to when you connect?
• How often do you go to a bricks-and-mortar store for the type of purchasesyou make at the site you just described?
• When shopping online, do you sometimes include shopping trips to realstores as part of the process? Which parts were these and why?
SHOPPING BEHAVIOR
• How would you describe yourself as a shopper in general—time spent,common items bought, easiest items to buy?
• How does this compare to your online shopping behavior?
• What products/services do you generally have delivered to your home?How long does it take to have them delivered?
PROJECTIONS
• How many shopping trips and how much time have you saved by doing atleast part of the shopping online?
• What else do you think might tend to change your shopping trip patterns inthe near future?
• What are the 3 top reasons why you would shop for an item online? Howwould an ideal shopping site address these?

First Online Survey and Rationale
Mineta Transportation Institute
B-1
APPENDIX B: FIRST ONLINE SURVEY AND RATIONALE
First Online Survey and Rationale
Mineta Transportation Institute
B-2
First Online Survey and Rationale
Mineta Transportation Institute
B-3

First Online Survey and Rationale
Mineta Transportation Institute
B-4

First Online Survey and Rationale
Mineta Transportation Institute
B-5

First Online Survey and Rationale
Mineta Transportation Institute
B-6
RATIONALE
In Question 1, we obtained the categories of products or services for which therespondent shopped. We were looking to weight the trip savings data bytransaction data from the market researcher’s forecast that we would choose.However, we were unable to obtain forecasts that gave average transaction sizeby product type, so our model for projecting trip savings would not work.
Question 2 obtained purchase information—whether the respondent purchasedproducts or services from the shopping activity and whether the purchaseswere online, offline, or both.
We asked about the most important item shopped for during this session. Theinterviews suggested that this was what drove the shopping behavior.Question 3 used a 7-point scale to assess familiarity. Question 4 assessedwhether the purchase was major or minor. Question 5 assessed whetherproducts sought needed to be inspected physically. Questions 6 asked whetherthe person phycically took any trips as part of the shopping process. Question 7asked how many trips were taken.
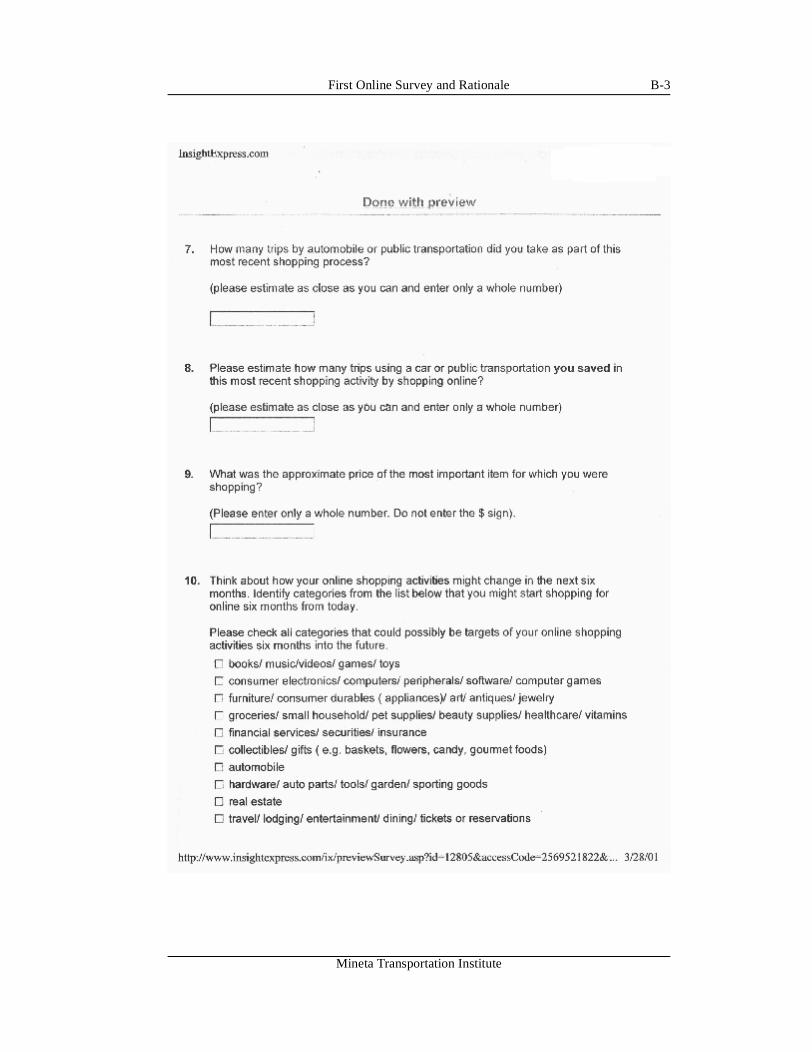
Question 8 asked how many trips were saved by the shopping activity inquestion. Question 9 asked for the price of the most important product.
Question 10 concerned the categories in which consumers believe they willbegin shopping within the next six months. We had hoped to use this questionas an aid in projecting future sales and trip savings.
Questions 11 to 13 were designed to seek demographic data that interviewssuggested would be associated with differences in shopping behavior.
Question 14 asked the respondent to categorize his or her shopping orientation.Prior research by Li, Kuo, and Russell1 suggests that the consumer’s shoppingstyle affects online shopping behavior. The prior research put people incategories based on cluster analysis of several variables. Based on ourinterviews, we believed that people display multiple shopping stylessimultaneously, so we allowed for multiple responses.
1 Li, Hairong, Cheng Kuo, and Marth G. Russell. “The Impact of Perceived Channel Utilities,Shopping Orientations, and Demographics on the Consumer’s Online Buying Behavior,”Journal of Computer-Mediated Communication, Vol. 5, No. 2 (December 1999). Available athttp://www.ascusc.org/jcmc/vol5/issue2/hairong.html

First Online Survey and Rationale
Mineta Transportation Institute
B-7
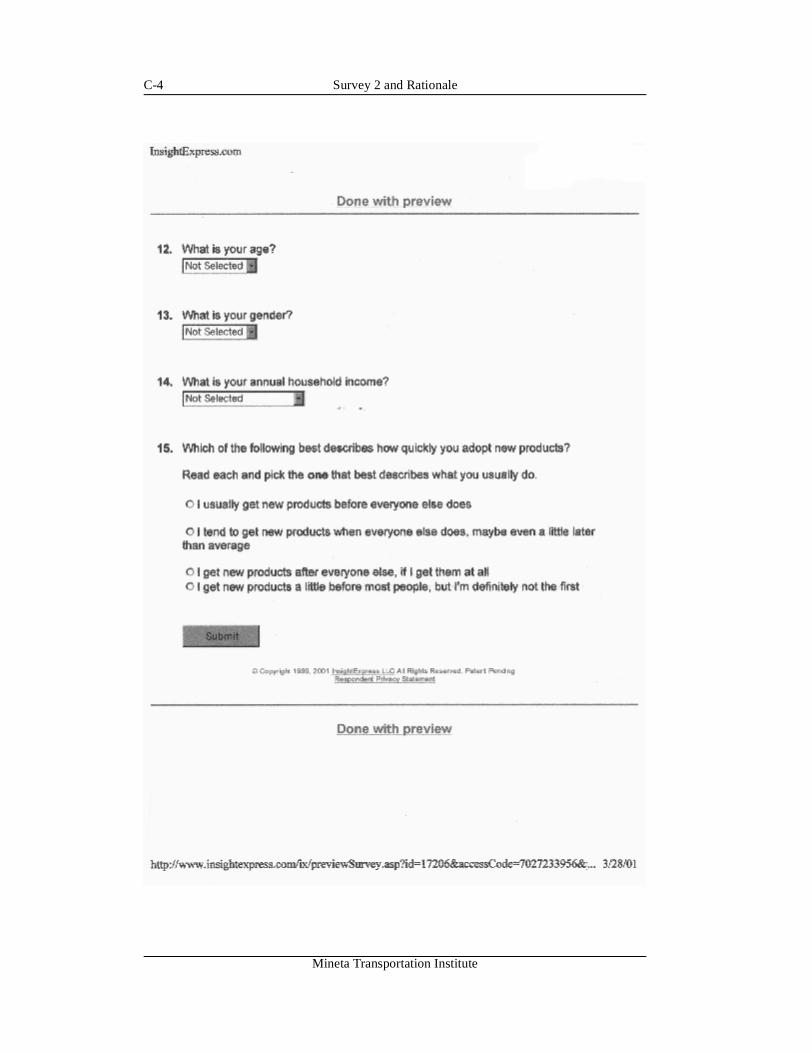
Question 15 asked the respondent to characterize his or her tendencies foradoption of new products or services. We realized that people would vary fromtheir preferred mode of new product adoption; however, the theory suggests acertain consistency that will affect buying behavior. Accordingly, we askedrespondents to characterize their typical adoption behavior.

First Online Survey and Rationale
Mineta Transportation Institute
B-8

Survey 2 and Rationale
Mineta Transportation Institute
C-1
APPENDIX C: SURVEY 2 AND RATIONALE

Survey 2 and Rationale
Mineta Transportation Institute
C-2

Survey 2 and Rationale
Mineta Transportation Institute
C-3
Survey 2 and Rationale
Mineta Transportation Institute
C-4

Survey 2 and Rationale
Mineta Transportation Institute
C-5
RATIONALE
As in the first survey, we asked what product or service was purchased, but weidentified first the most important item in the purchase (Question 1). InQuestion 2, we asked what the price was for this particular product, somethingwe did not do in the first survey. Question 3 covered the estimated number oftrips saved by purchasing this particular item. Question 4 provided insight intowhat kinds of purchase behaviors are being altered (catalog shopping, offlineshopping, etc.).
Question 5 determined whether this was a combination purchase or single-itempurchase. If it was a combination purchase, the respondent answered Questions6 through 11. Otherwise the respondent moved on to Question 12.
In Question 6, the category for the next most important product was obtained.We had hoped to find common combinations and determine the amount spentper transaction and total trips saved, and use this information to translate theeMarketer data. Common combinations did not emerge, however, so we had totreat all combination purchases as a single group. Therefore, Questions 7 and8, which obtained price and trips saved for the second most important productor service, produced data that were not central to the analysis.
Question 9 obtained the total trips saved for combination purchases. In theanalysis, these data had to be combined with data from Question 3, total tripssaved from purchase of the most important product (the only product for singlepurchases), to obtain the total trips saved from all purchases.
Question 10 obtained the total amount spent on all purchases in thecombination purchases. As with Questions 3 and 9, data from Question 10must be combined with data from Question 4 to obtain data on total dollarsspent online.
Question 11 obtained data on how many Web sites were purchased from. Thishelps to understand how online shopping is being done.
Questions 12 through 14 obtained demographic data that can be compared todata on the population of online shoppers. Question 15 determined therespondent’s adoption category.

Survey 2 and Rationale
Mineta Transportation Institute
C-6

Frequencies and Means for Surveys
Mineta Transportation Institute
D-1
APPENDIX D: FREQUENCIES AND MEANS FORSURVEYS
Frequencies and Means for First Survey
QuestionFrequency
(n=?)Valid
PercentMean (if
applicable)Std Dev.
Products or services shopped.(Multiple responses allowed)
278
Books/music/videos/games/toys 176 63.3
Consumer electronics/computer/software/peripherals/computer games
115 41.4
Furniture/consumer durables/art/antiques/jewelry
25 9.0
Groceries/small household/ petsupplies/beauty supplies/ healthcare/vitamins
103 37.1
Financial services/securities/insurance
28 10.1
Collectibles/gifts (flowers,candy, gourmet foods)
57 20.5
Automobiles 28 10.1
Hardware/auto parts/tools/garden/sporting goods
37 13.3
Real estate 6 2.2
Other 48 17.3
Purchased anything fromshopping activity? (Multipleresponses allowed)
278
Yes, online 234 84.2

Frequencies and Means for Surveys
Mineta Transportation Institute
D-2
Yes, offline 92 33.1
No 18 6.5
Familiarity with the mostimportant item prior toshopping? (1 = Very Familiar; 7= Not at all Familiar)
278 2.4856 1.5523
Was most important item amajor or minor purchase? (1 =Very Major; 7 = Very Minor)
278 4.0863 1.17163
Importance of being able toexamine most important itembefore buying? (1 = VeryImportant; 7 = Not at allImportant)
212 3.3538 1.7286
Were physical trips to the storepart of this shopping process?
278
Yes 106 38.1
No 172 61.9
How many physical trips didyou take as part of this shoppingprocess?
278 1.1906 2.3738
How many trips in this shoppingprocess did shopping onlinesave?
278 2.9065 2.6461
Approximate price of the mostimportant item?
276 $1,505 $7,469
Frequencies and Means for First Survey (Cont.)
QuestionFrequency
(n=?)Valid
PercentMean (if
applicable)Std Dev.

Frequencies and Means for Surveys
Mineta Transportation Institute
D-3
Categories of online shoppingsix months hence? (Multipleresponses allowed)
278
Books/music/videos/games/toys 230 82.7
Consumer electronics/computer/software/peripherals/computer games
177 63.7
Furniture/consumer durables/art/antiques/jewelry
92 33.1
Groceries/small household/ petsupplies/beauty supplies/ healthcare/vitamins
167 60.1
Financial services/securities/insurance
91 32.7
Collectibles/gifts (flowers,candy, gourmet foods)
141 50.7
Automobiles 62 22.3
Hardware/auto parts/tools/garden/sporting goods
99 35.6
Real estate 37 13.3
Travel/lodging/entertainment/dining/tickets or reservations
178 64.0
Other 67 24.1
Respondent’s age? 277
Below 18 0 0.0
18–25 48 17.3
26–35 72 25.9
Frequencies and Means for First Survey (Cont.)
QuestionFrequency
(n=?)Valid
PercentMean (if
applicable)Std Dev.

Frequencies and Means for Surveys
Mineta Transportation Institute
D-4
36–45 92 33.1
46–55 44 15.8
56–65 19 6.8
Above 65 2 0.7
Annual household income? 278
Less than $15,000 17 6.1
$15,001–$30,000 46 16.5
$30,001–$45,000 47 16.9
$45,001–$60,000 65 23.4
$60,001–$75,000 38 13.7
$75,001–$90,000 33 11.9
$90,001–$105,000 13 4.7
$105,001–$125,000 4 1.4
$125,001–$150,000 4 1.4
$150,001–$200,000 9 3.2
$200,001–$250,000 0 0
$250,001–$300,000 0 0
More than $300,000 2 0.7
Gender 278
Male 89 32
Female 189 68
Frequencies and Means for First Survey (Cont.)
QuestionFrequency
(n=?)Valid
PercentMean (if
applicable)Std Dev.

Frequencies and Means for Surveys
Mineta Transportation Institute
D-5
Shopping Style (Multipleresponses allowed)
278
Shopping is entertainment 126 54.7
See, touch, try before buying 76 27.3
Shopping has to be convenient 109 39.2
Being a smart shopper isimportant
198 71.2
Adoption Category 278
Usually get new products beforeeveryone else
31 11.2
Get new products a little beforemost people, but definitely notfirst
129 46.4
Get new products wheneveryone else does, maybe alittle later
74 26.6
Get new products after everyoneelse; maybe not at all
44 15.8
Frequencies and Means for Second Survey
QuestionFrequency
(n=?)Valid
PercentMean (if
applicable)Std Dev.
Most recent products or servicespurchased online–mostimportant item
275
Apparel & footwear 28 10.2
Frequencies and Means for First Survey (Cont.)
QuestionFrequency
(n=?)Valid
PercentMean (if
applicable)Std Dev.

Frequencies and Means for Surveys
Mineta Transportation Institute
D-6
Travel 27 9.8
Books 28 10.2
Health/drugs/beauty 25 9.1
Home-related 24 8.7
Food/beverages/groceries 5 1.8
Most recent products or servicespurchased online–mostimportant item
275
Apparel & footwear 28 10.2
Travel 27 9.8
Books 28 10.2
Health/drugs/beauty 25 9.1
Home-related 24 8.7
Food/beverages/groceries 5 1.8
Gifts/flowers 19 6.9
Music 17 6.2
Computer-related 46 16.7
Other 40 14.5
Don’t remember purchasing 16 5.8
Price of most important item? 259 $235 $633
Trips saved for most importantitem?
259 3.61 3.37
Frequencies and Means for Second Survey (Cont.)
QuestionFrequency
(n=?)Valid
PercentMean (if
applicable)Std Dev.

Frequencies and Means for Surveys
Mineta Transportation Institute
D-7
If you had to buy the mostimportant item offline, howwould you have done it?
259 4.0863 1.17163
Physical trip to store 164 63.3
Catalog purchase 20 7.7
Phone call (not a catalogpurchase)
31 12.0
Some other way 9 3.5
Would not have purchased 21 8.1
Would have purchased, but don’tknow how
14 5.4
How many other items werepurchased in the same onlinesession?
259 1.20 1.59
Next most important item – whatcategory?
127
Apparel & footwear 13 10.2
Travel 9 7.1
Books 14 11.0
Health/drugs/beauty 14 11.0
Home-related 11 8.7
Food/beverages/groceries 4 3.1
Gifts/flowers 10 7.9
Music 11 8.7
Computer-related 18 14.2
Frequencies and Means for Second Survey (Cont.)
QuestionFrequency
(n=?)Valid
PercentMean (if
applicable)Std Dev.

Frequencies and Means for Surveys
Mineta Transportation Institute
D-8
Other 23 18.1
No other purchases 148 53.8 (ofsample)
Price of second most importantitem?
127 $127 $295
Trips saved from shopping forsecond item online?
127 2.68 2.12
Total trips saved from onlineshopping session?
259 3.4942 3.2498
Total paid for all itemspurchased in this session?
259 $420 $2562
From how many Web sites werepurchases made? (Only thosewho purchased multiple items)
127 1.65 1.12
Respondent’s age? 275
Below 18 1 0.4
18–25 45 16.4
26–35 72 26.2
36–45 89 32.4
46–55 42 15.3
56–65 26 9.5
Above 65 0 0
Frequencies and Means for Second Survey (Cont.)
QuestionFrequency
(n=?)Valid
PercentMean (if
applicable)Std Dev.

Frequencies and Means for Surveys
Mineta Transportation Institute
D-9
Gender 275
Male 91 33.1
Female 184 66.9
Annual household income? 275
Less than $15,000 27 9.8
$15,001–$30,000 41 14.9
$30,001–$45,000 54 19.6
$45,001–$60000 50 18.2
$60,001–$75,000 45 16.4
$75,001–$90,000 26 9.5
$90,001–$105,000 6 2.2
$105,001–$125,000 5 1.8
$125,001–$150,000 7 2.5
$150,001–$200,000 7 2.5
$200,001–$250,000 1 0.4
$250,001–$300,000 1 0.4
More than $300,000 5 1.8
Adoption Category 275
Usually get new products beforeeveryone else
46 16.7
Get new products a little beforemost people, but definitely notfirst
107 38.9
Frequencies and Means for Second Survey (Cont.)
QuestionFrequency
(n=?)Valid
PercentMean (if
applicable)Std Dev.

Frequencies and Means for Surveys
Mineta Transportation Institute
D-10
Get new products wheneveryone else does, maybe alittle later
68 24.7
Get new products after everyoneelse; maybe not at all
54 19.6
Frequencies and Means for Second Survey (Cont.)
QuestionFrequency
(n=?)Valid
PercentMean (if
applicable)Std Dev.

The Model for Projecting Trip Savings
Mineta Transportation Institute
E-1
APPENDIX E: THE MODEL FOR PROJECTING TRIPSAVINGS
As noted earlier, the exploratory interviews suggested that the number of tripssaved would vary by the products purchased and the extent to whichcombination of products were purchased. In this section, we lay out thecalculation method for arriving at trip savings projections. The first subsection(below) shows how calculations were done for 2000. The second subsection(beginning on page E-7 ) shows how calculations were done for 2004.
CALCULATION OF 2000 TRIP SAVINGS
The model for which we wanted to estimate parameters is as follows:
TS2000 = TSP2000 + TCP
2000 + TOFLP2000 + TNOP
2000
Where
TS2000 = the number of trips saved in the year 2000 resulting fromonline shopping activity;
TSP2000 = the number of trips saved in 2000 in single purchases;
TCP2000 = the number of trips saved in 2000 in combination
purchases;
TOFLP2000 = the number of trips saved from online shopping in
2000, when the purchase was made offline;
TNOP2000 = the number of trips saved from online shopping in
2000, when no purchase was made.
Each element of the model requires expression as a calculation of variablesthat can be produced by the data that can be collected. Accordingly, a modelfor each element of trip savings was produced. The trips saved from singleonline purchases in the year 2000 was calculated as the sum of trips saved fromsingle online purchases in each product category:
TSP2000 = �
P
,1 nSPP
SPP TTr ∗
The Model for Projecting Trip Savings
Mineta Transportation Institute
E-2
Where
TSP2000 = the number of trips saved in the year 2000 in single
purchases;
= the number of single purchase transactions for productcategory P;
= the average number of trips saved per transaction forproduct category P.
The number of trips saved from online shopping episodes in which multipleproducts were purchased was calculated as the product of the number of suchtransactions and the average trips saved from these combination purchases.Originally, we had wanted to find a series of common purchase combinationsand sum the weighted average number of trips saved for these combinations.However, in our data sample, no such common purchase combinationsemerged, so we needed to use combined purchases as a single category. Hencethe calculation is as follows:
TCP2000 =
Where
TCP2000 = the number of trips saved in the year 2000 in
combination purchases;
= the number of combination purchase transactions in 2000;
= the average number of trips saved per transaction forcombined purchases in 2000.
In addition to the trips saved from making purchases online, the total numberof trips saved will include the number of trips saved from online shoppingwhen the purchase is made offline or no purchase is made. Calculation for tripssaved when the purchase is made offline occurs from the following equation:
TOLFP2000 =
SPPTr
SPPT
CPCP TTr ∗
CPTr
CPT
OLFPOLFP TTr ∗
The Model for Projecting Trip Savings
Mineta Transportation Institute
E-3
Where
TOFLP2000 = the number of trips saved from online shopping in
2000, when the purchase was made offline;
= the number of offline purchase transactions in 2000, whenshopping was done online;
= the average number of trips saved per transaction foroffline purchases in 2000.
The number of offline purchase transactions resulting from online shoppingcannot be derived directly from either secondary data or survey data.Accordingly, an additional calculation must be made based on the dataavailable. This calculation is shown beginning on page 5.
Some consumers will decide not to purchase anything based on their onlineshopping experience. Considering that they would have made physical trips tostores, with the same results, had they not shopped online, trips are saved inthis mode as well. The expression for calculating trips saved when no purchaseis made at all is as follows:
TNOP2000 =
Where
TNOP2000 = the number of trips saved from online shopping in
2000, when no purchase was made.
= the number of online shopping sessions resulting in nopurchases, but in which trips were saved, in 2000;
= the average number of trips saved per nonpurchase onlineshopping session in 2000.
Just as TOFLP2000 cannot be derived directly from secondary data or the
survey sample, neither can we directly derive TNOP2000. The calculation to
OLFPTr
OLFPT
NOPNOP TTr ∗
NOPTr
NOPT

The Model for Projecting Trip Savings
Mineta Transportation Institute
E-4
derive the number of online sessions resulting in no purchase, yet savingphysical trips, is shown beginning on page E-5.
Calculation of the Number of Transactions Made Online in 2000
The simple equation for estimating trip savings in 2000 requires thedetermination of the number of transactions made by online shoppers.Furthermore, it requires the separation of these transactions into transactions inwhich single items were purchased and transactions—sessions, really—involving the purchase of multiple items. As explained in the “Methodology”section, trip savings for these two types of occurrences are different enoughthat we wish to treat them separately. Given the projections from eMarketer oftotal dollars spent in online purchases, and given the data collected in oursurvey, we can obtain an estimate of the number of both single-purchasetransactions and combination-purchase transactions. The equation forcalculating the estimate of the single-purchase transactions is shown first.
=
Where
= the number of single-purchase transactions for productcategory P;
= the sum of dollars spent on single purchases for productcategory P in the survey sample;
= the dollars spent on all online transactions in the surveysample;
= the dollars spent on all online transactions in 2000, estimatedby eMarketer;
= the average dollar amount spent on a single purchase in
product category P in the sample survey.
The estimation of the number of combination-purchase transactions is asfollows:
SPPTr ÷
��
�
�
��
�
�S
ST
sSP
SPPD
SPPTr
SPPS
ST
S
SPPD

The Model for Projecting Trip Savings
Mineta Transportation Institute
E-5
=
Where
= the number of combination purchase transactions in 2000;
= the dollars spent on combination purchases in the surveysample;
= the dollars spent on all online transactions in the surveysample;
= the dollars spent on all online transactions in 2000, estimatedby eMarketer.
= the average dollar amount spent on a combination purchasein the survey sample.
Calculation for Trip Savings from Online Shopping Resulting in OfflinePurchases or in No Purchases
Just as the number of transactions for online purchases was estimated, thenumber of sessions resulting in offline purchases or no purchase whatsoeverneeds to be estimated. For this calculation, the first survey data were used. Itwas assumed that the survey sample would produce the same proportion ofsessions leading to offline purchases or no purchases as the proportions thatoccurred in the population as a whole. Accordingly, the calculation of theseproportions is as follows, starting with the proportion of total sessions leadingto offline purchases.
=
Where
CPTr ÷��
�
�
��
�
�S
ST
sCP
DCP
CPTr
CPS
ST
S
DCP
OLFPTr( )
�� �
�
��
�
�+�
P
n1,
SPP
CP
Sample
OLFPSample TrTr
Tr
Tr

The Model for Projecting Trip Savings
Mineta Transportation Institute
E-6
= the number of offline purchase transactions in 2000, whenshopping was done online;
= the number of offline purchase transactions, whenshopping was done online, in the survey sample;
= the total number of transactions in the survey sample,that is, the total number of respondents (after removingoutliers);
= the total number of online transactions in 2000,derived from the eMarketer projections.
Similarly, the calculation of the number of shopping sessions resulting in nopurchase is shown below.
=
Where
= the number of online shopping sessions in 2000, whenshopping resulted in no purchase at all;
= the number of online shopping sessions, when shoppingresulted in no purchase at all, in the survey sample;
= the total number of transactions in the survey sample,that is, the total number of respondents (after removingoutliers);
= the total number of online transactions in 2000,derived from the eMarketer projections.
OLFPTr
OFLPSampleTr
SampleTr
�+ P
n1,
SPP
CP TrTr
NOPTr( )
��
�
�
��
�
�+�
P
n1,
SPP
CP
Sample
NOPSample TrTr
Tr
Tr
NOPTr
NOPSampleTr
SampleTr
�+ P
n1,
SPP
CP TrTr

The Model for Projecting Trip Savings
Mineta Transportation Institute
E-7
CALCULATION FOR TRIP SAVINGS FROM ONLINE SHOPPING,PROJECTED TO 2004
Calculation of trip savings for 2004 involves finding trip savings by adoptercategories, for both single-product and combination purchases, and adjustingfor an assumed distribution of adopter categories in 2004. The main equationis:
TS2004 = TInnov2004 + TEarly
2004 + TLate2004 + TLagr
2004 + TOFLP2004
+ TNOP2004
Where
TS2004 = the number of trips saved in the year 2004 resulting fromonline shopping activity;
TInnov2004 = the number of trips saved in 2004 by Innovators in
making online purchases;
TEarly2004 = the number of trips saved in 2004 by Early Adopters in
making online purchases;
TLate2004 = the number of trips saved in 2004 by Late Adopters in
making online purchases;
TLagr2004 = the number of trips saved in 2004 by Laggards in
making online purchases;
TOFLP2004 = the number of trips saved from online shopping in
2004, when the purchase was made offline;
TNOP2004 = the number of trips saved from online shopping in
2004, when no purchase was made.
The calculation of trips saved in all the adopter categories is broken down intotrips saved in single purchases and in combination purchases. It was expectedthat the distribution of adopter categories would be skewed toward earlieradopters in 2000. The data proved this to be true. It was then assumed that thenumbers of buyers from each of the adopter categories would shift to a normaldistribution, as posited by Rogers in his work on the diffusion of innovations.1

The Model for Projecting Trip Savings
Mineta Transportation Institute
E-8
It was further assumed that the purchasing behavior—the transactions perperson, the expenditure per transaction, and the distribution between singlepurchases and combination purchases—would remain the same in 2004 as itwas in 2000. Accordingly, the calculation of trips saved for each adoptercategory is as follows:
TCat a2004 = TCat a
SP2004 + TCat aCP2004
Where
TCat a2004 = the number of trips saved in the year 2004 in Adopter
Category A in making online purchases;
TCat aSP2004 = the number of trips saved in the year 2004 in
Adopter Category A making online single purchases;
TCat aCP2004 = the number of trips saved in the year 2004 in
Adopter Category A making online combinationpurchases.
The number of trips saved for single purchases in Adopter Category A, then, isan adjustment from trips saved in 2000 for single purchases in the category, asshown below. The number of trips saved for combination purchases inCategory A is calculated in the same way.
TCat aSP2004 = *
Where
TCat aSP2004 = the number of trips saved in the year 2004 in
Adopter Category A making online single purchases;
= the number of single-purchase online transactions in theyear 2004 in Adopter Category A;
1 Rogers, Everett M. Diffusion of Innovations, 4th ed., New York: Free Press, 1995.
CatASP2004Tr CatA
SP2000T
CatASP2004Tr

The Model for Projecting Trip Savings
Mineta Transportation Institute
E-9
= the average number of trips saved per single-purchasetransaction in the year 2000 in Adopter Category A,calculated from Survey B.
While the average number of trips saved per transaction for type of purchase(single or combination) is taken directly from Survey B, the number of onlinetransactions must be calculated. The calculation is shown below, done forsingle-purchase transactions in Adopter Category A. The dollars spent pertransaction are assumed to be the same in 2004 as they were in 2000.
= *
Where
= the number of single-purchase online transactions in the
year 2004 in Adopter Category A;
= the total dollars spent in online, single-purchase
transactions in the year 2004 in Adopter Category A;
= average dollars spent per single-purchase transaction in
the year 2000 in Adopter Category A, calculated fromSurvey B.
The total dollars spent by Adopter Category A on single purchases, of course,must be estimated as well, since eMarketer does not provide such data.eMarketer does provide the total dollars anticipated to be spent in onlinepurchases in 2004. We need to estimate the proportion of this total expenditurethat will be spent on each type of purchase in each Adopter Category. As in theabove equations, the calculation shown below is for the single-purchasetransactions in Adopter Category A.
= *
Where
= the total dollars spent in online, single-purchase
transactions in the year 2004 in Adopter Category A;
CatASP2000T
CatASP2004Tr CatA
SP2004S DSP2000CatA
CatASP2004Tr
CatASP2004S
DSP2000CatA
CatASP2004S CatA
20042000C ∅ 2004S
CatASP2004S

The Model for Projecting Trip Savings
Mineta Transportation Institute
E-10
= the conversion factor, translating proportion of single
purchases, Adopter Category A, in the 2000 survey to itsassumed proportion in the year 2004;
= the dollars spent on single purchase transactions in theyear 2004 as estimated by eMarketer.
CatA20042000C ∅
2004S