effects of offshore wind farm noise on marine mammals and · pdf fileeffects of offshore wind...
TRANSCRIPT

Effects of offshore wind farm noise on marine mammals and fish
Frank Thomsen, Karin Lüdemann, Rudolf Kafemann and Werner Piper
July 06, 2006
This report has been funded by COWRIE Ltd

Effects of offshore wind farm noise on marine mammals and fish
ii
© COWRIE Ltd
This publication (excluding the logos) may be re-used free of charge in any format or medium. It may only be re-used accurately and not in a misleading context. The material must be acknowledged as biola copyright and use of it must give the title of the source publication. Where third party copyright material has been identified, further use of that material requires permission from the copyright holders concerned.
Preferred way to cite this report: Thomsen, F., Lüdemann, K., Kafemann, R. and Piper, W. (2006). Effects of offshore wind farm noise on marine mammals and fish, biola, Hamburg, Germany on behalf of COWRIE Ltd.
Copies available from: www.offshorewind.co.uk E-mail: [email protected]
Contact details:
Dr. Frank Thomsen and Werner Piper
biola (biologisch-landschaftsökologische arbeitsgemeinschaft) Gotenstraße 4 D –20097 Hamburg Germany [email protected] [email protected] Karin Lüdemann and Dr. Rudolf Kafemann
IfAF – Institut für angewandte Fischbiologie GmbH [email protected] [email protected] http://www.fischbiologie.de

Effects of offshore wind farm noise on marine mammals and fish
iii
Table of Contents
Page
LIST OF TABLES AND FIGURES .....................................................................................4 EXECUTIVE SUMMARY ..................................................................................................5 GLOSSARY ....................................................................................................................6 ACRONYMS ...................................................................................................................7 1. INTRODUCTION ...................................................................................................8 2. MEASUREMENT UNITS: DB-ISSUES ......................................................................9 3. WIND FARM RELATED NOISE .............................................................................11
3.1 CONSTRUCTION NOISE............................................................................................11 3.2 OPERATIONAL NOISE ..............................................................................................12 3.3 SHIP NOISE ........................................................................................................13
4. AMBIENT NOISE.................................................................................................13 5. PROPAGATION MODEL .......................................................................................14 6. MARINE MAMMALS AND WIND FARM NOISE ......................................................17
6.1 INTRODUCTION ....................................................................................................17 6.2 HEARING IN HARBOUR PORPOISES...............................................................................17 6.3 HEARING IN HARBOUR SEALS ....................................................................................19 6.4 EFFECTS OF CONSTRUCTION NOISE..............................................................................19
6.4.1 Audibility ....................................................................................................19 6.4.2 Masking .....................................................................................................22 6.4.3 Responsiveness ...........................................................................................23 6.4.4 Temporary threshold shift .............................................................................26 6.4.5 Severe injury ..............................................................................................28
6.5 EFFECTS OF OPERATIONAL NOISE ................................................................................28 6.6 EFFECTS OF SHIP NOISE ..........................................................................................30 6.7 IMPLICATIONS FOR OTHER CETACEAN SPECIES .................................................................31
7. FISH AND WIND FARM NOISE ............................................................................35 7.1 INTRODUCTION ....................................................................................................35 7.2 HEARING IN FISH ..................................................................................................35 7.3 TARGET SPECIES...................................................................................................36 7.4 EFFECTS OF CONSTRUCTION NOISE..............................................................................38
7.4.1 Audibility ....................................................................................................38 7.4.2 Masking .....................................................................................................40 7.4.3 Responsiveness ...........................................................................................41 7.4.4 Temporary threshold shift .............................................................................43 7.4.5 Severe injury ..............................................................................................44
7.5 EFFECTS OF OPERATIONAL NOISE ................................................................................45 7.6 EFFECTS OF SHIP NOISE ..........................................................................................48
8. MITIGATION MEASURES ....................................................................................49 9. CONCLUSIONS ...................................................................................................50 10. ACKNOWLEDGEMENTS .......................................................................................51 11. REFERENCES ......................................................................................................51 12. APPENDIX ..........................................................................................................60

Effects of offshore wind farm noise on marine mammals and fish
4
List of Tables and Figures
Table 1: Thresholds for mild behavioural reactions to received noise levels in harbour porpoises and received sound pressure levels at 20 km distance from an impact pile-driver ............24
Table 2: Summary of recent studies looking at behavioural response in cetaceans.................25 Table 3: 1/ 3 octave sound pressure levels of ship noise at different distances from the source
calculated after Thiele (2002)...................................................................................31 Table 4: Results of TTS studies in fish . ...........................................................................44 Table 5: Input data for the calculation of audibility ranges for cod and herring .....................47 Table 6: Measurement values during pile-driving of the FINO1-platform ..............................60 Table 7: Measurement values during operation of one turbine at Utgrunden wind farm ..........61 Table 8: Overview of the results of hearing studies in harbour porpoises ..............................62 Table 9: Underwater hearing thresholds of a harbour seal . ................................................62
Figure 1. Waveform of a simple sine-wave with scale for different measurement units ............ 9 Figure 2. Waveform of a impact-pile pulse .......................................................................11 Figure 3. Frequency spectrum of ramming pulses .............................................................12 Figure 4: Operational noise in of an offshore wind turbine ..................................................13 Figure 5: Ambient noise levels measured at 5 different locations in the North Sea at wind-
speeds 3-8 ms .......................................................................................................14 Figure 6: Transmission loss at distances 10 – 10,000 m calculated with different models........15 Figure 7: Zones of noise influence ..................................................................................17 Figure 8: Audiograms of the harbour porpoise ..................................................................18 Figure 9: Audiograms of the harbour seal ........................................................................19 Figure 10: Attenuation of pile-driving noise in different distances from the source, background
noise levels at wind-speeds of 3-8 m/s and audiogram of the harbour porpoise and the harbour seal ..........................................................................................................20
Figure 11: Some factors affecting responsiveness in marine mammals.................................23 Figure 12: Attenuation of impact pile-driving noise at 1 km distance from the source compared
with the audiogram of the harbour porpoise ...............................................................27 Figure 13: Sound pressure levels of an offshore wind farm pile in operation in different
distances from the source compared to the audiogram of harbour porpoises and harbour seals and background noise .....................................................................................29
Figure 14: Exemplary audiograms of odontocete species....................................................32 Figure 15: Audiograms of Atlantic salmon, Atlantic cod, Atlantic herring and dab...................37 Figure 16: Attenuation of pile-driving noise in different distances from the source, background
noise levels at moderate wind-speeds, and audiograms of target fish species ..................39 Figure 17: Attenuation of operational noise in different distances from the source, background
noise levels at wind-speeds, and audiogram of target fish species..................................46

Effects of offshore wind farm noise on marine mammals and fish
5
Executive Summary Since the beginning of the planning and installation of offshore wind farms, the possible impacts on marine mammals and fish have been discussed intensively within the public and the scientific community. Especially the noise created during pile-driving operations involves sound pressure levels that are high enough to impair the hearing system of marine mammals near the source and disrupt their behaviour at considerable distance from the construction site. Previous investigations also indicated that the construction phase will have considerable effects on fish species common in northern European waters. The goal of this study was to provide a further assessment on the effects of offshore wind farm related noise on selected marine mammal and fish species. Measurements of pile-driving noise were obtained as peak sound pressure levels and sound exposure levels in 1/3 octave bands from a jacket-pile construction in the German Bight. Operational noise was measured in peak sound pressure levels and equivalent sound pressure levels in 1/3 octave bands in 110 m distance from a 1.5 MW turbine in Sweden. Based on these measurements, sound levels at various distances from the source were calculated and zones of noise influences were assessed based on published data. The broadband peak sound pressure level during pile-driving was 189 dB0-p re 1 µPa (SEL = 166 dB re 1 µPa2 . s) at 400 m distance, resulting in a peak broadband source level of 228 dB0-p
re 1 µPa at 1 m (SEL = 206 dB re 1 µPa2 . s at 1 m). The 1/3 octave sound pressure level was highest at 315 Hz (peak = 218 dB0-p re 1 µPa at 1 m) with considerable pressures above 2 kHz. Values for the impact assessment were extrapolated for larger pile-diameters after recent measurements performed in the same area. During operation, the 1/3 octave sound pressure levels ranged between < 90 and 142 dBLeq re 1 µPa at 1m with most energy at 50, 160 and 200 Hz, at wind-speeds of 12 m/s. For harbour porpoises and harbour seals, the zone of audibility for pile-driving will most certainly extend well beyond 80 km, perhaps hundreds of kilometres from the source. Behavioural responses are possible over many kilometres, perhaps up to ranges of 20 km. Masking might occur in harbour seals at least up to 80 km and hearing loss might be a concern – on the basis of a regulatory approach - at 1.8 km in porpoises and 400 m in seals. Further, severe injuries in the immediate vicinity of ramming activities can not be ruled out. Operational noise of smaller turbines of 1.5 MW should have only minor influence as the detection radii for both species are rather small. However, since operational noise of larger turbines can not be assessed reliably yet, these results are rather preliminary. It is very likely that larger turbines are noisier resulting in much larger zones of noise influence. Cod and herring will be able to perceive piling noise at large distances, perhaps up to 80 km from the sound source. Dab and salmon might detect pile-driving pulses also at considerable distances from the source. However, since both species are predominantly sensitive for particle motion and not pressure, the detection radius can not be defined yet. Behavioural effects are possible due to piling noise. The spatial extension of the zone of responsiveness can not be calculated, as the available threshold levels vary greatly. The zone of potential masking might in some cases coincides with the zone of audibility. Also physical effects, like internal or external injuries or deafness (TTS/PTS) up to cases of mortality, are possible in the close vicinity to pile-driving. Operational noise of wind turbines will be detectable up to a distance of app. 4 km for cod and herring, and probably up to 1 km for dab and salmon. Within this zone, also masking of intraspecific communication is possible. Behavioural and/or physiological (stress) effects are possible due to operational wind farm noise. However, they should be restricted to very close-ranges. Mitigation measures should include both the source and the receiver. Promising measures include a combination of acoustic isolation of the ramming pile, ramp-up procedures and acoustic deterrent devices.
Effects of offshore wind farm noise on marine mammals and fish
6
Glossary
Absorption. Conversion of sound into heat.
Ambient noise. Background noise in the environment without distinguishable sources.
Attenuation. Decrease of sound pressure levels / acoustic energy.
Audiogram. Graph showing the absolute auditory threshold versus frequency.
Auditory brainstem response. A method of measuring hearing by placing electrodes on the head to record the electrical activity in the brain when sound occurs.
Auditory threshold (Hearing threshold). Minimum sound level that can be perceived by an animal in the absence of background noise.
Bandwidth. Range of frequencies of a given sound.
Critical band. Frequency band within which ambient- / background noise has strong effects on detection of a sound at a particular frequency.
Cylindrical spreading. Sound spreading for cylindrical waves. Given by 10 log (r), with r being range.
Decibel (dB). The logarithmic measure of sound intensity / pressure. The decibel value for sound pressure is 20 log10 (P / P0) with P = actual pressure and P0 = reference pressure.
Duty cycle. Percent of a time a given event occurs. A 1 s long tone with silent intervals of 1 s has a duty cycle of 50 %.
Hertz. The unit for frequency where 1 Hz = 1 cycle per second. One Kilohertz (kHz) are 1,000 cycles per second.
Impulsive sound. Transient signals emitted in brief sequences (pulses) with short duration and often high peak sound pressure levels.
Masking. Obscuring of sounds of interest by interfering sounds at similar frequencies.
Micro Pascal (µPa). Reference pressure for underwater sound. 1 µPa = 10-5 µbar.
Octave band. Interval between two discrete frequencies having a frequency ratio of two.
One-third-octave-band. Interval of 1/3 of an octave. Three adjacent 1/3 octave bands span one octave.
Pascal. Unit of pressure equal to one Newton per square metre.
Permanent threshold shift. A permanent elevation of the hearing threshold due to physical damage to the sensory hair cells of the ear.
Propagation loss (Transmission loss). Loss of sound power with increasing distance.
Pulse. A transient sound having a finite duration.
Rise time. Time needed to go from zero to maximum sound pressure.
Source level. Acoustic pressure at a standard reference distance of 1 m. Unit in dB re 1 µPa at 1 m (sometimes given as: @ 1m).
Sound pressure level. Expression of the sound pressure in decibel (dB)
Spherical spreading. Sound spreading for spherical waves. Given by 20 log (r), with r being range.
Temporary threshold shift (TTS). Temporal and reversible elevation of the auditory threshold.

Effects of offshore wind farm noise on marine mammals and fish
7
Waveform. Graph showing the oscillations of a sound wave (in Pa or mV/V over time).
White noise. Noise for which the spectrum density is independent of frequency over a specified range.
Ultrasonic. Sound with frequencies too high to be audible to humans (~ > 20 kHz).
Acronyms
dB Decibel
deg Degrees
Hz Hertz
ht Hearing threshold
kHz Kilohertz
km Kilometre
Leq Equivalent sound pressure level
Lpeak Peak sound pressure level
m Metre
MW Megawatt
MV Millivolt
ms Milliseconds
m/s Metre per second
PTS Permanent threshold shift
rms Root-mean-square
s Seconds
SEL Sound exposure level
SL Source level
SPL Sound pressure level
TL Transmission loss
TTS Temporary threshold shift
V Volt
µPa Micropascal
Effects of offshore wind farm noise on marine mammals and fish
8
1. Introduction The increased development of renewable energy has led to construction of offshore wind farms with high-powered turbines generating electrical power of several megawatts. In Europe, there are currently 17 maritime wind farms in operation with a combined power of 570 MW and many more are being planned, especially in the shallow coastal zones of northern Europe (e.g. off Great Britain, Netherlands, Germany and Denmark). Since the beginning of the planning and installation of offshore wind farms, the possible impacts on the marine environment, especially on marine mammals, have been discussed intensively within the public and the scientific community. The most important possible adverse effect of offshore wind farms relates to the underwater noise generated during the construction and operation of wind turbines. The most common cetacean species in European waters, the harbour porpoise, relies heavily on sound for orientation and foraging and is among the most acoustically sensitive cetacean species (Au et al. 1999a; Kastelein et al. 2002; Teilmann et al. 2002; Verfuss et al. 2005). Another common inhabitant of European waters, the harbour seal, communicates with low-frequency calls when diving and has a well developed underwater hearing system (Riedmann 1990; Kastak and Schustermann 1998). Especially the noise created during pile-driving operations involves sound pressure levels that are high enough to impair the hearing system of both species near the source and disrupt their behaviour at considerable distance from the construction site (Nedwell et al. 2003a; Nedwell and Howell 2004; Tougaard et al. 2003a, 2005; Madsen et al. 2006; Thomsen et al. 2006). Operational noise is less powerful than pile-driving noise but might have the potential to disrupt behaviours over distances of several hundred metres from the pile (Koschinski et al. 2003; Madsen et al. 2006). The effects of offshore wind farm related noise on fish have also received some attention and it is thought that at least the construction phase will have considerable effects on species common in northern European waters such as salmon, cod and several flatfish species (Nedwell et al. 2003a). Operational noise is expected to be audible to herring and cod over several kilometres and might mask potential communicative signals over considerable distances (Wahlberg and Westerberg 2005). Here, we present our own assessment on the effects of offshore wind farm related noise on marine mammals and fish. We were particularly interested in obtaining data from construction and operation that would be representative for planned sites. We also aimed at measurements in frequencies relevant for the hearing of selected marine mammal and fish species. For that, we teamed up with colleagues from the ‘Institut für theoretische und angewandte Physik’ (ITAP, Oldenburg, Germany) who supplied measurements obtained recently in Germany and Sweden (ITAP 2005). Based on these measurements, we will calculate zones of noise influences and also investigate frequency dependent disturbances. As we go along we will also critically review what is written on the subject so far. Finally, we will discuss mitigation measures and suggest those, that are – in our view - most promising.

Effects of offshore wind farm noise on marine mammals and fish
9
2. Measurement units: dB-issues The sound pressure level (SPL) of a sound of pressure P is given in decibels (dB) by:
SPL (dB) = 20 log10 (P/P0) where P0 is the reference pressure. The reference pressure in underwater acoustics is defined as 1 µPa. Doubling the pressure of a sound leads to a 6 dB increase in sound pressure level. A waveform of a simple sine-pressure-wave is shown in Figure 1. Pressure (in Pa from negative to positive) is given on the y-axis and time on the x-axis. It can be seen that the sound-wave oscillates rhythmically around the zero-line with one full cycle being 50 ms in duration.
Figure 1. Waveform of a simple sine-wave with scale for different measurement units.
As can be seen in Figure 1, the dB-values can be measured in several units:
1. ‘Peak-to-peak’ (peak-to peak) - dBp-p : pressure from the lowest to the highest point of the waveform.
2. ‘Zero-to-peak’ (peak)– dB0-p : pressure from zero to the highest point of the waveform. 3. ‘Root-mean-square-pressure level (RMS) – dBrms : Root of the mean squared pressures
divided by the duration of the signal. 4. ‘Equivalent-sound-pressure-level (Leq / Leq) – dBeq / dBLeq : Sound level averaged to
integration time T. 5. ‘Sound-exposure-level (SEL) – dBAE / dBSEL : Sound level averaged to 1 s. Often termed
‘energy flux density level’.
Looking at Figure 1, it can be derived that for this simple sine-wave (signal duration ~ 100 ms) SEL < RMS < 0-p < p-p. For a sine-wave with duration of more than 1 s, the SEL-value will be higher than the RMS-level. Peak values refer to the amplitude of a given sound and are not time-dependent as the other values. They are suited for the description of short impulsive sounds such as airguns or pile- driving pulses. RMS values are very often used since the intensity of the sound is averaged over its duration1. In hearing studies, very often sine-wave tones are used and they are most commonly given as RMS values, hence the detection threshold of the subject under
1 RMS values are computed using different temporal definitions relating to the shape of the waveform (for details see Madsen 2005).

Effects of offshore wind farm noise on marine mammals and fish
10
investigation is also given as dBrms. Leq-values are averaged over T, for example 60 s, and are suited for the description of continuous sounds with varying amplitude. For transient signals, Leq-values may incorporate silent periods between signal blocks (e.g. Kastelein et al. 2005). SEL-values are calculated by measuring the sound energy of an event with reference to a duration of 1 s. In other words: the SEL is the sound level which, if lasting for one second, would deliver the same amount of acoustical energy as that delivered over the measurement period. SEL’s are also sometimes referred to as ‘energy flux density levels´. Their unit is given in dB re 1 µPa2 .s. As can be derived from Figure 1, the values of the different dB units can vary greatly for any given sound. Unfortunately, researchers often don’t state what dB value they use which makes comparisons between studies sometimes difficult (see discussion by Richardson et al. 1995). For a continuous sine-wave, the RMS value is the peak value minus 3 dB and the peak-to-peak value minus 9 dB. For transient / impulsive signals, dB-values are not that readily convertible. For example, peak-to-peak values of airguns were 28 dB higher than the Leq values and 15 dB higher than the RMS values (McCauley et al. 2000). If noise levels are to be compared to the audiogram of the species in question, both should be given in the same unit, for example as RMS values. However, there are problems in using RMS pressure levels for transients as a stand-alone measure as this value is strongly affected by the time interval used for the measurements (Madsen 2005). Finally, in biological hearing systems, noise is integrated over several frequency filters, called the critical bands. The width of the filter is app. 1/3 – 1/12 of an octave with Q (the bandwidth of the filter divided by the centre frequency) being relatively constant for most species investigated (Fay 1991; Richardson et al. 1995; Southall et al. 2000; Erbe and Farmer 2002; Erbe 2002; Frisk et al., 2003; Southall et al. 2003; Wahlberg and Westerberg 2005; Madsen et al. 2006). For the sake of simplicity and in accordance with other studies (e.g. Madsen et al. 2006), noise measurements are given as 1/3 octave levels:2 Following measurement units were used: Pile-driving noise was measured as sound exposure- and peak-level (dB0-p) in 1/3 octave bands at 400 m distance from the source (ITAP 2005). The corresponding RMS values were derived from the SEL-values using following equation:
RMS = SEL + 10 log (T1/T2) where T1 = 1 s (reference duration for SEL values) and T2 = duration of the pile-driving pulse, in our case 50 ms (see below). After this formula, RMS values could be derived by adding 13 dB to the corresponding SEL values. The differences between the RMS values and the Peak values were between 6 and 12 dB, depending on frequency. Operational noise was measured at 110 m distance as equivalent sound pressure levels in 1/3 octave bands (T = 1 min; ITAP 2005).
Source levels of both construction and operational noise were back-calculated to 1 m by a transmission loss formula, developed by Thiele (2002; see below). The same formula was used in the calculation of transmission loss for several distances.
2 It should be noted that the use of 1/3 octave bands is only a first approximation of critical bands. As we progress, we will also review studies performed on the target species and discuss their implications for our assessment.
Effects of offshore wind farm noise on marine mammals and fish
11
3. Wind farm related noise
3.1 Construction noise
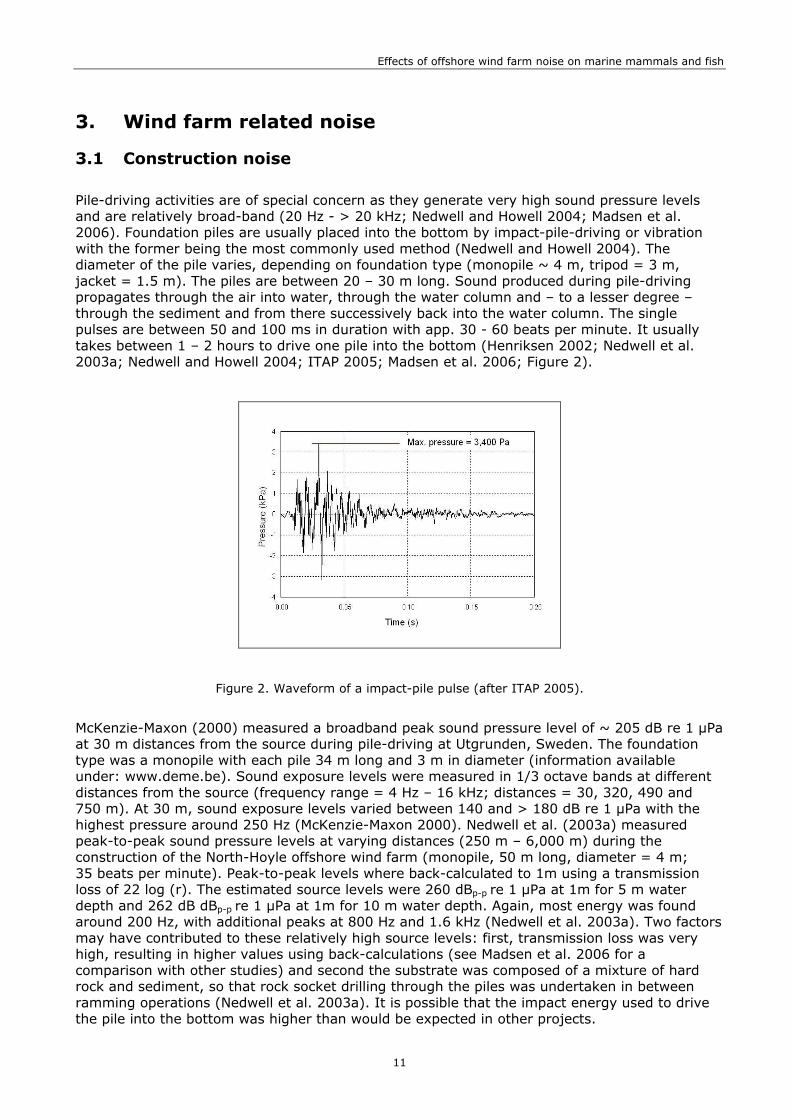
Pile-driving activities are of special concern as they generate very high sound pressure levels and are relatively broad-band (20 Hz - > 20 kHz; Nedwell and Howell 2004; Madsen et al. 2006). Foundation piles are usually placed into the bottom by impact-pile-driving or vibration with the former being the most commonly used method (Nedwell and Howell 2004). The diameter of the pile varies, depending on foundation type (monopile ~ 4 m, tripod = 3 m, jacket = 1.5 m). The piles are between 20 – 30 m long. Sound produced during pile-driving propagates through the air into water, through the water column and – to a lesser degree – through the sediment and from there successively back into the water column. The single pulses are between 50 and 100 ms in duration with app. 30 - 60 beats per minute. It usually takes between 1 – 2 hours to drive one pile into the bottom (Henriksen 2002; Nedwell et al. 2003a; Nedwell and Howell 2004; ITAP 2005; Madsen et al. 2006; Figure 2).
Figure 2. Waveform of a impact-pile pulse (after ITAP 2005).
McKenzie-Maxon (2000) measured a broadband peak sound pressure level of ~ 205 dB re 1 µPa at 30 m distances from the source during pile-driving at Utgrunden, Sweden. The foundation type was a monopile with each pile 34 m long and 3 m in diameter (information available under: www.deme.be). Sound exposure levels were measured in 1/3 octave bands at different distances from the source (frequency range = 4 Hz – 16 kHz; distances = 30, 320, 490 and 750 m). At 30 m, sound exposure levels varied between 140 and > 180 dB re 1 µPa with the highest pressure around 250 Hz (McKenzie-Maxon 2000). Nedwell et al. (2003a) measured peak-to-peak sound pressure levels at varying distances (250 m – 6,000 m) during the construction of the North-Hoyle offshore wind farm (monopile, 50 m long, diameter = 4 m; 35 beats per minute). Peak-to-peak levels where back-calculated to 1m using a transmission loss of 22 log (r). The estimated source levels were 260 dBp-p re 1 µPa at 1m for 5 m water depth and 262 dB dBp-p re 1 µPa at 1m for 10 m water depth. Again, most energy was found around 200 Hz, with additional peaks at 800 Hz and 1.6 kHz (Nedwell et al. 2003a). Two factors may have contributed to these relatively high source levels: first, transmission loss was very high, resulting in higher values using back-calculations (see Madsen et al. 2006 for a comparison with other studies) and second the substrate was composed of a mixture of hard rock and sediment, so that rock socket drilling through the piles was undertaken in between ramming operations (Nedwell et al. 2003a). It is possible that the impact energy used to drive the pile into the bottom was higher than would be expected in other projects.

Effects of offshore wind farm noise on marine mammals and fish
12
Our assessment is based on measurements obtained by ITAP (2005) during the construction of the FINO-1 research platform off Eastern Frisia, Germany (Jacket-pile construction, diameter = 1.5 m per pile, sandy bottom, water depth ~ 30 m; 60 beats per minute). The estimated broadband peak source level was 228 dB0-p re 1 µPa @ 1m. More importantly, ITAP (2005) measured third-octave-sound levels as peak sound pressure levels and sound exposure levels directly at 400 m from the source, resulting in the spectrum shown in Figure 3. It can be seen that the sound pressure level was highest at the 125 Hz centre frequency (peak = 179.5 dB0-p re 1 µPa @ 1m) with additional maxima at 315 Hz and 1 kHz and considerable pressures above 2 kHz. It can also be seen that for every 1/3 octave band, the peak levels were about 20 dB higher than the corresponding sound exposure levels (for exact values see Table 6).
Frequency (kHz)0.0
30.0
40.0
50.0
60.0
8 0.10.120.1
6 0.20.250.3
1 0.4 0.50.63 0.8 1 1.2 1.6 2 2.53.1
5 4 5 6.3 8 1012.5 16 20
SPL
(dB
re 1
µPa)
110
120
130
140
150
160
170
180
190SEL 400 m Peak 400 m
Figure 3. Frequency spectrum (Third octave band level) of ramming pulses (FINO 1-platform; red = dB0-p re 1 µPa, blue = dBAE re 1 µPa; from ITAP 2005).
Sound pressure levels in impact pile-driving are depending on the length and diameter of the pile and the impact energy (Nedwell et al. 2003a). Betke (pers. comm.) and ITAP (2005) measured 1/3 octave-band sound pressure levels during impact pile-driving in an adjacent region to FINO-1 (Amrumbank-West). The pile had a diameter of 3.5 m and the impact-energy therefore was considerably higher than at FINO-1. The increase in sound pressure levels was between 3 and 20 dB for every 1/3 octave-band with a mean value of 10 dB (ITAP 2005; Betke pers. comm.). Since for most planned wind farms piles of a comparable diameter will be used, we added 10 dB to every 1/3 octave band value to arrive at a realistic model-sound pressure level.
3.2 Operational noise
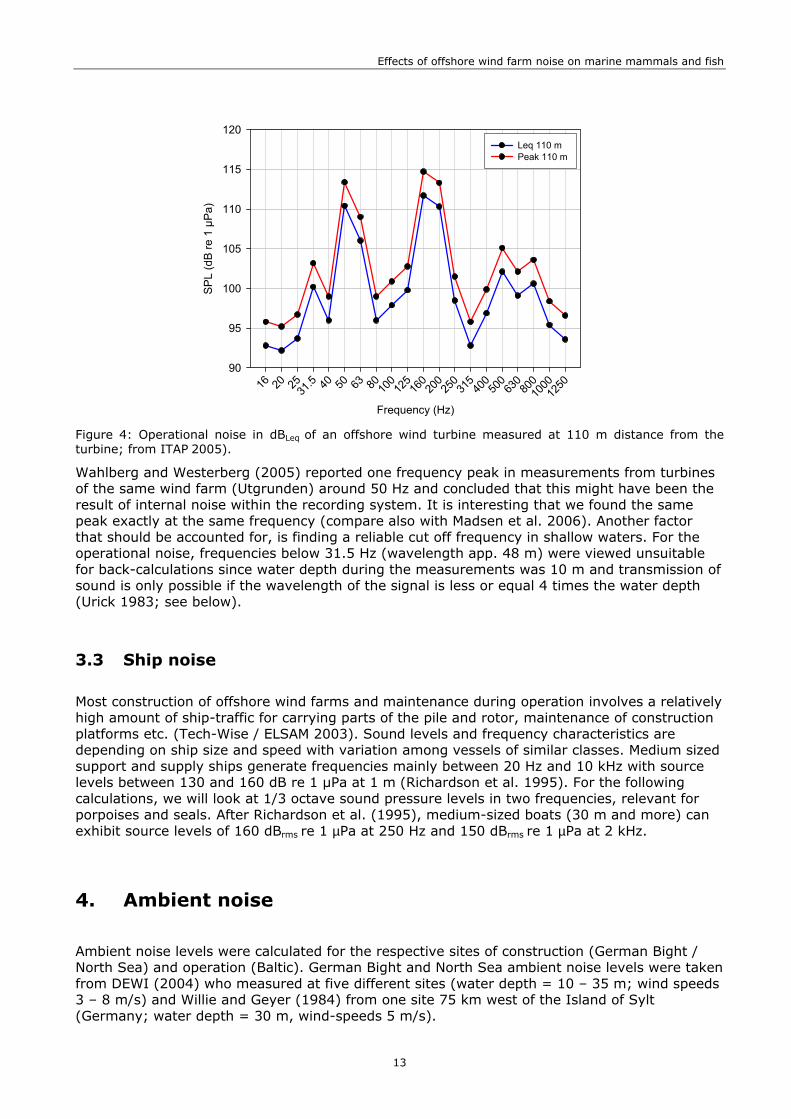
Noise during operation has been measured from single turbines (maximum power 2 MW) in Sweden and Denmark and has been found to be of much lower intensity than the noise during construction (review in Madsen et al. 2006). Our assessment is based on measurements that have been obtained by ITAP (2005) at 110 m distance during the operation of an offshore turbine in Utgrunden, Sweden (1.5 MW). At moderate-strong wind speeds of 12 m/s, the 1/3 octave sound pressure levels ranged between < 90 and 115 dBLeq re 1 µPa @ 1m with most energy at 50, 160 and 200 Hz (Figure 4, Table 7).
Effects of offshore wind farm noise on marine mammals and fish
13
Frequency (Hz)
16 20 2531.5 40 50 63 80 10
012
516
020
025
031
540
050
063
080
010
0012
50
SPL
(dB
re 1
µPa
)
90
95
100
105
110
115
120Leq 110 m Peak 110 m
Figure 4: Operational noise in dBLeq of an offshore wind turbine measured at 110 m distance from the turbine; from ITAP 2005).
Wahlberg and Westerberg (2005) reported one frequency peak in measurements from turbines of the same wind farm (Utgrunden) around 50 Hz and concluded that this might have been the result of internal noise within the recording system. It is interesting that we found the same peak exactly at the same frequency (compare also with Madsen et al. 2006). Another factor that should be accounted for, is finding a reliable cut off frequency in shallow waters. For the operational noise, frequencies below 31.5 Hz (wavelength app. 48 m) were viewed unsuitable for back-calculations since water depth during the measurements was 10 m and transmission of sound is only possible if the wavelength of the signal is less or equal 4 times the water depth (Urick 1983; see below).
3.3 Ship noise
Most construction of offshore wind farms and maintenance during operation involves a relatively high amount of ship-traffic for carrying parts of the pile and rotor, maintenance of construction platforms etc. (Tech-Wise / ELSAM 2003). Sound levels and frequency characteristics are depending on ship size and speed with variation among vessels of similar classes. Medium sized support and supply ships generate frequencies mainly between 20 Hz and 10 kHz with source levels between 130 and 160 dB re 1 µPa at 1 m (Richardson et al. 1995). For the following calculations, we will look at 1/3 octave sound pressure levels in two frequencies, relevant for porpoises and seals. After Richardson et al. (1995), medium-sized boats (30 m and more) can exhibit source levels of 160 dBrms re 1 µPa at 250 Hz and 150 dBrms re 1 µPa at 2 kHz.
4. Ambient noise
Ambient noise levels were calculated for the respective sites of construction (German Bight / North Sea) and operation (Baltic). German Bight and North Sea ambient noise levels were taken from DEWI (2004) who measured at five different sites (water depth = 10 – 35 m; wind speeds 3 – 8 m/s) and Willie and Geyer (1984) from one site 75 km west of the Island of Sylt (Germany; water depth = 30 m, wind-speeds 5 m/s).

Effects of offshore wind farm noise on marine mammals and fish
14
The 1/3 octave sound pressure levels were calculated from the spectrum density levels given in dB re 1µPa2 / Hz as:
1/3 octave sound pressure level = N0 (f) + 10log(0.23f)3
where N0 is the spectrum level and f represents the centre frequency of the corresponding 1/3 octave band (Wahlberg and Westerberg 2005; Madsen et al. 2006). As can be seen in Figure 5, ambient noise levels are between 85 and 115 dB re 1 µPa with most energy at frequencies < 100 Hz.
Data from the Baltic was taken from Betke et al. (2004) who measured 1/3 octave band equivalent sound pressure levels during wind-speeds of 3.5 m/s. For the assessment of operational noise, higher wind-speeds had to be considered, since measurements of turbine noise were taken at 12 m/s and ambient noise increases with wind-speed (Richardson et al. 1995). Therefore, the values were extrapolated from the ones at 3.5 m/s by adding 10 dB to every value. The resulting sound pressure levels agree well with other measurements from the Baltic at comparable wind-speeds (see Madsen et al. 2006; see Figure 13).
Frequency (kHz)
0.01 0.1 1 10
SP
L (d
B re
1 µ
Pa)
80
85
90
95
100
105
110
115
120
Figure 5: Ambient noise levels measured at 5 different locations in the North Sea at wind-speeds 3-8 ms (1/3 octave sound pressure levels in dBrms ; after DEWI 2004)
5. Propagation model As wind turbines are currently planned in relatively shallow waters up to 50 m water depth, transmission loss (TL) might be described by cylindrical spreading, with TL = 10 log (r), where TL = transmission loss and r = range in metres (Richardson et al. 1995). However, several field studies indicated a higher transmission loss in shallow waters, sometimes being higher than
3 This approach is - strictly speaking - only valid for white noise. However, since the ambient noise measurements by DEWI (2004) did not show spectral peaks, the calculation can be applied here for a first approximation of ambient noise levels in 1/3 octave bands.
Effects of offshore wind farm noise on marine mammals and fish
15
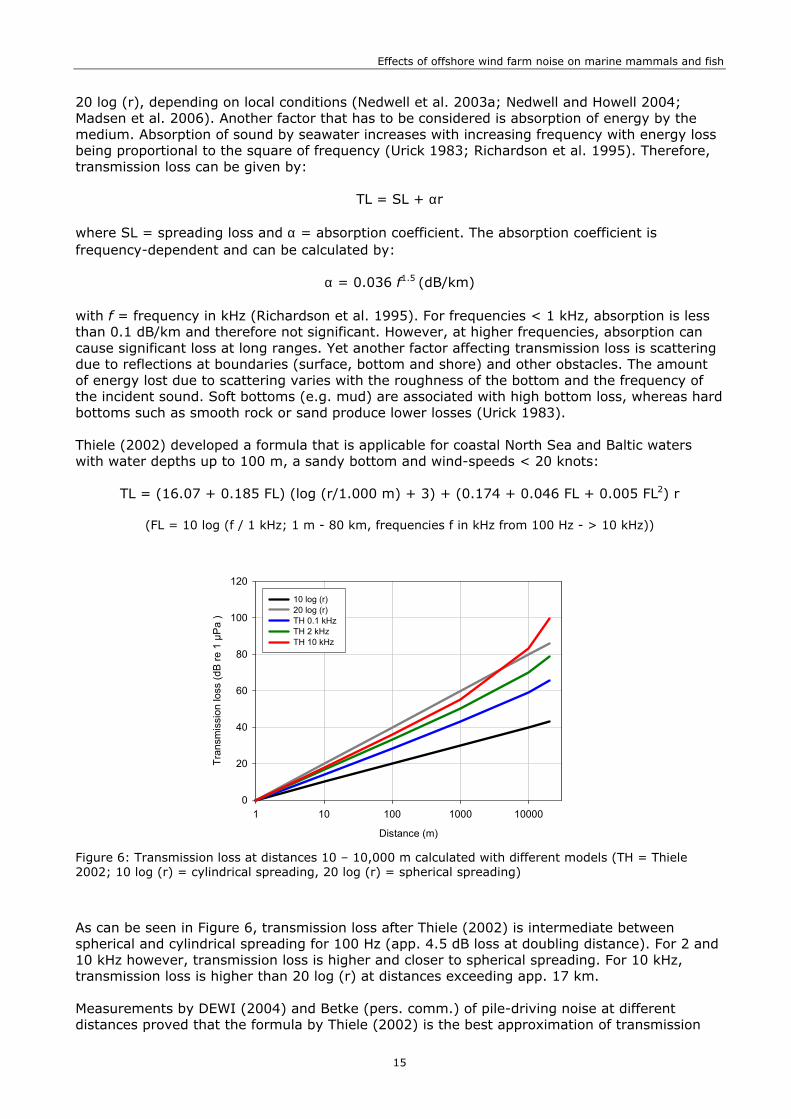
20 log (r), depending on local conditions (Nedwell et al. 2003a; Nedwell and Howell 2004; Madsen et al. 2006). Another factor that has to be considered is absorption of energy by the medium. Absorption of sound by seawater increases with increasing frequency with energy loss being proportional to the square of frequency (Urick 1983; Richardson et al. 1995). Therefore, transmission loss can be given by:
TL = SL + αr where SL = spreading loss and α = absorption coefficient. The absorption coefficient is frequency-dependent and can be calculated by:
α = 0.036 f1.5 (dB/km) with f = frequency in kHz (Richardson et al. 1995). For frequencies < 1 kHz, absorption is less than 0.1 dB/km and therefore not significant. However, at higher frequencies, absorption can cause significant loss at long ranges. Yet another factor affecting transmission loss is scattering due to reflections at boundaries (surface, bottom and shore) and other obstacles. The amount of energy lost due to scattering varies with the roughness of the bottom and the frequency of the incident sound. Soft bottoms (e.g. mud) are associated with high bottom loss, whereas hard bottoms such as smooth rock or sand produce lower losses (Urick 1983). Thiele (2002) developed a formula that is applicable for coastal North Sea and Baltic waters with water depths up to 100 m, a sandy bottom and wind-speeds < 20 knots:
TL = (16.07 + 0.185 FL) (log (r/1.000 m) + 3) + (0.174 + 0.046 FL + 0.005 FL2) r
(FL = 10 log (f / 1 kHz; 1 m - 80 km, frequencies f in kHz from 100 Hz - > 10 kHz))
Distance (m)
1 10 100 1000 10000
Tran
smis
sion
loss
(dB
re 1
µP
a )
0
20
40
60
80
100
120
10 log (r) 20 log (r) TH 0.1 kHz TH 2 kHz TH 10 kHz
Figure 6: Transmission loss at distances 10 – 10,000 m calculated with different models (TH = Thiele 2002; 10 log (r) = cylindrical spreading, 20 log (r) = spherical spreading)
As can be seen in Figure 6, transmission loss after Thiele (2002) is intermediate between spherical and cylindrical spreading for 100 Hz (app. 4.5 dB loss at doubling distance). For 2 and 10 kHz however, transmission loss is higher and closer to spherical spreading. For 10 kHz, transmission loss is higher than 20 log (r) at distances exceeding app. 17 km. Measurements by DEWI (2004) and Betke (pers. comm.) of pile-driving noise at different distances proved that the formula by Thiele (2002) is the best approximation of transmission

Effects of offshore wind farm noise on marine mammals and fish
16
loss for shallow North Sea and Baltic waters. DEWI (2004) measured a transmission loss of 4.5 dB per distance doubling (= 15 log (r)) for broadband pile-driving signals in the Mecklenburg Bight (Baltic Sea). Betke (pers. comm.) undertook measurements during pile-driving in the German North Sea at various distances from the source (water depths = 10-25 m; distance from source = 36 m – 33 km; measurements as SEL in 1/1 octave bands; frequency range 63 Hz – 16 kHz). Comparisons between the observed values and the predictions of the formula by Thiele (2002) showed good correspondence between both. The comparisons also indicated that the formula is also applicable for lower frequencies (63 Hz) and higher ones (16 kHz). Both pile-driving and operational noise values were back-calculated to 1 m using the formula by Thiele (2002). For the pile-driving noise, the whole measured spectrum (31.5 Hz – 20 kHz) was back-calculated. For the operational noise, the cut off frequency for reliable calculations was < 31.5 Hz.4 Transmission loss was calculated for every 1/3 octave band for distances up to 80 km, since this was the upper limit of the formula by Thiele (2002). For greater distances – or comparisons with results from other studies – transmission loss was calculated with 15 log (r) + α (r) (see Madsen et al. 2006).
4 The cut off frequency for soft bottom substrates might be even higher than that (Frisk et al. 2003). However, since bottom conditions couldn’t be quantified, we will work with the above mentioned cut off. Limitations of this methods will be discussed as we progress.

Effects of offshore wind farm noise on marine mammals and fish
17
6. Marine mammals and wind farm noise
6.1 Introduction
Richardson et al. (1995) define four zones of noise influences, depending on the distance between source and receiver. The zone of audibility is defined as the area within which the animal is able to detect the sound. The zone of responsiveness is the region in which the animal reacts behaviourally or physiologically. This zone is usually smaller than the zone of audibility. The zone of masking is highly variable, usually somewhere between audibility and responsiveness and defines the region within which noise is strong enough to interfere with detection of other sounds, such as communication signals or echolocation clicks. The zone of hearing loss is the area near the noise source where the received sound level is high enough to cause tissue damage resulting in either temporary threshold shift (TTS) or permanent threshold shift (PTS) or even more severe damage. The different zones are illustrated in Figure 7.
Figure 7: Zones of noise influence (after Richardson et al. 1995).
As sound spreads usually omnidirectionally from the source, the zones of noise influences are given as distance from the source indicating a radius rather than a straight line. For example, a radius (r) of 10 km results in a zone of audibility of 314.16 km2 (A = π x r2).
6.2 Hearing in harbour porpoises
Several studies investigated hearing in harbour porpoises with different methods. Hearing thresholds were derived either by auditory-brainstem-responses (ABR) or behaviourally, using psychometric methods (see Kastelein et al. 2002 and Nedwell et al. 2004 for detailed descriptions of methods). Figure 8 gives an overview over the results of the different studies. The exact values can be seen in Table 8.

Effects of offshore wind farm noise on marine mammals and fish
18
Frequency (kHz)
0.1 1 10 100
Hea
ring
thre
shol
d (d
B re
1µP
a)
20
40
60
80
100
120
140Popov et al. 1986 (ABR*)Lucke et al. 2004 (ABR)Lucke et al. 2006 (ABR)Andersen 1970 (Behaviour)Kastelein et al. 2002 (Behaviour)
Figure 8: Audiograms of the harbour porpoise (ABR = auditory-brainstem response, Behaviour = audiogram derived behaviourally, * = use of implanted electrodes)
It can be seen that - in general - harbour porpoises show the typical U-shaped audiogram with sensitivities shifted to higher frequencies and best hearing around 100 kHz and above, well within the range of their biosonar (Au et al. 1999b). However, it is also apparent, that results differed markedly between the studies, probably due to inter-individual differences in sensitivity. Another factor affecting the results might have been the method used. Central-nervous-processing might lead to a relatively better perception of acoustic stimuli in behavioural studies compared to ABR-ones. ABR audiometry therefore might provide a suprathreshold estimate of hearing in odontocetes (Szymanski et al. 1999; Kastelein et al. 2002). The results of the most recent study by Lucke et al. (2006), obtained with ABR showed a 10 dB higher sensitivity at 2 kHz and less sensitivity in all other measured frequencies compared to the psychometric results obtained by Kastelein et al. (2002) on the same animal. The differences between studies in the higher frequency range might be explained by reduced hearing abilities with age or different levels of background noise (Lucke et al. 2006). However, it remains unsolved why the same animal would have had a better hearing around 2 kHz. The porpoise studied by Andersen (1970) was more sensitive at lower frequencies and less sensitive at higher frequencies than the one studied by Kastelein (2002). It should be noted that Andersen didn’t provide exact values, only a figure showing thresholds as dB re 1 µbar without the dB-unit. Therefore, values had to be extrapolated from the graph and it had to be assumed that – since a pure tone signal was used as input – the values might be interpreted as RMS ones. The apparent mismatch between sensitivity and the range of sonar led Kastelein et al. (2002) to question the validity of the audiogram presented by Andersen (1970).
After Kastelein et al. (2002) harbour porpoises exhibit a very wide hearing range with relatively high hearing thresholds of 92 – 115 dBrms re 1 µPa below 1 kHz, good hearing with thresholds of 60 – 80 dBrms re 1µPa between 1 and 8 kHz, and excellent hearing abilities (threshold = 32 – 46 dBrms re 1 µPa) from 16 – 140 kHz. The reported hearing abilities closely match the sounds emitted which can be divided after Verboom and Kastelein (1995) into four classes: 1. Low frequency sounds at 1.4 – 2.5 kHz for communication 2. Sonar-clicks (echolocation) at 110 – 140 kHz 3. Low-energy sounds at 30 – 60 kHz 4. Broadband signals at 13 – 100 kHz
Most of the energy of acoustic emissions is exhibited in sonar clicks (Verboom and Kastelein, 1995).
Effects of offshore wind farm noise on marine mammals and fish
19
For simplicity and the above mentioned reasons, we will mainly use the audiogram provided by Kastelein et al. (2002) for the assessment of possible impacts. We should bear in mind, however, that hearing studies, focussing on the lower part of the frequency spectrum are needed to derive more detailed statements on the sensitivity of harbour porpoises to low frequency sound.
6.3 Hearing in harbour seals
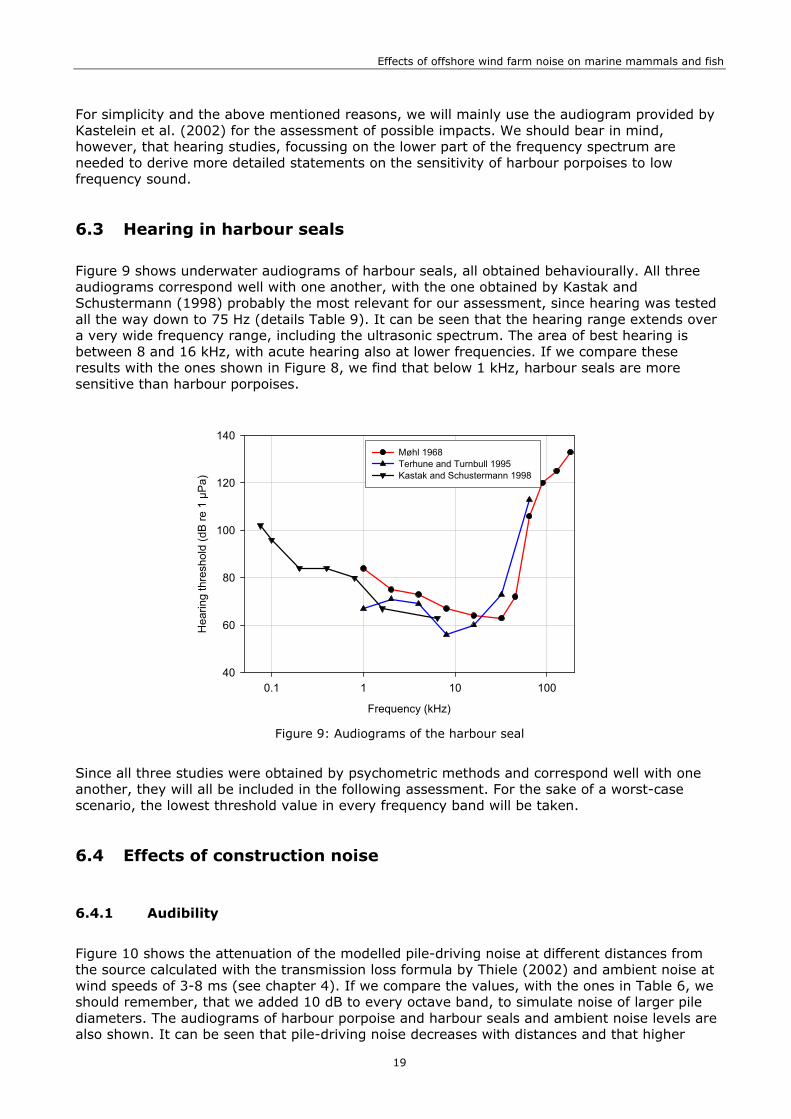
Figure 9 shows underwater audiograms of harbour seals, all obtained behaviourally. All three audiograms correspond well with one another, with the one obtained by Kastak and Schustermann (1998) probably the most relevant for our assessment, since hearing was tested all the way down to 75 Hz (details Table 9). It can be seen that the hearing range extends over a very wide frequency range, including the ultrasonic spectrum. The area of best hearing is between 8 and 16 kHz, with acute hearing also at lower frequencies. If we compare these results with the ones shown in Figure 8, we find that below 1 kHz, harbour seals are more sensitive than harbour porpoises.
Frequency (kHz)
0.1 1 10 100
Hea
ring
thre
shol
d (d
B re
1 µ
Pa)
40
60
80
100
120
140Møhl 1968Terhune and Turnbull 1995Kastak and Schustermann 1998
Figure 9: Audiograms of the harbour seal
Since all three studies were obtained by psychometric methods and correspond well with one another, they will all be included in the following assessment. For the sake of a worst-case scenario, the lowest threshold value in every frequency band will be taken.
6.4 Effects of construction noise
6.4.1 Audibility
Figure 10 shows the attenuation of the modelled pile-driving noise at different distances from the source calculated with the transmission loss formula by Thiele (2002) and ambient noise at wind speeds of 3-8 ms (see chapter 4). If we compare the values, with the ones in Table 6, we should remember, that we added 10 dB to every octave band, to simulate noise of larger pile diameters. The audiograms of harbour porpoise and harbour seals and ambient noise levels are also shown. It can be seen that pile-driving noise decreases with distances and that higher

Effects of offshore wind farm noise on marine mammals and fish
20
frequencies are more rapidly attenuated than lower ones. However, even at 80 km distance, which represents the upper limit for the transmission loss formula used here, the sound pressure levels at frequencies < 4 kHz are well above background noise.
Frequency (kHz)
0.020000.030000.040000.050000.060000.070000.080000.09000 0.200000.300000.400000.500000.600000.700000.800000.90000 2.000003.000004.000005.000006.000007.000008.000009.0000020.0000030.0000040.000000.1 1 10
SPL
(dB
re 1
µPa
)
020406080
100120140160180200220240260
SPL 1 m SPL 100 m SPL 400 m SPL 1 km SPL 10 km SPL 80 km Ambient noise 3-8 m/s Audiogram harbour porpoise Audiogram harbour seal
Figure 10: Attenuation of pile-driving noise in different distances from the source, background noise levels at wind-speeds of 3-8 m/s and audiogram of harbour porpoise and harbour seal (Pile-driving noise after ITAP (2005); values as dB0-p re 1 µPa in 1/3 octave-bands; TL-calculations after Thiele (2002); ambient noise levels as 1/3 octave-bands in dBrms re 1 µPa after DEWI 2004; audiograms in dBrms after Kastelein et al. 2002; Terhune and Turnbull 1995 and Kastak and Schustermann 1998).
Maximum sound pressure levels at 80 km distance are 144 dB0-p re 1 µPa (125 Hz), 146 dB0-p re 1 µPa (250 Hz) and 148 dB0-p re 1 µPa (315 Hz). These levels are app. 50 dB above background noise at wind-speeds between 3 and 8 m/s. However, since background noise levels and audiogram values are expressed in Figure 10 in a different dB unit than pile-driving noise levels, this has to be considered as only a rough estimate. RMS values - that are directly comparable to Leq-levels - are difficult to derive for transient signals such as pile-driving noise at exceeding distances from the source. The differences between peak and RMS were 6 - 12 dB, depending on frequency for the signal at the source and 400 m, respectively. In a real word scenario, the signal would be distorted in time, with extended duration leading to a probably lower RMS value.5 We should further consider that
5 It might be debatable why we plotted peak values instead of RMS ones here. However, there were several reasons for this. First, our RMS values are only approximate values derived by the SEL measurements, whereas the peak values are based on true measurements. Further, we feel that for this description of pile-driving, peak values are better suited than RMS values (see chapter 2). Finally, in our case RMS values might be more prone to distortion than peak values.

Effects of offshore wind farm noise on marine mammals and fish
21
hearing was tested against a 2 s sine-wave tone (harbour porpoises) and a 500 ms sine-wave (harbour seals) and that one pile-driving pulse has a duration of only app. 50 ms. Hearing in porpoises and seals is integrated over time with full perception probably established after app. 200 ms (SCAR 2004). For example, in harbour seals, Terhune (1988) reported an increase up to 6 dB in thresholds at 50 ms duration compared to longer stimuli. Figure 10 therefore represents a first impression of audibility rather than a quantitative measure. Even with all the uncertainties inherent in this particular description, some interesting phenomena can already be seen in Figure 10. We might conclude that in the present example at 80 km distance, sound pressure levels are far above hearing threshold of porpoises and seals, respectively and even taking all possible uncertainties into account, we might quite safely conclude that the zone of audibility extends at least to 80 km distance from the source for both species. The zone of audibility would be therefore at least 802 * π = 20,100 km2. Theoretically, the radius at which the ramming signal can be detected is much larger than that. At frequencies below 100 Hz (seals) and 400 Hz (porpoises), audibility is solely depending on the hearing threshold since, under moderate conditions, background noise levels are below threshold. The RMS-value at 250 Hz is in our case 205 dBAE re 1 µPa + 10 log (T1/T2) = 218 dBrms. This would lead to a signal-to-noise ratio between source level and hearing threshold of 218 – 115 dB = 103 dBrms at the source. We now have to calculate at what distance the transmission loss of pile-driving noise at that frequency equals the value of 103 dB, so that signal to noise ratio of the ramming pulse and hearing threshold is zero. If we use a transmission loss of 15 log (r) * α (r), we derive a detection distance of app. 2,000 km6. At frequencies above 100 Hz and 400 Hz, background noise levels are above the hearing threshold and audibility in both species is depending on the hearing abilities under noisy conditions. For this assessment, we assume that detection of a sound will be possible when the receiving level matches the ambient noise level, both given as 1/3 octave sound pressure levels as these resemble critical bands in both species (Richardson et al 1995; see also Madsen et al. 2006)7. If we investigate at what frequencies, the signal to noise ratio between the ramming pulse and background noise level is highest under noisy conditions, we find a maximum at 1 kHz for porpoises and one at 315 Hz for seals (Figure 9). The signal to noise ratio for porpoises at the source was 219 – 92 = 127 dBrms re 1 µPa (1 kHz). Working again with 15 log (r) * α (r) (α = 0.036 dB / km), we arrive at a signal to noise ratio of zero at app. 1,000 km. For harbour seals, the signal to noise ratio at 315 Hz is 221 – 95 = 126 dBrms re 1 µPa at 1 m. This is a similar value as for harbour porpoises, however, the absorption coefficient is much
Measurements of pile-driving in the German Bight at different distances indicate that distortion of the pulse might be rather moderate at distances around 2 km (Betke, pers. comm.). However, at longer ranges, for example at 16 km, the signal waveform had a different shape: It contained the original pulse that was in shape quite similar to the pulse at 2 km, including the peaks in the waveform. The pulse was then followed by an ~ 100 ms oscillation, probably due to echo –effects. At longer ranges, the shape of this later parts of the waveform would probably be altered to an unknown degree. Therefore it seemed more appropriate to plot peak levels in the figure instead of the RMS ones.
6 Please note that the back-calculation is made from rather far-field measurements, and as the 1 m range maybe within the near field of pile-driving, the actual sound level at 1 m may be different from the calculated source level. Since the formula by Thiele (2002) was developed only for distances up to 80 km, other TL models had to be applied for this and the following calculations. For the back-calculations of frequencies < 1 kHz, the Thiele formula is identical to 15 log (r).
7 Popov et al. (2006) estimated critical bands of harbour porpoises in the frequency range of 22 – 140 kHz and gave estimates for QERB (= 1/ Q; with Q = filter bandwidth divided by centre frequency given in proportions (0-1.0). QERB was 8.3 – 8.6 for frequencies of 22 – 32 kHz and 44.8 – 47.4 for higher frequencies (128-140 kHz). Q-values for the lower frequencies being therefore 0.116 - 0.12 (11.6 – 12 % of the centre frequency) for the higher frequencies Q-values might be approximated to be 2.5 % of the centre frequency. These results suggest a non-constant value of critical bandwidths with narrower frequency tuning at higher frequencies compared to lower ones. In other words, Q is not constant but increasing with decreasing frequencies (Popov et al. 2006). Frequencies lower than 22 kHz were not tested, however it might be quite reasonable to assume that critical bands below 2 kHz are much wider than the values obtained for 22 kHz, perhaps close to a value of 23 % given by 1/3 octave bands (see also Frisk et al. 2003 for a discussion on this topic).
Effects of offshore wind farm noise on marine mammals and fish
22
smaller (α = 0.0063 dB / km). It takes app. 4,300 km to reduce the TL of 126 dB to zero at these frequencies8. It should be emphasised that these latter detection radii are solely theoretical values as distortion of the signal in time and frequency will probably decrease the detectability of the ramming pulse significantly, especially with varying depths in coastal zones (see footnote 5). Looking at the receiver, we have to bear in mind that full detection will probably take place somewhere above a signal to noise ratio of zero (for a recent overview over audibility see Langemann and Klump 2005). We should also remember that 1/3 octave bands used here are only a first approximation on how porpoises and seals hear in noisy environments (see footnote 7 and 8). These theoretical zones, however, indicate that pile-driving noise, even under realistic North-Sea conditions, can be picked up by harbour porpoises and seals over huge distances. However, with our model we feel only safe to conclude that the radius of detectability will be at least 80 km and perhaps more.
6.4.2 Masking
The zone of masking is defined by the range at which sounds levels from the noise source are received above threshold within the critical band centred on the signal (Frisk et al. 2003). In other words, significant masking starts when the sound level of the masking sound equals the ambient noise in the frequency of the signal. It should be noted, however, that for noise with spectral peaks, this definition is not completely correct as the masking power of continuous pure tones is significantly lower than of broadband noise (Madsen et al. 2006). Madsen et al. (2006) argue that due to short signal duration and low duty cycle of the pile-driving sounds, no significant masking problems should occur during ramming. However, they also admit that due to the high sound pressure levels involved, reception of signals may be impaired by indirect effects such as distraction by the sound pressures. It may be added that repetition rates of 1 / s, such as those found at FINO-1, might hinder communication of social signals with relatively long durations and that the ramming pulse will certainly be extended in duration over long distances. We therefore believe that it is reasonable to have a closer look at the issue, at least for the species where communicative signals have been described. The sonar of harbour porpoises operates in a frequency range of 120 – 150 kHz, where ramming pulses have probably very little or no energy (see Nedwell et al. 2003a). Masking of echolocation is therefore not very likely. Amundin (1991) and Verboom and Kastelein (1995, 1997) described low-frequency sounds around 2 kHz emitted either as by-product of high-frequency clicks or independently and speculated about their possible function in communication. However, to date, no investigation dealt directly with those signals and essential data to predict the zone of masking for them (e.g. source levels) are unknown. It should be emphasised that studies on the communicative significance of harbour porpoise sounds are urgently needed to derive meaningful conclusions considering masking.
Harbour seals use signals between 0.2 and 3.5 kHz for communication between mother and calf and as territorial signals among males (Richardson et al. 1995; Riedmann 1990). After Southall et al. (2000), the 200 Hz component of a harbour seal call had a spectrum level of 105 dB re 1 µPa2 / Hz at 1 m. At 200 Hz, our modelled pile-driving sound has a sound pressure level of 206 dBrms re 1 µPa at the source. The signal to noise ratio is therefore 206 – 96 dB (background noise) = 110 dB. After Thiele (2002), this transmission loss is not reached at 80 km (TL 200 Hz, 80 km = 80 dB). We could therefore only assume that the zone of masking extends well beyond 80 km.
8 After Southall et al. (2000) underwater critical ratios of a harbour seal between 100 Hz and 2,500 Hz varied between 13 and 20 dB, depending on frequency. This results indicate more narrower critical bands than would be represented by 1/3 octave bands. Hence audibility might be underestimated by our approximation.

Effects of offshore wind farm noise on marine mammals and fish
23
6.4.3 Responsiveness
Many factors affect responsiveness in marine mammals, some of them are shown in Figure 11. Therefore, the zone of behavioural response is particularly difficult to assess (Richardson et al. 1995; Gordon 2002; Würsig and Richardson 2002; Madsen et al. 2006).
Figure 11: Some factors affecting responsiveness in marine mammals.
We should also bear in mind that responses of marine mammals to noise vary greatly from very subtle reactions (startle; small changes in swimming direction) to strong avoidance behaviour (swimming away from the noise source; for reviews see Richardson et al. 1995; Würsig and Richardson 2002). However, given that data applicable to porpoises is rather sparse, we should look at the issue rather broadly, defining the zone of responsiveness as the one where any behavioural reactions might be expected. For pile-driving pulses it is important to note that they are transient stimuli and that at certain frequencies (see above) impact-pulses are probably the only signals the animals hear. Therefore, harbour porpoises should react strongly to them (see Kastelein et al. 2005 for discussion on responses to transient stimuli). On the other hand, pulses are of short duration, probably well below the time where full detection of signals is possible in porpoises (Cummings 2003; SCAR 2004; Madsen et al. 2006). It is therefore possible that there is a trade-off between transition and duration that will lead to an intermediate behavioural reaction. Theoretical assumptions and some empirical data suggest a rather wide zone of responsiveness in cetaceans for impulsive noise. McCauley et al. (2000) found strong behavioural reactions in humpback whales to airgun sounds at a received broad-band level of 172-180 dBp-p (duration = 60 ms; frequency range = 0.1 – 2 kHz). This would correspond roughly to a threshold of 166 dB0-p. If we take the broadband value of the pile-driving noise (see Table 6; value ~ 228 dB0-p for 1.5 m piles and ~ 238 dB0-p for larger piles) and calculate transmission loss to be 15 log (r) – we arrive at a 60 km radius for behavioural reaction. Nedwell et al. (2003) define a dBht value (ht = hearing threshold) at which behavioural reactions should occur in cetaceans. They postulate that sound pressure levels 75 and 90 dB above hearing threshold should lead to mild and strong behavioural reactions in cetaceans, respectively. How this value was calculated exactly is not explained. The authors also admit that

Effects of offshore wind farm noise on marine mammals and fish
24
the dBht values are derived from studies on humans and fish9, and therefore need further evaluation. The advantage of this method is that impacts are calibrated against the hearing abilities of the species in question. If we add the 75 dB value to the audiogram by Kastelein et al. (2002) we arrive at different reaction-thresholds shown inTable 1. Again, we are faced with the problem of calculating RMS for transients (Madsen 2005), so both dB-values should be considered here. If we – for the sake of a worst case scenario – use the peak values, we arrive at a zone of 20 km. Here, the 1 kHz frequency Peak-SPL is above threshold. However, the RMS value is well below threshold. At 10 km distance, the peak values at 1, 2 and 4 KHz are above threshold and the RMS-value at 1 kHz is close. Going by the RMS values alone, we would arrive at a distance of 7.5 km (1 kHz) for mild behavioural reactions. To conclude, taking the dBht –value, we would expect mild behavioural reactions (e.g. subtle change in swimming direction) in harbour porpoises to occur between 7 and 20 km distance from the pile-driving source.
Table 1: Thresholds for mild behavioural reactions to received noise levels in harbour porpoises and received sound pressure levels at 20 km distance from an impact pile-driver (threshold = 75 dB above hearing threshold (Nedwell et al. 2003a; based on audiogram by Kastelein et al. 2002; Transmission loss calculated after Thiele (2002); * = value extrapolated from 16 and 32 kHz; bold = value over threshold ).
Frequency (kHz) Reaction Threshold (dBrms re 1µPa)
Received SPL (dB0-p re 1 µPa)
Received SPL (dBrms re 1µPa)
10 km 20 km 10 km 20 km 0.25 190 165 156 157 148 0.5 167 159 154 150 145 1 155 163 156 153 146 2 147 150 141 140 131 4 142 143 131 132 120 8 134 133 118 122 107 16 119 118 98 106 86 20 115* 111 89 99 77
However, humpback whales, humans and fish are probably not a really precise indicator for the reaction of harbour porpoise to sound. We shall therefore look at the studies dealing with our target species in more detail. In a recently published experiment Kastelein et al. (2005) tested the reaction of harbour porpoises in a floating pen (34 m x 20 m; 3.5 m deep) to different signals with frequencies around 12 kHz. They found aversive responses at received levels of 97 – 111 dBLeq re 1 µPa. However, the test tones used were mainly narrowband. The only signal resembling pile-driving noise was the test sound S2, which induced aversive responses at a received level of 103 dBLeq re 1 µPa. However, these values were derived for signal blocks containing silent intervals. In the case of the S2-signal, signal block duration was 1.0 s and signal block interval was 0.7 s, (duty cycle = 60 %; Kastelein et al. 2005). To compare these values with other dB-units, the duty cycle has to be considered (see chapter 2). A sound pressure level of 103 dBLeq re 1µPa for a 1.7 s long signal would correspond to an sound exposure level (integration time = 1.0 s) of 10 log (1.7 / 1.0) = 105 dBAE re 1 µPa. This value might be defined as a threshold for behavioural reaction at 12 kHz. For our model pile-driving signal, the 12 kHz 1/3 octave sound exposure level at the source was 185 dBAE re 1 µPa . s. Using our transmission loss model, the threshold of 105 dBAE re 1µPa . s would be reached at app. 7.5 km distance from the source. However, we have to bear in mind that the animals in the experiment were held in a net pen with no possibility to swim further away from the source than to the borders of the pen and that signals were introduced probably with sudden onset (Kastelein et al. 2005). This is different from field conditions were animals swim freely within a sound field. We should also note that
9 See ‘fish and wind farm noise’ for a further discussion on the threshold values by Nedwell et al. (2003a) considering fish.

Effects of offshore wind farm noise on marine mammals and fish
25
this particular signal was different from pile-driving noise both in tonal quality and duration and that our conclusions have to be viewed therefore as rather preliminary.
Perhaps, most relevant are the results of the empirical studies by Tougaard et al. (2003a,b, 2005) during the construction of the offshore wind farms at Horns Reef (North Sea) and Nysted (Baltic). At Horns Reef, acoustic activity of porpoises – indicated by the interval between acoustic encounters (minimum separation = 10 min) – decreased shortly after each ramming event and went back to baseline (prior to ramming) conditions after 3-4 h. This effect was not only observed in the direct vicinity of the construction site but also at monitoring stations app. 15 km away indicating that porpoises either decreased their acoustic activity or left the area during ramming periods (Tougaard et al. 2003a). It was also found that densities of porpoises during ramming were significantly lower than before ramming in the entire Reef area. Behavioural observations showed that during ramming, porpoises exhibited relatively more directional swimming patterns compared to observations obtained on days without construction where relatively more non-directional swimming patterns were observed. This effect was found at distances of more than 11 km, perhaps also 15 km from the construction site (Tougaard et al. 2003a). It is important to mention that these distances rather represent the radius of observations than the zone of responsiveness, as no observations / acoustic logging happened at greater distances (Tougaard et al. 2003a). These reaction distances might therefore be viewed as the minimum zone of responsiveness. Similar effects on acoustic activity were found during the construction (combination of pile-driving and vibropiling) of the Nysted offshore wind farm. Porpoise abundance also reportedly declined after construction with no return to baseline levels (Tougaard et al. 2005). However, since absolute abundance of porpoises was low from the start, these latter results are difficult to interpret (Tougaard et al. 2005). It should be noted, however, that in both areas, pingers and seal-scarers were used before ramming. Touggard et al. (2003a, 2005) mentioned that both were used intentionally as a mitigation measure to deter porpoises and seals from the vicinity of the construction sites. They also note that the rather large scale behavioural effects could not have been attributed to the mitigation measures employed, since source levels of the deterrent devices were much lower than the ones from pile-driving. However, caution has to be taken in comparing source levels without reference to frequency. As we saw earlier, pile-driving noise is broadband, however, with most energy below 1 kHz and therefore below ranges of best hearing in porpoises. Especially the seal scarers might have caused avoidance response in porpoises at larger distances than expected, since the source levels used were reportedly rather high with carrier frequencies well within good hearing abilities of porpoises (SL = app. 189 dBp-p re 1 µPa; carrier frequencies of 13 – 15 kHz; Lofitech, Norway, pers. comm.). Since harbour porpoises have very acute hearing in that frequency range, it cannot be ruled out that effects were caused by a combination of the mitigation measures employed, along with the pile-driving. On the other hand, decrease of acoustic activity was also found during pile-driving in a harbour close to the Nysted site, with no mitigation measures employed. This might speak in favour of the interpretation by Tougaard et al. (2003a, 2005). The results of the different studies are summarised in Table 2.
Table 2: Summary of recent studies looking at behavioural response in cetaceans.
Reference Method Species studied Stimulus Reaction
threshold Estimated radius of
response for harbour porpoises
McCauley et al. (2000) empirical Humpback
whales Airgun-pulse
(60 ms; 0.1 – 2kHz) 172 dBp-p re
1µPa 60 km
Nedwell et al. (2003a) theoretical none -
75 dB above hearing
threshold 7 – 20 km
Kastelein et al. (2005) empirical Harbour
porpoise Pulsed tone
(12 kHz; 1.0 s) 103 dBLeq 6 / 7.5 km
Tougaard et al. (2003a, 2005) empirical Harbour
porpoises Impact-pile-driving
(> 220 dBp-p) - At least 15 km

Effects of offshore wind farm noise on marine mammals and fish
26
For harbour seals, the zone of responsiveness of impact-pile-driving is even more difficult to assess than for porpoises. After anecdotal observations reviewed by Richardson et al. (1995), impulsive sounds have less negative impact on seals than on cetaceans. By contrast Gordon et al. (2004) reviewed effects of seismic surveys on marine mammals and reported strong avoidance behaviour of harbour seals to airgun arrays. Recently, Kastelein et al. (2006) repeated their experiments done on harbour porpoises (see above) with harbour seals and found avoidance for the S2 test signal at received levels of 107 dBLeq re 1 µPa (= 109 dBAE re 1 µPa, see above). Given our SEL at the source of 185 dBAE re 1 µPa, the resulting signal to noise ratio would be 76 dB. The signal to noise ratio of zero would be reached at 6 km. This results suggest similar reactions of harbour seals and harbour porpoises, at least to the tested sound. Again, we shall look at the empirical studies undertaken in the North Sea and Baltic to derive some meaningful conclusions. Using satellite telemetry, Tougaard et al. (2003b) could show that harbour seals transited Horns Rev during pile-driving. However, at Nysted, Edren et al. (2004) found a 10 – 60 % decrease in the number of hauled out harbour seals on a sandbank 10 km away from the construction during days of ramming activity compared to days when no pile-driving took place. However, this effect was of short duration, since the overall number of seals remained the same during the whole construction phase. If we consider, that in harbour seals, the zone of audibility for pile-driving noise will most certainly be as wide as for harbour porpoises, we might conclude that potential behavioural reactions might be expected in distances comparable to porpoises. To summarise, the theoretical assumptions and empirical studies, reported above, suggest a rather wide zone of responsiveness in harbour porpoises and harbour seals to aversive sound. As a conservative measure – and looking at the results of the only two empirical studies done so far - the radius of responsiveness to pile-driving noise can only provisionally defined to be within several kilometres, perhaps up to at least 15-20 km both for harbour porpoises and for harbour seals, leading to a zone of responsiveness of several hundred km2 .
6.4.4 Temporary threshold shift
Temporary threshold shift (TTS) – the temporal elevation of the hearing threshold due to noise exposure – has been measured so far in white whales (Delphinapterus leucas) and bottlenose dolphins (Tursiops truncatus). Noise stimuli varied greatly in the experiments and the results indicate a linear relationship between sound exposure level and duration of exposure: the longer an animal is exposed, the lower the level of TTS. For short signals however, sound pressure levels had to be 90 – 120 dB above hearing threshold to induce TTS (Au et al. 1999b; Finneran et al. 2000; Schlundt et al. 2000; Nachtigall et al. 2003; for pinnipeds see Kastak et al. 1999). From a regulatory perspective, injury is a concern when the received broadband sound pres-sure level exceeds 180 dBrms re 1 µPa for cetaceans and 190 dBrms re 1 µPa for pinnipeds (NMFS 2003). The model impact pile-driving broadband sound pressure level is 229 dBrms re 1 µPa at 1 m. Using these value and calculating a TL of 15 log (r) (see Madsen et al. 2006), the resulting TTS-zones would be 1,800 m for harbour porpoises and 400 m for pinnipeds10. Of course, this is only a first estimate, since RMS values are difficult to apply as a stand alone measure to impulsive sounds such as pile-driving (Madsen et al. 2006). Recent studies on fish, birds and terrestrial mammals indicate that the degree of TTS is linearly correlated with the hearing threshold, with a greater degree of TTS (in dB) at frequencies of high sensitivity compared to low ones (Linear-threshold-shift-hypothesis; Smith et al. 2004b). Frequency-dependent TTS hasn’t been studied in cetaceans to date but it might become an important issue for further impact assessment, since TTS-thresholds might vary considerably
10 As we are looking at broadband emissions, the formula by Thiele (2002) can’t be used for this calculations.
Effects of offshore wind farm noise on marine mammals and fish
27
with hearing sensitivity. In humans, exposure to continuous airborne noise 90 – 100 dB above hearing threshold will cause TTS. Permanent hearing impairment is induced, if noise exposure is 80 dB above hearing threshold (8 h per day exposure for 10 years; Richardson et al. 1995). It is uncertain to what degree these ‘dB-above threshold criteria’ are applicable to cetaceans (Richardson et al. 1995; Ketten 1999). However, looking at the TTS-studies so far, it is likely that the ‘theoretical threshold shift zone’ in cetaceans is of similar dimensions as in other mammals. For example, in bottlenose dolphins a TTS of 12-18 dB was induced if noise exposure was 96 dB above hearing threshold for 30 min (Au et al. 1999b). After Nachtigall et al. (2004) broadband noise exposure between 4 and 11 kHz for 30 min caused TTS in a bottlenose dolphin at a received level of 160 dBrms re 1 µPa. Looking at the hearing threshold at these frequencies (4 kHz = 80 dBrms re 1 µPa; 11 kHz ~ 55 dBrms re 1 µPa; Johnson, 1967), the received levels would be between 80 and 105 dB above threshold. In her assessment on the effects of boat noise on killer whales (Orcinus orca), Erbe (2002) used results from various TTS-studies on other delphinid species and predicted a TTS of 5 dB if noise exposure was 68 dB above hearing threshold for 30 – 50 min and a TTS of 12-18 dB if noise exposure of 30 – 50 min was 96 dB above threshold. For the sake of a worst case scenario, an 80 dB-above-threshold criterion might be feasible to illustrate the problem.
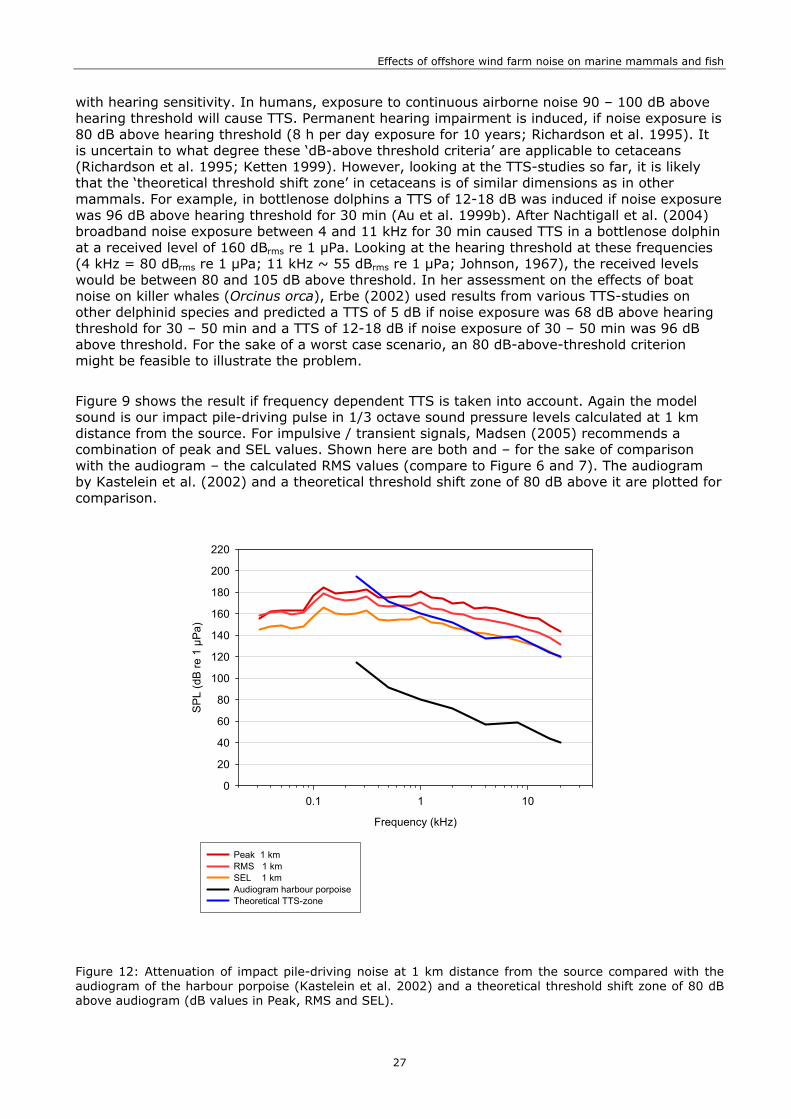
Figure 9 shows the result if frequency dependent TTS is taken into account. Again the model sound is our impact pile-driving pulse in 1/3 octave sound pressure levels calculated at 1 km distance from the source. For impulsive / transient signals, Madsen (2005) recommends a combination of peak and SEL values. Shown here are both and – for the sake of comparison with the audiogram – the calculated RMS values (compare to Figure 6 and 7). The audiogram by Kastelein et al. (2002) and a theoretical threshold shift zone of 80 dB above it are plotted for comparison.
Frequency (kHz)
0.020000.030000.040000.050000.060000.070000.080000.09000 0.200000.300000.400000.500000.600000.700000.800000.90000 2.000003.000004.000005.000006.000007.000008.000009.0000020.0000030.0000040.000000.1 1 10
SP
L (d
B re
1 µ
Pa)
0
20
40
60
80
100
120
140
160
180
200
220
Peak 1 km RMS 1 km SEL 1 km Audiogram harbour porpoise Theoretical TTS-zone
Figure 12: Attenuation of impact pile-driving noise at 1 km distance from the source compared with the audiogram of the harbour porpoise (Kastelein et al. 2002) and a theoretical threshold shift zone of 80 dB above audiogram (dB values in Peak, RMS and SEL).
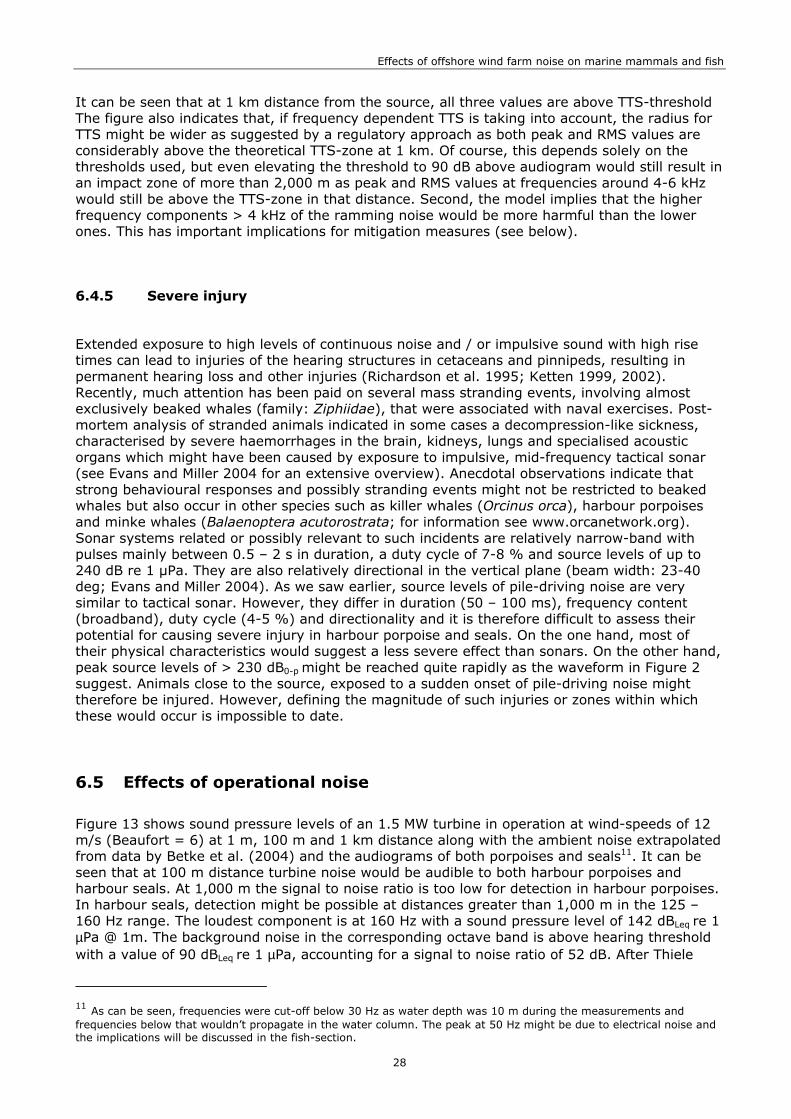
Effects of offshore wind farm noise on marine mammals and fish
28
It can be seen that at 1 km distance from the source, all three values are above TTS-threshold The figure also indicates that, if frequency dependent TTS is taking into account, the radius for TTS might be wider as suggested by a regulatory approach as both peak and RMS values are considerably above the theoretical TTS-zone at 1 km. Of course, this depends solely on the thresholds used, but even elevating the threshold to 90 dB above audiogram would still result in an impact zone of more than 2,000 m as peak and RMS values at frequencies around 4-6 kHz would still be above the TTS-zone in that distance. Second, the model implies that the higher frequency components > 4 kHz of the ramming noise would be more harmful than the lower ones. This has important implications for mitigation measures (see below).
6.4.5 Severe injury
Extended exposure to high levels of continuous noise and / or impulsive sound with high rise times can lead to injuries of the hearing structures in cetaceans and pinnipeds, resulting in permanent hearing loss and other injuries (Richardson et al. 1995; Ketten 1999, 2002). Recently, much attention has been paid on several mass stranding events, involving almost exclusively beaked whales (family: Ziphiidae), that were associated with naval exercises. Post-mortem analysis of stranded animals indicated in some cases a decompression-like sickness, characterised by severe haemorrhages in the brain, kidneys, lungs and specialised acoustic organs which might have been caused by exposure to impulsive, mid-frequency tactical sonar (see Evans and Miller 2004 for an extensive overview). Anecdotal observations indicate that strong behavioural responses and possibly stranding events might not be restricted to beaked whales but also occur in other species such as killer whales (Orcinus orca), harbour porpoises and minke whales (Balaenoptera acutorostrata; for information see www.orcanetwork.org). Sonar systems related or possibly relevant to such incidents are relatively narrow-band with pulses mainly between 0.5 – 2 s in duration, a duty cycle of 7-8 % and source levels of up to 240 dB re 1 µPa. They are also relatively directional in the vertical plane (beam width: 23-40 deg; Evans and Miller 2004). As we saw earlier, source levels of pile-driving noise are very similar to tactical sonar. However, they differ in duration (50 – 100 ms), frequency content (broadband), duty cycle (4-5 %) and directionality and it is therefore difficult to assess their potential for causing severe injury in harbour porpoise and seals. On the one hand, most of their physical characteristics would suggest a less severe effect than sonars. On the other hand, peak source levels of > 230 dB0-p might be reached quite rapidly as the waveform in Figure 2 suggest. Animals close to the source, exposed to a sudden onset of pile-driving noise might therefore be injured. However, defining the magnitude of such injuries or zones within which these would occur is impossible to date.
6.5 Effects of operational noise
Figure 13 shows sound pressure levels of an 1.5 MW turbine in operation at wind-speeds of 12 m/s (Beaufort = 6) at 1 m, 100 m and 1 km distance along with the ambient noise extrapolated from data by Betke et al. (2004) and the audiograms of both porpoises and seals11. It can be seen that at 100 m distance turbine noise would be audible to both harbour porpoises and harbour seals. At 1,000 m the signal to noise ratio is too low for detection in harbour porpoises. In harbour seals, detection might be possible at distances greater than 1,000 m in the 125 – 160 Hz range. The loudest component is at 160 Hz with a sound pressure level of 142 dBLeq re 1 µPa @ 1m. The background noise in the corresponding octave band is above hearing threshold with a value of 90 dBLeq re 1 µPa, accounting for a signal to noise ratio of 52 dB. After Thiele
11 As can be seen, frequencies were cut-off below 30 Hz as water depth was 10 m during the measurements and frequencies below that wouldn’t propagate in the water column. The peak at 50 Hz might be due to electrical noise and the implications will be discussed in the fish-section.
Effects of offshore wind farm noise on marine mammals and fish
29
(2002), a TL of 52 would be reached at app. 3.3 km. This wider zone of audibility for harbour seals compared to porpoises is well in line with the results of previous studies (Henriksen et al. 2001; Madsen et al. 2006).
Frequency (kHz)
0.01 0.1 1
SPL
(dB
re 1
µPa)
50
60
70
80
90
100
110
120
130
140
150
SPL 1 m SPL 100 m SPL 1 km Audiogram harbour porpoise Audiogram harbour sealAmbient noise 12 m/s
Figure 13: Sound pressure levels of an offshore wind farm pile in operation in different distances from the source compared to the audiogram of harbour porpoises and harbour seals and background noise (SPL = Leq in 1/3 octave sound pressure levels; calculated after Thiele 2002; background noise after Betke et al. 2004; audiogram harbour porpoise by Kastelein et al. 2002); audiogram harbour seal by Terhune and Turnbull 1995, Kastak and Schusterman 1998).
The detection radii depend on appropriate simulation of critical bands of the species in question, the signal to noise ratio of turbine and ambient noise and the transmission loss model used12. In calmer conditions, the detection range of the signal will probably increase somewhat. However, since turbine noise decreases under these circumstances (see Madsen et al. 2006), the overall detection ranges should remain relatively constant. We should also consider that ambient noise values were extrapolated from measurements obtained in the Baltic. Ambient noise in most parts of the North Sea is much higher and will decrease the radius of detection significantly (see DEWI 2004). The results indicate a rather small zone of audibility and noise levels at 1,000 m are too low to induce responsiveness, masking or TTS in porpoises. There might be masking of harbour seal sounds but this will probably only happen at close ranges below or near the zone of audibility. Koschinski et al. (2003) reported behavioural responses in both species to playback of simulated offshore turbine sounds at ranges of 200 – 300 m, indicated by theodolite tracking and recordings of acoustic activity13.
12 As indicated in footnote 8, the critical bands of harbour seals in that frequencies might be narrower than 1/3 octave bands and the zone of audibility therefore wider. Using the same method as applied here, Madsen et al. (2006) assessed the zone of audibility for a turbine also from Utgrunden and arrived at a signal to noise ratio of 32 dB at 83 m distance. They calculated with a transmission loss of 13 log (r) and estimated a zone of audibility of app. 20 km. However, the validity of the transmission loss was not clear.
13 See Madsen et al. (2006) for a critical review of the paper by Koschinski et al. (2003).

Effects of offshore wind farm noise on marine mammals and fish
30
It is important to remember that these conclusions are only valid for rather small turbines. There is good reason to believe, that bigger turbines – for example the 4-5 MW ones planned for most offshore wind farms – are noisier. For example, DEWI (2004) simulated sound emissions of an 2.5 MW turbine based on their measurements of a 1.5 MW offshore windmill in operation. They estimated that the sound pressure levels of the simulated 2.5 MW turbine would be between < 10 to 30 dB higher compared to the 1.5 turbine, depending on frequency. How realistic these simulations are, needs further evaluation, especially in situ measurements from larger turbines. Nonetheless, it is likely that radii of detection will increase considerably with higher powered turbines, even taking the higher ambient noise levels of the North Sea into account. Another factor we have to consider is the tonal content of the noise emitted by turbines in operation (DEWI 2004; Wahlberg and Westerberg 2005; Madsen et al. 2006; see footnote14). In larger turbines, narrow tones with clearly defined peaks might as well be ways above background noise levels and the zone of audibility of these rather discrete frequencies might be much larger than for relatively broadband noise (DEWI 2004). Finally, measurements of a whole wind farm in operation are needed to assess possible interference of sound waves coming from several turbines. As this might not be an important issue for smaller turbines, it might become relevant for the 4-5 MW class.
6.6 Effects of ship noise
Table 3 shows received 1/3 octave sound pressure levels of ship noise at 0.25 and 2 kHz in various distances from the source (source levels adapted from Richardson et al. 1995). Both frequencies were picked because most noise from construction / maintenance ships is exhibited in lower frequencies (Richardson et al. 1995). They are also applicable for harbour porpoises and harbour seals, since both species are suspected or known to communicate at low frequencies and hearing abilities are acute at least around 2 kHz. If we consider the detection thresholds for harbour porpoises (Hearing threshold = 115 dBrms re 1 µPa at 0.25 kHz; Ambient noise = 91 dBrms re 1 µPa at 2 kHz) it can be concluded that ship noise around 0.25 kHz will be detected by the species at distances of 1 km. Ship noise around 2 kHz will be detected in a distance of app. 3 km. For harbour seals (ambient noise = 94 and 91 dBrms re 1µPa at 0.25 and 2 kHz respectively), the zone of audibility will be app. 20 km for the 0.25 content of ship noise and identical to harbour porpoises for the 2 kHz content. These calculations are valid for ambient noise levels typical for the German Bight / North Sea at wind-speeds between 3 and 8 m/s (see chapter ‘ambient noise’). Masking of the 200 Hz content of harbour seal vocalizations by ship noise might occur at distances of app. 15 km (SN-ratio at the source = 160 – 97 = 63 dB; TL after Thiele (2002) = 63 at 15 km). Due to the much smaller noise levels of construction ships compared to pile-driving, TTS would occur in both species only at very close distances. As sound pressure levels from ships are considerably lower than those during pile-driving, the zone of responsiveness to ship noise will be much smaller than for pile-driving noise. However, as explained above, zones of responsiveness are difficult to predict. Richardson et al. (1995) define a received level of 120 dB for continuous noise as a criterion for responsiveness in cetaceans (see also Erbe 2002). Looking at the results shown in Table 3, the zone of responsiveness should be limited in both species to app. 400 m (0.25 Hz). Of course, frequency characteristics of the noise (tonal or broadband) and vessel speed might lead to different zones of responsiveness. Palka and Hammond (2001) estimated the distance where harbour porpoises
14 The measurements of Madsen et al. (2006) show a clear peak in the sound spectrum density level at around 160-180 Hz. The corresponding 1/3 octave sound pressure levels were only slightly lower. However, this picture might become different with larger turbines.

Effects of offshore wind farm noise on marine mammals and fish
31
respond behaviourally to survey vessels (speed = 10 knots) to be 1 km in the North Sea (95 % CI = 625 – 1556).
Table 3: 1/ 3 octave sound pressure levels of ship noise at different distances from the source calculated after Thiele (2002).
Ship noise (dBrms re 1µPa)
Distance to source 0.25 kHz 2 kHz 1 m 160 150
10 m 145 133 50 m 135 122 100 m 130 117 1 km 115 100 10 km 99 80
These calculations demonstrate that ship-noise might have effects on both species. However, looking at the estimated radii for audibility, responsiveness, ‘masking’ and TTS for pile-driving, it might be argued that the effects of pile-driving periods would shadow any effects from construction ships. For the operational phase, the story might become quite different. Apparently, the effort for maintaining the turbines might be quite high (Tougaard et al. 2005) and noise exposure from maintenance ships might therefore cause additional stress for both species.
6.7 Implications for other cetacean species Some of the points raised above might be applicable to other cetacean species inhabiting areas for future wind farm development. However, it is beyond the scope of this report to provide a detailed assessment for each of them. The following section should instead deal with some future key issues, considering the effects of offshore wind farms on selected marine mammal species. Reid et al. (2003) give a detailed account of 25 cetacean species residing and / or transiting north-west European waters, among them 6 mysticetes and 19 odontocetes. A number of these are distributed mainly in relatively deep waters offshore and might therefore only occasionally travel in areas of prospective offshore wind farm development. Among the candidates for a more comprehensive assessment with respect to northern European waters would be the bottlenose dolphin (Tursiops truncatus), the common dolphin (Delphinus delphis), the white-beaked dolphin (Lagenorhynchus albirostris), the Risso’s dolphin (Grampus griseus), the killer whale (Orcinus orca) and the minke whale (Balaenoptera acutorostrata) as these species are regularly seen in coastal areas with the bottlenose dolphin comprising resident population in some areas (Hammond et al. 2002; Reid et al. 2003). However, one might be cautious to narrow down the number of species impacted by future developments too much, since wind farms might as well be planned in deeper waters with more species being in the radius of potential impact. Figure 14 shows audiograms of three odontocete species found in coastal waters of northern Europe. The striped dolphin might be viewed as a very provisional representative for offshore dolphins, such as the white beaked dolphin. The audiogram of the harbour porpoises is shown for comparison (for an overview of audiograms see Richardson et al. 1995; Nedwell et al. 2004).

Effects of offshore wind farm noise on marine mammals and fish
32
Frequency (kHz)
0.01 0.1 1 10 100
SP
L (d
B re
1 µ
Pa)
20
40
60
80
100
120
140
160
Bottlenose dolphin (Johnson 1967) Risso's dolphin (Nachtigall et al. 1995) Striped dolphin (Kastelein et al. 2003) Killer whale (Szymanski et al. 1999; Behaviour) Killer whale (Szymanski et al. 1999; ABR) Harbour porpoise (Kastelein et al. 2002)
Figure 14: Exemplary audiograms of odontocete species
It can bee seen that all audiograms exhibit the characteristic U-shaped form with relatively high thresholds at and below 1 kHz and areas of best hearing in the ultrasonic range (> 20 kHz). It becomes also apparent that considerable data gaps exist, with respect to hearing abilities at frequencies below 1 kHz, with measurements only for two other species besides the harbour porpoise, comprising only two (bottlenose dolphin) and one (striped dolphin) individual tested15. However, it is interesting to note that the tested bottlenose dolphins showed quite similar sensitivities as the porpoise to frequencies around 250 Hz, which represents the maximum SPL for the pile-driving noise. This indicates that the zone of audibility for pile-driving noise for bottlenose dolphins might be quite similar to the one concluded for harbour porpoises (> 80 km). David (2006) estimated a detection distances of 40 km for pile-driving noise for bottlenose dolphins. However, his input sound was weaker and the transmission loss model differed from the one used here, so results are difficult to compare. Sensitivity for the striped dolphin was less at and below 1 kHz compared to harbour porpoises and the bottlenose dolphin (around 110 – 120 dB re 1 µPa). Looking at the peak sound pressure level of our pile-driving noise at 1 kHz in 80 km distance ( = 136 dBp-p re 1 µPa) and bearing all the uncertainties of calculating transmission loss for those distances, we might conclude that 80 km would be an upper limit for detection of pile-driving noise in that species and probably also in other offshore dolphins. For killer whales, hearing sensitivity around 1 kHz is better than in striped dolphins and weaker
15 In addition Turl (1993) tested the reaction of a bottlenose dolphin for sounds of 60, 100, 200 and 300 Hz and reported positive responses to test tone levels between ~ 100 – 120 dB re 1 µPa, with lower reaction thresholds for 300 Hz compared to the other frequencies.

Effects of offshore wind farm noise on marine mammals and fish
33
than both in bottlenose dolphins and harbour porpoises. At 2 kHz, hearing sensitivity is similar to the latter species. We might therefore argue, that killer whales might detect pile driving noise at distances up to 80 km and more. To summarise, even with our very limited data on hearing in other odontocetes, we might conclude that pile-driving noise will be audible to the above mentioned species at very large distances, in some cases exceeding the upper limit of our transmission loss model (= 80 km). Due to the comparable low source levels and the rather restricted frequency spectrum of operational noise (most energy around 160 Hz), the audibility for operational noise of smaller turbines, will be restricted to close-ranges, comparable or even less than the ones concluded for harbour porpoises (< 1 km). Again, we have to consider that most planned turbines will be more powerful and probably noisier and therefore zones of audibility might increase considerably. Masking of biological relevant signals by offshore wind farm noise might become a key-issue for species known or suspect to use signals in frequencies similar to the introduced noise. For example, most delphinids are highly vocal, producing an wide-array of burst-pulsed sounds and whistles known or suspected to be used in communication (reviews by Richardson et al. 1995; Tyack 1998; Herzing 2000; Janik 2005). For whistles of bottlenose dolphins, the active space - the area in which another individual can perceive the signals of a conspecific – is 20-25 km at maximum source levels (169 dBrms re 1 µPa; frequency range of the fundamental = ~ 3 – 10 kHz; mean = 9 kHz; sea state = 0; Janik 2000a). This active space will be reduced when the sound level of the masking sound equals the ambient noise in the frequency of the signal (see chapter 6.4.2). Using our modelled pile-driving sound and our transmission loss model, we might provisionally derive a zone of masking for whistles of ~ 35-40 km16. David (2006) estimated a very similar masking radius of 10-40 km for 9 kHz, again using a weaker pile-driving noise and a different transmission loss formula. This indicates that the rather large communication networks in bottlenose dolphins might be reduced by pile-driving at considerable distances. David (2006) and Madsen et al. (2006) mention that the impact of masking might be limited by the intermittent nature of the pile-driver noise. However, as noted above, the story might be more complicated with signals of relatively long duration and it might be added here, that delphinid communication is often comprising an exchange of information (see Janik 2000b; Miller et al. 2004) that might be very likely disrupted or ‘masked’ even by intermittent signals.
Trying to conclude upon the zone of responsiveness to offshore wind farm noise for other odontocetes would involve even more speculations, since empirical studies on this topic are lacking. However, looking at the principally large zones of audibility for pile-driving noise, it might be expected that behavioural reactions occur at considerable distance from the source, depending on the species in question. Excellent reviews on studies of responsiveness in odontocetes to other underwater noise sources are provided elsewhere (e.g. Richardson et al. 1995; Würsig and Richardson 2002; Gordon et al. 2004; for bottlenose dolphins see David 2006). Looking at the rather high-frequency content of vocalisations in most delphinids and the low-frequency nature of operational noise, we might conclude that masking by operational noise might be negligible. However, there are exceptions from that rule: Burst-pulsed sounds are often lower in frequency than whistles (Richardson et al. 1995) and at least bottlenose dolphins produce low-frequency bray-calls which are associated with feeding on salmonids (Janik 2000c). Given that larger turbines are most certainly noisier and some delphinids use rather low-frequency calls for communication / foraging, we can’t rule out at this point that even operational noise of wind-turbines will interfere with biologically relevant signals of the species in question.
16 SEL was 190 dB re 1 µPa at 1 m for 8 kHz (see Table 6 ). This would equal 203 dBrms re 1 µPa. TL at 37 km = 118 dB after Thiele (2002).

Effects of offshore wind farm noise on marine mammals and fish
34
Temporary threshold shift and severe injury by pile-driving noise are another difficult issue. If we are going by a regulatory approach (threshold for cetaceans = 180 dBrms re 1 µPa; see chapter 6.4.4) we conclude one zone of potential TTS ( = 1,800 m) for all odontocetes, regardless of the species. However, looking at the varying hearing capabilities of different species, this might be regarded as a very provisionally first step. As noted in chapter 6.4.4, TTS studies have so far only performed on two species (bottlenose dolphins and beluga whales) using various sounds. Again, studies on frequency dependant TTS are urgently needed to derive more solid conclusions on the effects of sound on odontocetes. Looking at possible impacts on mysticetes, we might concentrate on the minke whale (Balanaeptera acutorostrata) as this species appears in relative solid numbers in north west European Seas and is often seen in coastal areas (Reid et al. 2003; for a discussion on impacts on the northern right whale see Madsen et al. 2006). Data on hearing abilities of the species is lacking, as in all other mysticetes. However, minke whales produce sounds in the low frequency range (100-200 Hz) and higher (up to 9 kHz) with regional variation across populations (Richardson et al. 1995; Gedamke et al. 2001) and it is very likely that they have their best range of hearing at lower frequencies compared to odontocetes (for anatomical evidence see Ketten 2000). Due to the low-frequency content of most of the signals, the zone of audibility would be limited by ambient noise and probably not by the hearing threshold. It is therefore quite possible that minke whales detect wind farm related noise at considerable distances over many tens of km (pile driving) and / or closer ranges of some km (operation). And it is also quite possible that both noise sources mask biological relevant signals within the zone of audibility. The zone of responsiveness to pile-driving can’t be reliably assessed for minke whales. However, as we saw above, responsiveness to impulsive sounds occurs in other mysticetes, sometimes at considerable distances (McCauley et al. 2000; see also Richardson et al. 1995 and Madsen et al. 2006), and the potential of pile-driving noise to alter the behaviour of the species can’t be ruled out. The zone of TTS can only be provisionally derived by a regulatory approach as being 1,800 m (see chapter 6.4.4).

Effects of offshore wind farm noise on marine mammals and fish
35
7. Fish and wind farm noise
7.1 Introduction The effects of offshore wind farm noise on fish have drawn less attention from researchers compared to impact assessments on marine mammals or birds (Zucco and Merck 2004). Generally, studies investigating sound induced effects on fish are relatively scarce and the results are variable (Hastings and Popper 2005). It is often difficult to extrapolate the results gained in specific investigations or in fundamental research to different conditions, basically as a result of different hearing systems of the species in question and differences in the physical properties of the sound stimulus. By now, the available data only allow a first approach towards an assessment of how wind farm noise will affect fish. The principles of hearing in fish differ from those of marine mammals and have great influence on the way an assessment of noise induced impacts has to be done. We will therefore briefly review what is known about hearing in fish, then describe the hearing systems of the species we selected for the assessment in detail, and finalise this first part (chapters 7.1-7.3) with some points that have to be considered when describing possible impacts of noise on the target species. The later chapters (7.4 – 7.6) will follow the format of the marine mammal part by looking at the potential effects of noise during construction and operation of wind turbines.
7.2 Hearing in fish There is an extraordinary diversity in hearing structures among fishes, resulting in different auditory capabilities across species. While many fish species hear in the range of about 30 Hz to 1 kHz, some investigations have demonstrated species-specific hearing capabilities in the infrasonic range of less than 20 Hz (Karlsen 1992; Knudsen et al. 1997; Sand et al. 2000), and in the ultrasonic range of over 20 kHz (Mann et al. 1998, 2001; Popper et al. 2004a). Anthropogenic underwater noise, including, for example, shipping, seismic airguns, pile driving, and operational noise of wind turbines exhibits major energy below 1,000 Hz and is thus within the frequency range of hearing of most fishes (Richardson et al. 1995; Popper et al. 2003; see chapter 3). Fish possess two principal mechanosensory organs for the detection of underwater vibrations, the lateral line system and the inner ear. The lateral line system is stimulated by low frequency (generally below 150 Hz) water flow relative to the fish body (Sand 1984; Enger et al. 1989; Coombs and Montgomery 1999; Wahlberg and Westerberg 2005). Very close to the sound source the lateral line system can detect the acoustic field. However, the limited detection range makes the lateral line probably unimportant in the context of the reaction of fish to signals from wind turbines (Wahlberg and Westerberg 2005). The inner ear includes three semicircular canals and associated sensory regions and three otolith end organs, the saccule, utricle, and lagena (e.g. Popper and Fay 1999; Popper et al. 2003). Each otolith organ consists of a solid calcareous stone (the otolith) closely associated with a sensory epithelium containing mechanoreceptive hair cells. The otoliths are denser than the surrounding tissues and the water so that their movements in a sound wave will be at a different phase and amplitude than that of the epithelium, thus creating shearing movement of the hair cells. The otolith organs are therefore in principle particle motion detectors (e.g. Hawkins 1993; Popper et al. 2003; see below). They tend to respond to sound induced motions of the fish‘s body in both the near and the far field (Popper and Fay 1999). The perception of sound pressure is restricted to those fish species containing air-filled swim bladders. Due to the higher compressibility of gas compared to water, the swim bladder responds to sound pressure fluctuations. This motion of the swim bladder may be transmitted to the otolith organs of the

Effects of offshore wind farm noise on marine mammals and fish
36
inner ear (e.g. Fay and Popper 1999). In other words, the swim bladder transforms incident sound pressure into particle motion which stimulates the ear. The dual sensitivity of many fish species to sound pressure and particle motion may provide the animals with valuable information about sound source characteristics, including distance and location (Popper and Fay 1999; Popper et al. 2003). Fish can perform the same basic auditory tasks, such as discrimination between sounds, determining the direction of a sound, and detecting biologically relevant sounds in the presence of noise as do terrestrial vertebrates. Indeed, it has been shown that all species of fish tested are able to hear (Popper et al. 2003). However, hearing capabilities among species vary greatly. For classification purposes, the terms hearing specialist and hearing generalist (or non-specialist) are commonly used (Fay and Popper 1999). This classification is independent of the taxonomic grouping but is based entirely on a species‘ hearing capability. Hearing specialists have some means of mechanical coupling between the swim bladder and the inner ear (e.g. Weberian ossicles of the Ostariophysi, bulla auditoria of the Clupeidae). As a result of these additional indirect pathway to the ears, hearing specialists have high sound pressure sensitivity and generally low hearing thresholds when compared to generalists. They can detect sounds to over 3 kHz with best sensitivity from about 300 to 1,000 Hz (Popper et al. 2003). In contrast, the majority of fishes are not known to have hearing specializations and only detect sounds up to 500 - 1,000 Hz, with best hearing generally from 100 - 400 Hz (Popper et al. 2003). They are classified hearing generalists (Fay and Popper 1999) These species hear primarily via the direct pathway (that is particle motion via the otoliths) with relative poor sensitivity (Popper and Fay 1999). The hearing generalists may be further divided into those species lacking gas-filled structures and those species possessing a swim bladder but lacking specialized coupling mechanisms (Popper at al. 2003).
7.3 Target species
For the entire North Sea region, 224 fish species have been described (Yang 1982). Four species, whose hearing capabilities are well investigated are selected exemplarily in order to represent different levels of auditory capabilities. Our selection covers dab, Atlantic salmon, Atlantic cod and Atlantic herring. Dab (Limanda limanda) does not possess a swim bladder. Sound travels directly to the otolith organ via tissue conduction. As a result, dab is only sensitive to particle motion (Chapman and Sand 1974). The species is relatively insensitive to sound and hears over a very restricted range of frequencies. Dab hears in a frequency range between 30 and 250 Hz. The hearing threshold was determined as 89 dB re 1 µPa at 110 Hz (Chapman and Sand 1974) (Figure 15). Dab is chosen in order to represent other fish species of very low sensitivity to sound, especially flatfishes without a swim bladder. Atlantic salmon (Salmo salar) possess a swim bladder that is not always completely filled. In addition, it is disconnected from the skull, therefore Hawkins and Johnstone (1978) conclude that the swim bladder plays no part in hearing of the species. Hearing in the Atlantic salmon was studied by means of a cardiac conditioning technique by Hawkins and Johnstone (1978). Salmon responded only to low frequency tones (below 380 Hz) with best hearing (threshold 95 dB re 1 µPa) at 160 Hz (Figure 15). As a consequence of the hearing mechanism, particle motion, rather than sound pressure, proved to be the relevant stimulus. The hearing of salmon is poor with narrow frequency span, poor power to discriminate signals from noise, and low overall sensitivity (Hawkins and Johnstone 1978). Salmon has been selected as a target species because of its protection status. According to the red list, salmon is classified status 1 (critically endangered) in the German North Sea (Fricke et al. 1995). Moreover, the species is protected under the Habitat and Species Directive (Ssymank 1994).

Effects of offshore wind farm noise on marine mammals and fish
37
Frequency [Hz]1 10 100 1000
Hea
ring
thre
shol
d [d
B re
1 µ
Pa]
60
70
80
90
100
110
120
130
140
150
Atlantic cod dabAtlantic herringAtlantic salmon Pacific herring
Figure 15: Audiograms of Atlantic salmon (Salmo salar) (Hawkins and Johnstone 1978), Atlantic cod (Chapman and Hawkins 1973), Atlantic herring (Enger 1967), and dab (Chapman and Sand 1974). For comparative purpose the audiogram of Pacific herring (Mann et al. 2005) is included.
Atlantic cod (Gadus morhua) has a gas-filled swim bladder. Though there is no direct connection between the swim bladder and ear, the anterior of the swim bladder is in close proximity to the inner ear, which is positioned well back in the occiput (Hawkins and Johnstone 1978). Therefore, the species is more sensitive to sound than both dab and Atlantic salmon. Audiograms have been determined by classical cardio-conditioning technique. A change in heart beat obtained with the repeated presentation of a sound followed by a mild electric shock is taken as evidence that a given sound has been perceived by the animal. Buerkle (1967) has established a cod audiogram, but in a later publication (Buerkle 1968), the author stated that the experimental sound had been masked by ambient noise in the tank. Chapman and Hawkins (1973) investigated a total of 43 juvenile cod in a field study. Offutt (1974) based his audiogram on the investigation of 20 specimens in a tank. The best sensitivity was determined at 150 and 160 Hz, respectively in both of the latter studies. Saccular microphonic potentials were measured by Sand and Enger (1973) in four cod in order to investigate the role of the swim bladder in hearing. Considering the difficulties arising when measuring fish hearing in small tanks, especially when the species is sensitive rather to particle motion, the hearing curve determined by Chapman and Hawkins (1973) in the ocean is taken as a basis for further calculations. Highest sensitivity of cod is 75 dB re 1 µPa at 160 Hz (Figure 15). Sand and Karlsen (1986) found sensitivity in the infrasonic range below 1 Hz (see Astrup and Møhl 1993 for sensitivity in higher frequencies). Cod are capable of distinguishing between spatially separated sound sources (Buwalda et al. 1983), and also between sources in different distances (Schuijf and Hawkins 1983). In cod, both particle motion and sound pressure are important stimuli, especially for determining sound direction (Schuijf and Hawkins 1983). Like all members of the order Clupeiformes, Atlantic herring (Clupea harengus) has a swim bladder and inner ear structures which explain their special hearing capabilities. Structural specializations include an extension of the swim bladder that terminates within the inner ear and a high degree of specialization within the utricluar region of the inner ear (Popper et al. 2004b). Atlantic herring hears in an extended range of frequencies between 30 Hz and 4 kHz, with a hearing threshold of 75 dB re 1 µPa at 100 Hz (Enger 1967) (Figure 15). The audiogram was determined in a neurophysiological investigation rather than in behavioural experiments. Nervous responses to pure tone stimulation were measured (Enger 1967). More recent investigations demonstrated ultrasound detection in clupeiform fishes like the American shad

Effects of offshore wind farm noise on marine mammals and fish
38
(Alosa sapidissima) (Mann et al. 1998) and gulf menhaden (Brevoortia patronus) (Mann et al. 2001). However, this capability is probably restricted to the subfamily Alosinae (shads) (Mann et al. 2001). The hearing of the closely related Pacific herring (C. pallasii) was investigated by ABR technology and it was shown that it does not include ultrasound (Mann et al. 2005). In the lower frequencies (100 - 5,000 Hz), the hearing thresholds were typical of other clupeids and had a similar shape but less sensitivity than the neural recordings performed with Atlantic herring (Enger 1967) (Figure 15). From what we said so far, it becomes apparent that interpretations of audiograms for fish are rather difficult, since often the appropriate stimulus is not known. It might be argued that dab and possibly salmon are pure particle motion detectors. Consequently, Hastings and Popper (2005) note that not all of the threshold for hearing generalists may be quantitatively valid because some of them probably do not respond to sound pressure. However, they note, that it is likely that the range of best sensitivity is ‘reasonable accurate’. They also note that the relatively poor sensitivity of generalists is probably ‘qualitatively correct’. For more accurate measurements, not only sound pressure but also particle motion should be determined, because this is what many generalists most likely detect. Cod and herring can detect both particle motion and sound pressure, so audiograms given in terms of dB-values might appropriately describe their hearing sensitivity. As a consequence, the assessment of the zone of audibility for dab and salmon will be limited to general trends, whereas more explicit statements will be provided for cod and herring (see below and refer to the discussion on fish audiograms by Popper et al. 2003; Hastings and Popper 2005; Wahlberg and Westerberg 2005).
7.4 Effects of construction noise
7.4.1 Audibility
Sound induced effects are to be expected when the sound overlaps in frequency and level with the hearing capability of the species under consideration, and when the signal exceeds the ambient noise. Figure 16 shows the attenuation of our modelled pile-driving noise (dB0-p
re 1 µPa) at different distances from the source along with ambient noise at wind speeds between 3-8 m/s and the audiogram of our target species. As explained in chapter 6.4.1, the figure has to be interpreted with caution and is used here rather for illustration than as a quantitative measure. Figure 16 indicates that the sound pressure level of our modelled pile-driving noise in most of the frequencies under consideration is well above ambient noise up to a distance of 80 km to the source. Only the frequencies below 63 Hz and those above 2.5 kHz merge with ambient noise at 80 km from the source, thus not being audible. However, most of the energy of pile driving noise falling in the hearing range of our target species exceeds background noise over a range of at least 80 km (the upper limit of the attenuation model by Thiele (2002))17. Looking at the signal to noise ratio between the calculated RMS values and the background noise at 80 km distance18 it might be concluded that within the hearing range of cod and herring the sound level of pile driving noise exceeds background noise levels by as much as 47 dBrms (54 dBp-0 ) at 315 Hz. For dab and salmon sound pressure levels in 80 km distance are above the hearing threshold and / or ambient noise at certain frequencies. However, as mentioned above, the more appropriate input value for them would be particle motion and not sound pressure. It is true that in the far field, particle motion and sound pressure are proportional (Popper et al. 2003). However, since there are no measurements of the particle motion component of the pile-driving
17 The problems of transmission-loss calculations of frequencies below 100 Hz are explained in detail in chapter 4 18 For the calculations of RMS values from the SEL values, see chapter 2

Effects of offshore wind farm noise on marine mammals and fish
39
noise, the illustration for dab and salmon is just a first approximation of detection of pile-driving pulses in both species. It has to be also noted that for demersal fishes such as dab, the characteristics of the received sounds will be much different from those swimming in the water column as bottom-scattering and other effects will alter the pulse-sound significantly (Urick 1983; Richardson et al. 1995). Another important aspect is the sound propagation through the sediment and its probable detection by demersal species such as dab (for a description pathways of pile-driving noise see Nedwell et al. 2003a). In light of these extreme uncertainties, it is not possible to define the zone of audibility to pile-driving noise for dab and salmon. It might only be speculated that both might be able to detect the pile-driving signal over many kilometres.
Frequency (kHz)
0.01 0.1 1 10
SP
L (d
B re
1 µ
Pa)
20
60
100
140
180
220
260
0
40
80
120
160
200
240
SPL 1m SPL 100m SPL 400m SPL 1 km SPL 10 km SPL 80 km Audiogram dab Audiogram Atlantic cod Audiogram Atlantic herring Audiogram Atlantic salmon Ambient noise 3-8 m/s
Figure 16: Attenuation of pile-driving noise in different distances from the source, ambient noise levels, and audiograms of target fish species (Pile-driving noise after ITAP (2005) and Betke, pers. comm.; values as dB0-p re 1 µPa in 1/3 octave-bands; TL-calculations after Thiele (2002); ambient noise levels in 1/3 octave-bands in dBrms re 1 µPa after DEWI (2004); audiograms after Enger 1967; Chapman and Hawkins 1973; Chapman and Sand 1974; Hawkins and Johnstone 1978).
For the assessment of audibility in herring and cod, we also have to bear in mind that RMS values could only roughly be estimated, that full signal perception will probably happen only if pile-driving noise exceeds background noise levels to a certain degree, and that perception of short-impulsive sound will be probably worse than that of continuous noise as the threshold for detecting a brief sound generally declines as sound duration increases. For example, In goldfish

Effects of offshore wind farm noise on marine mammals and fish
40
(Carassius auratus), a 10-fold increase in duration produces a 10 dB-reduction in threshold up to a limit at about 400 ms when no threshold decrease is produced (Fay and Coombs 1983). Another important issue to be considered is the masking effect of ambient noise on the ability of a fish to perceive a signal. A sound of a given frequency will be potentially masked by noise components that are similar to the signal frequency. Noise components outside the bandwidth of auditory filters will have little interfering effect on signal detection (Fay and Simmons 1999). Masking has been investigated with respect to pure tones that are masked by broadband noise (e.g. Buerkle 1969; Chapman 1973; Chapman and Hawkins 1973; Tavolga 1974; Hawkins and Chapman 1975; Hawkins and Johnstone 1978). In how far ambient noise has the potential to mask an impulsive broadband noise such as pile driving remains uncertain. The width of the critical band in fishes varies with frequency and from species to species. In general, the bandwidth of the auditory filter increases with increasing frequency (e.g. 20 Hz for a 100 Hz signal as compared to 250 Hz for a 1,200 Hz signal; Chapman and Hawkins 1973; Fay and Simmons 1999). Hawkins and Johnstone (1978) calculated the effective bandwidth at 160 Hz for cod as 72.2 Hz. The 1/3 octave band for the 160 Hz centre frequency would be app. 37 Hz (see chapter 4) and might be therefore viewed as a very rough approximation of critical bands in this species. Given these uncertainties, the zone of audibility for our four target species can only be provisionally defined. Pile-driving noise has the potential to be detected over many kilometres by the four species, perhaps up to at least the upper limit of our transmission loss model in herring and cod. For dab and salmon the zone of audibility might be described as possibly extending many kilometres from the source.
7.4.2 Masking Sound production is widespread among teleost fish and use of sounds in vocal communication is common (for overviews see for example Tavolga 1971; Myrberg 1981; Hawkins and Myrberg 1983; Ladich 1997; Bass and McKibben 2003). The great majority of sounds are produced in a social context (Hawkins and Myrberg 1983), for example during aggression, defence, territorial advertisement, courtship and mating (Zelick et al. 1999). As discussed in the related section on marine mammals (see chapter 6.4.2), masking might be a less important issue considering pile-driving noise due to the intermittent nature of the sound. However, pile-driving might affect communication indirectly due to stress induced by the noise. It should also be noted that the temporal pattern of fish sounds, rather than the frequency spectrum is most important for communication in some fish (e.g. Winn 1964, Spanier 1979). Sequences of such sounds might indeed be masked by intermittent noise. We should therefore briefly look into use of communicative sounds in our target species with additional reference to closely related species. As no sound generation is known to occur during important biological behaviour patterns of dab, this chapter will focus on some observations on salmonid species and on herring with a more detailed look on cod and its relatives. Sound production in salmonid species (Salmo, Salvelinus and Oncorhynchus) is known to occur with major energy in the frequency range 100 - 500 Hz. Drum beats, produced by muscles associated to the swim bladder, seem to have a definite ‘nuptial’ function (Neproshin and Kulikova 1975). Herring produce sounds falling in three categories: incidental noises associated with jaw movements while feeding, tonal sounds (‘whistles’), and a variety of pulsed vocalisations (Fish and Mowbray 1970; Schwarz and Greer 1984; Wahlberg and Westerberg 2003; Wilson et al. 2004). In Pacific herring, trains of broadband pulses ranged in frequency from 1.7-22 kHz with durations between 0.6 and 7.6 s. Peak source levels were 143 dB re 1 µPa at 1-1.8 m (Wilson et al. 2004). Wahlberg and Westerberg (2003) found similar sounds in Atlantic herring, however, source levels were much lower and the active space – defined as the maximum zone of audibility for the signal – was estimated to be 1 m (Wahlberg and Westerberg 2003). The functions of these and other herring sounds are not known, but it is possible that they are used in communication (Wahlberg and Westerberg 2003; Wilson et al. 2004). It is difficult to assess potential masking effects of pile-driving noise on salmonid sounds, since for
Effects of offshore wind farm noise on marine mammals and fish
41
Atlantic salmon, even the zone of audibility can not be defined with certainty (see above). For herring, however, it is possible that pile-driving masks the mid-frequency part of pulsed signals over considerable distances, since the hearing threshold above 2 kHz is higher than ambient noise and masking distance is therefore solely depending on signal to noise ratio between pile-driving and hearing threshold (see Figure 16). Masking of communicative signals by anthropogenic noise might be important in gadoids. The importance of sound production in synchronising reproductive behaviour has been shown in haddock (Melanogrammus aeglefinus) by Hawkins and Amorim (2000). Studies by Hawkins and Rasmussen (1978) showed that out of the nine northern European Gadidae species, four produce sounds. Besides the cod, these were the haddock (Melanogrammus aeglefinus), the lythe (Pollachius pollachius), and the tadpole fish (Raniceps ranius). Cod produce deep grunting sounds during defensive and aggressive behaviour, and male cod grunt during courtship behaviour (Hawkins and Rasmussen 1978). No differences could be observed in the calls produced by cod in different social contexts (Hawkins and Rasmussen 1978). Whereas Brawn (1961) reported that the cod grunt showed a peak frequency at about 50 Hz, Hawkins and Rasmussen (1978) showed that the grunts were made up of a series of spaced low frequency harmonics, with greatest energy around 95 Hz. These grunts play an important role in the courtship behaviour (Brawn 1961; Hawkins and Rasmussen 1978). The sound level of the communication sounds of the closely related haddock (Melanogrammus aeglefinus) was determined to range up to 120 dB re 1 µPa in a distance of 1 m (reported in Wahlberg and Westerberg 2005). Wahlberg and Westerberg (2005) calculated that the maximum detectable distance for these sounds to be audible to another haddock would be 4 m. It has to be kept in mind that those sounds produced by haddock during courtship are even less noisy (Hawkins and Rasmussen 1978), therefore the detection distance will be smaller. As we saw above for herring, these rather short detection radii for communicative signals might be not exceptional. In addition, Myrberg (1978) provides an idea of how far intraspecific sounds can be received, resulting in maximal sound detection distances of 9 m in bicolor damselfish, 20 m in longspine squirrelfish, and 75 m in toadfish. Findings by Mann and Lobel (1997) support the view that the detection distance of damselfish courtship sounds is about 11 - 12 m. The spawning period of cod in the North Sea is in January and February (ICES 2004). Major spawning grounds are in the southern and western North Sea (Daan 1978; Rijnsdorp et al. 2002). A spatial overlap with potential wind farm locations can thus not be excluded, however, temporal overlaps are not very likely as construction of wind turbines has been currently taking place in spring and summer (Tougaard et al. 2003a). As we saw previously (chapter 5), transmission loss of low frequency signals is very difficult to predict for shallow waters with cut off frequencies possibly well above those proposed earlier in this paper (see also Frisk et al. 2003 for a detailed discussion on this topic). Looking at Figure 16, and deriving RMS-values for signal and noise ration calculations, we might provisionally conclude that the low-frequency part (95 Hz) of the pile-driving pulse will be transmitted over distances of up to 80 km before merging with the ambient noise. Zones of masking might therefore be quite large. However, these are preliminary conclusions and the importance of this issue on an individual or on a population basis can not be assessed on the current base of knowledge.
7.4.3 Responsiveness
The zone of responsiveness is the region within which fishes react behaviourally or physiologically to a given noise. Behavioural effects, such as avoidance of the area, have to be considered in particular when areas of special biological interest for a species, like breeding grounds, migratory routes, or schooling areas are concerned. However, due to the only very limited number of relevant studies on this topic, estimating responsiveness by fish to wind farm related noise requires even more assumptions than were required for the calculation of the zones of audibility and masking. We shall therefore take a rather broad look at this issue first, and then focus on more specific studies investigating reactions of different species to pile-driving noise.
Effects of offshore wind farm noise on marine mammals and fish
42
Physiological stress due to noise exposure was found in an experimental seismic survey in the open sea that led to typical stress response in caged European Sea Bass (Dicentrarchus labrax). For example, levels of cortisol and glucose were increased (Santulli et al. 1999). The sound emission was in the range of 80 - 100 dB re 1 µPa. In the low frequency range, it was only slightly above the level of background noise. A return of biochemical parameters to physiological values occurred within 72 hours (Santulli et al. 1999). In goldfish, a transient spike in plasma cortisol did occur after 10 minutes exposure to white noise at 170 dB re 1 µPa (Smith et al. 2004a). Cortisol levels returned to reference levels within 1 h. The lack of a long-term stress response was attributed to two possible reasons: either acclimatisation or/and a reduction of the level of perceived noise induced by damage to the hearing system (Smith et al. 2004a; for TTS see below). Behavioural effects vary greatly, depending on the physical properties of the sound, the species investigated and methodology. Several investigations have demonstrated an attracting effect of sound on some fish species (e.g. Richard 1968; Myrberg et al. 1972; Chapman et al. 1974; Culik et al. 2001). Deterring effects of very high-frequency sound (ultrasound) have been shown for various clupeid species (Dunning et al. 1992; Nestler et al. 1992; Ross et al. 1993, 1996; Gregory and Clabburn 2003). Startle responses in herring shoals were caused by frequencies between 70 Hz und 200 Hz (Blaxter et al. 1981; Blaxter and Hoss 1981). A deterring effect of infrasound on juvenile salmonids has been demonstrated by Knudsen et al. (1992, 1994, 1997) when the fish are very close (within a few meters) of the source. Sole (Solea solea) avoided noisy regions in a wind influenced aquarium. Wind effects were especially in the low frequency range (40 - 140 Hz) effective (Lagardère et al. 1994) (see Hastings and Popper 2005 for a review). The difficulties in investigating responsiveness to noise in fish have consequences for deriving appropriate threshold values for behavioural reactions. For example, it has been proposed that sound pressure levels of 90 dB above the hearing threshold in fish lead to significant avoidance reactions, with mild behavioural reactions occurring at 70 dB (75 dB by Nedwell et al. 2003a) above the hearing threshold (Nedwell et al. 2003b in: Nedwell and Howell 2004). These values were derived from studies on humans and reportedly supported by a study by the same investigators on the efficiency of fish deflecting systems (Nedwell et al 2003b in: Nedwell and Howell 2004). Based on these values, Nedwell et al. (2003a) calculated zones where significant avoidance reactions to piling noise at North Hoyle wind farm were to be expected as 1.4 km (salmon), 5.5 km (cod) and 1.6 km (dab). However, as described in chapter 6.4.3, the exact calculation of these dBht values (ht = hearing threshold) remains uncertain and support from experimental studies in peer-reviewed format is lacking to date. Therefore, the ranges calculated might be viewed as only very provisional, needing much further evaluation (see discussion in Nedwell et al. 2003a). Thresholds for avoidance might be even much less than those described above. In the context of the effects of shipping noise on fish, Mitson (1995, 2000) proposed a threshold value of only 30 dB above hearing threshold for the induction of avoidance behaviour in fish. However, this was based on no experimental work. Hastings and Popper (2005) provide an overview of results from five recent experimental studies looking at the effects of pile driving on fish. Four of them took place off the U.S. west coast, one was undertaken in Great Britain. Species investigated included the shiner surfperch (Cymatogaster aggregate), Sacramento blackfish (Orthodon microlepidotus), brown trout (Salmo trutta), steelhead (Oncorhynchus mykiss), Chinook salmon (Oncorhynchus tshawytscha) and northern anchovy (Engraulis mordax). Behavioural observations were undertaken on caged fish held at different distances from piling (methods reviewed in Hastings and Popper 2005). However, as mentioned by Hastings and Popper (2005), experimental conditions were in most cases difficult to control and the conclusions drawn from some of the studies might be viewed as being rather limited. For example, Nedwell et al. (2003c) placed brown trout in cages positioned at different distances from vibro and impact pile-driving operations in Southampton harbour and filmed them using close-circuit television monitoring. ‘Startle-reactions’ and ‘Fish
Effects of offshore wind farm noise on marine mammals and fish
43
activity level’ were investigated prior and during piling, with activity levels measured by counting the number of times a fish entered the camera’s field of view within a two-minute observation period. Controls were performed on the same animals as tested and control and event activity levels were compared with a Mann-Whitney U-test (Nedwell et al. 2003c). The observations revealed no evidence that trout reacted to impact piling at 400 m, nor to vibropiling at close ranges (<50 m; source level of impact pile-driving = 194 dBp-p re µPa). However, since control observations were performed on the same animals as tested, the results are difficult to interpret. It should also be noted that not all of the cage but only a part of it – the long diagonal - could be observed. How many animals were placed in the different cages was also not stated and it might be only speculated that this was the same number (n=10) than was examined later for injuries (for a detailed critical review of this and the four other studies see Hastings and Popper 2005). One would probably assume that our target species should show stronger avoidance to narrowband signals within ranges of best hearing than to broadband pile-driving noise. However, Dunning et al. (1992) found stronger reactions of clupeid fishes to broad-band stimuli than to pure tones. It can also be expected that short sounds such as pile-driving noise will lead to higher reaction thresholds compared to longer signals. However, as indicated above, data on behavioural reactions to pile-driving noise is so sparse and probably questionable, that conclusions on responsiveness would be extremely premature. Avoidance and flight reactions, startle and alarm response, and changes of shoaling behaviour are possible reactions. Stress resulting from such responses might in turn lead to higher susceptibilities to diseases (e.g. Bucke et al. 1983; Dethlefsen 1985; Vethaak and Rheinallt 1992). However, we believe that too many gaps exists in our knowledge on how fish react to pile-driving noise to derive a solid estimate on the zone of responsiveness for dab, salmon, cod and herring. Playback studies, using broadband impulsive emissions, simulating ramming pulses, or field studies during piling activities, performed under well controlled conditions, are urgently needed to further assess behavioural reactions and the zones of their incidence.
7.4.4 Temporary threshold shift
Temporary threshold shifts (TTS) – the temporal elevation of the hearing threshold due to noise exposure – was investigated in some laboratory studies, with the stimulus being either pure tones or white noise. TTS was induced in hearing specialists, whereas hearing generalists usually were not affected (Table 4). As Hastings and Popper (2005) point out, the sound stimulus in these studies consisted of only pressure, whereas hearing generalists are primarily sensitive to particle motion. Therefore no TTS was to be expected. After 4 h of sound exposure, TTS in goldfish lasted 2 - 4 h, with complete recovery afterwards (Popper and Clarke 1976). After 24 h of exposure, full recovery from a 28 dB shift took the same species 14 days (Smith et al. 2004a).
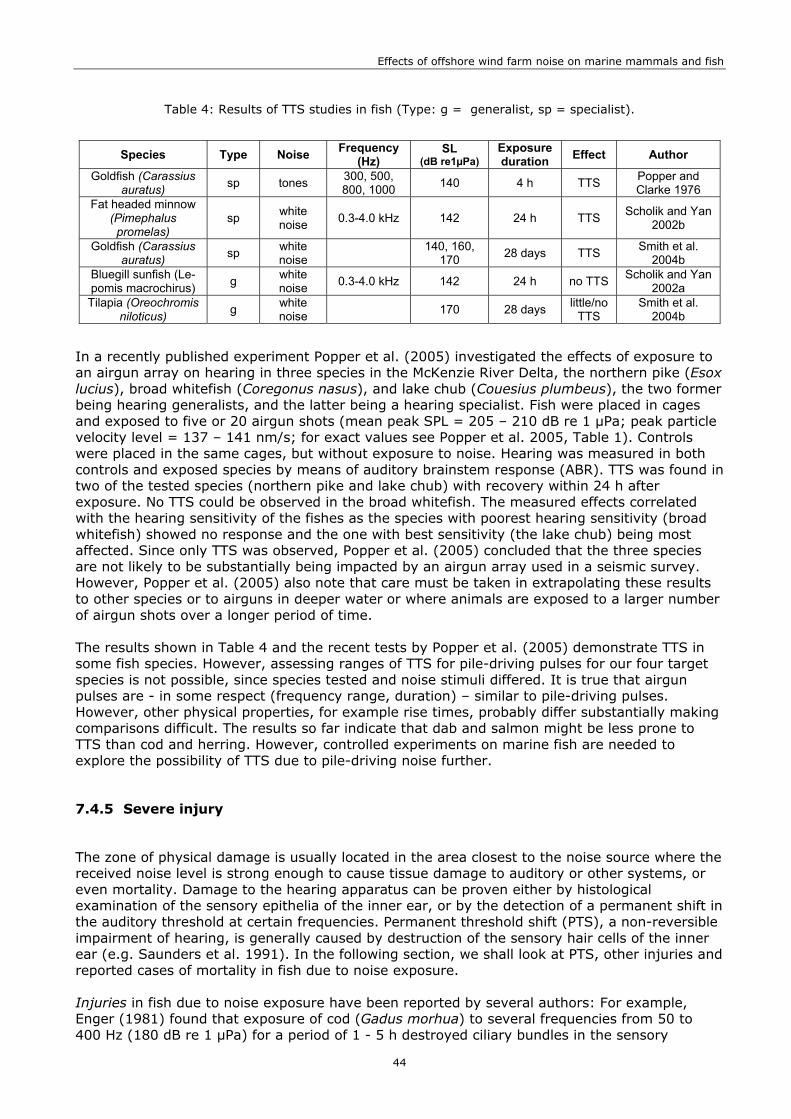
Effects of offshore wind farm noise on marine mammals and fish
44
Table 4: Results of TTS studies in fish (Type: g = generalist, sp = specialist).
Species Type Noise Frequency (Hz)
SL (dB re1µPa)
Exposure duration Effect Author
Goldfish (Carassius auratus) sp tones 300, 500,
800, 1000 140 4 h TTS Popper and Clarke 1976
Fat headed minnow (Pimephalus promelas)
sp white noise 0.3-4.0 kHz 142 24 h TTS Scholik and Yan
2002b
Goldfish (Carassius auratus) sp white
noise 140, 160, 170 28 days TTS Smith et al.
2004b Bluegill sunfish (Le-pomis macrochirus) g white
noise 0.3-4.0 kHz 142 24 h no TTS Scholik and Yan 2002a
Tilapia (Oreochromis niloticus) g white
noise 170 28 days little/no TTS
Smith et al. 2004b
In a recently published experiment Popper et al. (2005) investigated the effects of exposure to an airgun array on hearing in three species in the McKenzie River Delta, the northern pike (Esox lucius), broad whitefish (Coregonus nasus), and lake chub (Couesius plumbeus), the two former being hearing generalists, and the latter being a hearing specialist. Fish were placed in cages and exposed to five or 20 airgun shots (mean peak SPL = 205 – 210 dB re 1 µPa; peak particle velocity level = 137 – 141 nm/s; for exact values see Popper et al. 2005, Table 1). Controls were placed in the same cages, but without exposure to noise. Hearing was measured in both controls and exposed species by means of auditory brainstem response (ABR). TTS was found in two of the tested species (northern pike and lake chub) with recovery within 24 h after exposure. No TTS could be observed in the broad whitefish. The measured effects correlated with the hearing sensitivity of the fishes as the species with poorest hearing sensitivity (broad whitefish) showed no response and the one with best sensitivity (the lake chub) being most affected. Since only TTS was observed, Popper et al. (2005) concluded that the three species are not likely to be substantially being impacted by an airgun array used in a seismic survey. However, Popper et al. (2005) also note that care must be taken in extrapolating these results to other species or to airguns in deeper water or where animals are exposed to a larger number of airgun shots over a longer period of time. The results shown in Table 4 and the recent tests by Popper et al. (2005) demonstrate TTS in some fish species. However, assessing ranges of TTS for pile-driving pulses for our four target species is not possible, since species tested and noise stimuli differed. It is true that airgun pulses are - in some respect (frequency range, duration) – similar to pile-driving pulses. However, other physical properties, for example rise times, probably differ substantially making comparisons difficult. The results so far indicate that dab and salmon might be less prone to TTS than cod and herring. However, controlled experiments on marine fish are needed to explore the possibility of TTS due to pile-driving noise further.
7.4.5 Severe injury
The zone of physical damage is usually located in the area closest to the noise source where the received noise level is strong enough to cause tissue damage to auditory or other systems, or even mortality. Damage to the hearing apparatus can be proven either by histological examination of the sensory epithelia of the inner ear, or by the detection of a permanent shift in the auditory threshold at certain frequencies. Permanent threshold shift (PTS), a non-reversible impairment of hearing, is generally caused by destruction of the sensory hair cells of the inner ear (e.g. Saunders et al. 1991). In the following section, we shall look at PTS, other injuries and reported cases of mortality in fish due to noise exposure. Injuries in fish due to noise exposure have been reported by several authors: For example, Enger (1981) found that exposure of cod (Gadus morhua) to several frequencies from 50 to 400 Hz (180 dB re 1 µPa) for a period of 1 - 5 h destroyed ciliary bundles in the sensory

Effects of offshore wind farm noise on marine mammals and fish
45
epithelia. Denton and Gray (1993) observed destruction of the hair cells in the lateral line organ in clupeids by exposition to a sound level of 153 - 170 dB re 1 µPa. Hastings et al. (1996) found evidence of cupula damage in a hearing generalist, the oscar (Astronotus ocellatus), by the exposition to 300 Hz continuous tones at 180 dB re 1 µPa for 1 h. Neither lower sound levels (100 resp. 140 dB re 1 µPa) nor 60 Hz tones caused any damages. Exposure of caged pink snapper (Pagurus auratus) to signals from an air-gun resulted in extensive damage to their saccular sensory epithelia that was apparent as ablated hair cells. The air-gun had a source level at 1 m of 223 dBp-p re 1 µPa (or 204 dBrms re 1 µPa). The damage was regionally severe, with no evidence of repair or replacement of damaged sensory cells up to 58 days after air-gun exposure (McCauley et al. 2003). In the course of the San Francisco Oakland Bay Bridge Project, a variety of external and internal injuries, including reddening of the liver, rupture of the swim bladder, or internal bleedings were observed (Caltrans 2001). In another study, no physical injuries were observed in caged sea trout within a radius of 400 m from the piling (SL = 194 dBp-p re 1 µPa) in the harbour of Southampton during construction of the Red Funnel Terminal (Nedwell et al. 2003c). There is also evidence from reports in the grey literature that pile driving kills fishes of several different species if they are sufficiently close to the source (review by Hastings and Popper 2005). For example, mortalities were observed after pile-driving in the course of the San Francisco-Oakland Bay Bridge Demonstration Project, USA. Sound levels at a distance of 100 - 200 m from the pile were between 160 and 196 dBrms re 1 µPa (Caltrans 2001). Fish were found dead primarily within a range of 50 m (n=13). The external and internal injuries which were observed gave reason to assume that there might have been further mortalities, especially of species with swim bladders. The zone of direct mortality was about 10 - 12 m from piling, the zone of delayed mortality was assumed to extend out at least to 150 m to app. 1000 m from piling. Tests on caged fish revealed greater effects when using a larger hammer (1700 kJ, as compared with 500 kJ). The greatest effects were observed in a range of 30 m from piling. Preliminary results indicated increasing damage rates to the fish together with extended exposure times (Caltrans 2001). However, reviewing these and other studies, Hastings and Popper (2005) point out that the results provided are yet highly equivocal. They note, for example, that no clear correlation between the level of sound exposure and the degree of damage could be determined. They also criticise that in most of the studies, ‘pathology was done on fish that did not receive appropriate pathological or histological preparation or analysis’. Finally, in some studies it could not be ensured that exposed and control animals were treated identically (for a more detailed review on the pathological methods used see Hasting and Popper 2005; pp 40). To summarise, some reports in the grey literature indicate that severe damage due to pile-driving noise is possible. However, in light of the possible pitfalls of some of the analysis, it is our view that much more research is required to investigate the extend and dimension of physical effects due to pile-driving.
7.5 Effects of operational noise
Audibility: As in the section on marine mammals, the measurement at a 1.5 MW turbine in Sweden (ITAP 2005) represents the basis for the following calculations. Values are presented together with ambient noise data (Figure 17). Ambient noise measurements were performed in the Baltic Sea at wind speeds of 3 m/s (ITAP 2005). These values were corrected for higher wind speeds likely to be expected during the operational phase of a wind farm (see chapter 3.4). In 1 km distance to the turbine, the operational noise already merges with ambient noise. However, throughout the operational phase, diverse wind conditions are to be expected. At times with lower wind speeds, ambient noise might be reduced, leading to different signal-to-noise ratios. However, with decreasing wind-speeds, sound emissions from a turbine will also decrease. It is therefore likely that both factors even each other out.

Effects of offshore wind farm noise on marine mammals and fish
46
Figure 17 indicates that audibility is limited by ambient noise for cod and herring. On the other hand, the poor hearing sensitivities of dab and salmon indicate that the level of ambient nose will be below their hearing threshold, thus not audible to them. The perception of operational noise by these two species is therefore only limited by their hearing threshold.
Frequency (kHz)
0.01 0.1 1
SP
L (d
B re
1 µ
Pa)
50
70
90
110
130
150
60
80
100
120
140
SPL 1m SPL 100m SPL 1 km Audiogram dab Audiogram Atlantic cod Audiogram Atlantic herring Audiogram Atlantic salmon Ambient noise 12 m/s
Figure 17: Attenuation of operational noise in different distances from the source, ambient noise levels and audiograms of target fish species (operational noise after ITAP (2005); values as dBrms re 1 µPa in 1/3 octave-bands; TL-calculations after Thiele (2002); background noise levels in 1/3 octave-bands in dBrms re 1 µPa after Betke et al. (2004); audiograms after Enger 1967; Chapman and Hawkins 1973; Chapman and Sand 1974; Hawkins and Johnstone 1978).
In light of the extreme uncertainties in defining an appropriate cut off frequency for the relatively shallow site at Utgrunden (see chapter 3.2), we shall focus on those parts of the noise spectrum with peaks at higher frequencies, i.e. the one at 160 Hz instead of the 50 Hz-peak. Detection thresholds might be defined for ranges where third octave band received noise equals the ambient noise level. In cod, the best s/n ratio is 55 dB at a frequency of 200 Hz (signal=141 dB re 1 µPa, hearing threshold=86 dB re 1 µPa), resulting in a theoretical detection distance for the operational noise of a wind turbine of 4.6 km, calculated with a transmission loss of 15 log (r). Accordingly, the theoretical detection range might be calculated for herring as 4.6 km (Table 5)19. Due to their different detection mechanism, no ranges for salmon and dab can be calculated. However, bearing in mind that particle motion and pressure might be proportional under certain circumstances (see above), Figure 17, indicates that the zone of audibility might be much smaller, perhaps limited to around 1 km in both species.
19 For these frequencies and comparably short distances, the Thiele (2002) formula performs similar results to 15 log (r)

Effects of offshore wind farm noise on marine mammals and fish
47
Table 5: Input data for the calculation of audibility ranges for cod and herring (ht=hearing threshold; an=ambient noise).
species best s/n-ratio
[dB] frequency at
best s/n-ratiosignal
[dB re 1 µPa] lower limit
[dB re 1 µPa]
range of audibility
[km]
cod 55 200 141 86 (an) 4.6
herring 55 200 141 86 (an) 4.6
Wahlberg and Westerberg (2005) estimated detection distances for the operational noise of turbines from the same wind farm for wind speeds of 13 m/s of 0.5 km for Atlantic salmon, 7 km for cod, and 15 km for goldfish (as a representative for hearing specialists). However, their calculations were based on slightly different values both for turbines and ambient noise, and a transmission loss of 13 log (r). We have to consider though, that our approximation is resting on the assumption that 1/3 octave bands resemble critical bands in fish. After Hawkins and Chapman (1975) the critical bandwidth of cod at 180 Hz is 72-91 Hz, resulting in critical ratios between 18.5 and 19.5 dB. For 1/3 octave centre frequencies 160 and 200 Hz, the corresponding values would be 15.6 and 16.6 dB. As critical ratios have to be added to the spectrum noise density level to derive the received noise level, our method of integrating critical bands would overestimate hearing ranges to a certain degree. Another factor that has to be considered – and that is acting in the different direction - is that noise itself should only be integrated over the filter bandwidth, if the bandwidth of the noise is at least as wide as the filtering bandwidth. Since noise from offshore turbines has tonal qualities shorter than the measured 1/3 octave band, our noise integration method has to be viewed with caution. However, looking at results from the same site, the peaks around 180 Hz in spectral density and the corresponding 1/3 octave sound pressure levels had very similar values (see Madsen et al. 2006; Figure 2). We therefore believe our method to be an accurate description of the emitted noise. It has to be further noted that these ranges are only applicable for the area where our measurements were obtained (Baltic Sea). Ambient noise in the North Sea is in most areas much higher than in the Baltic (see DEWI 2004; Madsen et al. 2006) and therefore the detection ranges might be much smaller. With regard to operational noise, the effect of the acoustic near field has to be taken into consideration. In close proximity to the wind turbine, the particle motion component will be much higher for the respective sound pressure values. This is especially important for fish species that are primarily sensitive to particle motion, e.g. our target species dab and salmon. Assuming the model of a simple monopole structure, the extension of the near field can be assessed for the frequency components of 16 Hz in the operational noise (chapter 3.2) as r=λ/2 (with r=distance (m); λ=wavelength=c/f with c=sound velocity in water=1,484 m/s; f=frequency) (Hawkins 1993) as r=47 m. The extension of the 50 Hz component would result in a near filed up to a distance of 14 m from the source. As the assumption of a monopole structure is only a rough estimation, these values are only to be taken as an indication about how far the near field might extend. In conclusion, in a range of probably less than hundred metres around the turbines, hearing generalists that are primarily sensitive to particle motion will perceive much higher relevant impulses. To summarise, our calculations indicate that dab and salmon might detect operational noise of a wind turbine at relatively short distances of no more than 1 km. The zone of audibility for cod and herring will be larger, perhaps up to 4-5 km from the source. However, these values have to be viewed as preliminary. Masking: Depending on signal characteristics, the zone of masking – defined here as the distance where wind turbine noise might reduce the maximum detection distance between signaller and receiver - might extend as far as the zone of audibility in some cases. However, as

Effects of offshore wind farm noise on marine mammals and fish
48
stated above, we are not yet able to exclude that the 50 Hz peak in the measurements was prone to electric noise nor is it possible to define a precise cut off frequency for shallow water habitats. For species with signals higher than 50 Hz, for example salmon and cod, the resulting area of masking might be close to the zone of audibility (see Wahlberg and Westerberg 2005). For the mid-frequency burst-pulse signals of herring, however, masking should only occur at very close ranges, since noise-levels of the turbine exhibit main energy at considerably lower frequencies. Responsiveness: The only investigation dealing with the impact of wind farm induced operational noise specifically on fish was conducted by Westerberg (1994, 2000) at the Svante wind farm in Sweden. By means of ultrasonic telemetry and fishing, it was shown that European eels (Anguilla anguilla) passing a single (220 kW) wind turbine at a distance of 0.5 km did not substantially change their swimming behaviour. When the rotor was stopped, the catch rates of cod and roach (Rutilus rutilus) were significantly higher in the vicinity of the turbine (100 m) than at distances between 200 and 800 m. These findings indicate an attraction for fish, possibly due to the reef effect. By contrast, during operation, the catch rate decreased by a factor of 2 within 100 m from the windmill under otherwise similar conditions. This could be interpreted as a displacement effect. However, no investigations of the variation in fish density were performed prior to construction, so the differences may be attributable to other factors. As audibility in the four species is limited to a few kilometres or less, aversive responses might be expected only in the close vicinity of the turbine. Wahlberg and Westerberg (2005) estimated the range to which fish be scared away from a wind turbine to be only 4 m. However, while the construction phase will be terminated after about 1 year, the operational phase will last for about 25 years, considering the possibility of ‘re-powering’ (construction of a new turbine on an existing grounding) up to 50 years. An important issue for future investigations will be habituation by fish to the continuous operational sound of wind turbines. Habituation has been observed in some investigations (Larsson 1992 in: Westerberg 1994; Knudsen et al. 1997). On the other hand, there are studies that found no habituation to continuous sound emissions (Enger et al. 1993; Engås et al. 1995). Hawkins (1973) concludes that observations support the view that fish are rapidly able to assess the importance of a particular stimulus. This would indicate a possible habituation of fishes to wind farms. Physical damage: Based on the present state of knowledge, it is highly unlikely that the sound levels during operation of wind turbines will cause physical damage to the fish fauna. An important limitation of the calculations presented in the course of this study is that only measurements of single small wind turbines are available. Finally, it has to be kept in mind that the offshore wind farms in the North and Baltic Seas are planned with much larger turbines of the 5-6 MW class, therefore higher sound levels are to be expected and radii of noise influence will probably increase, even under North Sea ambient noise conditions (DEWI 2004; see chapter 6.5).
7.6 Effects of ship noise
Data on the effects of research vessels on fish were compiled by Mitson (1995). The focus was on cod (Gadus morhua) and herring (Clupea harengus), as these species seem to have the best hearing capabilities among the commercially exploited species. Besides avoidance reactions, a number of studies observed an impact on shoaling behaviour (review by Vella et al. 2001). Scholik and Yan (2002b) caused a significant increase of hearing threshold (TTS) in the fat-headed minnow (Pimephalus promelas) by experimental exposure to boat engine noise. The knowledge of the effects of the sound of ships on fish, and especially that generated by ships using sonar systems, is recently summarised by ICES (2005). The authors note that it is difficult to draw definite conclusions. The data currently available on the response of fish to sounds is

Effects of offshore wind farm noise on marine mammals and fish
49
not yet sufficient to develop scientifically supportable guidance on exposure to sound that will not harm fish. Maintenance and supply of the wind farms will probably lead to ship traffic during the entire operational phase. Based upon the experiences from the Danish wind farm Horns Reef, it may be assumed that each turbine will require one to two days of maintenance work per year (Zucco 2005). Extrapolations to an entire wind farm with 80 turbines (maximum pilot phase in German wind farms according to Dahlke (2002) and SRU (2004)) lead to the assumption that ships will be present in wind farm regions during up to 160 days per year. The acoustic disturbances and their effects on the fish fauna will consequently not be restrained to the construction phase of a wind farm. Noise generated by shipping and by offshore wind farms is considered to act in an additive manner.
8. Mitigation measures Mitigation measures might first focus on construction, since zones of noise influence are rather large. They can both deal with the source of noise as well as the receiver, in this case harbour porpoises, seals and fish. Looking at the source, there are several mitigation options currently in discussion in different working groups, among them the ‘Arbeitskreis Schallimmissionen von Offshore-WEA’ of Ministry of the Environment, Germany (AKS, personal communication):
1. Extending the duration of the impact during pile-driving (decrease of 10-15 dB in SL; mostly at higher frequencies > 2 kHz)
2. Mantling of the ramming pile with acoustically-isolated material (plastic etc.; decrease of 5 –25 dB in SL; higher frequencies better than lower ones)
3. Air-bubble curtain around the pile (decrease of 10-20 dB, depending on frequency; Würsig et al. 2000)
4. Soft-start / ramp-up procedure (slowly increasing the energy of the emitted sound; Richardson et al. 1995)
The methods mentioned above have benefits and costs: extending the duration of the impact, reduces source levels very efficiently but has biological implications since signals of longer duration would mask harbour seal and possibly harbour porpoise communication signals to a greater extent than shorter signals. The method is also limited technically, since shorter pulses are more effective in driving the pile into the bottom than longer ones. Mantling seems to be very promising but has so far only been tested in a relatively short pile (AKS, pers. comm.). Air bubble curtains are very expensive and might be only effective in relatively shallow water (Knust et al. 2003). Soft-start procedures are theoretically promising but their effect hasn’t been tested to a large degree. Ramping-up might also make it more difficult for cetaceans and seals localizing the sound source (Richardson et al. 1995). Precautionary mitigation measures would include not carrying out pile-driving in confined areas in close proximity to migrating fish. If less noisy methods exist, these should be preferentially be used. Times of special sensitivity (migration peaks, spawning time of fishes; breeding season in porpoises) might be avoided. Time frames should also be allowed for with respect to the danger of masking during spawning of gadoid fishes. Looking at the receiver, acoustic harassment devices have been used, both for seals and harbour porpoises and have proven to be effective in scaring the animals away from the source (Yurk et al. 2000; Culik et al. 2001). Culik et al. (2001) reported a mean avoidance zone of 500 m around a ‘pinger’ for porpoises. Cox et al. (2001) reported a smaller avoidance response of app. 208 m. Therefore, both systems seem to work at relatively short ranges, below the potential TTS zones (see above). It might therefore be necessary to deploy several pingers in different distances from the construction site (see also the potential impact of seal-scarers on harbour porpoises under chapter ‘responsiveness’).

Effects of offshore wind farm noise on marine mammals and fish
50
9. Conclusions By compiling this report we tried to avoid producing rather firmative conclusions based on limited data sets, however, we were also reluctant in saying little for the sake of being ‘on the safe side’. Our attempt should therefore be viewed as an assessment based on the data available, with all uncertainties inherent in such an approach. More precise information on turbine emissions (sound pressure and particle motion), in situ measurements of attenuation and on the hearing capabilities of different species are needed to provide a more detailed assessment in the future. Especially one gap in our knowledge became apparent: No sound assessment is possible without threshold values for certain effects. However, these values can not be solely defined on a theoretical basis. A number of literature reviews concerning sound induced effects on marine mammals and fish have already been performed (e.g. Gladwin et al. 1988; Richardson et al. 1995; Vella 2001; Würsig and Richardson 2002; Knust et al. 2003; Nedwell and Howell 2004; Hastings and Popper 2005; ICES 2005; Wahlberg and Westerberg 2005; Madsen et al. 2006; Keller et al. in press), and each of them added some new conclusions. But as long as proposed threshold values vary by as much as 60 dB for fishes (Nedwell et al. 2003a; Mitson 2000), they do not provide a solid basis to work with. In our view it is most important to note that assessments can not replace good empirical data and the need for that should have become clear by reading the previous sections. However, with the extensive plans for future marine development, it is very likely that many wind farms will be placed into European coastal waters in the very near future and it is our obligation to provide the necessary information on their possible impacts now. This assessment provided further evidence that wind farm related noise has the potential to affect the physiology and behaviour of harbour porpoises and harbour seals at considerable distances. During ramming, the zone of audibility will most certainly extend well beyond 80 km (the upper limit of our transmission loss formula), perhaps hundreds of kilometres from the source. Behavioural responses are possible over many kilometres, perhaps up to ranges of 20 km. Masking might occur in harbour seals at least up to 80 km and hearing loss is a concern – on the basis of a regulatory approach - at 1.8 km in porpoises and 400 m in seals. Further, severe injuries in the immediate vicinity of ramming activities can not be ruled out. During operation, smaller turbines of 1.5 MW should have only minor influences, as the detection radii in both species are rather small. However, since operational noise of larger turbines can not be assessed reliably yet, these results are rather preliminary. It is very likely that larger turbines are noisier resulting in much larger zones of noise influence. Cod and herring will be able to perceive piling noise at large distances, perhaps up to 80 km from the sound source. Dab and salmon might detect pile-driving pulses also at considerable distances from the source. However, since both species are predominantly sensitive for particle motion and not pressure, the detection radius can not be defined yet. Behavioural effects, like avoidance and flight reactions, alarm response, and changes of shoaling behaviour are possible due to piling noise. The spatial extension of the zone of responsiveness can not be calculated, as the available threshold levels vary greatly. The zone of potential masking might in some cases coincides with the zone of audibility. Also physical effects, like internal or external injuries or deafness (TTS/PTS) up to cases of mortality, may happen in the close vicinity to pile-driving. Operational noise of wind turbines will be detectable up to a distance of app. 4 km for cod and herring, and probably up to 1 km for dab and salmon. Within this zone, also masking of intraspecific communication is possible. Behavioural and/or physiological (stress) effects are possible due to operational wind farm noise. However, they should be restricted to very close-ranges.

Effects of offshore wind farm noise on marine mammals and fish
51
10. Acknowledgements We like to thank W.W.L Au, P.E. Nachtigall, A.N. Popper and P. T. Madsen for supplying us with valuable information and also literature – sometimes ‘hot from the press’ - as we went along. We are very grateful to A.D. Hawkins, M. Laczny, P.T. Madsen, and A.N. Popper for providing comments on earlier versions of this report. K. Betke and M. Schultz-von Glahn not only provided the noise measurements presented here, but also helped a great deal answering our numerous technical questions. The ‘Arbeitskreis Schall’ (BfN, DEWI, ITAP, Kurt Risch Institut, University of Hannover) was very informative and instructive, considering all possible technical details. Finally, we would like to thank D. Bürkel for his drawing of the harbour porpoise which we used several times in the graphics.
11. References
Amundin, M. (1991). Sound production in odontocetes with emphasis on the harbour porpoise, Phocoena phocoena. Doctoral Dissertation, Department of Zoology, Division of Functional Morphology, University of Stockholm.
Andersen, S. (1970). Auditory sensitivity of the harbour porpoise Phocoena phocoena. In: G. Pilleri (ed.). Investigations on Cetacea, Vol II. - Institute of Brain Anatomy, Bern, 255-259.
Astrup, J. and Møhl, B. (1993). Detection of intense ultrasound by the cod (Gadus morhua). J. exp. Biol., 182, 71-80.
Au, W.W.L., R. A. Kastelein, T. Rippe and Schooneman, N.M. (1999a). Transmission beam pattern and echolocation signals of a harbor porpoise (Phocoena phocoena). J. Acoust. Soc. Am. 106, 3699-3705.
Au, W.W.L., Nachtigall, P.E. and Pawlowski, J.L. (1999b). Temporary threshold shift in hearing induced by an octave band of continuous noise in the bottlenose dolphin. J. Acoust. Soc. Am. 106, 2251.
Bass, A.H. and McKibben, J.R. (2003). Neural mechanism and behaviours for acoustic communication in teleost fish. Progress in Neurobiology 69, 1-26.
Betke, K., Schultz-von Glahn, M. and Matuschek, R. (2004). Underwater noise emissions from offshore wind turbines. Paper presented on CFA/DAGA 2004, 2 pp. (http://www.Itap.de/Itap.htm)
Blaxter, J.H.S. and Hoss, D.E. (1981). Startle response in herring: the effect of sound stimulus frequency, size of fish and selective interference with the acoustico-lateralis system. J. Mar. Biol. Ass. UK 61, 871-879.
Blaxter, J.H.S; Gray, J.A.B. and Denton, E.J. (1981). Sound and startle responses in herring shoals. J. Mar. Biol. Ass. UK 61, 851-869.
Brawn, V.M. (1961). Sound production by the cod (Gadus callarias). Behaviour 18, 239-255. Bucke, D., Feist, S.W., Norton, M.G. and Rolfe, M.S. (1983). A histopathological report of some epidermal
anomalies of Dover sole, Solea solea L., and other flatfish species in costal waters off south-east England. J. Fish Biol. 23, 565-578.
Buerkle, U. (1967). An audiogram of the Atlantic cod, Gadus morhua L. J. Fish. Res. Bd. Can. 24, 2309-2319.
Buerkle, U. (1968). Relation of Pure Tone Thresholds to Background Noise Level in the Atlantic Cod (Gadus morhua). J. Fish. Res. Bd. Can. 25, 1155-1160.
Buerkle, U. (1969). Auditory Masking and the Critical Band in Atlantic Cod (Gadus morhua). J. Fish. Res. Bd. Can. 26, 1113-1119.
Buwalda, R.J.A., Schuijf, A. and Hawkins, A. D. (1983). Discrimination by the cod of sounds from opposing directions. J. Comp. Physiol. 150, 175-184.
Caltrans ( (2001). Fisheries Impact Assessment. - San Francisco - Oakland Bay Bridge East Span Seismic Safety Project. PIPD EA 012081, Caltrans Contract 04A0148, Task Order 205.10.90, PIPD 04-ALA-80-0.0/0.5: 57 pp.
Effects of offshore wind farm noise on marine mammals and fish
52
Chapman, C.J. (1973). Field studies of hearing in teleost fish. Helgoländer wiss. Meeresunters. 24, 371-390.
Chapman, C.J. and Hawkins, A.D. (1973). A field study of hearing in cod, Gadus morhua. J. Comp. Physiol. 85, 147-167.
Chapman, C.J. and Sand, O. (1974). Field studies of hearing in two species of flatfish Pleuronectes platessa (L.) and Limanda limanda (L.) (Family Pleuronectidae). Comp. Biochem. Physiol. 47A, 371-385.
Chapman, C. J., Johnstone, A. D. F., Dunn, J. R. and Creasey, D. J. (1974). Reaction of Fish to Sound Generated by Divers' Open-Circuit Underwater Breathing. Mar. Biol. 27, 357-366.
Coombs, S. and Montgomery, J.C. (1999). The Enigmatic Lateral Line System. In: Fay, R.R. and Popper, A.N. (eds.). Comparative Hearing: Fish and Amphibians, 319-362.
Cox, T.M., Read, A.J., Solow, A. and Tregenza, N. (2001). Will harbour porpoises habituate to pingers?. J. Cetacean Res. Manage. 3, 81-86.
Culik, B.M., Koschinski, S., Tregenza, N. and Ellis, G.M (2001). Reactions of harbour porpoises Phocoena phocoena and herring Clupea harengus to acoustic alarms. Mar. Ecol. Progr. Ser. 211, 255-260.
Cummings, J. (2003). Seismic Surveys: What we don’t know may hurt – Report prepared for Greenpeace. Acoustic Ecology Institute Santa Fe, USA.
Daan, N. (1978). Changes in cod stocks and cod fisheries in the North Sea. Rapp. P.-v. Reun. Int. Explor. Mer. 172, 39-57.
Dahlke, C. (2002). Genehmigungsverfahren von Offshore-Windenergieanlagen nach der Seeanlagenverordnung. Natur und Recht, 24, 472-479.
David, J.A. (2006). Likely sensitivity of bottlenose dolphins to pile-driving noise. Water and Environment Journal 20 , 48-54.
Denton, E.J. and Gray, J.A.B. (1993). Stimulation of the acusto-lateralis system of clupeid fish by external sources and their own movement. Philosophical Transactions of the Royal Society of London, B. 341, 113-127.
Dethlefsen, V. (1985). Krankheiten von Nordseefischen als Ausdruck der Gewässerbelastung. Abhandlung Naturwissenschaftlicher Verein Bremen 40, 233-252.
DEWI (2004). Deutsches Windenergie-Institut: Standardverfahren zur Ermittlung und Bewertung der Belastung der Meeresumwelt durch Schallimmissionen von Offshore-Windenergieanlagen. -Abschlussbericht zum Forschungsvorhaben 0327528A an das BMU, 123 pp.
Dunning, D.J., Ross, Q.E., Geoghegan, P., Reichle, J.J., Menezes, J.K. and Watson, J.K. (1992). Alewives avoid high-frequency sound. N. Am. J. Fish. Manage. 12, 407-416.
Edrén, S.M.C., Teilmann, J., Dietz, R. and Carstensen, J. (2004). Effects from the construction of Nysted Offshore Wind Farm on seals in Rødsand seal sanctuary based on remote video monitoring. Report request. Commissioned by ENERGI E2 A/S. National Environmental Research Institute. 31 p.
Engås, A., Misund, O.A., Soldal, A.V., Horvei, B. and Solstads, A. (1995). Reactions of penned herring and cod to playback of original, frequency-filtered and time-smoothed vessel sound. Fisheries Research 22, 243-254
Enger, P.S. (1967). Hearing in Herring. Comp. Biochem. Physiol. 22, 527-538.
Enger, P.S. (1981). Frequency discrimination in teleosts - central or peripheral? In: Tavolga, W.M., Popper, A. N. and Fay R.R. (eds.). Hearing and Sound Communication in Fishes. Springer , New York, 243-255.
Enger, P.S., Kalmijn, A.D. and Sand, O. (1989). Behavioural investigations on the function of the lateral line and inner ear in predation. In: Coombs, S., Görner, P. and Münz, H. (eds.) The mechanosensory lateral line. Springer-Verlag, New York, 375-387.
Enger, P.S., Karlsen, H.E., Knudsen, F.R. and Sand, O. (1993). Detection and reaction of fish to infrasound ICES Mar.Sci.Symp. 196, 108-112.
Erbe, C. (2002). Underwater noise of whale-watching boats and potential effects on killer whales (Orcinus orca), based on an acoustic impact model. Mar. Mamm. Sci. 18, 394-419.
Erbe, C. and Farmer, D.M. (2000). Zones of impact around icebreakers affecting beluga whales in the Beaufort Sea. J. Acoust. Soc. Am. 108, 1332-1340.

Effects of offshore wind farm noise on marine mammals and fish
53
Evans, P.G.H. and Miller, L.A. (2004). Proceedings of the workshop on active sonar and cetaceans. ECS Newsletter Special Issue No. 42. European Cetacean Society.
Fay, R.R. (1991). Structure and function in sound discrimination among vertebrates. In: Popper, A., N., Fay, R.R., Webster, D.B. (eds.), The evolutionary biology of hearing. Springer, New York, 229-263.
Fay, R.R. and S. Coombs (1983). Neural mechanisms in sound detection and temporal summation. Her. Res. 10, 69-92.
Fay, R.R. and Simmons, A.M. (1999). The Sense of Hearing in Fishes and Amphibians. In: Fay, R.R. and Popper, A.N. (eds.). Comparative Hearing: Fish and Amphibians, 269-318.
Fay, R.R. and Popper, A.N. (1999). Hearing in Fishes and Amphibians: An Introduction. In: Fay, R.R. and Popper, A.N. (eds.). Comparative Hearing: Fish and Amphibians, 1-14.
Finneran, J.J., Schlundt, C.E., Carder, D.A., Clark, J.A., Young, J.A., Gaspin, J.B. and Ridgway, S.H. (2000). Auditory and behavioral responses of bottlenose dolphins (Tursiopps truncatus) and a beluga whale (Delphinapteras leucas) to impulsive sounds, resembling distant signatures of underwater explosions. J. Acoust. Soc. Am. 108, 417-431.
Fish, M.P. and Mowbray, W.H. (1970). Sounds of western North Atlantic fishes; a reference file of biological underwater sounds. Baltimore, M.D., Johns Hopkins Press.
Fricke, R.; Berghahn, R. and T. Neudecker (1995). Rote Liste der Rundsmäuler und Meeresfische des deutschen Wattenmeer- und Nordseebereichs (mit Anhängen: nicht gefährdete Arten). Schr.-R. f. Landschaftspfl. u. Natursch. 44, 101-112.
Frisk, G., Bradley, D., Caldwell, J., D’Spain, G., Gordon, J., Hastings, M., Ketten, D., Miller, J., Nelson, D. L., Popper, A.N. and Wartzok, D. (2003). Ocean noise and marine mammals. National Research Council of the National Academics; National Academic Press, Washington, 192 p.
Gedamke, J., Costa, D.P. and Dunstan, A. (2001). Localization and visual verification of a complex minke whale vocalization. J. Acoust. Soc. Am. 109, 3038-3047.
Gordon, J. (2002). Behavioural reactions of marine mammals to impulsive sound. In: Forschungs- und Technologiezentrum Westküste (ed.). Ergebnisprotokoll Fachgespräch Offshore windmills – sound emissions and marine mammals; FTZ, 15.01.2002, Büsum, 18-24.
Gordon, J., Gillespie, D., Potter, J., Frantzis, A., Simmons, M., Swift, R. and Thompson, D. (2004). A review of the effects of seismic surveys on marine mammals. Marine Technology Society Journal 37, 16-34.
Gregory, J. and Clabburn, P. (2003). Avoidance behaviour of Alosa fallax fallax to pulsed ultrasound and its potential as a technique for monitoring clupeid spawning migration in a shallow river. Aquatic Living Resources 16, 313-316.
Hammond P.S., Berggren P., Benke H., Borchers D.L., Collet A., Heide-Jørgensen M.P., Heimlich S., Hiby A.R., Leopold M.F. and Øien N. (2002). Abundance of the harbour porpoise and other cetaceans in the North Sea and adjacent waters. J. Appl. Ecol. 41, 1129-1139.
Hastings, M. C. and Popper, A. N. (2005). Effects of sound on fish. California Department of Transportation Contract 43A0139 Task Order, 1. http://www.dot.ca.gov/hq/env/bio/files/Effects_of_Sound_on_Fish23Aug05.pdf
Hastings, M.C., Popper, A.N., Finneran, J.J. and Lanford, P.J. (1996). Effects of underwater sound on hair cells of the inner ear and lateral line in the oscar (Astronotus ocellatus). J. Acoust. Soc. Am. 99, 2576-2603.
Hawkins, A.D. (1973). The sensitivity of fish to sounds. Oceanogr. Mar. Biol. Annu. Rev. 11, 291-340.
Hawkins, A.D. (1993). Underwater sound and fish behaviour. In: Pitcher, T.J. (ed.), Behaviour of Teleost Fishes 2nd edition. Chapman & Hall, 129-169.
Hawkins, A.D. and Chapman, C.J. (1975). Masked Auditory Thresholds in the Cod, Gadus morhua L. J. Comp. Physiol. 103, 209-226.
Hawkins, A.D. and Johnstone, A.D.F. (1978). The hearing of the Atlantic salmon (Salmo salar). J. Fish. Biol. 13, 655-673.
Hawkins, A.D. and Rasmussen, K.J. (1978). The calls of gadoid fish. J. Mar. Biol. Ass. U.K. 58, 891-911.
Hawkins, A.D. and Myrberg, A.A. Jr. (1983). Hearing and sound communication under water. In: Lewis, B. (ed.). Bioacoustics: A Comparative Approach. Academic Press, 347-405.

Effects of offshore wind farm noise on marine mammals and fish
54
Hawkins, A.D. and Amorim, M.C.P. (2000). Spawning sounds of the male haddock, Melanogrammus aeglefinus. Environ. Fish. Biol. 59, 29-41.
Henriksen, O. D. (2002). Sound emissions of offshore windmills in operation. Handout Fachgespräch: Offshore-Windmills-sound emissions and marine mammals. - FTZ-Büsum, 15.01.2002.
Henriksen, O. D., Teilmann, J. and R. Dietz (2001). Does underwater noise from offshore windfarms potentially affect seals and harbour porpoises? – In: Abstract 14th Biennial Conference on the Biology of Marine Mammals. - Vancouver, Canada Nov 28 - Dec 3, 2001, Society for Marine Mammalogy, 45.
Herzing, D. (2000). Acoustic and social behaviour of wild dolphins: implication for a sound society. In: Au, W.W.L., Popper, A.N. and Fay, R.R. (eds.). Hearing by whales and dolphins. Springer, Berlin, Heidelberg, New York, 225-273.
ICES (2004). Report of the Working Group on Ecosystem Effects on Fishing Activity (WGECO). ICES CM 2004/ACE: 03, 176 pp.
ICES (2005). ICES Advisory Committtee on Ecosystems (AGISC). Report of the Ad-hoc Group on the impacts of Sonar on Cetaceans and Fish (AGISC) (2nd edition). ICES CM 2005/ACE, 57 pp.
ITAP – Institut für technische und angewandte Physik GmbH (2005). Ermittlung der Schalldruck-Spitzenpegel aus Messungen der Unterwassergeräusche von Offshore-WEA und Offshore-Rammarbeiten. Report commissioned by biola (biologisch-landschaftsökologische Arbeitsgemeinschaft)
Janik, V.M. (2000a). Source levels and the estimated active space of bottlenose dolphin (Tursiops truncatus) whistles in the Moray Firth, Scotland. J. Comp. Physiol. A. 186, 673-680.
Janik, V.M. (2000b). Whistle matching in wild bottlenose dolphins (Tursiops truncatus). Science 289, 1355-1357.
Janik, V.M. (2000c). Food-related bray calls in wild bottlenose dolphins (Tursiops truncatus). Proc. R. Soc. Lond. B. 267, 923-927.
Janik, V.M. (2005). Underwater acoustic communication networks in marine mammals. In: McGregor, P. K. (ed), Animal Communication Networks. Cambridge University Press, 390-415.
Johnson, C.S. (1967). Sound detection thresholds in marine mammals. In Tavolga, W.N. (ed), Marine Bioacoustics II. Pergamon, Oxford, 247-260.
Karlsen, H.E. (1992). Infrasound sensitivity in the plaice (Pleuronectes platessa). J. Exp. Biol. 171, 173-187.
Kastak, D. and Schusterman, R.J. (1998). Low–frequency amphibious hearing in pinnipeds: methods, measurements, noise and ecology. J. Acoust. Soc. Am. 103, 2216-2228.
Kastak, D., Schusterman, R.J., Southall, B.L. and Reichmuth, C.R. (1999). Underwater temporary threshold shift induced by octave-band noise in three species of pinnipeds. J. Acoust. Soc. Am. 106, 1142-1148.
Kastelein, R.A., Bunskoek, P., Hagedoorn, M. and Au, W.W.L. (2002). Audiogram of a harbor porpoise (Phocoena phocoena) measured with narrow-band frequency modulated signals. J. Acoust. Soc. Am. 112, 334-344.
Kastelein, R.A., Hagedoorn, M., Au, W.W.L. and de Haan, D. (2003). Audiogram of a striped dolphin (Stenella coeruleoalba). J. Acoust. Soc. Am. 113, 1130-1137.
Kastelein, R.A., Verboom, W.C., Muijsers, M., Jennings, N.V. and van der Heul, S. (2005). The influence of acoustic emissions for underwater data transmission on the behaviour of harbour porpoises (Phocoena phocoena) in a floating pen. Mar. Env. Res. 59, 287-307.
Kastelein, R.A., van der Heul, S., Verboom, W.C., Triesscheijn, R.J.V. and Jennings, N. (2006). The influence of underwater data transmission sounds on the displacement behaviour of captive harbour seals (Phoca vitulina). Mar. Env. Res. 61, 19-39.
Keller, O., Lüdemann, K. and Kafemann, R. (in press). Review of the literature on the ecological research on offshore wind farms with regard to fish fauna. In: Part C of the International Exchange of Experience of Ecological Research on Offshore Wind Farms (NN, eds.). BfN Skripten, Bundesamt für Naturschutz, Bonn.
Ketten, D.R. (1999). Evidence of hearing loss in marine mammals. Presentation at Marine mammal bioacoustics short course, 27-28 November, Maui, Hawaii. Acoustical Society of America and Society for Marine Mammalogy.
Ketten, D.R. (2000). Cetacean ears. In: Au, W.W.L., Popper, A.N. and Fay, R.R. (eds.), Hearing in whales and dolphins. Springer, New York, 43-108.
Effects of offshore wind farm noise on marine mammals and fish
55
Ketten, D.R. (2002). Acoustic trauma in marine mammals. Talk at Fachgespräch Offshore Windmills – sound emissions and marine mammals. FTZ-Büsum 15.01.02.
Knudsen, F.R., Enger, P.S. and Sand, O. (1992). Awareness reactions and avoidance responses to sound in juvenile Atlantic salmon, Salmo salar L. J. Fish Biol. 40, 523-534.
Knudsen, F.R., Enger, P.S. and Sand, O. (1994). Avoidance responses to low frequency sound in downstream migrating Atlantic salmon smolt, Salmo salar. J. Fish Biol. 45, 227-233.
Knudsen, F.R., Schreck, C.B., Knapp, S.M., Enger, P.S. and Sand, O. (1997). Infrasound produces flight and avoidance response in Pacific juvenile salmonids. J. Fish Biol. 51, 824-829.
Koschinski, S., Culik, B.M, Henriksen, O.D., Tregenza, N., Ellis, G.M., Jansen, C. and Kathe, G. (2003). Behavioural reactions of free-ranging harbour porpoises and seals to the noise of a simulated 2 MW windpower generator. Mar. Ecol. Progr. Ser. 265, 263-273.
Ladich, F. (1997). Agonistic behaviour and significance of sounds in vocalizing fish. Mar. Freshw. Behav. Physiol. 29, 87-108.
Lagardère, J.P., Béout, M.L., Lafaye, J.Y. and Villotte, J.P. (1994). Influence of Wind-produced Noise on Orientation in the Sole (Solea solea). Can. J. Fish. Aquat. Sci. 51, 1258-1264.
Langemann, U. and Klump, G.M. (2005). Perception and acoustic communication networks. In McGregor, P. K. (ed), Animal Communication Networks. Cambridge University Press, 451-480.
Larsson, M. (1992). Fiskspärrar. Metoder att leda (skrämma, locka) fisk i anslutning till vattenkraftsanläggningar. - Vattenfall Rapport H 1992/5.
Lucke, K., Hanke, W. and Denhardt, G. (2004). Untersuchungen zum Einfluß akustischer Emissionen von Offshore-Windkraftanlagen auf marine Säuger im Bereich der deutschen Nord- und Ostsee. – Marine Warmblüter in Nord- und Ostsee: Grundlagen zur Bewertung von Windkraftanlagen im Offshore-Bereich. Endbericht, Teilprojekt 1, Nationalpark.schleswig-holsteinisches Wattenmeer und Bundesministerium für Umwelt, Naturschutz und Reaktorsicherheit (FKZ: 0327520), 23-76.
Lucke, K., Siebert, U., Sundermeyer, J. and Benke, H. (2006). TP1- Weiterführende Untersuchungen zum Einfluß akustischer Emissionen von Offshore Windenergieanlagen auf marine Säuger in Nord- und Ostsee. In: Minos/Plus – Weiterführende Arbeiten an Seevögeln und marinen Säugern zur Bewertung von Offshore-Windkraftanlagen. Zweiter Zwischenbereicht, April 2006. Landesamt für den Nationalpark Schleswig-Holsteinisches Wattenmeer, Tönning, 10-27.
Madsen, P.T. (2005). Marine mammals and noise: Problems with root mean square sound pressure levels for transients. J. Acoust. Soc. Am. 117, 3952-3957.
Madsen, P.T., Wahlberg, M., Tougaard, J., Lucke, K. and Tyack, P. (2006). Wind turbine underwater noise and marine mammals: implications of current knowledge and data needs. Mar. Ecol. Progr. Ser. 309, 279-295.
Mann, D.A. and Lobel, P.S. (1997). Propagation of damselfish (Pomacentridae) courtship sounds. J. Acoust. Soc. Am. 101, 3783-3791.
Mann, D. A., Zhongmin, L., Hastings, M.C. and Popper, A.N. (1998). Detection of ultrasonic tones and simulated dolphin echolocation clicks by a teleost fish, the American shad (Alosa sapidissima). J. Acoust. Soc. Am. 104, 562-568.
Mann, D. A., Higgs, D.M., Tavolga, W.N., Souza, M.J. and Popper, A.N. (2001). Ultrasound detection by clupeiform fishes. J. Acoust. Soc. Am. 109, 3048-3054.
Mann, D. A, Popper, A. N. and Wilson, B. (2005). Pacific herring hearing does not include ultrasound. Biology Letters 1, 158-161.
McCauley, R.D., Fewtrell, J., Duncan, A.J., Jenner, C., Jenner, M.-N., Penrose, J.D., Prince, R.I.T., Adhitya, A., Murdoch, J. and McCabe, C. (2000). Marine Seismic Surveys: Analysis and Propagation of Air Gun Signals; and Effects of Air-Gun Exposure on Humpback Whales, Sea Turtles, Fishes and Squid. Report on research conducted for The Australian Petroleum Production and Exploration Association.
McCauley, R.D.; Fewtrell, J. and Popper, A.N. (2003). High intensity anthropogenic sound damages fish ears. J. Acoust. Soc. Am. 113, 638-641.
McKenzie-Maxon, C. (2000). Off-shore wind turbine construction. Offshore pile-driving underwater and above water measurements and analysis. Ødegaard and Danneskiold-Samsø, report no. 00.877, Copenhagen.
Miller, P.J.O., Shapiro, A.D., Tyack, P.L. and Solow, A.R. (2004). Call-type matching in vocal exchanges of free-ranging resident killer whales, Orcinus orca. Anim. Behav. 62, 1099-1107.

Effects of offshore wind farm noise on marine mammals and fish
56
Mitson, R.B. (1995). Underwater noise of research vessels. Cooperative Research report, no. 209, International Council for the Exploration of the Sea, Kopenhagen, Dänemark, 61 pp.
Mitson, R.B. (2000). ICES Cooperative Research Report 209: Five Years On. - ICES Fisheries Acoustic Science and Technology Working Group. - Haarlem, Netherlands, 10-14. April 2000.
Møhl, B. (1968). Auditory sensitivity of the common seal in air and water. J. Aud. Res. 8, 27-38.
Myrberg, A.A. (1978). Ocean noise and the behaviour of marine animals: relationships and implications. In: Fletcher, J.L. and Busnel, R.-G. (eds.). Effects of noise on wildlife, Academic Press, 169-208.
Myrberg, A.A. Jr. (1981). Sound communication and interception of fishes. In: Tavolga, W.N.; Popper, A.N. andFay, R.R. (eds.). Hearing and Sound Communication in Fishes. Springer Verlag, New York, 395-452.
Myrberg, A. A. Jr., Samuel, J.H.A., Walewski, S. and Banbury, J.C. (1972). Effectiveness of acoustic signals in attracting epipelagic sharks to an underwater sound source. Bull. Mar. Sci. 22, 926-949.
Nachtigall, P.E., Au, W.W.L., Pawlowski, J.L. and Moore, P.W.B. (1995). Risso’s dolphin (Grampus griseus) hearing thresholds in Kaneohe Bay, Hawaii. In Kastelein, R.A., Thomas, J.A. and Nachtigall, P.E. (eds.), Sensory systems of aquatic mammals. De Spil Publ., Woerden, Netherlands, 49-53.
Nachtigall, P.E., Pawlowski, J. and Au, W.W.L. (2003). Temporary threshold shifts and recovery following noise exposure in the Atlantic bottlenosed dolphin (Tursiops truncatus). J. Acoust. Soc. Am. 113, 3425-3429.
Nachtigall, P.E., Supin, A.Y., Pawlowski, J.L. and Au, W.W.L. (2004). Temporary threshold shifts after noise exposure in the bottlenose dolphin (Tursiops truncatus) measured using evoked auditory potentials. Mar. Mamm. Sci. 20, 673-687.
Nedwell, J. R. and D. Howell (2004). A review of offshore windfarm related underwater noise sources. – COWRI report No. 544 R 0308, 57 pp.
Nedwell, J. R., Langworthy, J. and Howell, D. (2003a). Assessment of sub-sea acoustic noise and vibration from offshore wind turbines and its impact on marine wildlife; initial measurements of underwater noise during construction of offshore windfarms, and comparison with background noise. COWRIE report No. 544 R 0424, 68 pp.
Nedwell, J. R., et al. (2003b). Objective design of acoustic fish deterrent systems. - Proceedings of the Symposium on Cooling Water Intake Technologies to Protect Aquatic Organisms, Environmental Protection Agency, May 6- 7, 2003. Hilton Crystal City at National Airport, Arlington, VA.
Nedwell, J.R., Turnpenny, A., Langworthy, J. and Edwards, B. (2003c). Measurements of underwater noise during piling at the Red Funnel Terminal, Southampton, and onservations of its effect on caged fish. Subacoustics LTD. Report 558 R 0207.
Nedwell, J.R., Edwards, B., Turnpenny, A.W.H. and Gordon, J. (2004). Fish and marine mammal audiograms: a summary of available information. Subacoustech report ref. 534R0214, submitted to Chevron Texaco Ltd.,278 pp.
Neproshin, A. and Kulikova, W. (1975). Sound production organs in salmonids. J. Ichthyiol. 15, 481-485
Nestler, J.M., Ploskey, G.R., Pickens, J., Menezes, J. and Schilt, C. (1992). Responses of blueback herring to high-frequency sound and implications. N. Am. J. Fish. Manage. 12, 667-683.
NMFS (2003). Taking marine mammals incidental to conducting oil and gas exploration activities in the Gulf of Mexico. Federal register 68, 9991-9996.
Offutt, G.C. (1974). Structures for the detection of acoustic stimuli in the Atlantic codfish, Gadus morhua. J. Acoust. Soc. Am. 56, 665-671.
Palka, D.L. and Hammond, P.S. (2001). Accounting for response movement in line transect estimates of abundance. Can. J. Fish. Aqua. Sci. 58, 777-787.
Popov, V.V., Ladygina, T.F, and Supin, A.Ya. (1986). Evoked potential of the auditory cortex of the porpoise, Phocoena phocoena. J. Comp. Phyiol. 158, 705-711.
Popov, V.V., Supin, A. Ya., Wang, D. and Wang, K. (2006). Nonconstant quality of auditory filters in the porpoises, Phocoena phocoena and Neophocoena phocaenoides (Cetacea, Phocoenidae). J. Acoust. Soc. Am. 119, 3173-3180.
Popper, A.N. and Clarke, N.L. (1976). The auditory system of the goldfish (Carassius auratus). effects of intense acoustic stimulation. J. Comp. Biochem. Physiol. 53A, 11-18.

Effects of offshore wind farm noise on marine mammals and fish
57
Popper, A.N. and Fay, R.R. (1999). The Auditory Periphery in Fishes. In: Fay, R.R. and Popper, A.N. (eds.). Comparative Hearing: Fish and Amphibians, 43-100.
Popper, A.N., Fay, R.R., Platt, C. and Sand, O. (2003). Sound Detection Mechanisms and Capabilities of Teleost Fishes. In: Collin, S.P. and Marshall, N.J. (eds.). Sensory Processing in Aquatic Environments. Springer Verlag, New York, 3-38.
Popper, A.N., Plachta, D.T.T., Mann, D.A. and Higgs, D. (2004a). Response of clupeid fish to ultrasound: a review. ICES Journal of Marine Science 61, 1057-1061.
Popper, A.N., Fewtrell, J., Smith, M.E., and McCauley, R.D. (2004b). Anthropogenic sound: Effects on the behavior and physiology of fishes. Marine Technology Soc. J. 37(4). 35-40.
Popper, A.N., Smith, M.E., Cott, P.A., Hanna, B.W., MacGillivary, A.O., Austin, M. and Mann, D.A. (2005). Effects of exposure to seismic airgun use on hearing of three fish species. J. Acoust. Soc. Am. 117, 3958-3971.
Reid, J.B., Evans, P.G.H. and Northridge, S.P. (2003). Atlas of cetacaean distribution in north-west European waters. Joint Nature Conservation Committee, Peterborough, 76 pp.
Richard, J.D. (1968). Fish attraction with pulsed low-frequency sound. J. Fish. Res. Bd Can. 25, 1441-1452.
Richardson, W.J., Greene, C.R.G. jr., Malme, C.I. and Thomson, D.H. (1995). Marine Mammals and Noise. Academic Press, San Diego, 576 pp.
Riedmann, M. (1990). The Pinnipeds. University of California Press. Berkeley, Los Angeles, Oxford, 439 pp.
Rijnsdorp, A.D., Piet, G. and Poos, J.J. (2002). Evaluatie van het biologisch effect van het gesloten gebied in de Nordsee ter bescherming van kabeljauw in 2001. - RIVO Rapport C027/02, 25 pp.
Ross, Q.E., Dunning, D.J., Thorne, R., Menezes, J.K., Tiller, G.W. and Watson, J.K. (1993). Response of alewives to high-frequency sound at a power plant intake on Lake Ontario. N. Am. J. Fish. Manage. 13, 291-303.
Ross, Q.E., Dunning, D.J., Menezes, J.K., Kenna, M.J.Jr. and Tiller, G. (1996). Reducing impingement of alewives with high-frequency sound at a power plant intake on Lake Ontario. N. Am. J. Fish. Manage. 16, 548-559.
Sand, O. (1984). Lateral line system. In Bolis, L. Keynes, R. and Maddress, S. (eds.), Comparative physiology of sensory systems. Cambridge University Press, Cambridge, 3-32.
Sand, O. and P.S. Enger (1973). Evidence for an auditory function of the swimbladder in the cod. J. Exp. Biol. 59, 405-414.
Sand, O. and Karlsen, H.E (1986). Detection of infrasound by the Atlantic cod. J. Exp. Biol. 125, 197-204.
Santulli, A., Modica, A., Messina, C., Ceffa, L., Curatolo, A., Rivas, G., Fabi, G. and D'Amelio, V. (1999). Biochemical responses of European Sea Bass (Dicentrarchus labrax L.) to the stress induced by off shore experimental seismic prospecting. Mar. Pollut. Bull. 38, 1105-1114.
Saunders, J.C.; Cohen, Y.E. and Y.M. Szymko (1991). The structural und functional consequences of acoustic injury in the cochlea and peripheral auditory system: A five years update. J. Acoust. Soc. Am. 90, 147-155.
SCAR (2004). Scar Report On Marine Acoustic Technology And The Antarctic Environment. - Scientific Committee on Antarctic Research. Scott Polar Research Institute, Cambridge, United Kingdom, 17 pp.
Schlundt, C.E., Finneran, J.J., Carder, D.A. and Ridgway, S.H. (2000). Temporary shift in masked hearing thresholds of bottlenose dolphins, Tursiops truncatus, and white whales, Delphinapteras leucas, after exposure to intense tones. J. Acoust. Soc. Am. 107, 3496-3505.
Scholik, A.R. and Yan, H.Y. (2002a). The effects of noise on the auditory sensitivity of the bluegill sunfish, Lepomis macrochirus. Comp. Biochem. Physiol. 133 Part A, 43-52.
Scholik, A.R. and Yan, H.Y. (2002b). Effects of boat engine noise on the auditory sensivity of the fathead monnow, Pimephales promelas. Environmental Biology of Fishes 63, 203-209.
Schuijf, A. and Hawkins, A.D. (1983). Acoustic distance discrimination by the cod. Nature 302, 143-144.
Schwarz, A.L. and Greer, G.L. (1984). Responses of Pacific herring, Clupea harengus pallasi, to some underwater sounds. Can J. Fish. Aquat. Sci. 41, 1183-1192.
Smith, M.E., Kane, A.S. and Popper, A.N. (2004a). Acoustical stress and hearing sensitivity in fishes: does the linear threshold shift hypothesis hold water? J. Exp. Biol. 207, 3591-3602.

Effects of offshore wind farm noise on marine mammals and fish
58
Smith, M.E., Kane, A.S. and Popper, A.N. (2004b). Noise-induced stress response and hearing loss in goldfish (Carassius auratus). J. Exp. Biol. 207, 427-435.
Southall, B.L., Schusterman, R.J. and Kastak, D. (2000). Masking in three pinnipeds: underwater, low frequency critical ratios. J. Acoust. Soc. Am. 108, 1322-1326.
Southall, B.L., Schusterman, R.J. and Kastak, D. (2003). Auditory masking in three pinnipeds: Aerial critical ratios and direct critical bandwidth measurements. J. Acoust. Soc. Am. 114, 1660-1666.
Spanier, E. (1979). Aspects of species recognition by sound in four species of damselfish, genus Eupomacentrus (Pisces: Pomacentridae). Z. Tierpsychol. 51, 301-316.
SRU (Der Rat von Sachverständigen für Umweltfragen) (2004). Windenergienutzung auf See- Stellungnahme, 20 pp.
Ssymank, A. (1994). Neue Anforderungen im europäischen Naturschutz. Das Schutzgebietssystem Natura 2000 und die FFH-Richtlinie der EU. Natur u. Landschaft 69, 395-406.
Szymanski, M.D., Bain, D.E., Kiehl, K., Pennington, S., Wong, S. and Henry, K.R. (1999). Killer whale (Orcinus orca) hearing: Auditory brainstem response and behavioural audiograms. J. Acoust. Soc. Am. 106, 1134-1141.
Tavolga, W.N. (1971). Sound production and detection. In Hoar, W.S. and Randall, D.J. (eds.), Fish Physiology, vol V. Academic Press, New York, 135-205.
Tavolga, W.N. (1974). Signal/noise ratio and the critical band in fishes. J. Acoust. Soc. Am. 55, 1323-1333.
Tech-Wise / Elsam (2003). Elsam. Offshore-Windfarm Horns Rev. Annual status report for the environmental monitoring programm 1 January 2002 – 31 December 2002. Tech-Wise, Frederica, Denmark.
Teilmann, J., Miller, L.A. Kirketerp, T., Kastelein, R.A., Madsen, P.T. Nielsen, B.K. and Au, W.W.L. (2002). Characteristics of echolocation signals used by a harbour porpoise (Phocoena phocoena) in a target detection experiment. Aquatic Mammals 28, 275-284.
Terhune, J.M. (1988). Detection thresholds of a harbour seal to repeated underwater high-frequency, short-duration sinusoidal pulses. Can. J. Zool. 66, 1578-1582.
Terhune, J. and S. Turnbull (1995). Variation in the psychometric functions and hearing thresholds of a harbour seal. In Kastelein, R.A., Thomas, J.A. and Nachtigall, P.E. (eds.), Sensory systems of aquatic mammals. De Spil Publ., Woerden, Netherlands, 81-93
Thiele, R. (2002). Propagation loss values for the North Sea. Handout Fachgespräch: Offshore-Windmills-sound emissions and marine mammals. FTZ-Büsum, 15.01.2002.
Thomsen, F., Betke, K., Schultz-von Glahn, M. and Piper, W. (2006). Noise during offshore wind turbine construction and it’s effects on harbour porpoises (Phocoena phocoena). In: Abstracts of the 20th Annual Conference of the European Cetacean Society, Gdynia, Poland, 2-7 April, 2006, 24-25.
Tougaard, J., Carstensen, J., Henriksen, O.H., Skov, H. and Teilmann, J. (2003a). Short-term effects of the construction of wind turbines on harbour porpoises at Horns Reef. Technical report to Techwise A/S. Hedeselskabet.
Tougaard, J., Ebbesen, I., Tougaard, S., Jensen, T. and Teilmann, J. (2003b). Satellite tracking of Harbour Seals on Horns Reef. Use of the Horns Reef wind farm area and the North Sea. Report request. Commissioned by Tech-wise A/S. Fisheries and Maritime Museum, Esbjerg. 42 pp.
Tougaard, J., Carstensen, J., Teilmann, J. and Bech, N.I., Skov, H. and Henriksen, O.D. (2005). Effects of the Nysted Offshore wind farm on harbour porpoises. Technical Report to Energi E2 A/S. NERI, Roskilde.
Turl, C.W. (1993). Low-frequency sound detection by a bottlenose dolphin. J. Acoust. Soc. Am. 94, 3006-3008.
Tyack, P. L. (1998). Acoustic communication under the sea. In: Hopp, S.L., Owren, M.J. and Evans, C.S. (eds.), Animal acoustic communication: recent technical advances. Springer, Heidelberg, 163-220.
Urick, R. (1983). Principles of underwater sound. – McGraw Hill, New York.
Verboom, W.C. and Kastelein, R.A. (1995). Acoustic signals by harbour porpoises (Phocoena phocoena). In Nachtigall, P.E., Lien, J., Au, W.W.L. and Read, A.J. (eds.), harbour porpoises – laboratory studies to reduce bycatch. De Spil Publishers, Woerden, Netherlands, 343-362.
Effects of offshore wind farm noise on marine mammals and fish
59
Verboom, W.C. and Kastelein, R.A. (1997). Structure of harbour porpoise (Phocoena phocoena) click train signals. In: Read, A.J., Wiepkema, P.R. and Nachtigall, P.E. (eds.), The biology of the harbour porpoise. De Spil Publishers, Woerden, 343-367.
Verfuss, U.K., L.A. Miller and Schnitzler, H.U. (2005). Spatial orientation in echolocating harbour porpoises (Phocoena phocoena). J. Exp. Biol. 208, 3385-3394.
Vella, G., Rushforth, I., Mason, E., Hough, A., England, R., Styles, P., Holt, T. and Thorne, P. (2001). Assessment of the effects of noise and vibration from offshore wind farms on marine wildlife. - ETSU W/13/00566/REP, DTI/Pub URN 01/1341, 107 pp.
Vethaak, A.D. and Rheinallt, T. (1992). Fish disease as a monitor for marine pollution: the case of the North Sea. Reviews in Fish Biology and Fisheries 2, 1-32.
Wahlberg, M. and Westerberg H. (2003). Sounds produced by herring (Clupea harengus) bubble release. Aquatic Living Resources 16, 271-275.
Wahlberg, M. and Westerberg, H. (2005). Hearing in fish and their reactions to sound from offshore wind farms. Mar. Ecol. Prog. Ser. 288, 295-309.
Westerberg, M. (1994). Fiskeriundersökningar vid havsbaserat vindkraftverk 1990-1993. Rapport 5 – 1994 Jönköping: Göteborgsfilialen, Utredningskontoret I Jönköping, Sweden National Board of Fisheries, 44 pp.
Westerberg, H. (2000). Impact Studies of Sea-Based Windpower in Sweden. - In: Merck, T. and Nordheim, H. von (eds.), Technische Eingriffe in marine Lebensräume. BFN-Skripten 29, Bundesamt für Naturschutz, 163-168.
Winn, H.E (1964). The biological significance of fish sounds. In: Tavolga, W.N. (ed.): Marine Bioacoustics, Pergamon Press, Oxford, 213-231.
Willie, P.C. and Geyer, D. (1984). Measurements on the origin of the wind-dependent ambient noise variability in shallow water. J. Acoust. Soc Am. 75, 173-185.
Wilson, B. and L.W. Dill (2002). Pacific herring respond to simulated odontocete echolocation sounds. Can. J. Fish. Aquat. Sci. 59, 542-533.
Wilson, B., Batty, R.S. and Dill, L.M. (2004). Pacific and Atlantic herring produce burst pulse sounds. Proc. R. Soc. Lond. B (Suppl.) 271, S95-S97.
Würsig, B. and Richardson, W.J. (2002). Effects of Noise. In: Perrin, W.F, Würsig, B. and Thewissen, J.G.M. (eds.) Encyclopedia of Marine Mammals. Academic Press, 794-802.
Würsig, B., Green, C.R. Jr., Jefferson, T.A. (2000). Development of an air bubble curtain to reduce underwater noise of percussive piling. Mar. Environ. Res. 49, 79-93.
Yang, J. (1982). The dominant fish fauna in the North Sea and its determination. J. Fish Biol. 20, 635- 643.
Yurk, H. and Trites, A.W. (2000). Experimental attempts to reduce predation by harbor seals on out-migrating juvenile salmonids. Transactions of the American Fisheries Society 129, 1360-1366.
Zelick, R., Mann, D.A. and Popper, A.N. (1999). Acoustic Communication in Fishes and Frogs. In: Fay, R.R. and Popper, A.N. (eds.). Comparative Hearing: Fish and Amphibians, 363-411.
Zucco, C. and Merck, T. (2004). Ökologische Effekte von Offshore-Windkraftanlagen , eine Übersicht zur aktuellen Kenntnislage (Stand: März 2004). Naturschutz und Landschaftsplanung 36, 261-269.
Zucco, C. (2005). Auswirkungen von Offshore-Windkraftanlagen auf die marine Fauna und den Vogelzug - Erkenntnisse aus nationaler und internationaler Begleitforschung. Presentation at the Meeresumwelt-Symposium des Bundesamtes für Seeschifffahrt und Hydrographie in Zusammenarbeit mit dem Umweltbundesamt und dem Bundesamt für Naturschutz im Auftrag des Bundesministeriums für Umwelt, Naturschutz und Reaktorsicherheit, Hamburg, 07.-08.06.2005.

Effects of offshore wind farm noise on marine mammals and fish
60
12. Appendix Table 6: Measurement values during pile-driving of the FINO1-platform (measurements in 400 m distance from pile; values at 1 m back-calculated after Thiele 2002; values < 100 Hz corrected and after Thiele (2002); from ITAP (2005))
Distance 400 m Distance 1 m
Frequency (Hz) Equivalent sound pressure level
LE in dB re 1 µPa Peak level Lpeak in dB re 1 µPa
Equivalent sound pressure level
LE in dB re 1 µPa Peak level Lpeak in dB re 1 µPa
broadband 166.4 189.1 206.0 ca. 228 20 129.8 166.2 25 133.5 170.0
31.5 139.5 148.9 176.1 185.6 40 142.2 156.3 179.1 193.2 50 143.3 158.1 180.4 195.2 63 141.1 157.3 178.5 194.6 80 143.2 158.2 180.9 195.8
100 153.0 171.8 190.9 209.7 125 161.3 179.5 199.6 217.7 160 156.2 174.2 194.8 212.8 200 154.7 175.1 193.7 214.0 250 155.7 176.3 195.0 215.7 315 158.7 178.7 198.4 218.4 400 150.3 170.4 190.5 210.6 500 149.8 171.9 190.4 212.5 630 151.0 171.8 192.0 212.9 800 150.9 172.7 192.5 214.3
1000 153.8 176.7 195.8 218.7 1250 148.9 172.1 191.4 214.5 1600 148.0 170.9 191.0 213.9 2000 144.0 166.5 187.5 210.0 2500 143.0 167.1 186.9 211.0 3150 139.8 162.2 184.2 206.6 4000 138.9 163.4 183.9 208.4 5000 137.2 162.8 182.7 208.3 6300 135.3 160.0 181.3 206.0 8000 133.3 157.8 179.9 204.4 10000 130.8 155.0 177.8 202.1 12500 127.8 153.2 175.4 200.9 16000 123.3 148.3 171.5 196.5 20000 117.4 142.0 166.1 190.8
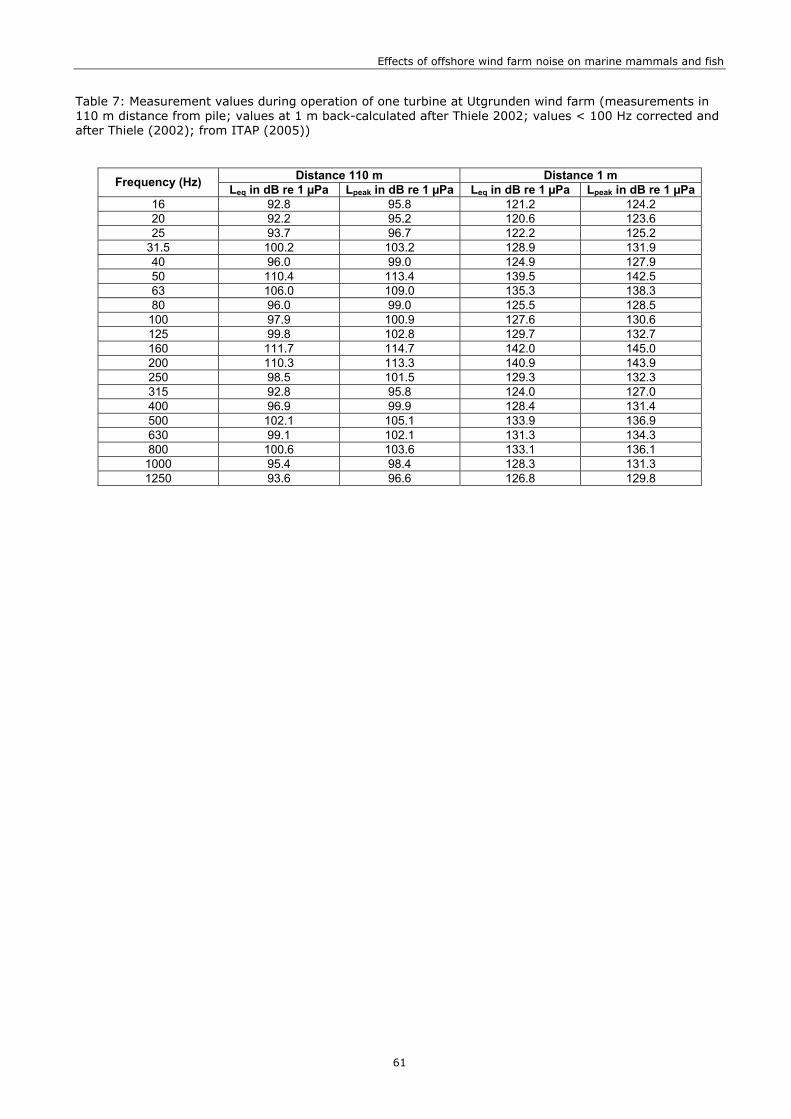
Effects of offshore wind farm noise on marine mammals and fish
61
Table 7: Measurement values during operation of one turbine at Utgrunden wind farm (measurements in 110 m distance from pile; values at 1 m back-calculated after Thiele 2002; values < 100 Hz corrected and after Thiele (2002); from ITAP (2005))
Distance 110 m Distance 1 m Frequency (Hz) Leq in dB re 1 µPa Lpeak in dB re 1 µPa Leq in dB re 1 µPa Lpeak in dB re 1 µPa16 92.8 95.8 121.2 124.2 20 92.2 95.2 120.6 123.6 25 93.7 96.7 122.2 125.2
31.5 100.2 103.2 128.9 131.9 40 96.0 99.0 124.9 127.9 50 110.4 113.4 139.5 142.5 63 106.0 109.0 135.3 138.3 80 96.0 99.0 125.5 128.5
100 97.9 100.9 127.6 130.6 125 99.8 102.8 129.7 132.7 160 111.7 114.7 142.0 145.0 200 110.3 113.3 140.9 143.9 250 98.5 101.5 129.3 132.3 315 92.8 95.8 124.0 127.0 400 96.9 99.9 128.4 131.4 500 102.1 105.1 133.9 136.9 630 99.1 102.1 131.3 134.3 800 100.6 103.6 133.1 136.1
1000 95.4 98.4 128.3 131.3 1250 93.6 96.6 126.8 129.8

Effects of offshore wind farm noise on marine mammals and fish
62
Table 8: Overview of the results of hearing studies in harbour porpoises
Reference Lucke et al. (2004)
Lucke et al. (2006)
Popov et al. (1986) Andersen (1970) Kastelein et al.
(2002) Method ABR Behavioural audiogram
Stimulus Sinus-tone 10 / 25 ms
Sinus-tone 25 ms
Clicks / broadband
5µs Sinus-tone
1.5 s Sinus-tone
2 s
Stimulus frequency
(kHz) Hearing threshold (dBrms re 1µPa)
0.25 115 0.3 116.8 0.5 118.6 92 0.7 108.9 1 104.9 82 80
1.4 96.7 2 90.0/ 95.0 62.5 65 72
2.8 77.7 60.5 4 90.8 64.7 53 57
5.6 71.1 59.4 8 84.9 74.5 49 59
10 58.5 88 11.2 89.8 74.7 16 52.8 85.0 52 44 20 82 30 61 32 47 37 50 80 36 64 56 70 76 100 75 60 32 125 60 70 150 103 120 160 102 91
Table 9: Underwater hearing thresholds of a harbour seal (after Kastak and Schustermann, 1998).
Frequency [kHz] Hearing threshold (dBrms re 1µPa)
0.075 101.9 0.1 95.9 0.2 83.8 0.4 83.9 0.8 79.8 1.6 67.1 6.4 62.8