effects of nitrogen fertilization on the life history of
TRANSCRIPT

Clemson UniversityTigerPrints
All Theses Theses
12-2015
Effects of Nitrogen Fertilization on the Life Historyof the Madeira Mealybug (Phenacoccusmadeirensis) and the Molecular Composition of itsHost PlantStephanie Alliene RhodesClemson University
Follow this and additional works at: https://tigerprints.clemson.edu/all_theses
This Thesis is brought to you for free and open access by the Theses at TigerPrints. It has been accepted for inclusion in All Theses by an authorizedadministrator of TigerPrints. For more information, please contact [email protected].
Recommended CitationRhodes, Stephanie Alliene, "Effects of Nitrogen Fertilization on the Life History of the Madeira Mealybug (Phenacoccus madeirensis)and the Molecular Composition of its Host Plant" (2015). All Theses. 2584.https://tigerprints.clemson.edu/all_theses/2584

EFFECTS OF NITROGEN FERTILIZATION ON THE LIFE HISTORY OF THE
MADEIRA MEALYBUG (PHENACOCCUS MADEIRENSIS) AND THE
MOLECULAR COMPOSITION OF ITS HOST PLANT
A Thesis
Presented to
the Graduate School of
Clemson University
In Partial Fulfillment
of the Requirements for the Degree Master of Science
Entomology
by
Stephanie Alliene Rhodes
December 2015
Accepted by:
Dr. Juang-Horng Chong, Committee Co-Chair
Dr .Matthew Turnbull, Committee Co-Chair
Dr. Peter Adler
Dr. Dara Park

pg. ii
ABSTRACT
The aim of this study was to investigate how different nitrogen fertilization rates
of host-plants influence the development, fecundity, and nutritional status of a pest insect,
the Madeira mealybug (Phenococcus madeirensis Green, Hemiptera: Psuedococcidae).
This study evaluated the effects of nitrogen fertilization (0, 75, 150 and 300 ppm N) on
the growth, % nitrogen, % carbon, lipid, and protein contents of basil plants (Ocimum
basilicum L., Lamiaceae), and the subsequent impacts of host-plant nutritional status on
the life history and total lipid and protein contents of the Madeira mealybug. Heights and
root lengths of plants fertilized with 75 ppm N were greater than those of plants of any
other nitrogen level. Plant leaves and stems from the 300 ppm N level had the highest %
nitrogen, but the leaves did not exhibit significant differences in protein content across
plant nitrogen levels. Plants might be allocating nitrogen to maintain proper functioning
of photosynthetic organs. No consistent patterns were observed for plant tissue %
carbon, and no significant differences were found in plant tissue lipid absorbance values
across nitrogen levels. Developmental times and survivorship of mealybugs between
instars and from egg to adulthood did not differ across nitrogen levels. Mealybug
females reared on plants fertilized with 0 ppm N had the fewest eggs. Net reproductive
rates, intrinsic rates of increase, and finite rates of increase did not differ among
mealybugs reared on plants fertilized at all nitrogen levels. Females reared on plants
fertilized at 0 and 75 ppm N had the longest and shortest generation times, respectively.
Adult females reared on plants fertilized at 0 ppm N had the highest protein contents and
produced the most eggs, but their eggs had the lowest protein contents compared to those

pg. iii
of their counterparts from the other nitrogen fertilization levels. Adult females reared on
plants fertilized at 300 ppm N had lower total protein contents and produced fewer
numbers of eggs than those from unfertilized plants, but their eggs were the highest in
average protein content. This finding indicates that Madeira mealybug females are able
to differentially allocate nutrients based on host-plant nutrient status.

pg. iv
DEDICATION
This work is dedicated to my parents who have always supported me in my endeavors,
and encouraged me to reach my goals
– And to my best buddy, Jackie-Boy (b. 2001 – d. 2015).
Thank you to all of my family and friends – my greatest blessings and inspiration.

pg. v
ACKNOWLEDGEMENTS
I would like to thank Dr. JC Chong and Dr. Matthew Turnbull for guiding me
through this project. I appreciate all the time they took to offer help and support during
the study. A special thanks to Dr. Turnbull for generously providing the use of his lab
and equipment while I was completing the macromolecular assays, and for providing
insightful suggestions on how to improve my methodologies. I would like to thank my
committee members, Dr. Dara Park and Dr. Peter Adler, for providing constructive
recommendations and assistance on the development of this study. Thanks to Dr. James
Frederick at the Clemson University Pee Dee Research and Education Center for the use
of his crop drying facility. I would also like to thank Dr. Nishanth Tharayil for the use of
the Multi-User Analytical Laboratory, and Amith Maroli for additional instruction on the
use of the HPLC equipment. An additional thanks to Mr. Mark Pullen, Ms. Shawn West,
Ms. Shannon Cook and Ms. Hechu Zhu for providing assistance in data collection.
I greatly appreciate the opportunity I received from Dr. Chong to conduct this
research. I have gained invaluable experience and knowledge during the completion of
my program, and I extend my sincerest gratitude for the funding and support he provided.

pg. vi
TABLE OF CONTENTS
Page
TITLE PAGE .................................................................................................................... i
ABSTRACT ..................................................................................................................... ii
DEDICATION ................................................................................................................ iv
ACKNOWLEDGEMENTS ............................................................................................. v
TABLE OF CONTENTS ................................................................................................ vi
LIST OF TABLES .......................................................................................................... ix
LIST OF FIGURES ........................................................................................................ xi
CHAPTER
1. LITERATURE REVIEW .............................................................................. 1
1.1 Plant Acquisition of Nitrogenous Compounds and Assimilation ...... 1
1.2 Acquisition and Assimilation of Nitrogenous Compounds by Plant
Sap-feeding Insects………….......................................................4
1.3 The Madeira Mealybug: Phenacoccus madeirensis Green ............... 6
1.4 Host-Plant Quality and its Effects on Insect Herbivores ................... 7

pg. vii
Table of Contents (Continued)
Page
1.5 Hypotheses and Expected Results ................................................... 10
2. MATERIALS AND METHODS ................................................................. 15
2.1 Preparation of Plants and Fertilizer Treatments ............................... 15
2.2 Mealybug Infestation and Data Collection ...................................... 19
2.3 Protein and Lipid Content Analyses for Mealybugs
and Plant Tissues........................................................................24
2.4 Plant Tissue %N and %C Analyses ................................................. 27
2.5 Statistical Analyses .......................................................................... 28
2.6 Voucher Specimens ......................................................................... 30
3. RESULTS .................................................................................................... 31
3.1 Pre-Assignment Seedling Height and Harvest Measurements ........ 31
3.2 Pre-Infestation Plant Growth ........................................................... 31
3.3 Post-Infestation Plant Growth .......................................................... 33
3.4 Post-Infestation Plant Parameters at Harvest ................................... 39
3.5 Post-Infestation Plant Tissue %N and %C, Protein Contents
and Lipid Absorbance Values by Infestation Status and
Nitrogen Fertilization Level.......................................................43
3.6 Madeira Mealybug Development, Surviving Individuals, and
Mortality.....................................................................................49
pg. viii
Table of Contents (Continued)
Page
3.7 Madeira Mealybug Population Parameters ...................................... 53
3.8 Mealybug Protein Contents and Lipid Absorbance Values ............. 55
3.9 Correlations: Plant Protein/Lipid vs %N/%C, Plant
Protein/Lipid vs Insect and Egg Protein/Lipid and Female
Mealybug Protein/Lipid vs. Egg Protein/Lipid..........................58
4. DISCUSSION AND CONCLUSIONS ....................................................... 65
4.1 Pre-Assignment and Pre-Infestation Plant Measurements ............... 65
4.2 Post-Infestation Plant Measurements ............................................... 65
4.3 Madeira Mealybug Life History Parameters, and Implications
for Future Studies.......................................................................70
4.4 Adult Female Madeira Mealybug and Egg Protein and
Lipid Results, and Implications for Future Studies....................74
APPENDICES............................................................................................................... 78
Appendix A ............................................................................................ 79
Appendix B ............................................................................................ 80
Appendix C ............................................................................................ 81
WORKS CITED ............................................................................................................ 82

pg. ix
LIST OF TABLES
Table Page
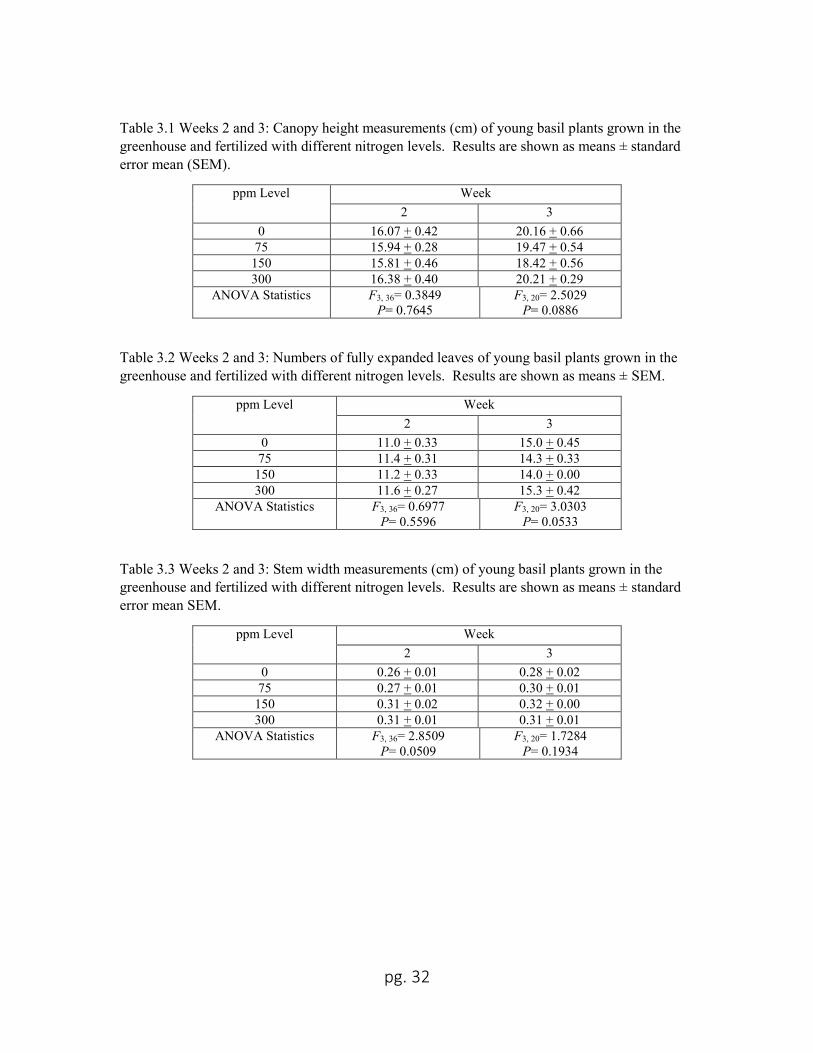
3.1 Weeks 2 and 3: Canopy height measurements (cm) of young basil plants
grown in the greenhouse and fertilized with different nitrogen levels....32
3.2 Weeks 2 and 3: Numbers of fully expanded leaves of young basil plants
grown in the greenhouse and fertilized with different nitrogen levels....32
3.3 Weeks 2 and 3: Stem width measurements (cm) of young basil plants
grown in the greenhouse and fertilized with different nitrogen levels....32
3.4 Weeks 5, 6, 7 and 9: Plant heights (cm) of infested (I) and uninfested (U)
basil plants grown in the greenhouse and fertilized with different
nitrogen levels.........................................................................................35
3.5 Weeks 5, 6, 7 and 9: Numbers of fully expanded leaves of infested (I)
and uninfested (U) basil plants grown in the greenhouse and fertilized
with different nitrogen levels..................................................................36
3.6 Weeks 5, 6, 7 and 9: Numbers of branches of infested (I) and uninfested (U)
basil plants grown in the greenhouse and fertilized with different
nitrogen levels.........................................................................................37
3.7 Weeks 5, 6, 7 and 9: Stem widths (cm) of infested (I) and uninfested (U)
basil plants grown in the greenhouse and fertilized with different
nitrogen levels........................................................................................38
pg. x
List of Tables (Continued)
Table Page
3.8 August 17, 2014: Canopy weights (g), fallen leaves weights (g) and leaf
surface area measurements (cm2) of infested (I) and uninfested (U)
basil plants grown in the greenhouse and fertilized with different
nitrogen levels..........................................................................................41
3.9 August 17, 2014: Root weights (g) and root lengths (cm) of infested (I)
and uninfested (U) basil plants grown in the greenhouse and
fertilized with different nitrogen levels....................................................42
3.10 Madeira mealybug developmental times, reproductive longevity and
fecundity across the four host-plant nitrogen levels.................................51
3.11 Madeira mealybug tally of individuals per developmental stadium,
proportion of individuals surviving at each stadia and mortality
rate across host-plant nitrogen fertilization levels....................................52
3.12 Madeira mealybug gross reproductive rates (mx), net reproductive rate
(Ro), generation time (GT), rate of intrinsic increase (rm), and finite
rate of increase (λ) from the four host-plant nitrogen levels................................54
pg. xi
LIST OF FIGURES
Figure Page
3.1 A %N of leaves and stems of uninfested plants across ppm levels ................... 45
3.1 B %C of leaves and stems of uninfested plants across ppm levels .................... 46
3.1 C %N of leaves and stems of infested plants across ppm levels ....................... 46
3.1 D %C of leaves and stems of infested plants across ppm levels ....................... 47
3.2 Lipid absorbance values of uninfested basil plant leaves and stems
across nitrogen treatment ppm levels and plant height regions..............47
3.3 Lipid absorbance values of infested basil plant leaves and stems
across nitrogen treatment ppm levels and plant height regions..............48
3.4 Protein mg/ml of uninfested basil plant leaves and stems across
nitrogen treatment ppm levels and plant height regions.........................48
3.5 Protein mg/ml of infested basil plant leaves and stems across
nitrogen treatment ppm levels and plant height regions.........................49
3.6 A Adult female mealybug lipid absorbance values across nitrogen
fertilization levels...................................................................................56
3.6 B Adult female mealybug protein contents (mg/ml) across nitrogen
fertilization levels...................................................................................56

pg. xii
List of Figures (Continued)
Figure Page
3.6 C Egg lipid absorbance values across nitrogen fertilization levels .................... 57
3.6 D Egg protein content (mg/ml) across nitrogen fertilization levels .................... 57
3.7 A Plant protein mg/ml vs plant %N .................................................................... 60
3.7 B Plant lipid absorbance values vs plant %C ..................................................... 60
3.8 A Plant lipid absorbance values vs adult female mealybug lipid
absorbance values...................................................................................61
3.8 B Plant lipid absorbance values vs egg lipid absorbance values ........................ 62
3.8 C Plant total protein (mg/ml) vs adult female mealybug total protein (mg/ml) . 62
3.8 D Plant total protein (mg/ml) vs egg total protein (mg/ml) ................................ 63
3.9 A Adult female mealybug lipid absorbance values vs egg lipid absorbance
values......................................................................................................63
3.9 B Adult female mealybug protein (mg/ml) contents vs egg protein (mg/ml)
contents...................................................................................................64

pg. 1
CHAPTER ONE
LITERATURE REVIEW
1.1 Plant Acquisition of Nitrogenous Compounds and Assimilation
Nitrogen, as the major component of amino acids and nucleic acids, is one of the
most important elements for all organisms (Mattson 1980, Xu et al. 2012, Bloom 2015,
Krapp 2015). The most abundant reservoir of inorganic nitrogen occurs as nitrogen gas
(N2), which is unavailable for direct assimilation and use by most organisms (Mattson
1980, Raven et al. 2005, 2008). Except for legumes (Fabaceae), which have symbiotic
nitrogen-fixing bacteria, plants cannot process atmospheric N2 (Raven and Smith 1976,
Pate and Layzell 1990, Richardson et al. 2009, Xu et al. 2012, Krapp 2015,). However,
nitrogen sourced from N2 can enter the soil for use by plants. The cycling of nitrogen,
both in the atmosphere and biosphere, plays a primary role in plant nitrogen acquisition
(Raven et al. 2005, 2008; Bloom 2015).
While in the atmosphere, N2 can be transformed into nitric acid (HNO3) through
the action of negatively charged hydroxyl ions (OH-), positively charged hydrogen atoms
(H+), and negatively charged oxygen atoms (O2-) formed from the action of lightning
splitting water molecules apart (Bloom 2015). Nitric acid (HNO3) loses its hydrogen
atom and forms NO3- (nitrate) as it falls to the ground with precipitation and settles in the
soil (Bloom 2015).
Although some nitrogen in soil comes from atmospheric N2, most of the nitrogen
in soil comes from organic sources (Crawford and Glass 1998, Raven et al. 2005).

pg. 2
Bacterial and fungal decomposers break down animal waste and decaying matter into
simpler compounds, such as amino acids, and release ammonium cations (NH4+) as waste
products (Raven et al. 2005). Ammonium is a form of nitrogen usable to plants, and can
be absorbed into root cells (Crawford and Glass 1998, Bloom 2015, Krapp 2015).
However, NH4+ is not always available to plants because it is readily consumed by soil
bacteria (Miller and Cramer 2004, Bloom 2015). Bacteria belonging to the genus,
Nitrosomonas (Nitrosomonadales: Nitrosomonadaceae) use NH4+ in oxidation reactions,
producing nitrite ions (Miller and Cramer 2004, Raven et al. 2005, Bloom 2015). Nitrite
ions (NO2-) are then taken up by Nitrobacter spp. (Rhizobiales: Bradyrhizobiaceae) to
produce nitrate ions (NO3-; Miller and Cramer 2004, Raven et al. 2005, Bloom 2015). In
addition to competition with bacteria, plants also have difficulty in absorbing NH4+ from
the soil because NH4+ binds strongly to negatively charged soil components, such as clay
particles and organic matter (Miller and Cramer 2004, Jhonson 2009, Bloom 2015).
Recent studies with Arabidopsis (Brassicaceae) showed that nitrate and peptide
transporters aid in nitrogen absorption from the soil (Xu et al. 2012, Krapp 2015). The
absorption of NO3- is conducted by active transport into root epidermal cells (Crawford
and Glass 1998, Miller and Cramer 2004, Richardson et al. 2009, Krapp 2015). The
exact components and carriers involved in the transportation and assimilation pathway
are still being investigated. Nitrate ions pass through the root epidermal cells to the root
cortex and reach the root endodermis (Krapp 2015). From the endodermis, NO3- is
transported across the xylem parenchyma and into the xylem sap, where it is transported
to the canopy (Mattson 1980, Miller and Cramer 2004, Xu et al. 2012, Bloom 2015,

pg. 3
Krapp 2015). In the cytosol of shoot cells, NO3- (nitrate) is reduced to NO2
- (nitrite) by
nitrate reductase (Pate and Layzell 1990, Crawford and Glass 1998, Xu et al. 2012,
Bloom 2015, Krapp 2015). Nitrite is taken to the chloroplast and converted into NH4+ by
nitrite reductase (Xu et al. 2012, Bloom 2015, Krapp 2015).
If NH4+ is absorbed directly from the soil, it will pass across the root cell
membrane via a concentration gradient, where NH4+ flows into the root cells containing
the lowest concentrations of ammonium (Miller and Cramer 2004, Xu et al. 2012).
Ammonium will then pass into the xylem sap and be transported to the canopy (Miller
and Cramer 2004).
Once inside the chloroplasts of shoot cells, NH4+ reacts with glutamate to produce
glutamine through a process catalyzed by glutamate synthetase (Miller and Cramer 2004,
Xu et al. 2012, Bloom 2015, Krapp 2015). A single glutamine reacts with 2-oxoglutarate
(produced from the tricarboxylic acid cycle in the mitochondria), using ferredoxin-
dependent glutamate-oxoglutarate-aminotransferase as the catalyst, to produce two
glutamine amino acids (Miller and Crawford 2004, Bloom 2015, Krapp 2015). From this
point, glutamine and glutamate are used in transamination reactions to form other amino
acids (Miller and Cramer 2004, Bloom 2015, Krapp 2015). The resulting amino acids are
transported through the xylem and phloem to areas of the plant that require them for
tissue synthesis, maintenance and regulatory and defense pathways (Miller and Cramer
2004).

pg. 4
1.2 Acquisition and Assimilation of Nitrogenous Compounds by Sap-Feeding Insects
The general insect herbivore digestive system consists of three sections: foregut,
midgut and hindgut (Chapman 1998, Schoohoven et al. 2005, Ferreira 2009, Klowden
2013). The foregut consists of the mouth, esophagus, crop and proventriculus (Chapman
1998, Klowden 2013). Food passes into the mouth, through the esophagus and into the
crop where the food may be stored or undergo primary digestion (Terra 1990, Chapman
1998, Ferreira 2009, Klowden 2013). Before reaching the midgut, where the majority of
digestion takes place, food must pass through the proventriculus (Terra 1990, Chapman
1998, Ferreira 2009, Klowden 2013). To help protect the midgut from abrasion by food
particles and contact with pathogens and parasites, many insect species secrete a
peritrophic matrix around the food bolus as it passes through the midgut (Terra 1990).
This peritrophic matrix is composed of proteins and chitin, and contains small pores
(approximately 7-9 nm) that allow only small digested products into the gut lumen for
further digestion and absorption (Terra 1990, Ferreira 2009). Digestion in the insect gut
occurs in three phases: primary, secondary, and final digestion (Terra 1990, Chapman
1998, Ferreira 2009). The first level of digestion takes place in the peritrophic membrane
and consists of macromolecules, such as proteins, being broken down into smaller
components (Terra 1990, Chapman 1998, Woods and Kingsolver 1999, Ferreira 2009).
During the next phase of digestion, food particles are diffused out of the peritrophic
membrane and into the gut lumen for further digestion (Terra 1990, Chapman 1998,
Ferreira 2009). At this point, oligomers (i.e. polypeptides) are broken down further into
dimers (i.e. dipeptides) (Terra 1990, Chapman 1998, Ferreira 2009). Dimers are digested

pg. 5
into monomers, such as amino acids, during the final phase of digestion which takes
place in the gut cell microvilli (Terra 1990, Woods and Kingsolver 1999, Ferreira 2009,
Schoonhoven et al. 2005). Amino acids from digested food are absorbed into the
epithelium of the insect’s midgut, transported into the hemocoel through the basolateral
membrane, and carried through the body by hemolymph for assimilation into proteins,
tissues and for other processes (Woods and Kingsolver 1999, Boudko 2012). The waste
material from food digestion passes through the hindgut and out the anus as fecal matter
(Ferreira 2009).
Hemipteran digestive systems, which are adapted to sap-feeding, differ from those
of other insect taxa in that no crop or peritrophic matrix is present (Chapman 1998,
Schoonhoven et al. 2005, Ferreira 2009, Klowden 2013). In addition, digestive enzymes
associated with the first two phases of digestion (such as proteinases) are lacking in
hemipteran sap-feeders (Terra 1990, Cristofoletti et al. 2003, Ferreira 2009).
Herbivorous insects are nitrogen limited, and they satisfy their nitrogen
requirements from their diets (Mattson 1980, Strauss 1987, Schoonhoven et al. 2005).
Acquiring adequate essential amino acids is challenging for sap-feeders because phloem
and xylem saps contain small amounts of amino acids (15-65 mM and 3-10 mM for
phloem and xylem sap, respectively; Sandstrӧm and Moran 1999, Miller and Cramer
2004, Douglas 2006, Ferreira 2009, Hosseini et al. 2010). To concentrate the amino
acids, sap-feeders must eliminate the extra water and carbohydrates from the ingested sap
(Terra 1990). The hemipteran digestive system is well equipped to this task. Ingested
sap flows into the esophagus and then into the tube-like anterior midgut (Chapman 1998,
pg. 6
Ferreira 2009, Dinant et al. 2010, Klowden 2013). A portion of the anterior midgut
comes in contact with a portion of the posterior midgut and Malpighian tubules (Klowden
2013). The complex of tissues is known as a filter chamber, and is enveloped with an
epithelial pouch (Klowden 2013). The filter chamber acts to pump out excess water and
carbohydrates directly into the posterior midgut, which are then eliminated through the
anus as sugary fluid known as “honeydew” (Douglas 2006, Klowden 2013).
1.3 The Madeira Mealybug, Phenacoccus madeirensis Green
The Madeira mealybug is a significant pest, and has gained more notoriety as a
pest species within the past two decades because of its spread worldwide (Herren et al.
1986, Chong et al. 2003, Sclar 2008, Gill et al. 2012). This pest has a relatively short life
cycle (multiple generations per year), and each female can produce hundreds of eggs
during its reproductive period (Chong et al. 2003, Hogendorp et al. 2006, Sclar 2008). In
addition, mealybugs are small and easily go unnoticed until mass infestations have
overtaken plants, causing wilting and eventual death of the crop (Skinkis et al. 2009,
Bethke et al. 2014)
Mealybugs undergo incomplete metabolism, or hemimetabolism, during their life
cycle (Chong et al. 2003, Skinkis et al. 2009, Osborne 2010, Bethke et al. 2014). The
process consists of development through the egg stage and three nymphal instars (four
nymphal instars for males) to reach adulthood. Madeira mealybug eggs are yellow, and
crawlers (first instars) are approximately the same size as eggs and oval in shape with
legs and red eyespots. Second instars are slightly larger than crawlers and become light
pg. 7
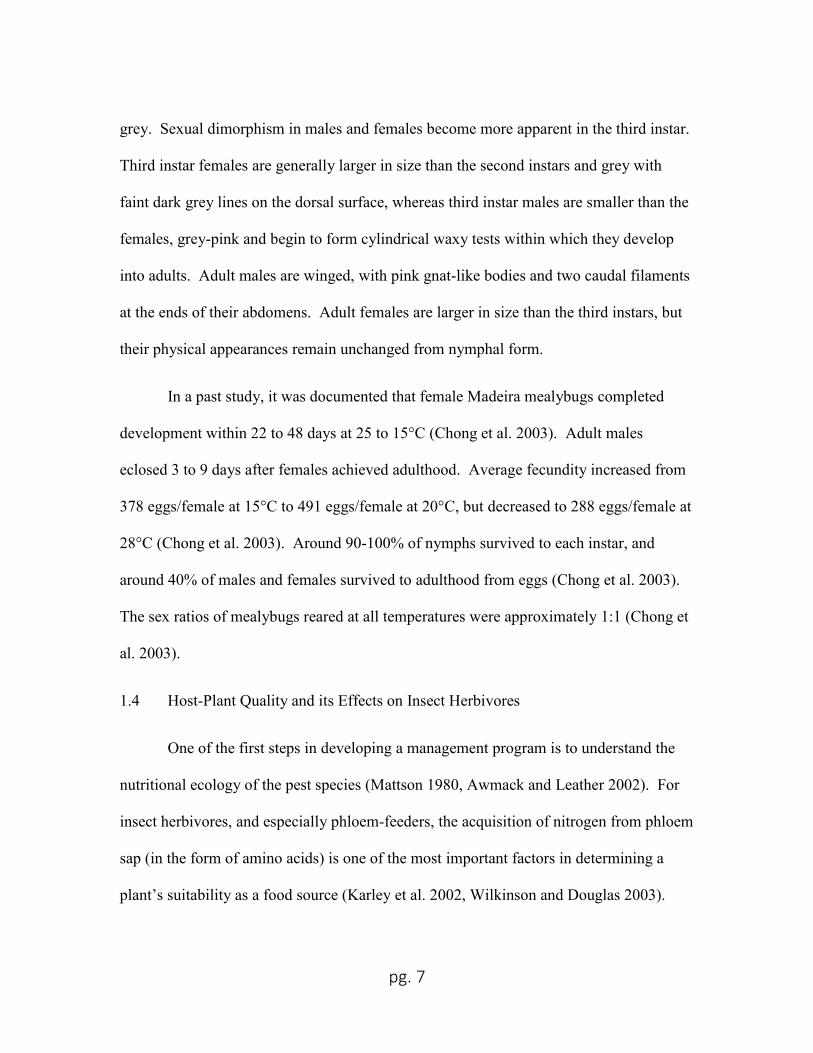
grey. Sexual dimorphism in males and females become more apparent in the third instar.
Third instar females are generally larger in size than the second instars and grey with
faint dark grey lines on the dorsal surface, whereas third instar males are smaller than the
females, grey-pink and begin to form cylindrical waxy tests within which they develop
into adults. Adult males are winged, with pink gnat-like bodies and two caudal filaments
at the ends of their abdomens. Adult females are larger in size than the third instars, but
their physical appearances remain unchanged from nymphal form.
In a past study, it was documented that female Madeira mealybugs completed
development within 22 to 48 days at 25 to 15°C (Chong et al. 2003). Adult males
eclosed 3 to 9 days after females achieved adulthood. Average fecundity increased from
378 eggs/female at 15°C to 491 eggs/female at 20°C, but decreased to 288 eggs/female at
28°C (Chong et al. 2003). Around 90-100% of nymphs survived to each instar, and
around 40% of males and females survived to adulthood from eggs (Chong et al. 2003).
The sex ratios of mealybugs reared at all temperatures were approximately 1:1 (Chong et
al. 2003).
1.4 Host-Plant Quality and its Effects on Insect Herbivores
One of the first steps in developing a management program is to understand the
nutritional ecology of the pest species (Mattson 1980, Awmack and Leather 2002). For
insect herbivores, and especially phloem-feeders, the acquisition of nitrogen from phloem
sap (in the form of amino acids) is one of the most important factors in determining a
plant’s suitability as a food source (Karley et al. 2002, Wilkinson and Douglas 2003).

pg. 8
Numerous studies have investigated the effects of host-plant nutritional quality on insect
biology and ecology (e.g. Awmack and Leather 2002, Hogendorp et al. 2006, Hosseini et
al. 2010, Sauge et al. 2010). Most studies report shorter insect developmental times and
higher fecundity of phloem-feeding insects on fertilized plants (Rae and Jones 1992,
Awmack and Leather 2002, Hogendorp et al. 2006, Sauge et al. 2010). Per capita
fecundity of citrus mealybugs (Planococcus citri Risso, Hemiptera: Pseudococcidae)
increased with increasing nitrogen fertilization level from 0 to 400 ppm N (Hogendorp et
al. 2006). The greatest citrus mealybug fecundity was recorded on coleus (Solenostemon
scutellarioides Linnaeus and Brown, Lamiaceae) plants fertilized at 400 ppm N, with 192
eggs/female for the red variety coleus and 312 eggs/female for the green variety coleus
(Hogendorp et al. 2006). Citrus mealybugs reared on coleus receiving 100, 200, and 400
ppm N had shorter developmental times (45.1-48.6 days) than those reared on 0, 25 and
50 ppm N (52.5-57.2 days) (Hogendorp et al. 2006). Coleus plants (regardless of variety)
had significantly greater mean heights, numbers of branches, and numbers of leaves when
fertilized at 200 and 400 ppm N (Hogendorp et al. 2006). Hosseini et al. (2010) found
that the net reproductive rate (Ro), intrinsic rate of increase (rm), and finite rate of increase
(λ) of cotton aphids (Aphis gossypii Glover, Hemiptera: Aphididae) reared on cucumber
(Cucumis sativus L., Cucurbitaceae) fertilized with the highest nitrogen level (190 ppm
N) were significantly higher than those of aphids reared on plants fertilized with lower
nitrogen levels (90, 110, and 150 ppm N). The developmental times and doubling times
were significantly shorter for aphids reared on cucumber plants fertilized at 190 ppm N
(Hosseini et al. 2010). Also, higher nitrogen percentages in leaves correlated positively

pg. 9
with higher nitrogen fertilization rates (Hosseini et al. 2010). Plant nitrogen fertilization
level had a great effect on the size of aphid offspring, with offspring reared on cotton
plants (Gossypium hirsutum L., Malvaceae) fertilized at 100% of the recommended
nitrogen level having significantly greater head widths and body lengths than those reared
on non-fertilized plants (Nevo and Coll 2001).
Other studies have shown that insect survival is higher when they feed on plants
fertilized at moderate nitrogen levels, not higher N fertilization rates (Mattson 1980,
Strauss 1987, Honěk 1991, Rae and Jones 1992, Gash 2012). High and low levels of
nitrogen fertilization reduced the survivorship of sugarcane mealybug (Saccharicoccus
sacchari Cockerell, Hemiptera: Psuedococcidae) nymphs when compared to the median
levels (Rae and Jones 1992). The researchers suggested that the negative responses at the
high nitrogen level might have been the result of increased host-plant production of
nitrogen-based defense compounds, such as glycoalkaloids.
Other sap-feeding insects do not respond, or have negative responses to nitrogen
fertilization. Metopolophium dirhodum, Walker (Hemiptera: Aphididae) abundance
increased with increasing nitrogen fertilization levels (from 0 to 160 kg N/hectare) of
winter wheat (Triticum spp. L., Poaceae) and barley (Hordeum vulgare L., Poaceae),
whereas the population abundance of Sitobion avenae, F. (Hemiptera: Aphididae)
remained unchanged on the host-plants over the course of the 8-year experiment (Honěk
1991). Honěk (1991) concluded that nitrogen fertilization affected the nutritional quality
of leaves more than that of ears, leading to differential responses in S. avenae (an ear-
feeder) and M. dirhodum (a leaf-feeder).

pg. 10
Phloem-feeding insect populations increased on potted plants fertilized at higher
ammonium nitrate concentrations, whereas beetle densities did not increase as
ammonium nitrate level was increased from 0 to 80 g/m2 (Strauss 1987). Damage by
beetles (chewing herbivores) decreased on fertilized plants, which might be the result of
predation of beetle larvae and eggs by ants attracted to honeydew produced by the
phloem-feeders (Strauss 1987). Researchers assert that phloem-feeding insects may
change the quality of plants by extracting amino acids with the phloem sap thereby
disrupting nutrient flow, and altering plant amino acid concentrations, and plant growth
and development (Strauss 1987, Walling 2008).
1.5 Hypotheses and Expected Results
The objectives of this study were: 1) Evaluate the influences of different nitrogen
fertilization treatments on plant growth, 2) Evaluate the influences of different nitrogen
fertilization treatments on host-plant tissue %N, %C, and protein and lipid contents, 3)
Evaluate the influences of mealybug infestation on plant growth and plant tissue
macromolecular contents, 4) Study the effects of host plant nitrogen fertilization on
Madeira mealybug life history, and 5) Evaluate how plant nitrogen status influenced the
nutrient contents (total protein and lipid) of female mealybugs and their eggs.
Plant growth was evaluated by measuring plant height, numbers of branches,
numbers of leaves, and stem widths over several weeks to assess changes in plant growth
across nitrogen levels. Plants fertilized with 300 ppm N were predicted to be taller, have
more leaves and branches, and have wider stems than plants fertilized with lower

pg. 11
nitrogen levels. The shortest plants with the fewest leaves and branches, and the
narrowest stems were predicted to be from the 0 ppm N level. The same expectations
were for plant canopy fresh and dry weights, root weights, leaf surface area
measurements, and root length measurements. I expected plants from the 300 ppm N
level to have greater canopy weights (fresh and dry), root weights (fresh and dry) and leaf
surface areas, as well as longer roots, than plants from the other nitrogen levels because
300 ppm N plants would have more nitrogen available to proliferate root and canopy
growth. I hypothesized that unfertilized plants would have the lowest values for canopy
and root weights, leaf surface areas and root length because these plants would be
nitrogen-limited and restricted in their abilities to allocate nitrogen to growth.
In addition to plant growth, total protein and lipid contents, and total %N and %C
of plant tissues were evaluated. I hypothesized that %N and total protein contents of
plant tissues would be greater for plants from the 300 ppm N level than for plants
fertilized at the other nitrogen concentrations. Sauge et al. (2010) reported that the leaf
nitrogen contents of young peach trees (Prunus persica Linnaeus and Batsch, Rosaceae)
increased positively with nitrogen fertilization level. In wheat and barley, chaff (ear) %N
increased with nitrogen fertilization level (Honěk 1991). Total %C and lipid values of
plants tissues were not expected to differ significantly across treatment levels because
carbon compounds are used in and derived from photosynthesis and would not be directly
impacted by the nitrogen fertilization levels (Raven et al. 2005). Past studies have also
found that increasing nitrogen fertilization does not significantly affect plant tissue
carbon (Ye et al. 2014) or lipid (Grunwald et al. 1997) concentrations. I hypothesized

pg. 12
that infested and uninfested plants would not differ significantly from one another in
plant growth, but would differ in %N and %C and protein and lipid contents of plant
tissues. The effects of the nitrogen fertilization treatments might overshadow the effects
of mealybug infestation on plant growth. However, because mealybugs extract nutrients
from plants’ phloem systems, I expected that plants infested with mealybugs would show
greater sensitivity to the infestation through changes in the elemental and
macromolecular contents of plant tissues.
Developmental times, survivorship and fecundity of the Madeira mealybugs reared
on plants fertilized at 0, 75, 150 and 300 ppm N were observed in this study. Net
reproductive rates, generation times, intrinsic rates of increase, and finite rates of increase
of mealybugs were also estimated. I hypothesized that the developmental times of each
instar would be greater for insects reared on plants fertilized at 0 and 75 ppm N than for
those reared on plants fertilized at 150 and 300 ppm N. I also hypothesized that females
reared on plants fertilized with 150 and 300 ppm N would have greater reproductive
longevity after the onset of egg production than females from 0 and 75 ppm N level
plants. I hypothesized that the numbers of individuals and proportions of individuals
surviving per stadia would be greater for insects reared on 150 and 300 ppm N plants
than for insects reared on 0 and 75 ppm N plants. Fecundity, net reproductive rates,
intrinsic rates of increase, and finite rates of increase were also hypothesized to increase
as plant nitrogen levels increased, with the highest measurements of these parameters
occurring at the 300 ppm N treatment level and the lowest values occurring at 0 ppm N.
These hypotheses were based on findings of past studies where phloem-feeders exhibited

pg. 13
shorter developmental times, higher fecundity, higher net reproductive rates and higher
intrinsic and finite rates of increase with higher plant nitrogen fertilization (Awmack and
Leather 2002, Hogendorp et al. 2006, Hosseini et al. 2010, Sauge et al. 2010, Karley et al.
2002).
To evaluate how Madeira mealybug nutrient status is affected by plant nitrogen
quality, the total protein and lipid contents of adult females and their eggs were analyzed.
Only adult females were used in this portion of the study because female nutrition
determines the quality of eggs produced (Awmack and Leather 2002). Aside from high
water concentrations, insect eggs are mostly composed of proteins and lipids (Kawooya
et al. 1988). Protein in the form of vitellin serves as the resource for structural
development – as the egg matures, vitellin is translated into embryonic protein (Hagedorn
and Kunkel 1979). Generally, lipids and proteins each make up 30 – 40% of the dry
weight of insect eggs (Kawooya et al 1988, Zeigler and Antwerpen 2006, Pӧykkӧ and
Mӓntӓrri 2012). However, egg compositions differ across species and within species,
based on life history and parental nutrient accruement (Sloggett and Lorenz 2008). I
hypothesized that total protein content of adult females and eggs would be highest for
those raised on 300 ppm N treated plants, while protein values for insects and eggs from
the other treatment levels were expected to be lower. However, I hypothesized that the
lipid content of adult females and eggs would not differ significantly across plant
nitrogen levels.
I correlated the total protein and lipid values of the adult females and eggs to host-
plant total protein and lipid absorbance values, and plant %N and %C contents. In

pg. 14
addition, female protein and lipid data were analyzed for correlation to egg protein and
lipid data to determine if significant patterns existed between the nutrient status of the
females and the nutrient status of the eggs produced. Past studies have indicated that
females can manipulate the allocation of nutrients towards eggs/offspring based on the
nutrients accrued from food (Papaj 2000). Females feeding on low nutrient quality foods
use two options when producing eggs: 1) the female produces many low-nutrient quality
eggs; or 2) the female produces fewer eggs, but they are of high nutrient quality
(Awmack and Leather 2002). A majority of studies on nutritional stress and resource
allocation in insects focus on insect population performance and fecundity, while few
studies have investigated the macromolecular composition of eggs produced by females
under nutritional stress (Sloggett and Lorenz 2008). I expected that adult female and egg
total protein contents would exhibit positive, linear correlations with plant protein
because female and egg protein contents would be directly influenced by the protein
content of the food (plant). As nitrogen fertilization level increases, so too would plant
protein content, and the amount of nitrogen available to female mealybugs for growth and
reproduction. Lipid values of adult females, eggs, and plant tissues were not expected to
have any correlations because nitrogen fertilization would not directly affect lipid
concentrations within plants. I hypothesized that correlations between female protein
contents and egg protein contents would have a significant positive correlation based on
plant nitrogen level. No correlation was expected between female lipid absorbance
values and egg lipid absorbance values based on plant nitrogen level.

pg. 15
CHAPTER TWO
MATERIALS AND METHODS
2.1 Preparation of Plants and Fertilizer Treatments
Basil (O. basilicum, cultivar ‘Black Opal’) was selected as the host-plant because
of its short germination time and heat tolerance (Puteivsky and Galambosi 2003). Seeds
(Jiffy International, Kristianand, Norway) were sown in two germinating trays filled with
Fafard Super Fine Germinating Mix (SunGro Horticulture, Agawam, MA, USA) on 16
May 2014. The trays were misted with water daily using a handheld spray bottle until the
medium was moist, but not saturated. The germination trays were placed in a greenhouse
at the Pee Dee Research and Education Center (PDREC) in Florence, SC. The glass roof
was covered with a shade cloth that provided 30% shade. The mean temperature (±
standard error mean) and relative humidity (± SEM) in the greenhouse, from July 8th to
August 22nd, were 28.4± 0.090°C (95% CI= 28.3°C to 28.5°C) and 79.4± 0.174% (95%
CI= 79.1 to 79.8%), respectively. The seeds germinated on 26 May 2014.
As recommended by Hamrick (2003), the basil seedlings received a 0.120 g N/L
H2O (150 ppm) nitrogen fertilizer solution after sprouting from the germination medium.
In the prepared fertilizer solution, nitrogen was provided in the form of calcium nitrate
(15% nitrogen; Fisher Scientific, Waltham, MA, USA), ammonium nitrate (34%
nitrogen; Certified ACS, Fisher Scientific), and urea (46% nitrogen; Potash Corporation
of Saskatchewan, Saskatoon, Canada). The fertilizer solution also contained 0.543 ml / L
H2O (0.050 g P/L H2O = 50 ppm) of P2O5 (Liquid Phosphorus Solution 0-30-0; Growth

pg. 16
Products, Inc., White Plains, NY, USA) and 1 ml/L H2O (0.101 g K / L H2O = 100 ppm)
potassium (ACE 29 0-0-29; Custom Agronomics, Inc., Palm City, FL, USA; see
Appendix A for recipes of the fertilizer solutions). Each tray received 200 ml of fertilizer
solution every two days, and was irrigated with tap water as needed. Water and fertilizer
solution were poured into solid bottom trays holding the germination trays; this was done
to retain water and fertilizer solution, and to keep the germination medium moist.
Two hundred eighty-eight seedlings were selected from the tallest seedlings and
transplanted individually to 72-cell trays on 29 May 2014. Each seedling was assigned a
number (1-288). The growing medium used for these trays consisted of 75% peat moss
(Pro-Moss Sphagnum Peat Moss, Premier Tech Horticulture, Ltd, Quakertown, PA,
USA), 25% sand (Golf Agronomics, Lugoff, SC, USA) and dolomic lime (0.378 g / cm3
of peat moss-sand mixture to achieve pH of 5.5-6). All constituents of the growing
medium were hand-mixed until uniform, and then transferred to an electric soil sterilizer
(Pro-Grow Model SS-60R, Pro-Grow Supply Corp; Brookfield, WI, USA) and heat-
sterilized at 82.2°C for 24 hours. The purpose of using a specially made potting medium
of sand and peat moss, instead of a peat moss-pine bark based commercial potting
medium, was to provide the plants with an adequate growing medium while avoiding any
added chemicals or fertilizers that are usually found in commercial medium.
Beginning on 11 June 2014, the amount of fertilizer solution was increased to 800
ml per tray to meet growing plant needs. On 20 June, a majority of seedlings had reached
at least 10 cm in height. Twenty seedlings were selected and assigned randomly into four
groups using a random sequence generator (RANDOM.ORG, Randomness and Integrity

pg. 17
Services Ltd. 2015) and harvested to assess canopy and root weights for pre-assignment
(before nitrogen and infestation treatments) measurements. These measurements were
taken to detect any significant differences in weights and growth of the seedlings (“Pre-
assignment data”). Plant canopies were cut at the medium level, and roots were washed
clean of growing medium. Roots were allowed to air dry before their fresh weights were
recorded. Canopies and roots were weighed (fresh weights) separately, placed in paper
bags, dried in a drying oven at 60°C for 24 hours, and weighed again (dry weights). One
hundred and twenty eight seedlings were selected randomly from the remaining seedlings
and transplanted individually to pots (10 cm in height and 15 cm in diameter at the rim)
filled with sterilized sand-peat moss growing medium. Each pot was irrigated with 400
ml and 50 ml of water before and after transplant, respectively. Saucers (3.2 cm in height
and 20.3 cm diameter) were placed under the pots to collect extra water and fertilizer
solution leached from the pots. Plant heights, numbers of fully expanded leaves, and
stem widths were measured for two weeks after transplant (“Pre-infestation data”).
Water sources for the fertilizer solutions and daily irrigation were located in the
laboratory and greenhouse, respectively. One water sample (500 ml) from each location
was collected mid-day on May 28 in sterilized plastic bottles, and sent to the Agricultural
Services Laboratory (ASL; Clemson, SC) to analyze for pH, mineral, and minor element
contents. Analysis showed that the pH of both water sources was 7.3, with low amounts
of phosphorus, potassium, magnesium, zinc, copper, manganese, iron, boron, sodium,
and chlorine (see Appendix B). Calcium was present in both water sources at 8.6 mg/L
(laboratory) and 8.7 mg/L (greenhouse).

pg. 18
Two samples of the sand-peat moss growing medium (0.9 kg each) were also
collected on May 28 in plastic bags, and sent to the ASL for analysis of pH level, mineral
contents, electrical conductivity and total dissolved solids. Analysis reported that both
samples had the same pH (5.6-5.7), and similar constitutions of total dissolved solids,
electrical conductivity, and mineral content (see Appendix B).
Eighty potted plants were assigned randomly to one of two mealybug infestation
categories: Infested or Uninfested (40 plants in each group). Within each infestation
category, 10 plants were assigned randomly to each of the four nitrogen fertilization
levels. The four nitrogen fertilization treatments were 0, 75 (0.060 g N / L), 150 (0.120 g
N / L), and 300 (0.240 g N / L) ppm. The fertilizer solutions of different nitrogen
concentrations were prepared with the nitrogen, phosphorus (0.050 g / L H2O = 50 ppm),
and soluble potash (0.101 g / L H2O = 100 ppm) sources (see Appendix A).
Beginning on 21 June, each plant received 100 ml of fertilizer solution of its
assigned nitrogen concentration daily for one week. A minor elements solution (Energy
Turf and Ornamental Micronutrients, Manufacturer: Vereens Turf Center; Longs, SC,
USA) was diluted to 2.510 ml / L H2O. Five milliliters of the diluted solution was
provided to each plant weekly. Each 5 ml of diluted minor elements solution consisted of
1.639 x 10⁻⁴ g (1%) magnesium, 3.278 x 10⁻⁶ g (0.02%) boron, 4.917 x 10⁻⁴ g (3%) iron,
6.901 x 10⁻⁵ g (4%) manganese, and 3.278 x 10⁻⁶ g (0.02%) zinc. To prevent the plants
from getting top-heavy and falling over or breaking, wooden dowels were placed in the
pots and the plants were secured upright by tying them to the dowels.

pg. 19
Temperature and relative humidity in the greenhouse were recorded with data
loggers (HOBO UX 100 Temp/RH 3.5% Data Logger; Onset Computer Corporation,
Bourne, MA, USA). One data logger was prepared for each of the four greenhouse
benches. Each data logger was hung 0.3 m above the bench-top in the middle of each
bench using fishing lines, and covered with a radiation shield constructed by gluing a
Styrofoam cup (8.89 cm diameter x 12.7 cm height) to the middle of the concave side of
a Styrofoam plate (25.4 cm diameter) covered in aluminum foil. The data loggers were
hung inside the cups with the sensor portions exposed to the ambient environment.
Readings of pH were recorded by submerging the electrode top of a pH meter (pH
100: ExStik; Extech Instruments Corporation, Nahua, NH, USA) in the effluent collected
in the saucers. Potted plants from each nitrogen fertilization level were randomly
selected for pH readings on June 21, June 25, June 27, July 19, July 23, and July 30. The
average pH across all measurement dates and nitrogen levels was 6.21 ± 0.05 (95% CI=
6.11 to 6.30). Chlorfenapyr (Pylon, at 0.019 g/100 ml H2O; BASF Corporation, Research
Triangle Park, NC, USA) was applied to all plants on 26 June when thrips damage was
observed. Chlorfenapyr was effective against thrips but degrades quickly to have no
impact on the mealybugs introduced onto the plants.
2.2 Mealybug Infestation and Data Collection
Madeira mealybug colonies were maintained on sprouted potatoes (Solanum
tuberosum L., Solenaceae) in the laboratory at the PDREC. One hundred eighty gravid
females (beginning to form egg sacs but no eggs had been deposited) were collected from

pg. 20
colonies and introduced to 20 petri dishes (10 cm diameter x 1.5 cm height). Leaves of
untreated Verbena (Verbena sp. L., Verbenaceae) were collected from a greenhouse. A
petiole was put through a hole at the bottom of a petri dish and immersed in tap water
contained in a specimen cup (5.08 cm diameter x 8.89 cm height). The verbena leaves
provided an adequate stratum for the female mealybugs to lay their eggs and were
succulent enough for the females to feed from while reproducing. The females were
monitored for egg production over the next 10 days. All eggs and egg sacs produced in
the first three days were removed and discarded until a majority of the females had
produced enough eggs of the same age (within 24 hours) for infesting multiple plants.
Twenty plants selected randomly from each nitrogen concentration level were
infested each day on 8 and 9 July 2014. Eggs produced over 24 hours were collected and
pooled. One leaf was selected from each plant to hold the eggs and a clip cage. Leaves
holding the eggs and clip cages were chosen based on several criteria: 1) leaves were
fully expanded; 2) similar in color (limited variegation in leaf color); 3) at least 6.35 cm
long (from the base to the tip of leaf) and large enough to accommodate the clip cages.
Clip cages were used to secure the eggs in place, and mimicked a protective environment
that would be provided by the waxy egg sacs. Forty eggs were secured on the underside
of each selected leaf. Clip cages were constructed from flexible foam, chiffon cloth and
metal alligator clips.
The infested and uninfested plants were arranged on four greenhouse benches,
with 20 plants on each bench. The benches were separated into five sections (spaced
0.25 m apart), with four plants in each section. Plants from all four nitrogen levels were

pg. 21
represented in each section. Infested and uninfested plants were not put together in the
same sections. Each plant received 200 ml of its respective fertilizer solution three days a
week and was irrigated with water as needed. Water-filled saucers functioned as moats
to make sure that mealybugs did not disperse to other pots. Plant growth was observed
after infestation (“Post-infestation data”).
Clip cages were removed from the infested plants when all eggs had hatched. All
plants were inspected daily, using a 10x magnifying loupe, for mealybug crawlers (first
instars), second instars, third instars, and adults until the plants were harvested in mid-
August. Empty tests indicate successful adult male eclosion, and were used as a proxy
for adult male abundance. These data were used to compute the developmental duration
of each stage and survivorship from eggs to adults.
The proportion of surviving individuals at the beginning of each instar/stage (lx) is
equal to nx/no, where nx is the number of individuals alive at a given instar and no is the
number of eggs transferred to plants at the beginning of the infestation treatment. The
mortality rate (qx) was calculated by dividing lx – lx+1 by lx, where lx+1 is the proportion of
survivors in the instar succeeding lx. The formulae for lx and qx were adapted from those
described in Ecology (Cain et al. 2011).
To make sure that females were fertilized and produced eggs, the lab colony was
brought out in a clear, rectangular plastic container (81.6 cm x 48.6 cm x 17.8 cm) and
placed in the middle of the greenhouse room during the 1 – 22 August. Petroleum jelly
was applied around the inside of the top of the container (5 cm in width), and then the top

pg. 22
of the container was covered in chiffon fabric with a 10 cm diameter hole cut through the
fabric in the center of the container. Only males from the lab colony were able to fly out
of the container to fertilize the females in the greenhouse, while lab colony females were
kept trapped inside the container. The first adult females to reproduce on each
experimental plant were collected and secured on a fully expanded leaf with a clip cage
closest to where it was found. Plants that did not produce any adult females received
gravid females from other plants fertilized at the same nitrogen levels. The females were
observed daily, their egg sacs were removed, and the numbers of eggs were recorded on
1-22 August 2014.
Fecundity (mx) was calculated by counting all eggs produced by each female
(Cain et al. 2011). Net reproductive rate (Ro) of adult female mealybugs was calculated
by taking the sum of the product of lx and mx (formula adapted from Chong et al. 2008).
Mean generation time (GT) was calculated by multiplying Ro by the average time (days)
for adult females to reproduce (x) and then divide by Ro (Chong et al. 2008). The
intrinsic rate of increase (rm) was estimated by dividing the natural log of the net
reproductive rate by the mean generation time ([ln(Ro)] / GT; Chong et al. 2008). To
estimate finite rate of increase (λ), the mathematical constant e is raised to the power of
the intrinsic rate of increase (er) (Chong et al. 2008).
Females not selected for the fecundity assessment were allowed to produce eggs,
and these females and their eggs were collected on 15-18 August. The collected eggs and
females were stored in 2-ml microcentrifuge tubes (Eppendorf; Hamburg, Germany) at -

pg. 23
80°C until lipid and protein analyses. Eggs collected from the same plants were stored in
a single tube; likewise, for females.
Beginning on 20 June 2014, plant heights, numbers of fully expanded leaves,
numbers of branches, and stem widths were measured weekly. Fully expanded leaves
were defined as leaves that had reached at least 2.5 cm in length and 1.9 cm in width at
the widest area of the blade. Terminals with at least two fully expanded leaves were
considered branches. The stem width was taken 2.5 cm above the sand – peat moss mix
surface. These measurements were taken on 20 June (destructive sampling was
conducted on seedlings one week after transplant), 26 June (2 weeks after transplant and
1 week after fertilization treatment had begun), 30 June (3 weeks after transplant), 14 and
15 July (5 weeks after transplant), 21 and 22 July (6 weeks after transplant), 28 and 29
July (7 weeks after transplant), and 11 and 12 August (9 weeks after transplant).
Five plants from each infested or uninfested group of each nitrogen level were
selected randomly and harvested on 17 August 2014. The canopy fresh weights, root
fresh weights and root lengths were measured immediately after harvest. Each plant was
divided into three regions based on its height: bottom (0-30% plant height section),
middle (30-60% plant height section), and top (60-90% plant height section). From these
divisions, two leaves were taken from one node in the middle section and two leaves
from a node in the top section. No leaves were taken from the bottom section because of
an absence of enough leaves, and because the leaves had begun senescence and
degradation. The surface areas of these leaves were measured using an LI-3100 Leaf
Area Meter (LI-COR, Lincoln, NE, USA).

pg. 24
Two stem sections from the middle plant height region and two from the top plant
height region were collected from each of the selected plants for %N and %C analysis.
Stem sections were 2.5 cm in length with nodes in the middle of the sections.
Additionally, one stem section and one leaf were collected from each of the middle and
top regions of each selected plant, and were stored in a -80°C freezer until total protein
and lipid analyses. The leaves selected for surface area measurements, the stem sections
for %N and %C analysis, and remaining plant materials were placed in a drying oven and
dried at 60°C for 72 hours. After the plant tissues were completely dried, canopy and
root dry weights were measured. The protein, lipid, and % carbon and % nitrogen
analyses took place February – April 2015.
2.3 Protein and Lipid Content Analyses for Mealybugs and Plant Tissues
A total of 40 adult females (weighing 1 mg each ± 0.00) and 32 egg samples
(samples weighing 1 mg each ± 0.00) were used for protein and lipid content analyses
(see Appendix C for a summary of all protein and lipid assays). Protein assays were
conducted based on the Bradford method (Bradford 1976). A total of 20 egg samples (5
samples per nitrogen level) and 20 adult female mealybugs (5 females per nitrogen level)
were analyzed for total protein. Each female insect and each egg sample were placed in
separate sterilized, 1.7-ml microcentrifuge tubes (Genesee Scientific, San Diego, CA,
USA). Six protein standards (1, 0.5, 0.25, 0.125, 0.0625 and 0.03125 mg/ml) were
prepared from diluted albumin standard (Thermo Scientific, Rockford, IL, USA). Both
the samples and standards were placed on ice before processing.

pg. 25
One protease inhibitor tablet (Pierce/Thermo Scientific Protease Inhibitor Mini
Tablets, Thermo Scientific, Rockford, IL, USA) was completely dissolved in 10 mL of
hypotonic lysis buffer (AMRESCO, Solon, OH, USA). One hundred microliters of
hypotonic lysis buffer mixed with protease inhibitor was added to each sample. Samples
were homogenized within 30 seconds using a small micro-centrifuge pestle. Samples
were then centrifuged at 5000xg at 4°C for 5 minutes in a refrigerated centrifuge (5804
R; Eppendorf Hamburg, Germany). Supernatants were transferred to new tubes and
placed on ice.
Bradford reagent was prepared by mixing 1 part Bio-Rad Dye Reagent
Concentrate (Bio-Rad Laboratories, Hercules, CA, USA) and 4 parts deionized, distilled
water (ddH2O). The reagent was gravity filtered through filter paper (Qualitative:
medium, 7.0 cm diameter; Fisher Scientific Company, Pittsburgh, PA, USA).
Ten microliters of supernatant from each standard and sample were aliquoted in
triplicate to microplate wells (Corning Inc., Corning, NY, USA). Two hundred
microliters of Bradford reagent were then aliquoted to each well. The microplate also
contained three blank wells (containing only ddH2O) and three control wells (containing
ddH2O and reagent). The microplate was placed on ice and the reagent was allowed to
develop for 5 minutes before absorbance values were determined at 595nm with a
Spectramax Multi Microplate Reader (Molecular Devices, LLC, Sunnyvale, CA, USA). .
Methods for analyzing total lipid content were adapted from Van Handel (1985)
and Cheng et al. (2011). Twenty adult females (5 females per nitrogen level) and 12 egg

pg. 26
samples (3 samples per nitrogen level) were analyzed for total lipid contents. Each
sample was placed in a 1.5-ml HydroLogix micro-centrifuge tube (Molecular
BioProducts, San Diego, CA, USA).
For adult females, a chloroform:methanol (2:1, v:v) wash was used to remove the
waxes and lipids from their body surfaces (Buckner 1993, Brey et al. 1985). The insects
were kept in the wash for 15 minutes and then removed and placed in new
microcentrifuge tubes.
One milliliter of chloroform:methanol (1:1, v:v)was added to each sample tube.
Samples were homogenized for 15 seconds using small microcentrifuge pestles, and then
centrifuged for 10 minutes at 2600xg at room temperature. Supernatants were removed
and placed in new micro-centrifuge tubes. A half milliliter of chloroform:ddH2O (1:1,
v:v) was added to each sample. Samples were vortexed for 15 seconds and then
centrifuged for 5 minutes at 2600xg at room temperature. The water/methanol layer,
separated on the top, was extracted and discarded as waste. Then, 0.5 ml of chloroform
was added to each sample, and samples were vortexed and centrifuged as in the previous
step. The supernatants from the chloroform extractions were collected and combined
with the previously collected supernatants from the same samples.
Ten microliters of supernatant from each sample was aliquoted in triplicate to
microplate wells. The solvent was evaporated at room temperature. When all solvent
had dissipated, 100 µl of sulfuric acid was aliquoted to each well. The plate was
incubated at 70°C for 10 minutes, then allowed to cool to room temperature. Background

pg. 27
absorbance values of the microplate contents were determined in the Spectramax
microplate reader at 490 nm.
Vanillin-Phosphoric acid reagent was made by mixing 600 mg of vanillin with
100 ml of ddH2O (50-60°C) and 400 ml of 85% phosphoric acid (Van Handel 1985).
One-hundred microliters of Vanillin-Phosphoric acid reagent was added to each well, and
color was allowed to develop for 5 minutes. The absorbance values of the samples were
determined again at 490 nm, and were used as a proxy for lipid contents in samples.
Forty-eight leaf and 48 stem samples were processed in the same manner as the
insect samples for protein content analysis and lipid absorbance analysis, except for the
initial wash step (see Appendix C). Leaf and stem section samples were ground with
mortar and pestle, using dry ice. Ten milligrams of plant material was collected from
each sample for these assays.
2.4 Plant Tissue %N and %C Analyses
Leaves and stems were selected from the previously dried plant material for %N
and %C analysis. A leaf tissue sample consisted of leaves collected from the middle and
top plant height regions from the same plant. Dried leaves were placed in a mortar and
ground to a fine powder. Samples weighing 0.1 g were placed in sterilized, labeled
microcentrifuge tubes.
There were three leaf samples from each of the nitrogen treatment levels in both
infested and uninfested plant treatment groups for a total of 24 leaf samples (12 for
infested and 12 for uninfested plants). Stems were treated in the same manner as the leaf

pg. 28
samples with 24 stem samples in total for %N and %C analysis. Leaves from the
different plant height regions were combined, and stem sections from the different plant
height regions were combined for each plant because of the large amount of dry material
needed for analysis.
The %N and %C analyses were conducted by ASL. Percent nitrogen and carbon
analysis of the plant tissues followed the Dumas (thermal combustion) methodology
(Moore and Sikora 2014). Dry samples are heated in the presence of excess oxygen and
release water, carbon dioxide, and nitrogen oxides (Moore and Sikora 2014, Anonymous
1997). The products are separated within the machine via chromatography and are
detected and quantified using a thermal conductivity sensor (Anonymous 1997).
2.5 Statistical Analyses
All data were analyzed using JMP 11 Statistical Software (SAS Institute, Cary,
NC, USA) at α = 0.05. Shapiro-Wilk tests were performed to check for data normality.
The results of Shapiro-Wilk tests suggested that most of the data were not normally
distributed. The following data transformations were used to try to normalize data:
Log10, inverse, square root, inverse of square root, power transformations (X2 and X3).
However, data transformations were not successful in normalizing the data. In addition,
no known non-parametric tests available in the JMP 11 software perform the exact same
functions as 2-way Analysis of Variance (ANOVA). Therefore, the original data were
used in statistical analyses.

pg. 29
One-way ANOVA was used to analyze for significant differences in pre-
assignment and pre-infestation plant growth and harvest data, insect developmental times,
insect longevity and fecundity, number of mealybugs (x), proportion of mealybugs
surviving to each instar (lx), mortality rates of mealybugs (qx), and insect and egg protein
contents and lipid absorbance values.
Post-infestation plant growth and harvest data, %N and %C of plant tissues and
protein content and lipid absorbance values of plant tissues were analyzed using the 2-
way ANOVA, with nitrogen level and infestation as the main treatment factors. When
ANOVA detected significant differences, means were separated with Tukey’s Honest
Significant Difference (HSD) test, unless otherwise noted.
Non-parametric Wilcoxon/Kruskall-Wallis analysis was used to determine if any
significant differences existed among the four plant nitrogen levels for mealybug
fecundity (mx), net reproductive rate (Ro), generation time (GT), intrinsic rate of increase
(rm), and finite rate of increase (λ). Steel-Dwass non-parametric analysis was conducted
to determine which treatments differed from others.
Correlations among plant %N and %C, plant protein and lipid, adult female
protein and lipid and egg protein and lipid results were conducted using JMP’s Graph
Builder function, Fit Least Squares, and Multivariate correlation functions. Pearson
correlation analyses were used to obtain correlation coefficient values and significance
levels.

pg. 30
2.6 Voucher Specimens
Representative specimens of adult female Madeira mealybugs, obtained from the
PDREC laboratory colony used in this study, are located in the Clemson University
Arthropod Collection (CUAC).

pg. 31
CHAPTER THREE
RESULTS
3.1 Pre-Assignment Seedling Height and Harvest Measurements
No significant difference among groups was found in seedling height (F3, 16=
0.8333, P= 0.4950), canopy fresh weights (F3, 16= 0.0769, P= 0.9701), canopy dry
weights (F3, 16= 0.0346, P= 0.9910), root fresh weights (F3, 16= 1.1411, P= 0.3625), and
root dry weights (F3, 16= 0.9671, P= 0.4324). Average height of pre-assignment seedlings
was 13.53 cm (+/- 0.32 ). Canopy fresh and dry weights for seedlings were 0.73 g (+/-
0.03) and 0.10 g, respectively. Average seedling fresh root weight was 0.19 g (+/- 0.06)
and dry root weight was 0.03 g.
3.2 Pre-Infestation Plant Growth
Plant heights, numbers of fully expanded leaves, and stem widths of plants before
infestation were not different from each other across nitrogen levels for Weeks 2 and 3
(Tables 3.1, 3.2 and 3.3). In Week 2, the plants were on average 16.05 cm in height with
11.3 fully expanded leaves and 0.29 cm in stem width. By week 3, average plant growth
had increased to 19.57 cm in height with 14.7 leaves and 0.30 cm in stem width.
pg. 32
Table 3.1 Weeks 2 and 3: Canopy height measurements (cm) of young basil plants grown in the
greenhouse and fertilized with different nitrogen levels. Results are shown as means ± standard
error mean (SEM).
ppm Level Week
2 3
0 16.07 + 0.42 20.16 + 0.66
75 15.94 + 0.28 19.47 + 0.54
150 15.81 + 0.46 18.42 + 0.56
300 16.38 + 0.40 20.21 + 0.29
ANOVA Statistics F3, 36= 0.3849
P= 0.7645
F3, 20= 2.5029
P= 0.0886
Table 3.2 Weeks 2 and 3: Numbers of fully expanded leaves of young basil plants grown in the
greenhouse and fertilized with different nitrogen levels. Results are shown as means ± SEM.
ppm Level Week
2 3
0 11.0 + 0.33 15.0 + 0.45
75 11.4 + 0.31 14.3 + 0.33
150 11.2 + 0.33 14.0 + 0.00
300 11.6 + 0.27 15.3 + 0.42
ANOVA Statistics F3, 36= 0.6977
P= 0.5596
F3, 20= 3.0303
P= 0.0533
Table 3.3 Weeks 2 and 3: Stem width measurements (cm) of young basil plants grown in the
greenhouse and fertilized with different nitrogen levels. Results are shown as means ± standard
error mean SEM.
ppm Level Week
2 3
0 0.26 + 0.01 0.28 + 0.02
75 0.27 + 0.01 0.30 + 0.01
150 0.31 + 0.02 0.32 + 0.00
300 0.31 + 0.01 0.31 + 0.01
ANOVA Statistics F3, 36= 2.8509
P= 0.0509
F3, 20= 1.7284
P= 0.1934

pg. 33
3.3 Post-Infestation Plant Growth
Mealybug-infested plants grown at 0 ppm N were significantly shorter than their
counterparts grown at the higher nitrogen levels (Table 3.4). By Week 9, 0 ppm N
treated, infested plants were 44.61 cm in height and uninfested plants were 48.01 cm.
Plants grown with 75 ppm N were taller (Week 9: infested height was 60.01 cm,
uninfested height was 64.14 cm) than the plants fertilized at other nitrogen levels.
Significant differences did not exist between infested and uninfested plant heights for any
of the nitrogen levels, except for 150 ppm N treated plants during Week 5 when infested
plants were taller than uninfested plants.
Plants fertilized at 75 and 150 ppm N did not differ significantly in numbers of
leaves from unfertilized or 300 ppm N fertilized plants (Table 3.5). By Week 9, infested
plants from all the nitrogen levels had on average 19.5 leaves and uninfested plants had
18.3 leaves. Uninfested and infested plants did not differ in the numbers of leaves across
nitrogen levels, except at 300 ppm N where infested plants had a significantly greater
number of leaves than their uninfested counterparts during Week 5.
Unfertilized plants (both infested and uninfested) had the fewest branches (Table
3.6). Infested and uninfested plants at the 75, 150, and 300 ppm N levels had
significantly more branches than did their uninfested counterparts across measurement
dates. By Week 9, plants treated with 75, 150, and 300 ppm N did not differ from each
other in number of branches regardless of infestation status. On average, infested plants
of the 75, 150 and 300 ppm N levels had 18.8 branches and uninfested plants had 14.9

pg. 34
branches by Week 9. Uninfested and infested, unfertilized plants had 5 branches on
average at Week 9.
For stem width measurements, plants treated with 300 ppm N had wider stems
than did plants from the other nitrogen levels in both infestation levels during Weeks 6, 7,
and 9 (Table 3.7). Significant differences in stem width began to show at Week 6 for
both infested and uninfested plants; however, for uninfested plants the significant
differences in stem width did not remain constant to Week 9. By Week 9, the stem
widths of 300 ppm N plants were 0.54 cm for infested plants and 0.46 cm for uninfested
plants. Infested plants of the 75, 150 and 300 ppm N levels had significantly wider stems
than did their uninfested counterparts at week 9. On average, infested plants in the 75,
150, and 300 ppm N levels had stems 0.51 cm in width which was 0.07 cm more than the
average stem width for uninfested plants of the same nitrogen levels.

pg. 35
Table 3.4 Weeks 5, 6, 7 and 9: Plant heights (cm) of infested (I) and uninfested (U) basil plants
grown in the greenhouse and fertilized with different nitrogen levels. Results are shown as means
± SEM.
Infested /
Uninfested
ppm
level
Week
5 6 7 9
I
0 33.37 + 0.70
a; A
38.39 + 0.95
b
41.85 + 1.08
b
44.61 + 1.59
b
75 35.91 + 0.68
a; A
44.29 + 1.01
a
48.86 + 1.80
a
60.01 + 2.26
a
150 35.97 + 0.77
a; A
44.96 + 1.24
a
50.39 + 1.97
a
57.94 + 2.28
a
300 35.59 + 0.74
b; A
42.93 + 0.94
a
49.09 + 1.15
a
54.71 + 2.00
a
U
0 31.72 + 0.76
b; A
37.88 + 1.41
b
42.67 + 2.16
b
48.01 + 2.50
c
75 35.69 + 0.44
a; A
45.62 + 1.15
a
51.15 + 2.17
a
64.14 + 1.54
a
150 33.72 + 0.51
ab; B
43.15 + 1.02
a
49.49 + 1.71
ab
58.04 + 1.84
ab
300 33.62 + 0.66
ab; A
42.32 + 0.60
a
47.85 + 0.88
ab
55.94 + 1.41
b
2-way
ANOVA
Statistics
I/U F= 10.4510
d.f.= 1
P= 0.0019
F= 0.2786
d.f.= 1
P= 0.5993
F= 0.0423
d.f.= 1
P= 0.8376
F= 2.5514
d.f.= 1
P= 0.1146
ppm F= 8.4483
d.f.= 3
P= <0.001
F= 16.2349
d.f.= 3
P= <0.0001
F= 9.5804
d.f.= 3
P= <0.0001
F= 23.2203
d.f.= 3
P= <0.0001
I/U*
ppm
F= 0.9155
d.f.= 3
P= 0.4379
F= 0.7436
d.f.= 3
P= 0.5296
F= 0.4717
d.f.= 3
P= 0.7029
F= 0.4553
d.f.= 3
P= 0.7143
Error d.f.= 72 d.f.= 72 d.f.= 65 d.f.= 70
I/U= Infestation status; ppm= nitrogen fertilization levels; I/U*ppm= interaction between I/U and ppm.
Data were analyzed with 2-way ANOVA at α = 0.05. Means were separated by Tukey’s HSD. Means
within an infestation level followed by the same lower-case letters are not significantly different among the
nitrogen levels. Means within a nitrogen level followed by the same upper-case letters are not significantly
different between the infestation levels.

pg. 36
Table 3.5 Weeks 5, 6, 7 and 9: Numbers of fully expanded leaves of infested (I) and uninfested
(U) basil plants grown in the greenhouse and fertilized with different nitrogen levels. Results are
shown as means ± SEM.
Infested /
Uninfested
ppm
level
Week
5 6* 7 9
I
0 20.80 +
0.59
b
21.00+ 0.62
b
20.11+ 0.51
b; A
17.00+ 0.82
75 21.90+
0.84
ab
24.00+ 0.73
ab
23.50+ 1.05
ab; A
20.60+ 1.21
150 23.30+
0.79
ab
23.90+ 1.48
ab
24.30+ 1.48
ab; A
20.50+ 1.55
300 23.80+
0.36
a
25.90+ 0.55
a
26.00+ 1.03
a; A
19.90+ 0.67
U
0 19.80+
0.95
b
18.60+ 1.44
b
18.00+ 1.26
b; A
17.22+ 0.97
75 21.00+
0.91
ab
22.70+ 1.08
ab
21.67+ 1.34
ab; A
19.50+ 0.79
150 22.80+
0.51
a
22.30+ 1.10
ab
20.78+ 1.0
ab; A
18.20+ 1.63
300 22.30+
0.62
ab
24.30+ 0.68
a
22.88+ 0.79
a; B
18.22+ 1.49
2-way
ANOVA
Statistics
I/U F= 3.6455
d.f.= 1
P= 0.0602
F= 5.7400
d.f.= 1
P= 0.0192
F= 11.0857
d.f.= 1
P= 0.0014
F= 2.0671
d.f.= 1
P= 0.1550
ppm F= 6.8924
d.f.= 3
P= 0.0004
F= 9.4372
d.f.= 3
P= <0.0001
F= 7.9392
d.f.= 3
P= 0.0001
F= 2.2013
d.f.= 3
P= 0.0955
I/U*pp
m
F= 0.1622
d.f.= 3
P= 0.9215
F= 0.1073
d.f.= 3
P= 0.9556
F= 0.2584
d.f.= 3
P= 0.8551
F= 0.4025
d.f.= 3
P= 0.7517
Error d.f.= 72 d.f.= 72 d.f.= 65 d.f.= 70 U/I= Infestation status; ppm= nitrogen fertilization levels; I/U*ppm= interaction between I/U and ppm.
Data were analyzed with 2-way ANOVA at α = 0.05. Means were separated by Tukey’s HSD. Means
within an infestation level followed by the same lower-case are not significantly different among the
nitrogen levels. Means within a nitrogen level followed by the same upper-case letters are not significantly
different between the infestation levels. *Mean separations for Week 6 showed no significant differences in
numbers of fully expanded leaves between infested and uninfested plants receiving the same nitrogen
fertilization levels, but there was a significant difference between infested and uninfested plant means when
numbers of fully expanded leaves were averaged over all nitrogen levels (Infested: 23.70 ± 0.52,
Uninfested: 21.98 ± 0.63).

pg. 37
Table 3.6 Weeks 5, 6, 7 and 9: Numbers of branches of infested (I) and uninfested (U) basil
plants grown in the greenhouse and fertilized with different nitrogen levels. Results are shown as
means ± SEM.
Infested /
Uninfested
ppm
level
Week
5 6 7 9
I
0 3.20 + 0.71
b; A
6.80 + 1.69
b; A
4.33 + 1.28
b
5.90 + 1.20
b; A
75 7.90 + 0.75
a; A
16.70 + 0.91
a; A
15.70 + 1.98
a
18.40 +
1.27
a; A
150 8.90 + 0.77
a; A
17.10 + 1.09
a; A
16.50 + 0.95
a
18.50 +
1.31
a; A
300 10.60 + 1.10
a; A
16.50 + 1.11
a; A
14.60 + 1.45
a
19.50 +
0.98
a; A
U
0 1.50 + 0.58
b; A
2.40 + 0.87
c; B
2.50 + 0.86
c
4.00 + 1.51
b; A
75 6.70 + 1.02
a; A
9.90 + 1.05
b; B
11.90 + 1.50
b
14.30 +
1.13
a; B
150 4.90 + 1.02
ab; B
10.00 + 1.33
ab; B
14.00 + 0.96
ab
13.80 +
1.75
a; B
300 8.50+ 1.31
a; A
14.30+ 1.26
a; A
17.20+ 1.03
a
16.70+
1.17
a; A
2-way
ANOVA
Statistics
I/U F= 11.5751
d.f.= 1
P= 0.0011
F= 37.2086
d.f.= 1
P= <0.0001
F= 2.2279
d.f.= 1
P= 0.1400
F= 13.3126
d.f.= 1
P= 0.0005
ppm F= 20.8238
d.f.= 3
P= <0.0001
F= 33.0933
d.f.= 3
P= <0.0001
F= 39.1462
d.f.= 3
P= <0.0001
F= 42.3888
d.f.= 3
P= <0.0001
I/U* ppm F= 0.8555
d.f.= 3
P= 0.4682
F= 1.8637
d.f.= 3
P= 0.1434
F= 2.3013
d.f.= 3
P= 0.0847
F= 0.4663
d.f.= 3
P= 0.7067
Error d.f.= 72 d.f.= 72 d.f.= 65 d.f.= 70 U/I= Infestation status; ppm= nitrogen fertilization levels; I/U*ppm= interaction between I/U and ppm.
Data were analyzed with 2-way ANOVA at α = 0.05. Means were separated by Tukey’s HSD. Means
within an infestation level followed by the same lower-case are not significantly different among the
nitrogen levels. Means within a nitrogen level followed by the same upper-case letters are not significantly
different between the infestation levels.

pg. 38
Table 3.7 Weeks 5, 6, 7 and 9: Stem widths (cm) of infested (I) and uninfested (U) basil plants
grown in the greenhouse and fertilized with different nitrogen levels. Results are shown as means
± SEM.
Infested /
Uninfested
ppm level Week
5 6 7 9
I
0 0.35+ 0.02 0.40+ 0.02
b
0.39+ 0.02
b
0.40+ 0.02
b; A
75 0.37+ 0.01 0.42+ 0.01
ab
0.42+ 0.01
ab
0.48+ 0.01
a; A
150 0.40+ 0.02 0.44+ 0.02
ab
0.45+ 0.02
a
0.50+ 0.01
a; A
300 0.40+ 0.02 0.46+ 0.01
a
0.46+ 0.01
a
0.54+ 0.02
a; A
U
0 0.38+ 0.02 0.38+ 0.02
b
0.40+ 0.02
a
0.40+ 0.01
a; A
75 0.37+ 0.02 0.40+ 0.02
ab
0.41+ 0.01
a
0.41+ 0.02
a; B
150 0.39+ 0.02 0.44+ 0.01
ab
0.43+ 0.01
a
0.45+ 0.01
a; B
300 0.39+ 0.02 0.45+ 0.02
a
0.44+ 0.01
a
0.46+ 0.02
a; B
2-way ANOVA
Statistics
I/U F= 0.0203
d.f.= 1
P= 0.8871
F= 0.7679
d.f.= 1
P= 0.3838
F= 0.6796
d.f.= 1
P= 0.4126
F= 20.9032
d.f.= 1
P=
<0.0001
ppm F= 1.1580
d.f.= 3
P= 0.3318
F= 6.6655
d.f.= 3
P= 0.0005
F= 6.3627
d.f.= 3
P= 0.0007
F= 16.7419
d.f.= 3
P=
<0.0001
I/U*ppm F= 0.5079
d.f.= 3
P= 0.6781
F= 0.1126
d.f.= 3
P= 0.9525
F= 0.3332
d.f.= 3
P= 0.8013
F= 3.5806
d.f.= 3
P= 0.0179
Error d.f.= 72 d.f.= 72 d.f.= 65 d.f.= 70
U/I= Infestation status; ppm= nitrogen fertilization levels; I/U*ppm= interaction between I/U and ppm.
Data were analyzed with 2-way ANOVA at α = 0.05. Means were separated by Tukey’s HSD. Means
within an infestation level followed by the same lower-case are not significantly different among the
nitrogen levels. Means within a nitrogen level followed by the same upper-case letters are not significantly
different between the infestation levels.

pg. 39
3.4 Post-Infestation Plant Parameters at Harvest
Canopy fresh and dry weights of unfertilized plants were significantly lower than
those of fertilized plants regardless of the infestation status (Table 3.8). Unfertilized,
infested plants were on average 13.88 g in canopy fresh weight whereas unfertilized,
uninfested plants were 13.61 g. Infested and uninfested plants fertilized with 75, 150 or
300 ppm N were above 25 g in canopy fresh weight. The same pattern was seen in
canopy dry weight measurements, where 0 ppm N treated plants had the lowest dry
weights. Plants of the 75, 150, and 300 ppm N levels had the highest canopy dry weights
with the averages being 5.66 g and 5.13 g for infested and uninfested plants, respectively.
Canopy fresh weights of infested, 75-ppm N-fertilized plants were 5.43 g greater than the
fresh weights of their uninfested counterparts. Infested plants given 150 ppm N had the
highest weight of fallen leaves (0.26 g) than did plants at the other nitrogen levels (0 ppm
N: 0.11 g, 75 ppm N: 0.10 g and 300 ppm N: 0.24 g), whereas uninfested plants did not
differ significantly in the total weights of fallen leaves across ppm N levels. Leaves from
plants fertilized with 300 ppm N had greater surface area than did leaves from other ppm
N levels at both middle and top plant height regions. A significant difference in leaf
surface areas between infested and uninfested 75 ppm N plants was found for leaves at
the middle plant height region, where infested leaves had the greater leaf surface area
(15.99 cm2) than uninfested leaves (11.77 cm2).
Unfertilized plants’ (fresh and dry) roots weighed less than those at the other N
levels regardless of infestation status (Table 3.9). Plants given 300 ppm N had the
highest fresh root weights (Infested: 16.71 g, Uninfested: 12.32 g). Root fresh weights of

pg. 40
infested plants fertilized at 75 and 150 ppm N (75 ppm N: 13.94 g, 150 ppm N: 14.73 g)
did not differ significantly from those fertilized at 0 or 300 ppm N (0 ppm N: 9.59 g, 300
ppm N: 16.71 g). The same pattern was seen in root dry weights of infested plants, with
unfertilized plants having the lowest dry root weight (0.82 g) than the other ppm N levels
(75 ppm N: 1.46 g, 150 ppm N: 1.71 g and 300 ppm N: 2.40 g). Uninfested plants
fertilized at 75 ppm N had significantly longer root lengths (23.24 cm) than those
fertilized at 150 or 300 ppm N (150 ppm N: 17.59 cm, 300 ppm N: 17.27 cm). The roots
of uninfested, unfertilized plants were significantly longer (22.67 cm) than those from the
300 ppm N level, but were not significantly longer than 75 and 150 ppm N plants.
Infested plants showed no significant differences in terms of root lengths across nitrogen
levels, although unfertilized plants had the longest roots (22.23 cm) of all nitrogen levels
(75 ppm N: 20.32 cm, 150 ppm N: 19.49 cm and 300 ppm N: 18.54 cm).

pg. 41
Table 3.8 August 17, 2014: Canopy weights (g), fallen leaves weights (g) and leaf surface area
measurements (cm2) of infested (I) and uninfested (U) basil plants grown in the greenhouse and
fertilized with different nitrogen levels. Results are shown as means ± SEM.
Infested /
Uninfested
ppm
level
Canopy
Weight (g)
Fresh
Canopy
Weight (g)
Dry
Fallen
Leaves
Weight (g)
Dry
Leaf Surface
Area (cm2) –
Middle
Region
Leaf Surface
Area (cm2) –
Top Region
I
0 13.88 + 1.53
b; A
2.70 + 0.28
b
0.11 + 0.02
b
16.31 + 1.89
A
8.82 + 0.99
b
75 31.85 + 1.23
a; A
5.62 + 0.33
a
0.10 + 0.01
b
15.99 + 0.87
A
12.27 + 0.31
ab
150 31.50 + 2.17
a; A
5.61 + 0.45
a
0.26 + 0.06
a
14.61 + 1.23
A
11.65 + 1.48
ab
300 36.66 + 2.47
a; A
5.75 + 0.49
a
0.24 + 0.03
ab
17.10 + 0.56
A
13.89 + 1.50
a
U
0 13.61 + 3.97
c; A
2.95 + 0.73
b
0.10 + 0.01
a
11.39 + 1.63
A
8.25 + 1.57
a
75 26.42 + 0.85
b; B
5.10 + 0.28
a
0.11 + 0.02
a
11.77 + 1.60
B
11.04 + 0.61
a
150 25.42 + 1.53
b; A
4.52 + 0.37
a
0.17 + 0.04
a
14.83 + 1.03
A
12.58 + 0.39
a
300 35.18 + 1.74
a; A
5.78 + 0.28
a
0.18 + 0.03
a
16.72 + 1.42
A
11.54 + 1.58
a
2-way
ANOVA
Statistics
I/U F= 4.8212
d.f.= 1
P= 0.0355
F= 1.2102
d.f.= 1
P= 0.2795
F= 3.2967
d.f.= 1
P= 0.0791
F= 5.8824
d.f.= 1
P= 0.0213
F= 0.9722
d.f.= 1
P= 0.3318
ppm F= 38.3050
d.f.= 3
P= <0.0001
F= 19.2386
d.f.= 3
P= <0.0001
F= 8.9598
d.f.= 3
P= 0.0002
F= 2.3228
d.f.= 3
P= 0.0943
F= 5.2875
d.f.= 3
P= 0.0046
I/U*pp
m
F= 0.9058
d.f.= 3
P= 0.4491
F= 1.0087
d.f.= 3
P= 0.4016
F= 1.2406
d.f.= 3
P= 0.3118
F= 1.8583
d.f.= 3
P= 0.1573
F= 0.6977
d.f.= 3
P= 0.5605
Error d.f.= 32 d.f.= 32 d.f.= 31 d.f.= 31 d.f.= 31
U/I= Infestation status; ppm= nitrogen fertilization levels; I/U*ppm= interaction between I/U and ppm.
Data were analyzed with 2-way ANOVA at α = 0.05. Means were separated by Tukey’s HSD. Means
within an infestation level followed by the same lower-case are not significantly different among the
nitrogen levels. Means within a nitrogen level followed by the same upper-case letters are not significantly
different between the infestation levels.

pg. 42
Table 3.9 August 17, 2014: Root weights (g) and root lengths (cm) of infested (I) and uninfested
(U) basil plants grown in the greenhouse and fertilized with different nitrogen levels. Results are
shown as means ± SEM.
Infested /
Uninfested
ppm
level
Root Weight
(g) Fresh
Root Weight
(g) Dry
Root Length
(cm)
I
0 9.59 + 0.72
b
0.82 + 0.08
b
22.23 + 2.17
a
75 13.94 + 1.62
ab
1.46 + 0.25
ab
20.32 + 1.04
a
150 14.73 + 1.47
ab
1.71 + 0.23
ab
19.49 + 1.73
a
300 16.71 + 2.02
a
2.40 + 0.65
a
18.54 + 1.23
a
U
0 7.32 + 0.66
b
0.75+ 0.064
b
22.67 + 1.80
ab
75 14.74 + 0.74
a
1.48 + 0.08
a
23.24 + 2.42
a
150 12.01 + 2.19
a
1.13 + 0.22
ab
17.59 + 1.09
bc
300 12.32 + 1.75
a
1.48 + 0.29
a
17.27 + 1.30
c
2-way
ANOVA
Statistics
I/U F= 4.0485
d.f.= 1
P= 0.0527
F= 3.5615
d.f.= 1
P= 0.0682
F= 0.0016
d.f.= 1
P= 0.9680
ppm F= 7.1744
d.f.= 3
P= 0.0008
F= 5.2613
d.f.= 3
P= 0.0046
F= 3.7307
d.f.= 3
P= 0.0209
I/U* ppm F= 1.0332
d.f.= 3
P= 0.3910
F= 1.1487
d.f.= 3
P= 0.3445
F= 0.8374
d.f.= 3
P= 0.4834
Error d.f.= 32 d.f.= 32 d.f.= 32 U/I= Infestation status; ppm= nitrogen fertilization levels; I/U*ppm= interaction between I/U and ppm.
Data were analyzed with 2-way ANOVA at α = 0.05. Means were separated by Tukey’s HSD. Means
within an infestation level followed by the same lower-case are not significantly different among the
nitrogen levels. Means within a nitrogen level followed by the same upper-case letters are not significantly
different between the infestation levels.

pg. 43
3.5 Post-Infestation Plant Tissue %N and %C, Protein Contents and Lipid Absorbance
Values by Infestation Status and Nitrogen Fertilization Level
Leaves from the 300 ppm N level had significantly higher %N (Infested: 3.04 %N
+/- 0.17 and Uninfested: 3.15 %N +/- 0.46) than those of other treatment levels regardless
of infestation status (Infested: F3, 8= 79.339, P= <0.0001, Uninfested: F3, 8= 23.658, P=
0.0002) (Figures 3.1 A and C). Unfertilized plants had the lowest leaf %N with 0.64 %N
(+/- 0.01) for infested plants’ leaves and 0.65 %N (+/- 0.01) for uninfested plants’ leaves.
Stem %N follows a similar pattern, with 300 ppm N plants’ stems having significantly
greater %N (Infested: 2.84 %N +/- 0.35 and Uninfested: 3.97 %N +/- 0.09) than those
from the 0 (Infested: 0.22 %N +/- 0.01 and Uninfested: 0.23 %N +/- 0.02) and 75
(Infested: 0.54 %N +/- 0.08 and Uninfested: 0.48 %N +/- 0.17) ppm N levels (Infested:
F3, 8= 45.930, P: <0.0001, Uninfested: F3, 8= 234.620, P= <0.0001). Infested plant leaves
also had significantly different %C values across fertilization levels (F3, 8= 5.444, P=
0.0247) where 75 and 0 ppm N leaves had the highest %C (75 ppm N: 39.76 %C +/- 0.33
and 0 ppm N: 39.65 %C +/- 0.12) and 300 and 150 ppm N had the lowest %C (300 ppm
N: 39.31 %C +/- 0.24 and 150 ppm N: 38.63 %C +/- 0.09) (Figure 3.1 D). Infested plant
stems at the 300 ppm N level (43.06 %C) had more %C than uninfested plant stems at the
300 ppm N level (42.14 %C; F1, 4= 10.563, P= 0.0314) (Figure 3.1 B). Uninfested plant
stems had significantly different %C values across nitrogen levels (F3, 8= 6.328, P=
0.0166), with 75 ppm N plant stems having the highest %C (43.63 %C +/- 0.12) and 300
ppm N stems having the lowest %C (42.14 %C +/- 0.22).

pg. 44
The average lipid absorbance value for uninfested, top region leaves of 300 ppm
N plants was 0.19 (+/- 0.01), which was significantly higher than the lipid absorbance
values of leaves from 0 (0.14 +/- 0.01) and 150 (0.14 +/- 0.01) ppm N plants (F3,8= 6.704,
P=0.014) (Figure 3.5). Leaves from the top region of 75 ppm N plants had a value of
0.16 for lipid absorbance (+/- 0.01). Infested leaves did not show the same pattern in
lipid absorbance values as uninfested leaves (Figure 3.6). On average, stems of infested
and uninfested plants from the middle plant height region had values of 0.16 +/- 0.01 and
0.12 +/- 0.01, respectively. The average lipid absorbance values for top region stems
were less (infested: 0.12 +/- 0.01 and uninfested: 0.10 +/- 0.00) than those for the middle
regions. Significant differences in infested and uninfested plant tissue lipid absorbance
values were observed for top region leaves of 0 ppm N plants (F1, 4= 10.5310, P=
0.0315), where infested plant leaves had significantly higher lipid absorbance (0.19 +/-
0.01) than did uninfested plant leaves (0.14 +/- 0.01). Top region leaves of infested, 150
ppm N were significantly higher (F1, 4= 40.97, P= 0.0031) in lipid absorbance (0.18 +/-
0.00) than leaves of uninfested plants (0.14 +/- 0.01) of the same region and nitrogen
level. For stem tissue, only top region stems from infested, 150 ppm N plants had
significantly higher lipid absorbance (0.12 +/- 0.00) than stems from uninfested, 150 ppm
N plants (0.10 +/- 0.01) of the same region.
Only middle region stems of uninfested plants were determined to have
significant differences in protein contents across plant nitrogen fertilization levels (F3, 8=
5.5568, P= 0.0234) (Figure 3.7). Middle stems from uninfested plants fertilized with 150
and 300 ppm N had significantly higher protein contents (0.13 mg/ml +/- 0.02 and 0.14

pg. 45
mg/ml +/- 0.02, respectively) than middle stems from plants fertilized with 0 and 75 ppm
N (0.06 mg/ml +/- 0.02 and 0.06 mg/ml, respectively). Stems of infested, 300 ppm N
plants contained more total protein (above 0.10 mg/ml) than stems from infested 0, 75 or
150 ppm N plants (below 0.08 mg/ml) in both the middle (F3,8= 5.509, P= 0.0240) and
top (F3,8= 6.576, P= 0.0150) plant height regions. No significant differences in protein
contents were found between infested and uninfested plants of the same tissues types and
nitrogen fertilization levels. However, leaves tended to have higher protein contents than
stems at both plant height regions for infested and uninfested plants. Leaves of
uninfested plants had protein contents of above 0.30 mg/ml, and infested plant leaves had
above 0.15 mg/ml total protein across the four nitrogen levels.
Figures 3.1 A-D: %N and %C of plant leaves and stem sections of infested and uninfested basil
plants grown in the greenhouse with different nitrogen treatment ppm levels: A) %N of leaves
and stems of uninfested plants across ppm levels, B) %C of leaves and stems of uninfested plants
across ppm levels, C) %N of leaves and stems of infested plants across ppm levels, D) %C of
leaves and stems of infested plants across ppm levels. Bars topped with the same upper-case
letters are not significantly different from one another. Error bars indicating standard errors are
shown.
A

pg. 46
B
C

pg. 47
Figure 3.2 Lipid absorbance values of uninfested basil plant leaves and stems across nitrogen
treatment ppm levels and plant height regions. Bars topped with the same upper-case letters are
not significantly different from one another. Error bars indicating standard errors are shown.
D

pg. 48
Figure 3.3 Lipid absorbance values of infested basil plant leaves and stems across nitrogen
treatment ppm levels and plant height regions. Error bars indicating standard errors are shown.
Figure 3.4 Protein mg/ml of uninfested basil plant leaves and stems across nitrogen treatment
ppm levels and plant height regions. Bars topped with the same upper-case letters are not
significantly different from one another. The Student’s t-test was used to determine which
nitrogen levels differed from each other. Error bars indicating standard errors are shown.

pg. 49
Figure 3.5 Protein mg/ml of infested basil plant leaves and stems across nitrogen treatment ppm
levels and plant height regions. Bars topped with the same upper-case letters are not significantly
different from one another. Error bars indicating standard errors are shown.
3.6 Madeira Mealybug Development, Surviving Individuals, and Mortality
No significant differences in the duration of development from egg to adulthood
were found for male or female mealybugs (Table 3.10). Males, on average, took nearly
1.5 days longer to reach adulthood than did females. Longevity of adult females after
onset of egg production did not differ significantly across plant nitrogen levels; however,
females from the 75 and 150 ppm N treatments tended to live longer (7.2 and 7.4 days,
respectively) than those from 0 and 300 ppm N plants (5.8 and 5.9 days, respectively).
Overall, total development time to adulthood occurred in less than 26 days for both sexes.
On average, females from the 0 ppm treatment produced significantly fewer eggs (136.6
eggs) than those from the 75 and 150 ppm treatments (334.3 and 330.1 eggs,

pg. 50
respectively), but did not differ significantly from the numbers of eggs produced by
females at the 300 ppm N host-plant treatment level (229.1 eggs).
The numbers of mealybugs decreased at each developmental stadium, as did the
proportions of survivors for each plant nitrogen level (Table 3.11). On average, nearly 7
female mealybugs (+/- 0.74) and roughly 1 male mealybug (+/- 0.19) survived to
adulthood for each plant nitrogen level, making the percentage surviving to adulthood
17.5% and 2.5% for females and males, respectively. The mortality of eggs for each
plant nitrogen level was over 50%, and for crawlers (first instars) was 40% and above.

pg. 51
Table 3.10: Madeira mealybug developmental times, reproductive longevity and fecundity across
the four host-plant nitrogen levels. Results are shown as means ± SEM.
Life History
Parameter
Developmental
Stadium
Nitrogen Level (ppm) ANOVA
Statistics 0 75 150 300
Developmental
time (days +
SEM)
Egg to First
Instars
7.4 +
0.25
7.4 +
0.15
6.9 + 0.34 7.3 + 0.17 F3, 36=
1.0773
P= 0.3709
First to Second
Instars
4.7 +
0.87
4.0 +
0.29
3.8 + 0.49 3.9 + 0.70 F3, 33=
0.4653
P= 0.7084
Second to Third
Instar Females
8.2 +
0.98
7.4 +
0.90
9.0 + 0.76 7.7 + 0.95 F3, 29=
0.5024
P= 0.6836
Second to Third
and Fourth Instar
Males
7.5 +
0.99
7.8 +
0.44
8.0 + 0.83 8.7 + 1.43 F3, 26=
0.2735
P= 0.8439
Third/Fourth
Instar to Adult
Males
5.4 +
0.93
5.8 +
0.77
6.5 + 0.39 4.4 + 1.04 F3, 25=
1.1364
P= 0.3535
Third Instar to
Adult Females
4.5 +
0.68
5.4 +
1.58
2.4 + 0.92 4.6 + 0.63 F3, 30=
1.2528
P= 0.3082
Developmental
Time from Egg to
Adulthood (days
+ SEM)
Adult Males 24.7 +
1.22
24.9 +
0.67
25.0 +
0.39
24.5 +
1.42
F3, 25=
0.0550
P= 0.9826
Adult Females 25.0 +
1.18
22.3 +
0.56
22.0 +
0.84
23.6 +
0.45
F3, 30=
2.9037
P= 0.0510
Female
Reproductive
Longevity (days
+ SEM)
Adult Females 5.8 +
0.95
7.2 +
0.49
7.4 + 0.62 5.9 + 0.57 F3, 36=
1.5333
P= 0.2225
Fecundity
(Average # Eggs /
Adult) (number of
eggs + SEM)
Adult Female 136.6 +
37.44
b
344.3 +
39.31
a
330.1 +
60.53
a
229.1 +
33.21
a,b
F3, 36=
4.8751
P= 0.0060
Significant differences among nitrogen levels are indicated by lower-case letters (a, b, c, etc.).

pg. 52
Table 3.11: Madeira mealybug tally of individuals per developmental stadium, proportion of
individuals surviving at each stadia and mortality rate across host-plant nitrogen fertilization
levels. Results are shown as means ± SEM.
Population
Parameter
Developmental
Stadium
Nitrogen Level (ppm) ANOVA
Statistics
0 75 150 300
x (mean +
SEM)
Eggs 40 40 40 40
1st Instars 14.5 +
2.41
18.0 +
2.01
11.6 +
2.40
17.1 +
2.58
F3, 36=
1.4917
P= 0.2332
2nd Instars 7.9 + 2.08 7.8 + 0.96 6.6 +
1.49
6.2 + 1.61 F3, 36=
0.2896
P= 0.8326
3rd Instar Females 3.0 + 0.56 2.0 + 0.37 2.4 +
0.65
2.0 + 0.47 F3, 36=
0.8171
P= 0.4929
Male Tests 1.7 + 0.52 2.1 + 0.35 1.6 +
0.45
2.3 + 0.67 F3, 36=
0.4203
P= 0.7395
Adult Females 7.0 + 1.64 7.5 + 1.25 5.0 +
1.42
6.6 + 1.69 F3, 36=
0.5127
P= 0.6761
Adult Males 1.1 + 0.46 1.4 + 0.27 1.2 +
0.36
1.7 + 0.45 F3, 36=
0.4582
P= 0.7132
lx
(Proportion
of
Individuals
Surviving per
stadia +
SEM)
Eggs 1.000 1.000 1.000 1.000
1st Instars 0.36 +
0.06
0.45 +
0.05
0.29 +
0.06
0.43 +
0.06
F3, 36=
1.4917
P= 0.2332
2nd Instars 0.20 +
0.05
0.20 +
0.02
0.17 +
0.04
0.16 +
0.04
F3, 36=
0.2896
P= 0.8326
3rd Instar Females 0.08 +
0.01
0.05 +
0.01
0.06 +
0.02
0.05 +
0.01
F3, 36=
0.8171
P= 0.4929
Male Tests 0.04 +
0.01
0.05 +
0.01
0.04 +
0.01
0.06 +
0.02
F3, 36=
0.4203
P= 0.7395
Adult Females
0.18 +
0.04
0.19 +
0.03
0.13 +
0.04
0.17 +
0.04
F3, 36=
0.5127
P= 0.6761

pg. 53
Adult Males 0.03 +
0.01
0.04 +
0.01
0.03 +
0.01
0.04 +
0.01
F3, 36=
0.4582
P= 0.7132
qx (Mortality
Rate per
stadia +
SEM)
Eggs 0.64 +
0.06
0.55 +
0.05
0.71 +
0.06
0.57 +
0.06
F3, 36=
1.4917
P: 0.2332
1st Instars 0.53 +
0.09
0.52 +
0.07
0.40 +
0.19
0.64 +
0.06
F3, 36=
0.6641
P= 0.5796
2nd Instar Males
0.70 +
0.10
0.68 +
0.07
0.61 +
0.12
0.28 +
0.48
F3, 36=
0.5949
P= 0.6225
2nd Instar Females 0.26 +
0.27
0.74 +
0.05
0.52 +
0.11
0.47 +
0.28
F3, 36=
0.9618
P= 0.4213
3rd Instar Females -1.12 +
0.24
ab
-2.60 +
0.49
b
-0.77 +
0.25
a
-1.89 +
0.50
ab
F3, 36=
4.4161
P= 0.0096
Male Tests 0.25 +
0.13
0.23 +
0.10
0.13 +
0.09
0.14 +
0.06
F3, 36=
0.4274
P= 0.7345
Significant differences among nitrogen levels are indicated by lower-case letters (a, b, c, etc.).
3.7 Madeira Mealybug Population Parameters
Fecundity (mx) data showed a significant difference in the numbers of eggs
produced by females reared on differing plant nitrogen levels, with females from 75 and
150 ppm N plants producing the most eggs. The generation time of adult females reared
on unfertilized plants was nearly 3 days longer than the generation times of females from
other plant ppm N levels. Females reared on 75 ppm N plants had the shortest generation
time (28.9 days). Net reproductive rates, intrinsic rates of increase and finite rates of
increase did not differ significantly across plant nitrogen levels; however, mealybugs
from the 75 ppm N plant treatment tended to have the highest rates for all traits.

pg. 54
Table 3.12: Madeira mealybug gross reproductive rates (mx), net reproductive rate (Ro),
generation time (GT), rate of intrinsic increase (rm), and finite rate of increase (λ) from the four
host-plant nitrogen levels. Results are shown as means ± SEM.
Population
Parameters
Developmental
Stadium
Nitrogen Level (ppm)
Kruskal-Wallis
Statistics
0 75 150 300
mx
(Total
Average #
of Eggs per
Adult
Female+
SEM)
Adult Females 136.6
+
37.44
b
344.3
+
39.31
a
330.1
+
60.53
a
229.1
+
33.21
ab
Χ2= 10.5858
df: 3
P= 0.0142
Ro
(Average
Number of
Offspring
Produced
per Female
Surviving
into
adulthood)
+ SEM)
Adult Females 25.36
+ 8.75
71.22
+
17.21
57.60
+
24.67
35.04
+
10.79
Χ2= 4.8750
df: 3
P= 0.1812
GT (days +
SEM)
Adult Females 32.3 +
0.65
a
28.9 +
0.95
b
29.8 +
1.08
ab
29.4 +
0.54
ab
Χ2= 9.5839
df: 3
P= 0.0225
rm
(Maximum
Population
Growth
Rate per
Adult
Female +
SEM)
0.08 +
0.01
0.14 +
0.01
0.13 +
0.02
0.11 +
0.02
Χ2= 6.2062
df: 3
P= 0.1020
λ (number
of times
females
reproduce
during adult
stadia +
SEM)
1.09 +
0.02
1.15 +
0.01
1.14 +
0.02
1.12 +
0.02
Χ2= 6.2062
df: 3
P= 0.1020
Significant differences among nitrogen levels are indicated by lower-case letters (a, b, c, etc.).

pg. 55
3.8 Mealybug Protein Contents and Lipid Absorbance Values
No significant difference was found in adult female lipid absorbance values
across plant nitrogen levels (F3, 16= 2.6564, P= 0.0837), where the average female
mealybug total lipid absorbance value was 0.13 (Figure 3.9 A). Adult females reared on
0 ppm N plants exhibited lower lipid absorbance values (0.11 +/- 0.01) than did females
from the other plant N levels (75 ppm N: 0.12 lipid absorbance +/- 0.01, 150 ppm N: 0.13
lipid absorbance +/- 0.00, 300 ppm N: 0.14 lipid absorbance +/- 0.01). Females from 0
ppm N plants had significantly higher total protein (0.19 mg/ml +/- 0.04) than did females
reared on the other three ppm N levels (F3, 16= 3.7686, P= 0.0321, comparison and
separation of means by Student’s t-test).
No significant differences were found in lipid absorbance values for egg samples
produced by females raised on the four plant nitrogen levels (F3, 8= 0.2237, P= 0.8773).
However, eggs from females raised on 0 ppm N plants had significantly lower protein
content (0.12 mg/ml +/- 0.02). Females reared on plants fertilized with the 300 ppm N
produced eggs with the highest protein content (0.34 mg/ml +/- 0.07) (F3, 16= 4.1155, P=
0.0242).
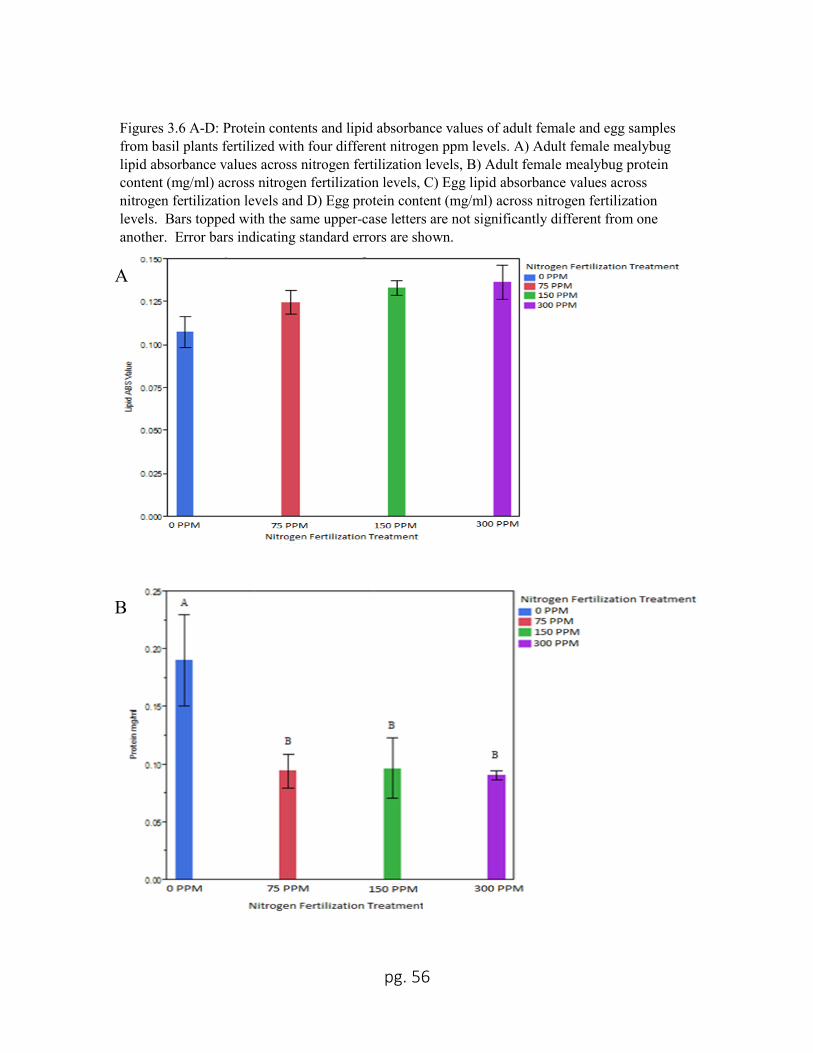
pg. 56
Figures 3.6 A-D: Protein contents and lipid absorbance values of adult female and egg samples
from basil plants fertilized with four different nitrogen ppm levels. A) Adult female mealybug
lipid absorbance values across nitrogen fertilization levels, B) Adult female mealybug protein
content (mg/ml) across nitrogen fertilization levels, C) Egg lipid absorbance values across
nitrogen fertilization levels and D) Egg protein content (mg/ml) across nitrogen fertilization
levels. Bars topped with the same upper-case letters are not significantly different from one
another. Error bars indicating standard errors are shown.
A
B

pg. 57
C
D

pg. 58
3.9 Correlations: Plant Protein/Lipid vs. %N /%C, Plant Protein/Lipid vs. Insect and Egg
Protein/Lipid, and Female Mealybug Protein/Lipid vs. Egg Protein/Lipid
Overall, plant leaves did not exhibit significant correlations between %N and total
protein contents across nitrogen levels (Figure 3.7 A). Pearson correlations of stem %N
and protein contents of infested (Pearson correlation coefficient: 0.642, p: 0.0250) and
uninfested (Pearson correlation coefficient: 0.855, p: 0.0004) plants showed slightly
linear and sigmoidal correlations, respectively. When analyzed within nitrogen level,
significant positive correlations were found between plant tissue %N and protein contents
for 75 ppm N, infested plant leaves (Pearson correlation coefficient= 0.9990, P=0.0282)
and 150 ppm N, uninfested stems (Pearson correlation coefficient= 1.0000, P=0.0013).
No significant correlations were determined between %C and lipid absorbance for
infested and uninfested plant tissues across nitrogen levels (Figure 3.7 B). When
analyzed within nitrogen level, only 0 ppm N infested plant stems showed a significant,
positive correlation between stem %C and lipid absorbance (Pearson correlation
coefficient= 0.9981, P: 0.0388).
No significant correlations were found between plant protein and lipid data versus female
mealybug and egg protein and lipid results (Figures 3.8 A-D). Data points, colored blue
(0 ppm N), red (75 ppm N), green (150 ppm N) and purple (300 ppm N) are scattered,
and no discernable patterns were observed for the data.
Overall, no significant correlation was found between adult female lipid
absorbance values and egg lipid absorbance values across plant nitrogen levels (Pearson

pg. 59
correlation coefficient= -0.2976, P= 0.3473) (Figure 3.9 A). However, within the 0 and
150 ppm N treatments, negative correlations between adult female lipid absorbance and
egg lipid absorbance values were found (0 ppm N: Pearson correlation coefficient= -
0.9980, P= 0.0407, 150 ppm N: Pearson correlation coefficient= -0.9995, P= 0.0196).
After analyzing adult female mealybug protein vs. egg protein across all plant nitrogen
levels, a significant negative correlation was found for the data (Pearson correlation
coefficient= -0.5767, P= 0.0078). The correlation was sigmoidal in shape, and showed
adult female protein content increasing as egg protein content and plant nitrogen level
decreases.

pg. 60
Figures 3.7 A and B: Correlations between %N, %C, protein contents and lipid absorbance values
of plant tissues from the four nitrogen ppm levels of infested and uninfested basil plants grown in
the greenhouse. Figure A) Plant protein mg/ml vs plant %N and Figure B) Plant lipid absorbance
values vs plant %C. Equations and R2 values for each correlation are shown within the graphs.
(“I”= Infested; “U”= Uninfested; “L”= Leaves; “S”= Stem Sections)
A
B
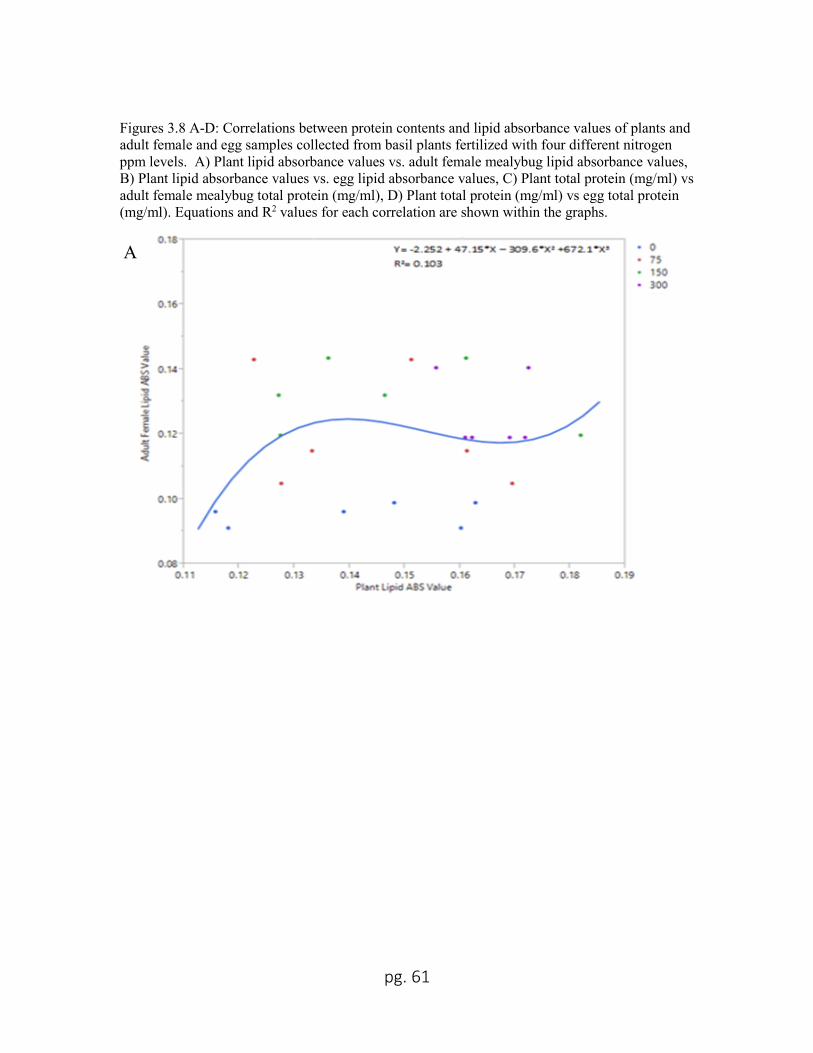
pg. 61
Figures 3.8 A-D: Correlations between protein contents and lipid absorbance values of plants and
adult female and egg samples collected from basil plants fertilized with four different nitrogen
ppm levels. A) Plant lipid absorbance values vs. adult female mealybug lipid absorbance values,
B) Plant lipid absorbance values vs. egg lipid absorbance values, C) Plant total protein (mg/ml) vs
adult female mealybug total protein (mg/ml), D) Plant total protein (mg/ml) vs egg total protein
(mg/ml). Equations and R2 values for each correlation are shown within the graphs.
A

pg. 62
B
C

pg. 63
Figures 3.9 A and B: Correlations between protein contents and lipid absorbance values of adult
female and egg samples collected from basil plants fertilized with four different nitrogen ppm
levels. A) Adult female mealybug lipid absorbance values vs egg lipid absorbance values and B)
Adult female mealybug protein (mg/ml) contents vs egg protein (mg/ml) contents. Equations and
R2 values for each correlation are shown within the graphs.
D
A

pg. 64
B

pg. 65
CHAPTER FOUR
DISCUSSION AND CONCLUSIONS
4.1 Pre-Assignment and Pre-Infestation Plant Measurements
Pre-assignment seedling height, canopy fresh and dry weights, root fresh and dry
weights, and root lengths did not differ statistically among the four randomly selected
groups of plants. These data signify that no one group of seedlings was more advanced
in shoot and root growth before plants were subjected to fertilization treatments. After 2
weeks of fertilization treatments (week 3), pre-infestation plants did not differ statistically
in height, number of fully expanded leaves and stem width. However, by week 5 (post-
infestation), significant differences in height, numbers of leaves and branches did begin
to occur in plants fertilized with different nitrogen concentrations regardless of
infestation status.
4.2 Post-Infestation Plant Measurements
After plants were infested (Weeks 5-9), unfertilized (infested and uninfested)
plants had the shortest canopy, fewer overall expanded leaves, fewer branches and
smaller stem widths than plants fertilized at 75, 150 and 300 ppm N. Unfertilized plants
had the lowest canopy fresh and dry weights, fallen leaves weights, and leaf surface areas
of all nitrogen levels. Plants fertilized at 300 ppm N had the greatest number of fully
expanded leaves and branches, the widest stems, greatest canopy weights (fresh and dry),
largest leaf surface areas, and highest root weights (fresh and dry) than did plants from

pg. 66
other nitrogen levels. These results are similar to findings from past studies. Hosseini et
al. (2010) found that cucumber leaf fresh and dry weights increased with increasing
nitrogen fertilization concentration. Studies by Hogendorp et al. (2006) and Goron et al.
(2015) documented increases in numbers of plant leaves and branches as nitrogen
fertilization level increased.
Plants fertilized at 75 ppm N were the tallest. This result for plant height is
contrary to what was hypothesized, but recent studies have documented similar findings.
Tomato plant (Solanum lycopersicum L., Solanaceae) height decreased with low and high
nitrogen fertilization, but plants were tallest when fertilized with the recommended,
moderate nitrogen fertilization rate (Han et al. 2014). Infestation by the leaf miner, Tuta
absoluta Meyrick (Lepidoptera: Gelechiidae) did not influence plant growth (Han et al.
2014). Zhao et al. (2005) analyzed differences in the heights of sorghum plants
(Sorghum bicolor L., Poaceae) fertilized at 100% N (half-strength Hoagland’s nutrient
solution), 20% N (nutrient solution was 20% of the 100% N solution) and 0% (no
nitrogen solution) 25 days after sowing. The researchers documented that plant height
increased when nitrogen fertilization level increased from 0% to 20%, but not from 20%
to 100%. The researchers reasoned that plants fertilized with high rates of nitrogen may
be allocating extra nitrogen to other processes than growth (Zhao et al. 2005, Masclaux-
Daubresse et al.2010, Sauge et al. 2010, Han et al. 2014).
Infested and uninfested plants fertlilized at 150 and 300 ppm N had the shortest
root lengths when compared to 0 and 75 ppm N plants, which contradicted my
expectations. Many studies have evaluated the effects of nitrogen fertilization on root

pg. 67
development and morphology (van Vuuren et al. 1996, Hodge 2004, Gao et al. 2015).
Honěk (1991) demonstrated that lower nitrogen fertilization levels (0 and 40 kg
N/hectare) produced the greatest root to shoot ratios. Gao et al. (2015) found that low
nitrogen fertilization led to the development of longer axile roots (roots extending
vertically down into the soil), but fewer crown roots (small roots extending out around
the soil surface) and shorter lateral roots (roots extending off of axile roots horizontally)
in maize (Zea mays mays L., Poaceae). The general consensus is that roots grow longer
at lower nitrogen fertilization levels because the plant is using root growth as a way of
“searching” out and tapping into nutrient-rich sections in the soil (Forde and Lorenzo
2001, Hodge 2004). Lower nitrogen fertilization rates produce longer plant roots even in
potted plants as documented in past studies and in my study (McIntyre and Raju 1967,
Liljeroth et al. 1990)
The leaves and stems from infested and uninfested plants showed a trend of
increasing %N as the nitrogen fertilization concentrations increased, with the highest %N
occurring in leaves and stems of plants fertilized at 300 ppm N. These results were
expected and similar to those of other studies. The %N in tomato plant leaves given the
moderate and excessive nitrogen treatments had similar leaf %N, but plants given the low
nitrogen treatment had significantly lower leaf %N (Han et al. 2014). The %N of wheat
plants increased with increasing nitrogen level (0 to 240 kg N/hectare; Gash 2012). From
these results, is evident that nitrogen fertilization rate directly influences plant tissue %N.
In my study, the %N of plant leaves and stems increased with increasing N
fertilization level, and stem protein contents followed this same trend with 300 ppm N

pg. 68
plant stems having greater protein contents than stems from the other nitrogen levels
(Figures 3.4 and 3.5). However, plant leaves did not exhibit the same pattern in protein
content as in %N across ppm N levels. Plant leaves of 300 ppm N plants were not the
highest in protein content among leaves of the four nitrogen levels, as expected. These
results indicate that plant leaf %N is not a direct indicator of leaf protein content and
plants must be allocating the nitrogen to processes other than protein and tissue synthesis.
The %C of leaves across the four nitrogen levels was between 35 and 40 %C,
whereas the %C of stems was between 42 and 44 %C, regardless of infestation status
(Figures 3.1 B and D). The significant differences in %C among the nitrogen levels were
not consistent across either tissue type. Results from this study are in contrast with those
of Hosseini et al. (2010), where %C of cucumber leaves were significantly higher at the
lowest nitrogen fertilization level than leaves of the higher nitrogen levels. Other studies
have documented similar changes in the C:N of plant tissues with different nitrogen
levels (Wingler et al. 2006, Ibrahim et al. 2011). In studies by Wingler et al. (2006) and
Ibrahim et al. (2011), carbohydrate and carbon-based metabolites (flavonoids and
phenolics) were found to increase with higher C:N when plants were fertilized with low
amounts of nitrogen. The difference between the plant %C results of this study, and the
findings from past experiments indicates that there may be differences occurring on the
molecular level with the carbon assimilation pathways. Plants are able to regulate and
balance the assimilation and use of carbon and nitrogen through cellular signaling
pathways, but these pathways are still being studied and all the constituents involved (e.g.
genes, enzymes) are currently not known (Zheng 2009). Also, these differences may

pg. 69
have been induced by other factors or stressors present in the studies, and not just by
nitrogen fertilization. Plant carbon and nitrogen contents are known to change as plants
age and are not consistent through time (Hicks 1928, Karley et al. 2002). A past study
documented that the aphids, Myzus persicae Sulzer and Macrosiphum euphorbiae
Thomas (Hemiptera: Aphididae) had shorter developmental times, higher fecundity, and
higher percentages of surviving individuals on young potato plants (Solanum tuberosum
L., Solanaceae), which contained lower leaf C:N and a higher concentration of glutamine
(an essential amino acid) than mature potato plants (Karly et al. 2002). In my study, the
ages of the basil plants and their tissues may have played a role in the relatively constant
%C measurements observed among the ppm N levels.
Only leaves of the top plant height region in uninfested plants exhibited
significantly different lipid absorbance values across ppm N levels (Figures 3.2 and 3.3).
The significant difference in leaf lipid absorbance at the top plant region might be an
artifact of sampling, because none of the other tissues and regions exhibit this in
uninfested and infested plants. Only three plant tissue samples were used per nitrogen
level for infested and uninfested plants at each plant region, therefore, using a larger
sample size might have lowered variances in lipid absorbance results (see Appendix C).
The inconsistent significant differences between infested and uninfested plants in
plant growth, plant harvest parameters (canopy and root weights, leaf surface areas and
root length), macromolecular contents (protein content and lipid absorbance values) and
%N and %C did not provide convincing evidence that mealybug infestation had any
significant effect on the plant parameters evaluated in this study. The low number of

pg. 70
mealybugs that survived on each infested plant most likely did not provide a high enough
infestation level to elicit significant changes in host-plant morphology or biochemistry.
These findings are similar to the study by Sauge et al. (2010) where aphid infestation had
no significant effects on peach leaf nitrogen content or plant growth parameters (stem
diameter, root-shoot ratio, and lateral-total leaf area ratio). However, the infestation
levels of M. persicae on the peach trees were also low (Sauge et al. 2010). For my study,
a greater number of surviving mealybugs on each infested plant might have been attained
by transferring a larger sample of mealybug eggs to each host-plant. A greater number of
surviving individuals on infested plants might have stimulated changes in the plant
parameters I evaluated.
4.3 Madeira Mealybug Life History Parameters and Implications for Future Studies
No significant differences were found in the developmental times of instars or
total developmental times to adulthood for male and female mealybugs, regardless of
plant ppm N level (Table 3.10). I expected that higher plant nitrogen fertilization would
yield mealybugs that completed development in shorter periods of time than those raised
on plants receiving lower nitrogen fertilization levels. Hosseini et al. (2010) and
Hogendorp et al. (2006) observed that insect developmental times decreased significantly
as host-plant nitrogen fertilization level increased. In my study, mealybugs experienced
high mortality rates, and were un-restricted in their movements on individual plants
(Table 3.11). High mealybug mortality might have been the result of the fluctuation in
temperature in the greenhouse room throughout the day and night. Chong et al. (2003)
showed that high temperatures (above 30°C) desiccated Madeira mealybug eggs and

pg. 71
killed crawlers (first instars) 2 days after hatching. High mortality and dispersion of
mealybugs might have impacted the results of developmental times, where a small
sample size (few mealybugs) and movement of mealybugs on plants (insects difficult to
spot) limited the detection of differences in number of days from one developmental
stadium to the next.
Females from 75 and 150 ppm N plant treatments had greater longevity and
fecundity than did females from the other treatment levels. This same trend was
observed in the analyses of Ro, rm, GT and λ, where mealybugs from 75 ppm N treated
plants performed better than did their counterparts by producing the most eggs in the
shortest amount of time, and increasing population density at a faster rate (Table 3.12).
These results are contrary to what was hypothesized at the beginning of my study, but are
similar to the findings of past studies. Rae and Jones (1992) found that fecundity was
greatest for sugarcane mealybug females raised on the medium-low to optimum nitrogen
fertilization level (112 ppm N and 224 ppm N), but not those reared on plants fertilized at
448 ppm N. Rae and Jones (1992) also found that net reproductive rate, intrinsic rate of
increase and finite rate of increase were highest on plants fertilized at 112 ppm N, but
lowest on plants fertilized at 0 ppm N and 22.4 ppm N. Cereal aphid longevity on wheat
plants did not differ among nitrogen treatment level (Gash 2012). However, fecundity
(nymphs/day) and intrinsic rate of increase of cereal aphids were highest at 180 kg
N/hectare, and then decreased at 240 kg N/hectare (Gash 2012). These results indicate
that fertilization of host-plants at high and low nitrogen levels have adverse effects on the
fecundity of aphids and other phloem-feeding insects. Higher nitrogen levels might lead

pg. 72
to the production of more nitrogen-based defense compounds, which might be a cause of
decreased phloem-feeder performance on plants receiving excessive nitrogen fertilization
(Bryant et al. 1981, Rae and Jones 1992, Coviella et al. 2002, Sauge et al. 2010). It has
been documented that amino acid content and prunasin (secondary defense metabolite in
peach trees) concentrations increased with peach tree nitrogen fertilization level, while
chlorogenic acid (another defensive secondary metabolite) decreased with increasing
nitrogen level (Sauge et al. 2010).
Plant defense through the production of secondary metabolites is a factor that
might influence phloem-feeder selection of a host-plant and acquisition of nutrients (Zhu-
Salzman et al. 2005). Plants and their immune systems can recognize attacks by foreign
bodies and induce activity of biochemical defense pathways specific to the threat
perceived (Zhu-Salzman et al. 2005). For instance, plant defense receptors send distinct
signals to the immune system distinguishing between herbivory by a caterpillar and
attacks by pathogens (Beckers and Spoel 2005). The two major pathways involved in
plant defense are the salicylic acid (SA) pathway and the jasmonic acid (JA) pathway
(Beckers and Spoel 2005, Walling 2008). Studies concerning these pathways are
relatively recent, and the details of activation and signaling mechanisms are not as well
understood compared to other biochemical pathways.
Studies concerning plant molecular defense against members of the suborder
Sternorrhyncha (includes aphids, whiteflies, and mealybugs) show conflicting results in
terms of the elicitation of the SA and JA pathways (Morgan and Thompson 2001, Zarate
et al. 2007). Past research with whitefly (Order: Hemiptera, Family: Aleyrodidae)

pg. 73
infestations has shown that SA-induced plant defenses were higher in intensity than those
associated with jasmonic acid (Zarate et al. 2007), but research with aphids suggests that
they elicit action from both pathways (Morgan and Thompson 2001). One recent study
with the mealybug, Phenococcus solanopsis Tinsley (Order: Hemiptera, Family:
Psuedococcidae), showed suppression of JA-regulated defenses during feeding, which
suggests that mealybugs might have similar feeding behaviors to whiteflies (Calatyud et
al. 1994, Zhang et al. 2011).
Before carrying out my current study, a preliminary experiment was conducted to
evaluate the possibility of analyzing for the presence and concentrations of SA and JA in
mealybug-infested plant tissues. The pilot study was conducted with coleus
(Solenostemon scutellarioides L., Lamiaceae) and Madeira mealybugs. Leaves from
infested and uninfested plants were processed, prepared and analyzed under the direction
of Dr. Nishanth Tharayil, Director of the Multi-User Analytical Laboratory in Clemson
University’s Biological Research Complex. Samples extracted from the leaves were
analyzed with a SA standard by High Performance Liquid Chromatography (HPLC)
using a Shimadzu LC-MS (Liquid Chromatography – Mass Spectrometry) detector with a
triple-quadrupole analyzer system (Shimadzu Corp., Durham, NC, USA). A reverse
phase C18 column was supplied with the machine to separate out the compounds for
detection by the machine’s sensor. Quantification of the metabolites was not successful,
because the compounds were in such low quantities in the plant samples that they were
undetectable by HPLC.

pg. 74
Future studies might look at how different levels of plant nutrient fertilization
affect the production of SA and JA pathway products (not the signaling metabolites,
themselves), and how possible changes in these compounds might affect phloem-feeding
insect performance. Analyzing differences in defense compound production across
plants of varying nitrogen quality would provide greater insight into the pathways of the
two major plant defense signaling compounds (SA and JA), and how these pathways
might be regulated through nitrogen allocation in plants under attack by insect pests.
4.4 Adult Female Madeira Mealybug and Egg Protein and Lipid Analyses, and
Implications for Future Studies
No significant differences in lipid absorbance values were determined for adult
mealybug females and eggs among plant nitrogen fertilization levels. However,
significant differences were found in adult female and egg protein contents among the
four plant nitrogen levels. Female mealybugs reared on 0 ppm N plants had the highest
protein contents of all females analyzed, while eggs from the 300 ppm N plant level had
the highest protein content compared to eggs from other nitrogen levels. These results
indicate that Madeira mealybug females, like other insects, are able to differentially
allocate resources to their eggs (Awmack and Leather 2002).
The correlation between female and egg protein contents provides further
evidence for maternal resource allocation in insects. A significant negative correlation
with a sigmoidal curve was found between female protein content and egg protein
content based on nitrogen fertilization level. The Madeira mealybugs reared on plants

pg. 75
receiving 75 (low), 150 (moderate) and 300 (high) nitrogen levels contribute their
nitrogen resources to the production of more eggs with higher nitrogen content than their
nitrogen stressed counterparts of the 0 ppm N treatment. Females from 0 ppm N plants
were higher in protein, but produced the fewest eggs with the lowest protein content.
Recent research has documented that under nutritional stress, insect females can re-
absorb immature embryos while the embryos are still in the ovaries (Lazzari and Zonta-
de-Carvalho 2012). This same ability has been recorded for aphids which re-absorb
immature embryos while under nutritional stress (Moore and Attisano 2011, Lazzari and
Zonta-de-Carvalho 2012). Moore and Attisano (2011) also documented that milkweed
bug (Oncopelitus fasciatus Dallas, Hemiptera: Lygaeidae) females given low-quality
food (pumpkin seeds, Cucurbita pepo L., Cucurbitaceae) had lower fecundity and higher
levels of oocyte re-absorption in comparison to females raised on high quality food
(sunflower seeds, Hilianthus spp. L., Asteraceae). The average life span of milkweed
bug females reared on pumpkin seeds was similar to that of females reared on the high
quality, sunflower seeds. Moor and Attisano (2011) argued that milkweed bug females
reared on pumpkin seeds might have been re-absorbing oocytes and using the nutrients to
maintain their survival (as indicated by unchanged life spans) and future production of
fewer, but higher quality eggs (Moore and Attisano 2011).
Papaj (2000) asserts that insects use host presence and nutrient quality as a signal
for the production of mature eggs, and that many insect species resorb the oocytes within
their ovaries as a means of self-survival until adequate nutrients can be obtained to
resume egg production. Insects starved over a period of time cease egg production and
pg. 76
maturation, and then begin egg production again when they are fed (Papaj 2000). Kajita
and Evans (2009) found that when lady beetles were starved for 6 days, a negative
response was observed in egg production the next day. Lady beetles produced small,
inviable eggs after food was taken away, and by day 4, produced no eggs at all (Kajita
and Evans 2009). However when food was given to them again, the insects resumed egg
production 3 days later and produced nearly as many viable eggs as before the starvation
treatment (Kajita and Evans 2009). The researchers asserted that the lady beetles
resorbed the immature oocytes to help sustain them during the period of starvation
(Kajita and Evans 2009). Similar findings were documented in the endoparasitoid
Pteromalus puparum Dalman (Hymenoptera: Pteromalidae), when oocytes degenerated
in the ovaries of starved female wasps (Guo et al. 2011). Guo et al. (2011) determined
that after 84 hours starved individuals experienced an increase in hemolymph total
protein, and a significant decrease in the protein concentrations of their ovaries,
indicating that oosorption was occurring.
In my study, Madeira mealybug females from the 0 ppm N plant treatment had
the highest protein content, but had the least amount of eggs with the lowest egg protein
content among all four ppm N levels. Mealybug females from the 300 ppm N plant
treatment also produced a lower number of eggs, but those eggs had significantly greater
protein content than the eggs produced by females reared on unfertilized plants. These
results indicate that Madeira mealybug females are capable of resource allocation and
differentially partitioning protein. Whether nitrogen-stressed mealybug females might be
able to conduct oosorption and maintain body protein is uncertain based on my current
pg. 77
data, but it is possible that mealybug females reared on poor-nutrient hosts may be able to
re-absorb embryos to maintain nutrients for survival. The viability of the eggs produced
and their sizes were not studied in this experiment, but would have given further insight
into how Madeira mealybug females allocate limited nutrients. Future studies of Madeira
mealybug nutrient allocation should focus on how host-plant quality affects mealybug
oogenesis, and if oosorption occurs via the degeneration of oocytes in the ovaries of
malnourished females. Studies focused on resource allocation within female Madeira
mealybugs would provide a better understanding of this species’ nutritional ecology and
the impacts of host-plant quality on the performance of this pest insect.

pg. 78
APPENDICES

pg. 79
Appendix A
Table of Ingredients for Nitrogen Solutions: The granular sources were first mixed in 10
ml H2O to create three separate nitrogen solutions. Specified amounts were taken from
the nitrogen solutions and mixed with other ingredients to produce the four fertilizer
solutions. Amounts of ingredients under the fertilizer ppm levels are given per 1 gallon
(3785 ml) of H2O.
Source Form g/10 ml H2O 0 75 150 300
ppm
Urea
(46% N)
Granular 6.08 g/10 ml 0 0.234 ml/
3785 ml H2O
0.467 ml/
3785 ml H2O
0.935 ml/
3785 ml H2O
Ammonium
Nitrate
(34% N)
Granular 5.85 g/10 ml 0 0.097 ml/
3785 ml H2O
0.194 ml/
3785 ml H2O
0.388 ml/
3785 ml H2O
Calcium Nitrate
(15% N)
Granular 3.75 g/10 ml 0 0.076 ml/
3785 ml H2O
0.151 ml/
3785 ml H2O
0.303 ml/
3785 ml H2O
Phosphorus Liquid - .5 ml/ 3785
ml H2O
.5 ml/ 3785
ml H2O
.5 ml/ 3785
ml H2O
.5 ml/ 3785
ml H2O
Potash Liquid - 1 ml/ 3785
ml H2O
1 ml/ 3785
ml H2O
1 ml/ 3785
ml H2O
1 ml/ 3785
ml H2O

pg. 80
Appendix B
Sand – Peat Moss Mix and Irrigation Water Reports from Clemson’s Agricultural
Services Laboratory: The ppm (parts-per-million) concentrations are given for the
following elements: P – Phosphorus, K – Potassium, Ca – Calcium, Mg – Magnesium, Zn
– Zinc, Cu – Copper, Mn – Manganese, Fe – Iron, S – Sulfur, B – Boron, Na – Sodium,
Cl – Chlorine. The ppm level of nitrate (NO3) were also given for the water sources and
sand – peat moss mix samples. Electrical conductivity was measured using the units
millimhos per centimeter. The measurements of bicarbonate (HCO3), carbon trioxide
(CO3), residual sodium carbonate (RSC), sodium adsorption ratio (SAR), and adjusted
sodium adsorption ratio (adjRNa) are given in milliequivalents per liter of water sample.
Water Sample Reports
Sample
#
Source P K Ca Mg Zn Cu Mn Fe S B Na Cl
ppm
1 Laboratory <0.02 0.2 8.6 0.3 <0.01 <0.01 <0.01 0.11 0 0.01 2 2.55
2 Greenhouse <0.02 0.2 8.7 0.3 <0.01 <0.01 <0.01 0.11 0 <0.01 2 2.25
Sample
#
Source NO3-
N
(ppm)
Total
Dissolved
Solids
(ppm)
Electrical
Conductivity
(mmhos/cm)
pH HCO3 CO3 RSC SAR adjRNa
Meq/L
1 Laboratory 0 38 0.06 7.3 0.5 0.0 0.05 0.18 0.09
2 Greenhouse 0 38 0.06 7.3 0.4 0.0 -0.06 0.18 0.09
Sand – Peat Moss Sample Report
Sample # pH NO3-N P
K
Mg
Ca
Electrical
Conductivity
(mmhos/cm)
Total
Dissolved
Solids (ppm) ppm
1 5.7 0 0 2 2 0 0.12 77
2 5.6 0 0 2 2 0 0.12 77

pg. 81
Appendix C
Summary of Analyzed Samples for Protein and Lipid Assays
Protein Assay Lipid Assay
Adult Female Samples
(1 mg each sample)
20 samples
(5 x 4 N treatments)
Adult Female Samples
(1 mg each sample)
20 samples
(5 x 4 N treatments)
Egg Samples
(1 mg each sample)
20 samples
(5 x 4 N treatments)
Egg Samples
(1 mg each sample)
12 samples
(3 x 4 N treatments)
Leaves at middle plant
height region
(10 mg each sample)
24 samples
Uninfested
(3 x 4 N treatments)
Infested
(3 x 4 N treatments)
Leaves at middle plant
height region
(10 mg each sample)
24 samples
Uninfested
(3 x 4 N treatments)
Infested
(3 x 4 N treatments)
Leaves at top plant height
region
(10 mg each sample)
24 samples
Uninfested
(3 x 4 N treatments)
Infested
(3 x 4 N treatments)
Leaves at top plant height
region
(10 mg each sample)
24 samples
Uninfested
(3 x 4 N treatments)
Infested
(3 x 4 N treatments)
Stem Sections at middle
plant height region
(10 mg each sample)
24 samples
Uninfested
(3 x 4 N treatments)
Infested
(3 x 4 N treatments)
Stem Sections at middle
plant height region
(10 mg each sample)
24 samples
Uninfested
(3 x 4 N treatments)
Infested
(3 x 4 N treatments)
Stem Sections at top plant
height region
(10 mg each sample)
24 samples
Uninfested
(3 x 4 N treatments)
Infested
(3 x 4 N treatments
Stem Sections at top plant
height region
(10 mg each sample)
24 samples
Uninfested
(3 x 4 N treatments)
Infested
(3 x 4 N treatments
Total 136 samples Total 128

pg. 82
WORKS CITED
Anonymous, 1997. Elemental analysis by micro-dumas combustion. University of
Georgia. Retrieved from http://sisbl.uga.edu/udumas.html on
August 18, 2015.
Awmack, C. S and Leather S. R. 2002. Host-plant quality and fecundity in herbivorous
insects. Annual Review of Entomology 47: 817 – 844.
Beckers, G. J. M. and Spoel, S.H. 2005. Fine-tuning plant defense signaling: salicylate
versus jasmonate. Plant Biology 8: 1-10.
Bethke, J. A., Kabashima, J. N., Newman, J. P., Robb, K. L. and Wilen, C. A. 2014.
“Insects, mites, and other invertebrate pests” in Container Nursery
Production and Business Management Manual edited by Newman, J. P.
UCANR Publications; Richmond, CA.
Bloom, A. J. 2015. The increasing importance of distinguishing among plant nitrogen
sources. Current Opinion in Plant Biology 25: 10 – 16.
Boudko, D. Y. 2012. Molecular basis of essential amino acid transport from studies of
insect nutrient amino acid transporters of the SLC6 family (NAT-SLC6).
Journal of Insect Physiology 58 (4): 433 – 449.
Bradford, M. M. 1976. A rapid and sensitive method for the quantitation of microgram
quantities of protein utilizing the principle of protein-dye binding.
Analytical Biochemistry 72: 284-254.
Brey, P. T., Ohayon, H., Lesourd, M. Castex, H., Roucache, J., and Latgé, J. P. 1985.
Ultrastructure and chemical composition of the outer layers of the cuticle
of the pea aphid Acyrthosiphon pisum (Harris). Comparative
Biochemistry and Physiology A82, 401 – 411.
Bryant, J. P., Chapu, S., and Klein, D. R. 1981. Carbon/nutrient balance of boreal
plants in relation to vertebrate herbivory. Oikos 40: 344 – 356.

pg. 83
Buckner, J. S. 1993. “Cuticular polar lipids of insects” in Insect Lipids: Chemistry,
Biochemistry, and Biology edited by Stanley, D. W. and Nelson, D. R.
The University of Nebraska Press, University of Nebraska; Lincoln, NE.
Cain, M. L., Bowman, W. D., and Hacker, S. D. 2011. Ecology. 2nd Edition. Sinauer
Associates, Inc.; Sunderland, MA.
Calatyud, P. A. Rahbe, Y., Tjallingii, W. F., Tertuliano, M., and Le Ru, B. 1994.
Electrically recorded feeding behavior of cassava mealybug on host and
non-host-plants. Entomologia Experimentalis et Applicata 72: 219-232.
Chapman, R. F. 1998. The Insects: Structure and Function. Cambridge University
Press; New York, NY.
Cheng, Y. S., Zheng, Y., and VanderGheynst, J. S. 2011. Rapid quantitative analysis of
lipids using a colorimetric method in a microplate format. Lipids 46 (1):
95 – 103.
Chong, J. H., Oetting, R. D., and Van Eirsel, M. W. 2003. Temperature effects on the
development, survival, and reproduction of the Madeira mealybug,
Phenococcus madeirensis Green (Hemiptera: Psuedococcidae), on
chrysanthemum. Annals of the Entomological Society of America 96 (4):
539-543.
Chong, J. H., Roda, A. L., Mannion, C. M. 2008. Life history of the mealybug,
Maconellicoccus hirsutus (Hemiptera: Psuedococcidae), at constant
temperatures. Environmental Entomology 37 (2): 323 – 332.
Coviella, C. E., Stipanovic, R. D., and Trumble, J. T. 2002. Plant allocation to defensive
compounds: interactions between elevated CO2 and nitrogen in
transgenic cotton plants. Journal of Experimental Botany 53 (367): 323 -
331.

pg. 84
Crawford, N. M. and Glass, A. D. M. 1998. Molecular and physiological aspects of
nitrate uptake in plants. Trends in Plant Science 3 (10): 389 – 395.
Cristofoletti, P. T., Ribeiro, A. F., Deraison, C., Rahbé, Y., and Terra, W. R. 2003.
Midgut adaptation and digestive enzyme distribution in a phloem feeding
insect, the pea aphid Acyrthosiphon pisum. Journal of Insect Physiology
49: 11 – 24.
Dinant, S., Bonnemain, J., Girousse, C., and Kehr, J. 2010. Phloem sap intricacy and
interplay with aphid feeding. Comptes Rendus Biologies 333: 504 – 515.
Douglas, A.E. 2006. Phloem-sap feeding by animals: problems and solutions.
Journal of Experimental Botany 57 (4): 747-754.
Ferreira, C. 2009. “Digestive System” in Encyclopedia of Insects, edited by Resh, V. H.
and Carde, T. Oxford: Elsevier Science and Technology. Retrieved from
http://libproxy.clemson.edu/login?url=http://search.credoreference.com/
content/entry/estinsects/digestive_system/0.
Forde, B. and Lorenzo, H. 2001. The nutritional control of root development. Plant and
Soil. 232: 51 – 68.
Gao, K., Chen F., Yuan, L., Zhang, F., and Mi, G. 2015. A comprehensive analysis of
root morphological changes and nitrogen allocation in maize in response
to low nitrogen stress. Plant, Cell and Environment 38: 740 – 750.
Gash, A. F. J. 2012. Wheat nitrogen fertilisation effects on the performance of the
cereal aphid Metopolophium dirhodum. Agronomy 2: 1 – 13.
Gill, H. K., Goyal, G., Gillett-Kaufman, J. 2012. Citris mealybug Planococcus citri
(Risso) (Insecta: Hemiptera: Psuedococcidae). University of Florida IFAS
Extension. Retrieved from edis.ifas.ufl.edu.

pg. 85
Goron, T. L., Bhosekar, V. K., Shearer, C. R., Watts, S. and Raizada M. N. 2015. Whole
plant acclimation responses by finger millet to low nitrogen stress.
Frontiers in Plant Science 6 (652) 1 – 14.
Grunwald, C., Sims, J. L., and Sheen, S. J. 1977. Effects of nitrogen fertilization and
stalk position on chlorophyll, carotenoids, and certain lipids of three
tobacco genotypes. Canadian Journal of Plant Science 57: 525 – 535.
Guo, J., Dong, S., Fang, Q., Hu, C., Li, K., and Ye, G. 2011. Oosorption in the
endoparasitoid, Pteromalus puparum. Journal of Insect Science 11:90
Retreived from insectscience.org/11.90 on October 21, 2015.
Hagedorn, H. H. and Kunkel, J. G. 1979. Vitellogenin and vitellin in insects. Ann. Rev.
Entomol. 24: 475 – 505.
Hamrick, D. (Editor) 2003. Ball RedBook: Crop Production. Volume 2, 17th Edition.
Ball Publishing; West Chicago, IL.
Han, P., Lavoir, A., Le Bot, J., Amiens-Desneux, E., and Desneux, N. 2014. Nitrogen
and water availability to tomato plants triggers bottom-up effects on the
leafminer Tuta absoluta. Scientific Reports 4 (4455): 1-8.
Van Handel, E. 1985. Rapid determination of total lipids in mosquitoes. Journal of
American Mosquito Control Association 1 (3): 302 – 304.
Herren, H. R., Hennessey, R. N., and Bitterli, R. 1986. Biological control and
host-plant resistance to control the cassava mealybug and green mite in
Africa: proceeds of an International workshop December 6 – 10, 1982,
Ibadan, Nigeria. International Fund for Agricultural Development
Organization for African Unity; Scientific, Technical and Research
Commission; International Institute of Tropical Agriculture, Ibadan,
Nigeria.

pg. 86
Hicks, P. A. 1928. Distribution of carbon/nitrogen ratio in the various organs of the
wheat plant at different periods of its life history. The New Phytologist
27 (2): 108 – 116.
Hodge, A. 2004. The plastic plant: root responses to heterogeneous supplies of
nutrients. The New Phytologist 162 (1): 9 – 24.
Hogendorp, B. K., Cloyd, R. A., and Swaider, J. M. 2006. Effect of nitrogen fertility
on reproduction and development of citrus mealybug, Planococcus citri
Risso (Homoptera: Pseudococcidae), feeding on two colors of coleus,
Solenostemon scutellarioides L. Codd. Environmental Entomology 35 (2):
201-211.
Honěk, A. 1991. Environment stress, plant quality and abundance of cereal aphid
(Hom., Aphididae) on winter wheat. Journal of Applied Entomology
112: 65 – 70.
Hosseini, M., Ashouri, A., Enkegaard, A., Goldansaz, S., Mahalati, M. N., and
Hosseininaveh, V. 2010. Performance and population growth rate of the
cotton aphid, and associated yield losses in cucumber, under different
nitrogen fertilization regimes. International Journal of Pest Management
56 (2): 127 – 135.
Ibrahim, M. H., Jaafar, H. Z. E., Rahmat, A., and Rahman, Z. A. 2011. Effects of
nitrogen fertilization on synthesis of primary and secondary metabolites
in three varieties of Kacip Fatimah (Labisia Pumila Blume).
International Journal of Molecular Science 12 (8): 5238 – 5254.
Jhonson, C. 2009. Biology of Soil Science. Oxford Book Company; Jaipur, India.
JMP®, Version 11. SAS Institute Inc., Cary, NC, USA, 1989-2015.
Kajita, Y. and Evans, E. 2009. Ovarian dynamics and oosorption in two species of
predatory lady beetle (Coleoptera: Coccinellidae). Physiological
Entomology 34: 185 – 194.

pg. 87
Karley, A. J., Douglas, A. E., and Parker, W. E. 2002. Amino acid composition and
nutritional quality of potato leaf phloem sap for aphids. The Journal of
Experimental Biology 205: 3009 – 3018.
Kawooya, J. K., Osir, E. O., and Law, J. H. 1988. Uptake of the major hemolymph
lipoprotein and its transformation in the egg. The Journal of Biological
Chemistry 263 (18): 8740 – 8747.
Klowden, M. J. 2013. Physiological Systems in Insects. Academic Press; San Diego,
CA.
Krapp, A. 2015. Plant nitrogen assimilation and its regulation: a complex puzzle with
missing pieces. Current Opinion in Plant Biology 25: 115 – 122.
Lazzari, S. M. N. and Zonta-de-Carvalho, R. C. 2012. “Sap-sucking insects
(Aphidoidea)” in Insect Bioecology and Nutrition for Integrated Pest
Management edited by Panizzi, A. R. and Parra J. R. P. CRC Press
(Taylor and Francis Group); Boca Raton, FL.
Liljeroth, E., Baath, E., Mattheisson, I., and Lundberg, T. 1990. Root exudation and
rhizoplane bacterial abundance of barley (Hordeum vulgare L.) in relation
to nitrogen fertilization and root growth. Plant and Soil 127 (1): 81 – 89.
Masclaux-Daubresse, C., Daniel-Vedele, F., Dechorgnat, J., Chardon, F., Gaufichon, L.,
and Suzuki, A. 2010. Nitrogen uptake, assimilation and remobilization in
plants: challenges for sustainable and productive agriculture. Annals of
Botany 105: 1141 – 1157.
Mattson, W. J. 1980. Herbivory in relation to plant nitrogen content. Annual Review
of Ecology and Systematics 11: 119 – 161.
McIntyre, G. I. and Raju, M. V. S. 1967. Developmental studies on Euphorbia esula:
some effects of the nitrogen supply on the growth and development of the
seedling. Canadian Journal of Botany 45: 975 – 984.

pg. 88
Miller, A. J. and Cramer, M. D. 2004. Root nitrogen acquisition and assimilation. Plant
and Soil 274: 1 – 36.
Moore, P. J. and Attisano, A. 2011. Oosorption in response to poor food: complexity in
the trade-off between reproduction and survival. Ecology and Evolution
[Online, Open Access]: 37 – 45.
Moore, K. P. and Sikora, F. J. (editors). 2014. Soil test methods from the southeastern
United States. Southeastern Extension and Research Activity Information
Exchange Group; Southern Association of Agricultural Experiment
Station Directors. Retrieved from http://www.clemson.edu/sera6/
MethodsManualFinalSERA6.pdf.
Morgan, T.P. and Thompson, G.A. 2001. Molecular responses to aphid feeding in
Arabidopsis in relation to plant defense pathways. Plant Physiology 125
(2): 1074 – 1085.
Nevo, E. and Coll, M. 2001. Effect of nitrogen fertilization on Aphis gossypii
(Homoptera: Aphididae): variation in size, color, and reproduction.
Journal of Economic Entomology 94 (1): 27-32.
Osborne, L. S. 2010. “Mealybugs.” University of Florida: MREC. Retrieved from
http://mrec.ifas.ufl.edu/lso/mealybugs.htm.
Papaj, D. R. 2000. Ovarian dynamics and host use. Annual Review of Entomology 45:
423 – 448.
Pate, J. S. and Layzell, D. B. 1990. “Energetics and biological costs of nitrogen
assimilation” in The Biochemistry of Plants: A Comprehensive Treatise.
Stumpf, P. K. and Conn, E. E. (editors-in-chief). Academic Press, Inc.;
San Diego, CA.
Pӧykkӧ, H. and Mӓntӓrri, S. 2012. Egg size and composition in an ageing capital
breeder – consequences for offspring performance. Ecological
Entomology 37: 330 – 341.

pg. 89
Rae, D. J. and Jones, R. E. 1992. Influence of host nitrogen levels on development,
survival, size and population dynamics of sugarcane mealybug,
Saccharicoccus sacchari (Cockerell) (Hemiptera: Pseudococcidae).
Australian Journal of Zoology 40: 327 – 342.
RANDOM.ORG©. Randomness and Integrity Services Ltd., Dublin, Ireland, 1998-2015.
Accessed at https://www.random.org/ on May 16, 2014.
Raven, J. A. and Smith, F. A. 1976. Nitrogen assimilation and transport in vascular
land plants in relation to intracellular pH regulation. New Phytologist
76 (3): 415 – 431.
Raven, P. H., Evert, R. F., and Eichhorn, S. E. 2005. Biology of Plants, 7th edition.
W. H. Freeman and Company; New York, NY.
Raven, P. H., Johnson, G. B., Losos, J. B., Mason, K. A., and Singer, S. R. 2008.
Biology, 8th edition. The McGraw – Hill Companies, Inc.; New York,
NY.
Richardson, A. E., Barea, J., McNeill, A. M., and Prigent-Combaret, C. 2009.
Acquisition of phosphorus and nitrogen in the rhizosphere and plant
growth promotion by microorganisms. Plant Soil 321: 305 – 339.
Sandstrӧm, J. and Moran, N. 1999. How nutritionally imbalanced is phloem sap for
aphids? Entomologia Experimentalis et Applicata 91: 203 – 210.
Sauge, M., Grechi, I., and Poëssel, J. 2010. Nitrogen fertilization effects on Myzus
persicae aphid dynamics on peach: vegetative growth allocation or
chemical defense? Entomologia Experimentalis et Applicata 136: 123 -
133.
Schoonhoven, L.M., Loon, J.J.A. van, and Dicke, M. 2005. Insect-Plant Biology.
Oxford University Press Inc.; New York, NY.
pg. 90
Sclar, C. 2008. Targeting the white menace: mealybugs. Greenhouse Product News
Magazine, Great American Media Services; Sparta, MI. Retrieved from
http://www.gpnmag.com/sites/default/
files/TargetingThe.pdf.
Skinkis, P. A., Dreves, A. J., Walton, V. M., and Martin, R. R. 2009. Field monitoring
for grapevine Leafroll Virus and mealybug in Pacific northwest
vineyards. Oregon State University Extension Service, Oregon State
University. Retrieved from http://ir.library.oregonstate.edu/xmlui/
bitstream/handle/1957/12260/em8985.pdf.
Sloggett, J. L. and Lorenz, M. W. 2008. Egg composition and reproductive investment
in aphidophagous ladybird beetles (Coccinellidae: Coccinelli): egg
development and interspecific variation. Physiological Entomology 33
(3): 200 – 208.
Strauss, S. Y. 1987. Direct and indirect effects of host-plant fertilization on an insect
community. Ecology 68 (6): 1670 – 1678.
Terra, W. R. 1990. Evolution of digestive systems of insects. Annual Review of
Entomology 35:181 – 200.
van Vuuren, M. M. I., Robinson, D., and Griffiths, B. S. 1996. Nutrient inflow and root
proliferation during the exploitation of a temporally and spatially discrete
source of nitrogen in soil. Plant and Soil 178: 185 – 192.
Walling, L.L. 2008. Avoiding effective defenses: strategies employed by phloem-
feeding insects. Plant Physiology 146: 859 – 866.
Wilkinson, T. L. and Douglas, A. E. 2003. Phloem amino acids and the host-plant range
of the polyphagous aphid, Aphis fabae. Entomologia Experimentalis et
Applicata 106 (2): 103 – 113.

pg. 91
Wingler, A., Purdy, S., Maclean, J. A., and Pourtau, N. 2006. The role of sugars in
integrating environmental signals during the regulation of leaf senescence.
Journal of Experimental Botany 57 (2): 391 – 399.
Woods, H. A. and Kingsolver, J. G. 1999. Feeding rate and the structure of protein
digestion and absorption in Lepidopteran midguts. Archives of Insect
Biochemistry and Physiology 42: 74 – 87.
Xu, G., Fan, X., and Miller, A. J. 2012. Plant nitrogen assimilation and use efficiency.
Annual Review of Plant Biology 63: 153 – 182.
Ye, Y., Liang, X., Chen, Y., Li, L., Ji, Y., and Zhu, C. 2014. Carbon, nitrogen and
phosphorus accumulation and partitioning, and C:N:P stoichiometry in
late-season rice under different water and nitrogen managements. PLoS
ONE 9 (7): e101776.doi:10.1371/journal.pone.0101776.
Zarate, S.I, Kempema, L.A. and Walling L.L. 2007. Silverleaf whitefly induces
salicylic acid defenses and suppresses effectual jasmonic acid
defenses. Plant Phsyiology 143: 866 – 875.
Zeigler, R. and Antwerpen, R. V. 2004. Lipid uptake by insect oocytes. Insect
Biochemistry and Molecular Biology 36 (4): 264 – 272.
Zhang, P., Zhu, X., Huang, F., Lin, Y., Zhang, J., Lu, Y., and Ruan, Y. 2011.
Suppression of jasmonic acid dependent defense in cotton plant by the
mealybug, Phenococcus solanopsis. PLoSONE 6 (7): 1-9.
Zhao, D., Reddy, K. R., Kakani, V. G., and Reddy, V. R. 2005. Nitrogen deficiency
effects on plant growth, leaf photosynthesis, and hyperspectral reflectance
properties of sorghum. European Journal of Agronomy 22: 391 – 403.
Zheng, Z. 2009. Carbon and nitrogen nutrient balance signaling in plants. Plant
Signaling Behavior 4 (7): 584 – 591.

pg. 92
Zhu-Salzman, K., Bi, J., and Liu, T. 2005. Molecular strategies of plant defense and
insect counter-defense. Insect Science 12: 3 – 15.