effects of neighborhood characteristics on the mortality of black
TRANSCRIPT
Effects of Neighborhood Characteristics on the Mortality of Black Male Youth: Evidence From Gautreaux
by
Mark E. Votruba, Case Western Reserve University Jeffrey R. Kling, Princeton University and NBER
CEPS Working Paper No. 107
May 2005 Abstract: The Gautreaux data for this paper were created with the assistance of the Leadership Council for Metropolitan Open Communities under special agreement with the U.S. Department of Housing and Urban Development and the National Center for Health Statistics. Generous support for data construction and analysis was provided by Daniel Rose and the MIT Center for Real Estate, the National Bureau of Economic Research, the National Science Foundation (SBE-9876337), the Princeton Center for Economic Policy Studies, and the Princeton Industrial Relations Section. Technical support was provided by the Princeton Office of Population Research (NICHD 5P30-HD32030) and the Princeton Center for Health and Wellbeing. Mortality count data for male youth residing in Chicago community areas were graciously provided by the Illinois Center for Health Statistics. We thank Greg Duncan and members of the Princeton Industrial Relations Section for helpful comments. @2004 by Mark E. Votruba and Jeffrey R. Kling. All rights reserved.

EFFECTS OF NEIGHBORHOOD CHARACTERISTICS ON THE MORTALITY OF BLACK MALE YOUTH:
EVIDENCE FROM GAUTREAUX
Mark E. Votruba∗,1, Jeffrey R. Kling2
11119 Bellflower Road, Cleveland, OH 44106, USA
July 2004 Abstract: We analyze the effects of neighborhood characteristics on the mortality of black male
youth in families relocated through the Gautreaux program, a residential mobility program
implemented in Chicago in 1976. While we find significant evidence of neighborhood self-
selection by families participating in Gautreaux, we nonetheless find evidence that certain
placement neighborhood characteristics were associated with lower male youth mortality rates
after controlling for household and origin neighborhood characteristics. Placement
neighborhood characteristics related to human capital and work were more important predictors
of male youth mortality than characteristics related to race, poverty, or family composition.
JEL classifications: H43; I12; I18
Keywords: Neighborhood effects; Mortality
∗ Corresponding author. Tel: +1-216-368-4296; fax: +1-216-368-5039. Email addresses: [email protected] (M. Votruba), [email protected] (J. Kling). 1 Economics Department, Weatherhead School of Management at Case Western Reserve University, and Center for Health Care Research & Policy at MetroHealth Medical Center. 2 Department of Economics and Woodrow Wilson School at Princeton University, and National Bureau of Economic Research.

1
1. Introduction
There is now widespread acceptance among health economists and health services
researchers that the impact of medical care on population health is fairly modest when compared
to other contributing factors, such as health behaviors, genetic endowment, and social and
environmental factors (e.g., McGinnis and Foege, 1993; Lurie et al., 2003). In particular, a large
literature based on observational evidence documents strong correlations between the
characteristics of places and health outcomes, including all-cause mortality, self-reported health
status, incidence of specific diseases, mental illness, incidence of injury, and adverse birth
outcomes.3 The general finding in this literature is that residents of disadvantaged
neighborhoods suffer worse health outcomes than those in more advantaged neighborhoods, and
that these differences cannot be fully explained by variation in individual-level characteristics.
If the correlations between neighborhood characteristics and health outcomes represent
causal relationships, it suggests that housing policies can have important implications for
individual health. Moreover, it suggests that residential segregation by income, class, or race
could be a contributing factor to the well-documented gradient between health and socio-
economic status (e.g., Deaton, 2001). Unfortunately, issues of omitted variable bias cast doubt
on the causal interpretation often applied to the observed correlations. Residential location is
largely a matter of household choice, and the determinants of this choice are, at best, imperfectly
observed by researchers. As a result, one cannot be sure if associations between neighborhood
characteristics and health outcomes gleaned from observational studies represent a causal
3 Pertinent citations include: Haan et al. (1987), Lynch et al. (1998), Waitzman and Smith (1998a, 1998b), Ross et al. (2000), and Bosma et al. (2001) for all-cause mortality; Malmstrom et al. (1999) and Subramanian et al. (2001) for self-reported health status; Armstrong et al. (1998), LeClere et al. (1998), Casper et al. (1999), Diez-Roux et al. (2001), Zierler at al. (2000), Barr et al. (2001), and Acevedo-Garcia (2001) for incidence of specific diseases; Aneshensel and Sucoff (1996),Yen and Kaplan (1999), and Ross (2000) for mental illness; Durkin et al. (1994), Reading et al. (1999), and Cubbin et al. (2000) for incidence of injury; Collins and David (1997), Matteson et al. (1998), and Gorman (1999) for adverse birth outcomes.
2
relationship, omitted variable bias, or some combination of the two. Reviewing the literature on
neighborhood effects on children outcomes, Jencks and Mayer note that “…the most
fundamental problem confronting anyone who wants to estimate neighborhoods’ effects on
children is distinguishing between neighborhood effects and family effects… This means that
children who grow up in rich neighborhoods would differ to some extent from children who
grow up in poor neighborhoods even if neighborhoods had no effect whatever” (1990, page 119).
The problem of omitted variable bias potentially explains the more modest neighborhood
health effects documented in studies of the Moving to Opportunity (MTO) demonstration
projects, which have operated in five cities since 1994.4 Under MTO, low-income public
housing families were randomly assigned to either the control group or one of two intervention
groups offering housing vouchers to move to neighborhoods with lower poverty rates. Recent
analyses of MTO participants indicate the neighborhood effects on health are less comprehensive
than suggested by observational studies. Kling et al. (2004) find that adults in the experimental
group demonstrate significantly better mental health and significantly lower obesity levels than
control group adults, but find no significant differences in four other aspects of physical health
(general health, asthma, physical limitations, and hypertension). Looking at the health of MTO
youth, Kling and Liebman (2004) find that female youth in the experimental group experienced
improvements in mental health and were less likely to engage in risky activities, with no
significant improvements in physical health. However, male youth in the experimental group
were more likely to engage in risky activities (e.g., alcohol and tobacco use) and more likely to
4 In MTO, the “experimental” group received housing vouchers that could only be used to lease housing in census tracts with 1990 poverty rates of less than 10 percent. The “Section 8” group received standard Section 8 vouchers with no constraints on the relocation area. The random assignments led to substantial variation in neighborhood characteristics across the three groups, with experimental families generally residing in census tracts having better socioeconomic characteristics and control families residing in tracts with poorer socioeconomic characteristics. See Goering, Feins, and Richardson (2002) for a detailed description of the MTO experiments and a review of findings current to its publication date.
3
experience serious physical injuries requiring medical attention. In sum, the MTO results
suggest a more modest role for the impact of neighborhoods on health, one largely constrained to
effects on mental health, and indicate that the health effect of “better” neighborhoods on poor
male youth may in fact be negative.
Against this backdrop, we contribute to the existing literature by investigating the link
between neighborhood characteristics and the mortality of black male youth who participated in
the Gautreaux Assisted Housing Program, a predecessor to MTO that operated in Chicago from
1976 to 1998. Gautreaux was designed with the intention of moving black public housing
residents into city and suburban neighborhoods where the black population was less than 30
percent. While Gautreaux was not a planned social experiment, analysts have referred to
placements under Gautreaux as “quasi-random” due to elements of randomness in the way
participants were matched to available rental units (e.g., Rosenbaum, 1992; Popkin et al., 1993;
Rosenbaum, 1995; Rosenbaum and DeLuca, 2000; Rosenbaum and Rubinowitz, 2001; DeLuca
and Rosenbaum, 2003). If placements were truly random, occurring without regard to family
characteristics and preferences, Gautreaux provides an ideal opportunity for investigating the
impact of neighborhood characteristics on health (and other) outcomes.
Our focus on the mortality of black male youth was directed by both statistical issues and
real-world relevance. Since our outcome measure is derived from administrative records (state
death certificates), we are able to overcome potential problems of attrition bias that plagued early
analyses of Gautreaux (e.g., Rosenbaum, 1992; Popkin et al., 1993; Rosenbaum, 1995).
Moreover, black male youth have notoriously high mortality rates.5 As a statistical matter, the
larger number of mortalities among this group allows for greater power in our empirical analysis.
5 The national mortality rate for black males ages 15 to 24 was 180.6 per 100,000 in 2001, more than 67 percent higher than the rate for white males in the same age group (Arias et al., 2003).

4
The mortality outcomes of male youth also hold particular interest given the estimated negative
effect that “better” neighborhoods had on the male youth in MTO.
Our analysis focuses on identifying the neighborhood characteristics that are most
strongly related to post-placement mortality, independent of family characteristics. Colinearity
of neighborhood characteristics impedes our attempts to measure the marginal contribution of
individual neighborhood characteristics. Nevertheless, the information we provide could be
useful to policymakers attempting to structure voucher programs to encourage relocations to
neighborhoods possessing bundles of characteristics that facilitate better outcomes (health or
otherwise). Understanding which neighborhood characteristics lead to better health outcomes
could also assist in formulating hypotheses about the underlying mechanisms through which
neighborhoods matter.
Our results indicate that claims of “quasi-randomness” in the Gautreaux placement
process are overstated. Characteristics of a family’s placement neighborhood (Census tract)
were found to be significantly related to both family characteristics and characteristics of the
family’s intake neighborhood. The correlation between the intake and placement neighborhood
characteristics indicates that household preferences likely affected the characteristics of one’s
placement neighborhood. These preferences may be correlated with determinants of black male
youth mortality, and we attempt to control for these preferences with a rich set of baseline data
collected at the time of enrollment in Gautreaux.
We find evidence that certain neighborhood characteristics affect the mortality rates of
male youth participating in Gautreaux. Specifically, male youth mortality rates decline
significantly with increases in the percent of adults with a college degree, percent of labor force
that is employed, and percent of workers in white collar professions. In contrast, we find no
5
robust associations between the mortality rate of male youth and the following placement tract
characteristics: placement in the city (vs. suburbs), percent non-white, poverty rate, percent of
households receiving government assistance, and percent of families headed by a female. It
appears then that black male youth mortality rates are most greatly affected by neighborhood
characteristics related to human capital and work. This contrasts with a community-level
analysis which finds that the local poverty rate and percent of households receiving government
assistance most strongly predict the black male youth mortality rate in Chicago community areas.
Notably, the results related to human capital and work are robust to the inclusion of
additional covariates capturing characteristics of intake neighborhoods. This is an important
finding since the characteristics of one’s intake neighborhood should, to some extent, capture
variance in families’ tastes for residing in different kinds of neighborhoods. If self-selection bias
were driving our estimates, our estimates should have been attenuated by the inclusion of intake
neighborhood characteristics.
The remainder of this paper is structured as follows. Section 2 provides background on
the Gautreaux program. Section 3 describes the dataset constructed for this analysis. Section 4
presents the empirical results including evidence of neighborhood selection by Gautreaux
participants. Section 5 discusses the implications of these findings and concludes. The Data
Appendix includes additional details on our data construction process.
2. Background
The Gautreaux Assisted Housing Program resulted from a consent decree originating
from a 1966 housing discrimination lawsuit against the Chicago Housing Authority (CHA) and
the U.S. Department of Housing and Urban Development (HUD). The suit alleged that black

6
public housing residents were denied opportunities to live in integrated areas in the Chicago
metropolitan area. In 1976, a U.S. district court decreed that HUD set aside 7000 Section 8 slots
to assist families in the plaintiff class to move to metropolitan area neighborhoods with black
populations of less than 30 percent.6 In 1981, this was amended to allow relocations into
revitalizing minority neighborhoods (Davis, 1993).
The Gautreaux program was administered by the Leadership Council for Metropolitan
Open Communities, a private, not-for-profit agency sponsored by local leadership organizations
and charged with addressing housing segregation in Chicago. From Gautreaux’s inception until
1989, the Leadership Council employed a full-time real estate staff that played the primary role
in locating landlords willing to participate in the program (Keels et al., 2003). As units were
located, they were offered to families “on the basis of their rank order on the waiting list,
regardless of any expressed preferences for city or suburban locations” (Popkin et al., 1993).
Popkin et al. noted that although “participants are allowed to refuse two housing offers for any
reason without jeopardizing their assistance, 95 percent accept the first offer they receive
because it is uncertain that there will be any others.” These observations are noteworthy since
they suggest apartments identified by the real estate staff were assigned without regard to family
preferences, although participating families were also permitted to search for their own units at
least as early as the mid-1980s (Keels et al., 2003).
By 1990, the rental housing market was strong enough that the Leadership Council
eliminated its real estate staff (Keels et al., 2003). Participating families were largely responsible
6 The Section 8 program, now known as Housing Choice Vouchers, is a federal housing assistance program providing vouchers that can be used to rent housing in the private rental market with a tenant contribution towards rent of about 30 percent of monthly income. Under Section 8, HUD determines the “fair market rent" (FMR) in cities and towns. For Section 8 “certificates,” HUD subsidies rent up to the FMR rent ceiling. For Section 8 “vouchers,” which over time have become the predominant form of assistance, the FMR determines HUD’s contribution to the rent. The value of the voucher would typically be the difference between the FMR and 30 percent of household monthly income, without a specific ceiling on rent for the unit.
7
for identifying their own units from this time forward. As a result, previous analyses of
Gautreaux have generally focused on placements occurring before 1990 on the assumption that
pre-1990 placements were exogenous with respect to family characteristics or neighborhood
preferences. In contrast, a similar argument could not be made about post-1990 placements.
In our sample period of 1976 to 1994, Gautreaux assisted a relatively homogenous group
of low-income Chicago residents in relocating to a wide variety of neighborhoods throughout the
Chicago metropolitan area. The individual characteristics associated with these location choices
are discussed in detail in section 4.
3. Data Description
3.1 Sample of Male Youth in Gautreaux
Data on the families participating in Gautreaux were created by the Leadership Council
and provided by the U.S. Department of Housing and Urban Development for the purpose of this
study. These data included participants’ date of intake and placement, intake and placement
addresses, identifying information for each member in the participating household (name, sex,
date-of-birth, and social security number), as well as additional characteristics of the family.7
Intake and placement addresses were geocoded to determine the Census tract of residence at
intake and placement. Data from the 1980 and 1990 Censuses were then merged to the
household records and used to construct characteristics of the intake and placement
neighborhood for each family.
As our analysis focuses on the mortality outcomes of the male youth in Gautreaux, we
restricted our sample to families containing at least one male age 25 or younger at the date of
7 A complete description of the data creation and verification steps is provided in the Data Appendix, but omitted here for brevity.

8
placement, dropping any males without a recorded date-of-birth. The resulting dataset consists
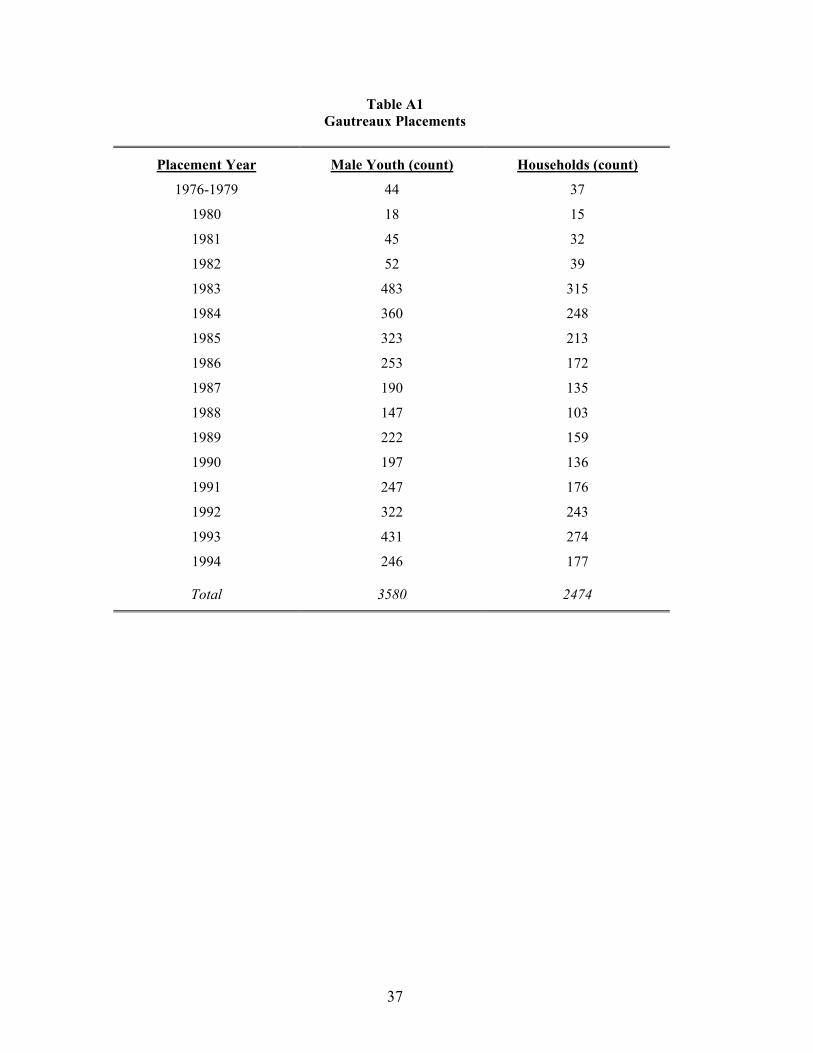
of 3580 male youth in 2474 families who were relocated under Gautreaux before 1995. The
number of families placed by Gautreaux was initially quite low, but increased substantially in
1983 (shown in Appendix Table A1). From that time forward, the number of placements per
year held fairly constant at an average of 196 per year for families containing a male youth.
Table 1 presents summary statistics of household and individual characteristics for the
dataset of male youth. About 72 percent of all male youth resided in households headed by an
unmarried female with another 17 percent recorded as headed by a married female. The head of
household was generally quite young (mean age of 30.1) and only 23 percent of household heads
were working at intake. Of those working, earnings were generally low, averaging only $7166 in
1979 dollars ($18,162 in 2003 dollars). Total monthly incomes in households without a working
head were even lower, suggesting annual total incomes averaging $2988 ($7572 in 2003
dollars).8 The number of bedrooms requested, determined by the Leadership Council based on
the sex and age composition of the family, was 2.7 on average, and the mean age of the male
youth at placement was 8.4 years old.
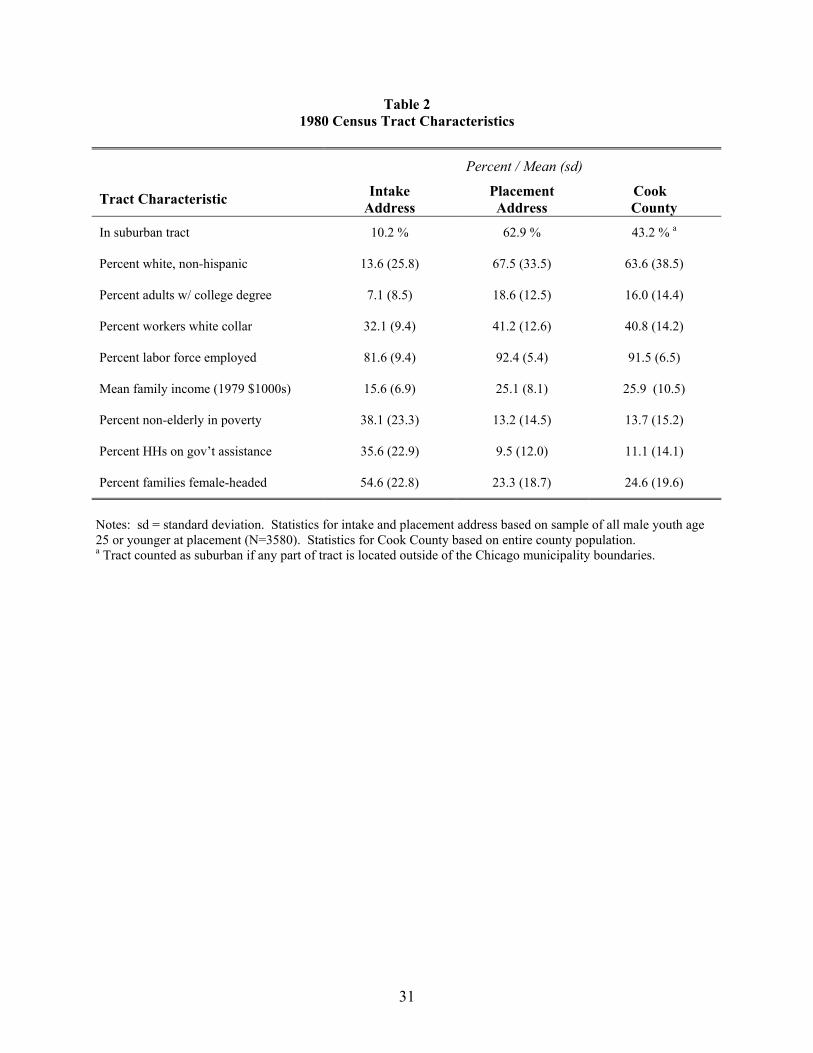
Table 2 summarizes the census tract characteristics of the intake and placement addresses
for the male youth. Although the years of intake and placement vary, Table 2 uses 1980 Census
data for all locations to facilitate comparison with the entire Cook County population given in
the third column.9 Not surprisingly, substantial differences exist between the intake and
placement neighborhoods. It is noteworthy that the judicial intent behind the program appears to
have been satisfied. Gautreaux families moved from overwhelmingly minority neighborhoods
8 Total monthly household income was not consistently recorded for families with a working head. In our regression models, total income is only included as an interaction with an indicator for having a non-working head. 9 The Chicago MSA consists of six counties. Cook County is the most populous of these and encompasses the City of Chicago.

9
into neighborhoods that were more white (on average) than Cook County as whole. The
majority of these moves were outside of the Chicago city limits; however, it is notable that 10
percent of the participants were already residing in the suburbs prior to participating in the
program. Differences between intake and placement neighborhoods are also evident in terms of
education level, fraction of workers in white collar jobs, unemployment rate, income level,
poverty rate, rate of government assistance, and fraction of families headed by a female. On
each measure, we observe families moving from neighborhoods with characteristics indicative of
economic deprivation into neighborhoods with average characteristics that resemble those for
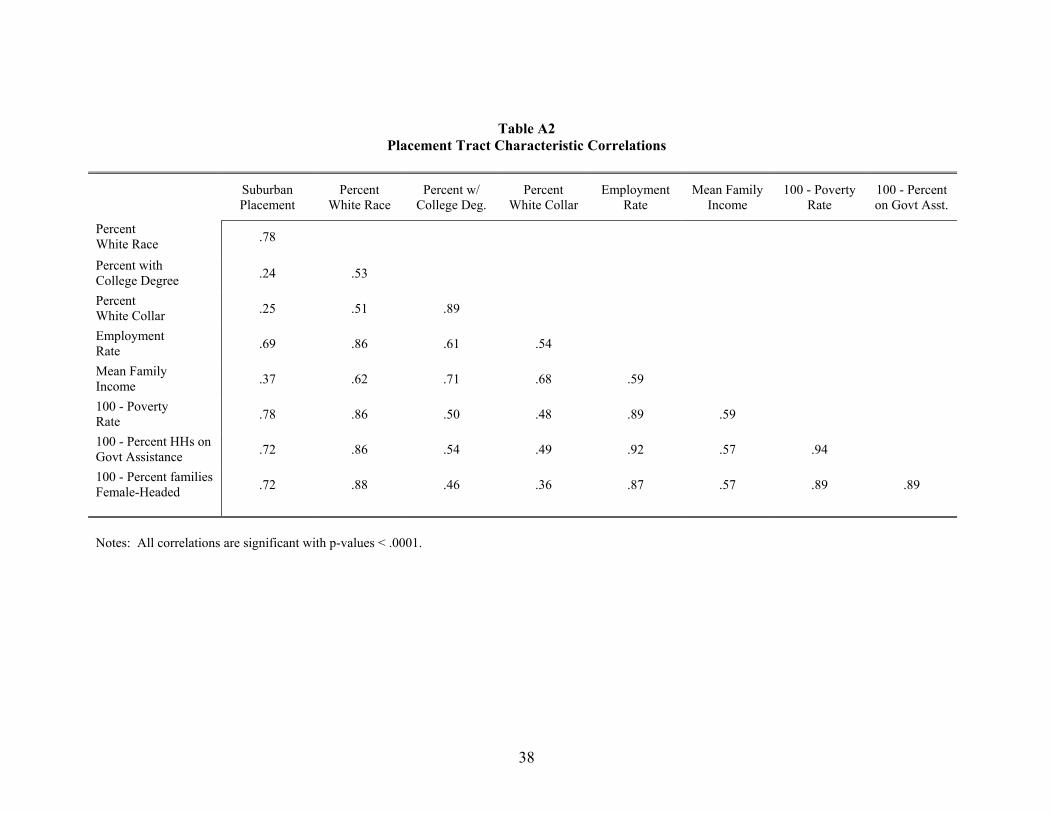
Cook County as a whole. As might be expected, the various characteristics of placement
neighborhoods were highly correlated (shown in Appendix Table A2).
3.2 Mortalities of Male Youth
Mortalities among the sample of male youth were identified through age 35 using the
National Death Index (NDI), a national computerized index of death record information
maintained by the National Center for Health Statistics (NCHS). Identifying information (name,
date-of-birth, and social security number) for the sample was submitted to the NCHS and
matched against the NDI to identify potential mortalities. Death certificates were obtained
directly from the State vital statistics offices to verify mortalities in cases where matches against
the NDI were inconclusive.10
10 We had anticipated some difficulty in identifying mortalities in cases with less than perfect matches against the NDI, but individual inspection comparing information on the death certificates (e.g., birthdate, name of spouse, address) against the Gautreaux records left little doubt which of the NDI matches were “true” and which were not. Nonetheless, the number of mortalities identified in the sample is potentially understated. It is well-known that matching against the NDI typically misses some percentage of actual mortalities, with higher error rates for blacks. Comparing NDI match results against a dataset of cancer patients with known mortality outcome, Calle and Terrell (1993) found that black male mortalities were correctly identified 95 percent of the time that a social security number was available and 86 percent of the time that no social security number was available, compared to 97

10
In all, 60 deaths were observed in our sample, with 53 of these occurring over the ages of
13 through 30. The implied annual mortality rates for our sample are a full order of magnitude
higher than the national mortality rate for black male youth over this period.11 Of the 60 deaths,
more than half (32) were the result of homicide. Another 11 were the result of an automobile (9)
or other accident. Thus, the variation in mortalities across neighborhoods analyzed in the
following section primarily reflects variation in the risk of violent or accidental death as opposed
to variation in exposure to environmental hazards or access to health care.
4. Empirical Analysis
4.1 Neighborhood Selection Analysis
Most previous analyses of the outcomes of Gautreaux participants regarded neighborhood
placements as essentially random, at least during the period in which the Leadership Council
employed a full time real estate staff to assist with placements (before 1990).12 To test this
assertion, we estimated the following OLS regression model over our sample of families
containing at least one male youth:
(1) PlacePctWhitef = αyr + β IntakePctWhitef + δ Xf + ef
percent and 87 percent for the sample as a whole. In our sample of Gautreaux male youth, 30 percent were missing social security numbers. 11 Calculating mortality rates as number of deaths divided by total person-years of post-placement observation time, the mortality rate was 1500 per 100,000 for those age 35 and younger and 2400 per 100,000 for those age 13 through 30. The national average mortality rate for black males ages 15 to 24 over the 1980s was 192.8 per 100,000 (NCHS, 2003). 12 An exception is Keels et al. (2003), who report changes in program administration around 1990 and find a number of correlations between family and placement neighborhood characteristics despite their restricted focus on pre-1990 placements. Both mother’s age and number of children were found to be significantly correlated with characteristics of the placement neighborhood, and numerous characteristics of families’ intake (pre-placement) neighborhoods were found to be significantly correlated with placement neighborhood characteristics.

11
where PlacePctWhitef captures the percent of white residents in a family’s placement tract,
IntakePctWhitef captures the percent of white residents in a family’s intake tract, and Xf
represents a vector of family characteristics. Regression intercepts were allowed to vary by year
of placement. In these regressions, as well as all that follow, the intake and placement tract
variables were constructed to capture tract characteristics in the year of placement, interpolated
(for years 1981 to 1989) and extrapolated (for years prior to 1980 and after 1990) based on data
from the 1980 and 1990 Censuses.13
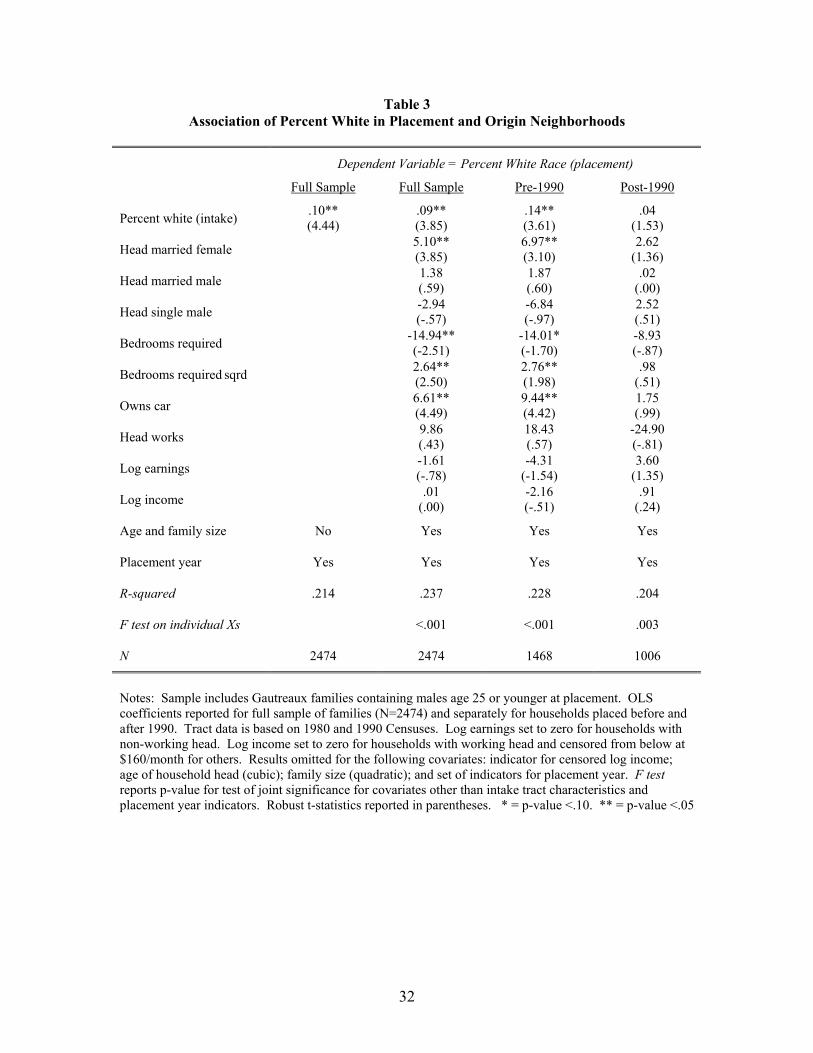
The results of this analysis are presented in Table 3. Columns 1 and 2 estimate the model
with and without inclusion of the family covariates. As shown, the percent white in the family’s
intake tract is a significant determinant of the percent white in the placement tract – a finding
that is robust to the inclusion of the family covariates. PlacePctWhite also increases
significantly for families headed by a married female and those owning cars, and has a
significant convex relationship with number of bedrooms requested.
The fact that car ownership and number of bedrooms requested affect placement comes
as little surprise, as the Leadership Council likely collected such data to assist housing
counselors in finding suitable housing for Gautreaux families. This finding indicates the
importance of controlling for such household characteristics when analyzing the effect of
placement neighborhood characteristics on participant outcomes, as they potentially affect male
youth mortality rates.
The characteristics of families’ intake neighborhoods are the clearest revelation of
residential preferences we have for participating families. If placements were truly made without
respect to families’ preferences, we would expect no relationship between the percent white in
the intake tract and the percent white in the placement tract. Instead, our results strongly suggest
13 Alternative results using 1980 Census tract characteristics were nearly identical to those reported here.

12
that participating families self-selected into placement neighborhoods where they felt more
comfortable.
Given changes that occurred to the Gautreaux program over time, we re-estimated our
model separately for families relocating before and after 1990 to investigate whether the
determinants of neighborhood placement changed substantially when the real estate staff was
eliminated. The results in columns 3 and 4 of Table 3 provide no evidence that self-selection
into “whiter” neighborhoods was less prevalent in the pre-1990 period. In fact, just the opposite
appears to be true, with the coefficient on IntakePctWhite significant and large in the pre-1990
regression, and insignificant and small in the post-1990 regression.
Similar analyses were conducted for each of the other placement neighborhood
characteristics, with the coefficients on the corresponding intake tract characteristics presented in
Table 4. These results are largely consistent with those in Table 3. Using the full sample, we
find that the intake neighborhood characteristic is a significant predictor of the corresponding
placement neighborhood characteristic in six of eight cases, the exceptions being percent of
workers in white collar jobs and mean family income. When the analyses were conducted
separately for pre- and post-1990 placements, we generally find larger coefficients on the intake
characteristic in the pre-1990 period. Only in the case of percent white collar is the intake
coefficient significantly larger in the post-1990 regression.
4.2 Estimation Model for Mortality Analysis
We analyzed the effect of placement neighborhood characteristics on the post-placement
mortality rates of male youth using the following Cox Proportional Hazard specification:
(2) λ(Agei, Xi) = exp(Xiβ) λ0(Agei)

13
where λ0(Agei) represents the (nonparametric) baseline mortality hazard at a particular age and
the vector β captures the proportional effect of each covariate on the baseline mortality rate.
Each Cox regression includes a single placement neighborhood characteristic. Placement
neighborhood characteristics were modified when necessary so that higher values correspond to
more-advantaged placement neighborhoods. Thus, the estimated βs capture the proportional
effect of an “improvement” in the neighborhood characteristic on the post-placement mortality
rate.
Due to the high degree of colinearity among our placement tract characteristics and the
relatively low “failure” (i.e., mortality) rate, attempts to measure the marginal contribution of
individual neighborhood characteristics proved unsuccessful. Our analysis detects the
neighborhood characteristics that are the most strongly related to post-placement mortality, but
cannot determine the independent contribution of each characteristic.
Our empirical strategy reflects the findings of our selection analysis, which indicate that
placement neighborhood characteristics under Gautreaux were independent of neither the
families’ characteristics nor the characteristics of the families’ intake neighborhoods. These
results strongly caution against analyzing the effects of placement neighborhood on subsequent
outcomes as if placements were randomly assigned. Failure to control for observed family
characteristics will lead to biased estimates of the neighborhood effects on male youth mortality
to the extent that such characteristics affect both neighborhood placement and male youth
mortality rates. We deal with this issue in a straightforward way by controlling for family
characteristics in our empirical model.
The fact that placement neighborhood characteristics are, in part, determined by intake
neighborhood characteristics presents a more difficult challenge. This finding points to some

14
degree of self-selection by Gautreaux families into neighborhoods possessing characteristics they
prefer. Unobserved preferences for certain neighborhood types potentially affect male youth
mortality rates through mechanisms other than neighborhood choice, leading to bias even after
controlling for family characteristics.
While we cannot directly control for unobserved neighborhood preferences, we do
observe the characteristics of families’ intake neighborhoods. The intake neighborhood
characteristics are assumed to be reasonable, if noisy, proxies for unobserved neighborhood
preferences. This assumption appears justified given the predictive power of intake
neighborhood characteristics on placement neighborhood characteristics. By additionally
controlling for the characteristics of the intake neighborhood, we can therefore absorb some of
the variance in mortality rates that is related to unobserved preferences for different
neighborhood types. If the estimated neighborhood effects on mortality are affected by inclusion
of intake neighborhood characteristics, it suggests that prior estimates suffer from self-selection
bias. Nor does the inclusion of intake characteristics fully alleviate such bias, since the intake
characteristics are only noisy proxies for households’ neighborhood preferences. However, if the
estimates are robust to the inclusion of the intake neighborhood characteristics, this strongly
suggests the estimates do not suffer from self-selection bias to any substantial degree.
In interpreting the results in this paper, it is important to keep in mind that we focus on
the placement neighborhood and its effects on male youth mortality. After living in one’s
placement community for one year, Gautreaux families were free to relocate without restrictions
and still retain their housing voucher. As such, the actual neighborhood of residence could have
changed over the period of analysis, especially if Gautreaux families felt uncomfortable in their
original placement neighborhoods (Clark, 1991). For interpreting our findings, this is an
15
important consideration. For instance, a weak association between mortality rates and the
percent white in placement neighborhoods might result if families placed in predominantly white
tracts were less likely to remain. Even if such relocations are prevalent, our findings are relevant
for policy makers because policies that influence where assisted families move are probably
more politically feasible than policies that force families to stay in assigned neighborhoods.
Moreover, evidence suggests that initial Gautreaux placements had an enduring effect on
the neighborhoods Gautreaux families resided in many years later. Analyzing a random sample
of 1506 Gautreaux families an average of 14 years after placement, DeLuca and Rosenbaum
(2003) find that families continued to live in neighborhoods with characteristics surprisingly
similar to the original placement neighborhoods. The only neighborhood characteristic that
changed substantially from placement was the percent black, though families on the whole
remained in neighborhoods that were more racially integrated than they did prior to moving.
DeLuca and Rosenbaum also find that the percent black in placement neighborhoods was
strongly predictive of the percent black in the families’ most recent neighborhoods, even after
controlling for household and intake neighborhood characteristics. In the same vein, Keels et al.
(2003) find strong correlations between the racial composition and income levels of families’
placement neighborhoods and their most recent neighborhoods.
4.3 Results for Mortality Analysis
Two versions of our mortality hazard model were estimated, following the male youth
from time of placement to time of mortality or censoring. All observations are censored if the
person was still alive as of 12/31/1999 (the latest date on which mortalities could be identified).
The first version of our model follows males (post-placement) through age 35. Since post-

16
placement mortalities were concentrated over the ages 13 through 30 (53 of 60), the second
version follows males over this age range.
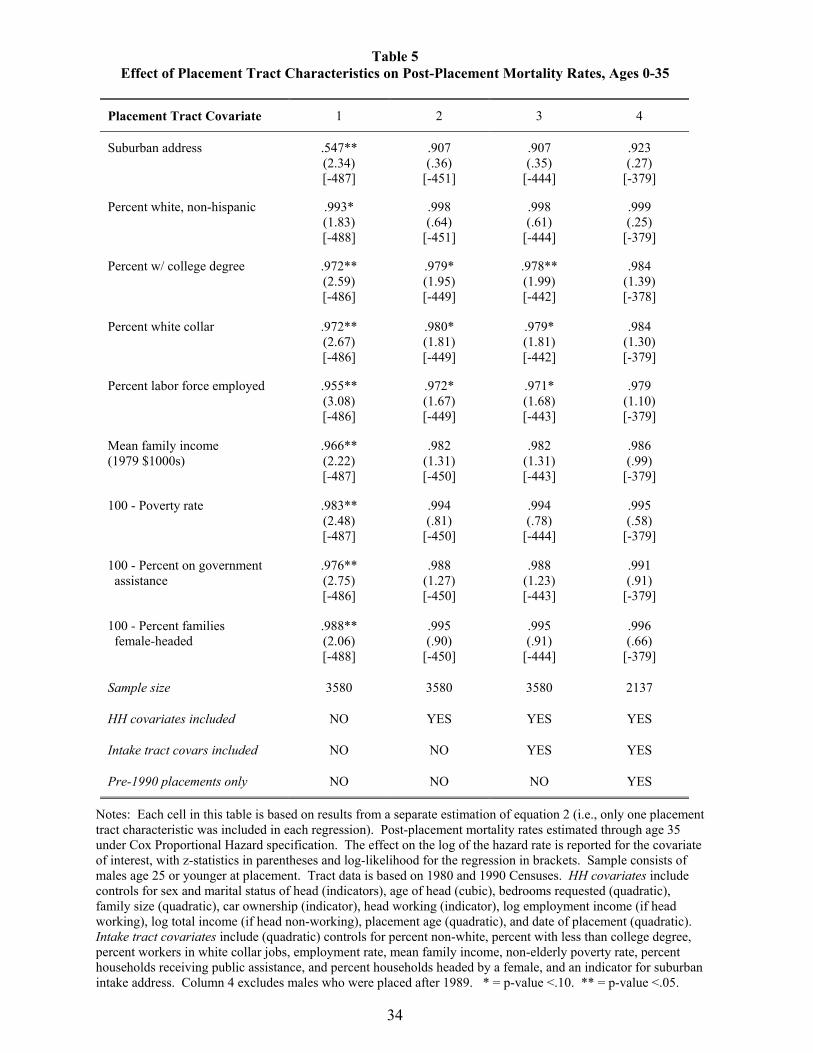
Table 5 presents estimates of the mortality hazard model through age 35. Each cell in
each column presents the coefficient of interest from a separate Cox regression. As shown in
column 1, each of the placement tract characteristics is significantly related to post-placement
mortality rates when no other covariates are included. However, after including family
characteristics as covariates (column 2), only three of the placement tract characteristics remain
(weakly) significant predictors of mortality: percent with college degree, percent white collar
and employment rate. In the cases of percent with college degree and percent white collar, a one
percentage point increase is associated with about a two percent decrease in the mortality rate. A
one percentage point increase in the employment rate is associated with a 2.8 percent decrease in
the mortality rate.
We test the robustness of these estimates to unobserved preferences for neighborhood
type in column 3 by including additional covariates capturing characteristics of the intake
neighborhood. These covariates include a dummy variable for suburban intake neighborhoods
and second-order (quadratic) controls for the eight other intake neighborhood characteristics.
The three significant findings are robust to the inclusion of the intake characteristics, even
growing slightly in magnitude, suggesting that these results are not driven by unobserved
variation in neighborhood preferences. The effect on the remaining estimates is also minimal.
Since previous research has concentrated on placements occurring before 1990, we
restrict our sample to pre-1990 placements in column 4. Doing so modestly attenuates most of
the estimated coefficients, while the sample size reduction substantially reduces the precision of
the estimates.
17
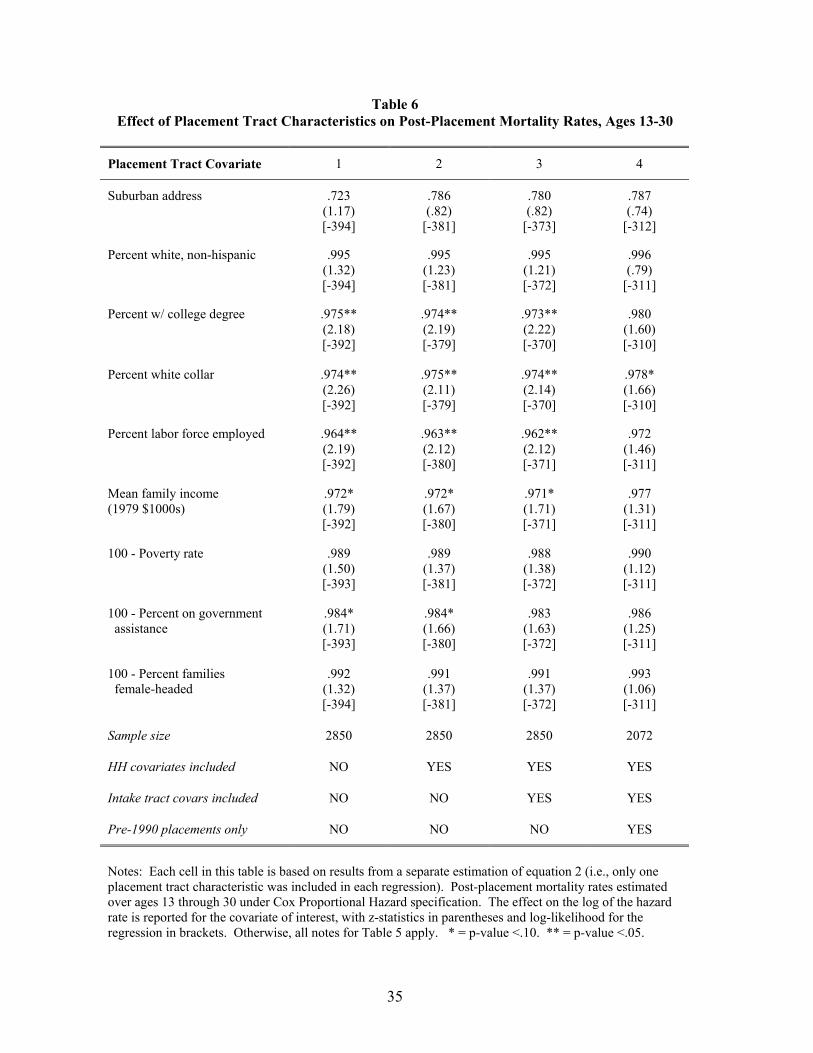
Table 6 reports similar estimates for males followed over the ages 13 through 30. These
results provide somewhat stronger evidence that neighborhood characteristics affected post-
placement mortality rates of the male youth. Excluding all other covariates (see column 1), we
estimate significant coefficients for percent with college degree, percent white collar, and
employment rate, and weakly significant coefficients for mean family income and percent on
government assistance. In each case, the estimates are robust to the inclusion of family
characteristics (column 2) and intake characteristics (column 3), even growing modestly in
magnitude.14 Again, the robustness of these estimates to the inclusion of the intake
characteristics strongly suggests that they are not merely artifacts of self-selection bias, but that
neighborhood characteristics do in fact affect post-placement mortality. Restricting the sample
to males placed before 1990 again attenuates most of these estimates modestly, but the
coefficient on the percent white collar remains weakly significant.
Since the majority of observed mortalities in our sample were due to homicide, we also
investigated the effect of placement neighborhood characteristics on post-placement homicide
rates. Specifically, we re-estimated our original version of equation (2) treating non-homicide
mortalities as random censoring events. The main results from this analysis are included as
Appendix Table A3. We find that the effect magnitudes are slightly larger across all
characteristics in homicide model relative to the all-cause mortality model. The most noteworthy
results pertain to the estimated effect of mean family income, which roughly doubles in
magnitude relative to the all-cause mortality estimates.
We also estimated alternative versions of equation (2) to investigate potential non-
linearity in the neighborhood effects on all-cause mortality. For each placement tract
14 The coefficient on the percent not receiving government assistance just misses significance at the 10 percent level when intake characteristics are included, but is nonetheless stronger than in the previous two models.

18
characteristic, the continuous covariate was replaced with “high” and “low” indicator variables,
corresponding to the upper and lower third of the distribution for that characteristic in our
sample. The main results from this analysis are included as Appendix Table A4. Significant
coefficients were only estimated for the “high” category of percent with college degree, percent
white collar, and percent not receiving government assistance, while no significant coefficients
were estimated for the “low” category indicators. These results suggest that relocations to
substantially better neighborhoods led to substantial reductions in mortality rates, while
relocations to modestly better neighborhoods led to fairly modest reductions, if any.
Together, these results provide compelling evidence that relocating to more-advantaged
neighborhoods reduced post-placement mortality rates for male youth participating in Gautreaux.
It is important to reiterate that the estimates presented here do not indicate the independent effect
of a given placement characteristic, as neighborhoods that are more advantaged along one
dimension are generally more advantaged along a number of dimensions. Nonetheless, we can
conclude that certain neighborhood characteristics (e.g., percent with college degree, percent
white collar, and employment rate) are associated with significant and substantial reductions in
male mortality, and these associations do not appear to be driven by selection bias.
4.4 Community Level Predictors of Mortality
Conflicting results from recent MTO studies notwithstanding, it may come as no surprise
that relocating to a “better” neighborhood decreases the mortality rate of poor black male youth.
Have we learned anything particularly noteworthy? One way to answer this question is to
determine whether our analysis provides different implications with respect to the predictors of
black male youth mortality than could be gleaned from a simple community-level analysis.

19
We therefore analyzed the relationships between black male youth mortality rates in
Chicago and the community characteristics in which they lived, looking over a similar period of
time as our Gautreaux analysis. Mortality rates by census tract are unfortunately not available,
but mortality rates within Chicago “community areas” could be estimated using mortality count
data from the Illinois Center for Health Statistics.15 Five-year mortality rates were generated by
community area separately for black males ages 29 and younger in 1980 and for black males
ages 15 through 29 in 1980. Identical Census tract characteristics as those used in the Gautreaux
analysis were aggregated to the community area level to create analogous community area
characteristics. We then regressed each of the estimated mortality rates on each community area
characteristic in OLS regressions.
The results of our community area analysis are presented in Table 7. The proportional
effect implied by each OLS coefficient is reported in brackets for comparability to the
proportional hazard coefficients reported in Tables 5 and 6. For each neighborhood
characteristic, the community area analysis produces stronger and more significant associations
with black male youth mortality rates than those based on our Gautreaux sample. In the case of
local poverty rates, the association with black male youth mortality rates is three to four times
greater in the community area analysis, with large differences also observed for employment
rate, mean family income, percent on government assistance and percent of families female-
headed. Judging by the reported t-statistics, the community area analysis suggests that the local
poverty rate and percent receiving government assistance are the most significant predictors of
black male youth mortality. The estimates for percent with college degree and percent white
collar, while statistically significant, are two of the weakest predictors of black male youth
mortality. These results strike an important contrast with the findings from our Gautreaux
15 Details are provided in the Data Appendix.

20
analysis. The community area analysis suggests that the most important neighborhood predictors
of black male youth mortality are related to neighborhood poverty levels, while our Gautreaux
analysis suggests that the most important neighborhood predictors are related to human capital
and work.
5. Conclusion
Despite assertions that placements under Gautreaux were “quasi-random,” we find
substantial evidence consistent with significant self-selection. Characteristics of a family’s
placement neighborhood were found to be significantly related to both family characteristics and
characteristics of the family’s intake neighborhood. Moreover, the relationship between intake
and placement neighborhood characteristics appears to be no weaker during the period that the
Leadership Council employed a full-time real estate staff to identify available units. These
findings suggest that neighborhood effects estimated under previous analyses should be
interpreted with caution, as estimated effects potentially suffer from omitted variable bias
resulting from the self-selection of participating families into neighborhoods.
Nonetheless, it is clear that Gautreaux had a substantial effect on the neighborhood
characteristics of participating families. While Gautreaux may not have been a “quasi-random
experiment,” it does appear to have induced wide variation in neighborhood characteristics for
participating families. After controlling for a rich set of individual characteristics, we find that
neighborhood characteristics related to human capital and work are significantly associated with
the mortality rate of black male youth in Gautreaux. Importantly, these findings are robust to the
inclusion of flexible controls for characteristics of one’s intake neighborhood, which is a

21
reasonable proxy for a family’s residential preferences. Based on the use of this proxy, the
associations we document do not appear to be driven to any great extent by self-selection bias.
Our finding that placements in “better” neighborhoods reduced male youth mortality in
Gautreaux stands in contrast to recent analyses of neighborhood effects on poor male youth who
participated in MTO. Kling and Liebman (2004) document a negative effect of relocating to a
better neighborhood on the physical health of male youth, and a positive effect on the likelihood
of engaging in risky behaviors (e.g., alcohol, tobacco, and marijuana use). Kling, Ludwig, and
Katz (2004), while finding a short-term reduction in the number of violent arrests among male
youth relocating to better neighborhoods, find an increase in non-violent arrests and self-reported
behavioral problems. MTO and Gautreaux were implemented in different cities and at different
times, so we cannot rule out the possibility that findings from our analysis (or, for that matter, the
MTO analyses) are specific to location and time period. Yet, aside from the short-term reduction
in violent arrests, these findings might have led one to expect increased mortality rates among
Gautreaux male youth relocating to better neighborhoods. Instead, we find the opposite. Even if
moving to better neighborhoods leads to increased behavioral problems and more injuries, it is
nonetheless possible that such neighborhoods shield poor black male youth from mortality risks
specific to homicides or accidents, as about three quarters of the observed deaths in our
Gautreaux sample were due to homicides (53 percent) and accidents (18 percent).
Our findings are also notable for what they say about which neighborhood characteristics
are the most important determinants of mortality rates for black male youth. Specifically, we
find that neighborhood characteristics relating to human capital and work are most strongly
associated with post-placement mortality rates, while neighborhood poverty rates, racial
composition, and female headship rates demonstrate negligible, insignificant associations. This
22
stands in contrast to our analysis of black male mortality rates across Chicago community areas
which identified the local poverty rate as the strongest predictor of mortality.
Since the first evaluations of Gautreaux appeared more than a decade ago, there has been
increased attention on the role that housing policy can play in improving outcomes for families
receiving housing assistance, particularly with regard to policies compelling families to reside in
neighborhoods possessing certain characteristics. In contrast to the goals of Gautreaux
(relocating black families to “whiter” neighborhoods) and MTO (relocating families to lower
poverty neighborhoods), our analysis indicates that directing families to neighborhoods with
stronger human capital and labor force characteristics would be more successful at reducing
mortality among black male youth. While this is only one outcome that policy makers have to
consider, it is nonetheless an important one. Additional research in this vein can hopefully better
illuminate which neighborhood characteristics deserve the most attention in developing housing
programs for the poor.
23
References
Armstrong, D.L., Barnett, E., Casper, M., Wing, S., 1998. Community Occupational Structure, Medical
and Economic Resources, and Coronary Mortality Among U.S. Blacks and Whites, 1980-1988.
Annals of Epidemiology 8 (3), 184-91.
Acevedo-Garcia, D., 2001. Zip Code-Level Risk Factors for Tuberculosis: Neighborhood Environment
and Residential Segregation in New Jersey, 1985-1992. American Journal of Public Health 91
(5), 734-41.
Aneshensel, C.S., Sucoff, C.A., 1996. The Neighborhood Context of Adolescent Mental Health. Journal
of Health and Social Behavior 37 (4), 293-310.
Arias, E., Anderson, R.N., Hsiang-Ching, K., Murphy, S.L., Kochanek, K.D., 2003. Deaths: Final Data
for 2001. National Vital Statistics Reports 52 (3), National Center for Health Statistics,
Hyattsville, MD.
Barr, R.G., Diez-Roux, A.V., Knirsch, C.A., Pablos-Mendez, A., 2001. Neighborhood Poverty and the
Resurgence of Tuberculosis in New York City, 1984-1992. American Journal of Public Health
91 (9), 1487-93.
Bosma, H., van de Mheen, H.D., Borsboom, G.J.J.M., Mackenbach, J.P., 2001. Neighborhood
Socioeconomic Status and All-Cause Mortality. American Journal of Epidemiology 153 (4), 363-
71.
Calle, E.E., Terrell, D.D., 1993. Utility of the National Death Index for Ascertainment of Mortality
Among Cancer Prevention Study II Participants. American Journal of Epidemiology 137 (2),
235-241
Casper, M.L., Barnett, E., Halverson, J.A., Elmes, G.A., Braham, V.E., Majeed, Z.A., Bloom, A.S.,
Stanley, S., 1999. Women and Heart Disease: An Atlas of Racial and Ethnic Disparities in
Mortality. Centers for Disease Control and Prevention, Atlanta.
Clark, W.A.V., 1991. Residential Preferences and Neighborhood Racial Segregation: A Test of the
Schelling Segregation Model. Demography 28 (1), 1-19.
Collins, J.W., David, R.J., 1997. Urban Violence and African-American Pregnancy Outcomes: An
Ecological Study. Ethnicity and Disease 7 (3), 184-90.
Cubbin, C., LeClere, F.B., Smith, G.S., 2000. Socioeconomic Status and Injury Mortality: Individual and
Neighborhood Determinants. Journal of Epidemiology and Community Health 54 (7), 51-24.
Davis, M., 1993. The Gautreaux Assisted Housing Program, in: Kingsley, G.T., Turner, M.A. (Eds.),
Housing Markets and Residential Mobility. Urban Institute Press, Washington, D.C.
Deaton, A., 2001. Inequalities in Income and Inequalities in Health, in: Bush School Series in the
Economics of Public Policy, vol. 2. University of Chicago Press, Chicago and London.

24
DeLuca, S., Rosenbaum, J.E., 2003. If Low-Income Blacks Are Given a Chance to Live in White
Neighborhoods, Will They Stay? Examining Mobility Patterns in a Quasi-experimental Program
with Administrative Data. Housing Policy Debate 14 (3), 305-45.
Diez-Roux, A.V., Merkin, S.S., Arnett, D., Chambless, L., Massing, M., Neito, F.J., Sorlie, P., Szklo, M.,
Tyroler, H.A., Watson, R.L., 2001. Neighborhood of Residence and Incidence of Coronary Heart
Disease. New England Journal of Medicine 345 (2) 99-106.
Durkin, M.S., Davidson, L.L., Kuhn, L., O’Connor, P., Barlow, B., 1994. Low-Income Neighborhoods
and the Risk of Severe Pediatric Injury: A Small-Area Analysis of Northern Manhattan.
American Journal of Public Health 84 (4), 587-592.
Goering, J., Feins, J.D., Richardson, T.M., 2002. A Cross-Site Analysis of Initial Moving to Opportunity
Demonstration Results. Journal of Housing Research 13 (1), 1-30.
Gorman, B.K., 1999. Racial and Ethnic Variation in Low Birthweight in the United States: Individual
and Contextual Determinants. Health and Place 5 (3), 195-207.
Haan, M., Kaplan, G.A., Camacho, T., 1987. Poverty and Health: Prospective Evidence from the
Alameda County Study. American Journal of Epidemiology 125, 989-98.
Jencks, C., Mayer, S.E., 1990. The Social Consequences of Growing Up in a Poor Neighborhood, in:
Lynn, L.E., McGeary, M. (Eds.), Inner-City Poverty in the United States. National Academy
Press, Washington, D.C.
Keels, M., Duncan, G., DeLuca, S., Mendenhall, R., Rosenbaum, J.E., 2003. Fifteen Years Later: Can
Residential Mobility Programs Provide a Permanent Escape From Neighborhood Segregation,
Crime, and Poverty? Working Paper #330, Joint Center for Poverty Research, Northwestern
University and University of Chicago.
Kling, J.R., Liebman, J.B., Katz, L.F., Sanbonmatsu, L., 2004. Moving to Opportunity and Tranquility:
Neighborhood Effects on Adult Self-Sufficiency and Health from a Randomized Housing
Experiment. Working Paper #481, Industrial Relations Section, Princeton University.
Kling, J.R., Ludwig, J., Katz, L.F., 2004. Youth Criminal Behavior in the Moving to Opportunity
Experiment. Working Paper #482, Industrial Relations Section, Princeton University.
Kling, J.R., Liebman, J.B., 2004. Experimental Analysis of Neighborhood Effects on Youth. Working
Paper #483, Industrial Relations Section, Princeton University.
LeClere, F.B., Rogers, R.G., Peters, K.D., 1998. Neighborhood Social Context and Racial Differences in
Women’s Heart Disease Mortality. Journal of Health and Social Behavior 39 (2), 91-107.
Lurie, N., McLaughlin, C., House, J.S., 2003. In Pursuit of the Social Determinants of Health: The
Evolution of Health Services Research. Health Services Research 38 (6) Part II, 1641-1643.

25
Lynch, J.W., Kaplan, G.A., Pamuk, E.R., Cohen, R.D., Heck, K.E., Balfour, J.L., Yen, I.H., 1998.
Income Inequality and Mortality in Metropolitan Areas of the United States. American Journal of
Public Health 88 (7), 1074-80.
Malmstrom, M., Sundquist, J., Johansson, S.-E., 1999. Neighborhood Environment and Self-Reported
Health Status: A Multi-Level Analysis. American Journal of Public Health. 89 (8), 1181-6.
Matteson, D.W., Burr, J.A., Marshall, J.R., 1998. Infant Mortality: A Multi-Level Analysis of Individual
and Community Risk Factors. Social Science and Medicine 47 (11), 1841-54.
McGinnis, J. M., Foege, W.H., 1993. Actual Causes of Death in the United States. Journal of the
American Medical Association 270 (18), 2207-12.
National Center for Health Statistics, 2003. Table HIST001R. Unpublished, available online at
http://www.cdc.gov/nchs/data/statab/hist001r.pdf.
Popkin, S.J., Rosenbaum, J.E., Meaden, P.M., 1993. Labor Market Experiences of Low-Income Black
Women in Middle-Class Suburbs: Evidence from a Survey of Gautreaux Program Participants.
Journal of Policy Analysis and Management 12 (3), 556-73.
Reading, R., Langford, I.H., Haynes, R., Lovett, A., 1999. Accidents to Preschool Children: Comparing
Family and Neighborhood Risk Factors. Social Science and Medicine 48 (3) 321-30.
Rosenbaum, J.E., 1992. Black Pioneers: Do Their Moves to the Suburbs Increase Economic Opportunity
for Mothers and Children? Housing Policy Debate 2 (4), 1179-1213.
Rosenbaum, J.E., 1995. Changing the Geography of Opportunity by Expanding Residential Choice:
Lessons from the Gautreaux Program. Housing Policy Debate 6 (1), 231-269.
Rosenbaum, J.E., DeLuca, S., 2000. Is Housing Mobility the Key to Welfare Reform? Lessons from
Chicago’s Gautreaux Program. Survey Series. Brookings Institution, Washington, D.C.
Rosenbaum, J.E., Rubinowitz, L.S., 2001. Crossing the Class and Color Lines: From Public Housing to
White Suburbia. University of Chicago Press, Chicago.
Ross, C.E., 2000. Neighborhood Disadvantage and Adult Depression. Journal of Health and Social
Behavior 41 (2), 177-87.
Ross, N.A., Wolfson, M.C., Dunn, J.R., Berthelot, J.-M., Kaplan, G.A., Lynch, J.W., 2000. Relation
Between Income Inequality and Mortality in Canada and the United States: Cross-Sectional
Assessment Using Census Data and Vital Statistics. British Medical Journal 320 (7239), 898-
902.
Subramanian, S.V., Kawachi, I., Kennedy, B.P., 2001. Does the State You Live in Make a Difference?
Multilevel Analysis of Self-Rated Health in the U.S. Social Science and Medicine 53 (1), 9-19.
Waitzman, C.R., Smith, K.R., 1998a. Separate but Lethal: The Effects of Economic Segregation on
Mortality in Metropolitan America, Milbank Memorial Quarterly 76 (3), 341-73.

26
Waitzman, C.R., Smith, K.R., 1998b. Phantom of the Poverty Area: Poverty-Area Residence and
Mortality in the United States. American Journal of Public Health 88 (6), 973-76.
Yen, I.H., Kaplan, G.A., 1999. Poverty Area Residence and Changes in Depression and Perceived Health
Status: Evidence from the Alameda County Study. International Journal of Epidemiology 28 (1),
90-4.
Zierler, S., Krieger, N., Tang, Y., Coady, W., Siegfried, E., DeMaria, A., Auerbach, J., 2000. Economic
Deprivation and AIDS Incidence in Massachusetts. American Journal of Public Health 90 (7),
1064-73.

27
Data Appendix
A1. The Gautreaux Dataset
Electronic and paper files pertaining to all Gautreaux participants were created by the
Leadership Council and provided by the U.S. Department of Housing and Urban Development
for the purpose of this study. Existing electronic datasets created by the Leadership Council
contained participants’ dates of intake and placement, addresses (intake and placement), and
identifying information for each member in the participating household (name, sex, date-of-birth,
and social security number). The data in these computerized files were verified against the
original paper files for accuracy. In addition, the following additional variables were constructed
from the paper files:
• Marital status (from intake sheet)
• Number of bedrooms required (intake sheet)16
• Automobile ownership (intake sheet)
• Employment status (intake sheet)
• Total monthly income (intake sheet)
• Annual employment income (from HUD Form 5005917)
The verification of the electronic data and construction of additional variables was performed
under contract by Microsystems, Inc. of Evanston, IL. In all, the original Gautreaux dataset
consisted of 5374 families with 5393 recorded relocation events. Dropping participants with
multiple recorded placements (19 relocation records18) and restricting the sample to those placed
16 Calculated by Leadership Council staff based on the age and sex composition of the household. 17 Also known as the Owner’s Certification of Compliance with HUD’s Tenant Eligibility and Rent Procedures. 18 A total of 17 families were recorded as having two Gautreaux-related relocations and another family was recorded as having three relocations.

28
between 1976 and 1994 (to allow for sufficient follow-up time) left a remaining sample of 5256
participating families, each with a single relocation record.
Intake and placement addresses were geocoded using Etak® Geocoding Software to
determine address latitude and longitude and 1990 Census tract. The longitude and latitude of
each address were then used to determine the 1980 Census tract containing the address. This
task was accomplished using ArcView® geographic software and a geographic (GIS) dataset of
the 1980 Chicago MSA census tract lines provided by the Joseph R. Regenstein Library and the
University of Chicago.19 Eight records were dropped, either for a missing intake address (1) or
an intake zip outside of IL (7). Another 87 records were dropped because of missing placement
addresses (86) or placement zips outside of IL (1). Finally, another 111 families were dropped
because their intake or placement addresses could not be successfully matched to addresses in
the Etak® database. For 289 intake addresses and 532 placement addresses, matching the
address to an address in the Etak® database required making a small modification to the address,
usually a spelling correction or small adjustment to the street address number.
In 156 cases, the placement tract was identical to the intake tract, and in 104 of these the
intake and placement addresses were identical. Since it seems unlikely that participating in
Gautreaux affected the placement tract in which these families resided, all 156 were dropped,
reducing the sample to 4895 participating families. For the current analysis, we kept only
families containing a male age 25 or younger at the date of placement, leaving a sample of 2474
families with 3580 male youth.
19 Available at www.lib.uchicago.edu/e/su/maps/chigis.html.
29
A2. Estimated Community Area Mortality Rates
At our request, the Illinois Center of Health Statistics provided count data for the number
of mortalities among black male youth over the years 1981 to 1985 in 65 Chicago community
areas. Data were not available for another 12 community areas. The community areas consisted
of 12.4 census tracts, on average. The mortality counts were constructed in two ways.
Mortality_0_29 was constructed by summing mortalities for black males age 29 or younger in
1980. Mortality_15_29 was constructed by summing mortalities for black males ages 15 through
29 in 1980. These variables were used as the numerators in our community area mortality rate
estimates.
To construct the denominator for these estimates, we used population count data from the
1980 Census. The count of black males under age 14 residing in each community area could be
directly calculated by summing over the relevant census tract variables. The count of black
males ages 15 through 29 was inferred by assuming that, within each tract, blacks comprised the
same fraction of males ages 15 to 29 as for males ages 5 to 14.20 Dividing Mortality_0_29 by the
estimated number of black males ages 0 through 29 residing in the community area provided an
estimate of the five-year mortality rate for this group. Dividing Mortality_15_29 by the
estimated number of black males ages 15 through 29 provided a similar mortality rate estimate
for older black male youth. Given that these estimates ignore mobility over the years between
1980 and 1985, and given the necessity of estimating population counts for the older youth, these
mortality rate calculations should only be interpreted as estimates.
20 Population counts by age are not as finely disaggregated for individual racial groups in the Census data, but are given in five-year spans by gender.

30
Table 1 Family and Individual Characteristics
Characteristic Percent / Mean (sd)
Family headed by married female 16.8 %
Family headed by married male 10.0 %
Family headed by single male 1.3 %
Age of family head 30.1 (7.2)
Family head working 23.2 %
Annual employment income if head working (1979 $s) 7166 (2907)
Total monthly income if head not working (1979 $s) 249 (91)
Family owns car 22.8 %
Number of persons in family 3.6 (1.3)
Bedrooms requested 2.7 (0.7)
Placement age of male youth 8.4 (6.0)
Notes: sd = standard deviation. Sample consists of male youth age 25 or younger at placement (N=3580).
31
Table 2 1980 Census Tract Characteristics
Percent / Mean (sd)
Tract Characteristic Intake Address
Placement Address
Cook County
In suburban tract 10.2 % 62.9 % 43.2 % a
Percent white, non-hispanic 13.6 (25.8) 67.5 (33.5) 63.6 (38.5)
Percent adults w/ college degree 7.1 (8.5) 18.6 (12.5) 16.0 (14.4)
Percent workers white collar 32.1 (9.4) 41.2 (12.6) 40.8 (14.2)
Percent labor force employed 81.6 (9.4) 92.4 (5.4) 91.5 (6.5)
Mean family income (1979 $1000s) 15.6 (6.9) 25.1 (8.1) 25.9 (10.5)
Percent non-elderly in poverty 38.1 (23.3) 13.2 (14.5) 13.7 (15.2)
Percent HHs on gov’t assistance 35.6 (22.9) 9.5 (12.0) 11.1 (14.1)
Percent families female-headed 54.6 (22.8) 23.3 (18.7) 24.6 (19.6)
Notes: sd = standard deviation. Statistics for intake and placement address based on sample of all male youth age 25 or younger at placement (N=3580). Statistics for Cook County based on entire county population. a Tract counted as suburban if any part of tract is located outside of the Chicago municipality boundaries.
32
Table 3 Association of Percent White in Placement and Origin Neighborhoods
Dependent Variable = Percent White Race (placement)
Full Sample Full Sample Pre-1990 Post-1990
Percent white (intake) .10** (4.44)
.09** (3.85)
.14** (3.61)
.04 (1.53)
Head married female 5.10** (3.85)
6.97** (3.10)
2.62 (1.36)
Head married male 1.38 (.59)
1.87 (.60)
.02 (.00)
Head single male -2.94 (-.57)
-6.84 (-.97)
2.52 (.51)
Bedrooms required -14.94** (-2.51)
-14.01* (-1.70)
-8.93 (-.87)
Bedrooms required sqrd 2.64** (2.50)
2.76** (1.98)
.98 (.51)
Owns car 6.61** (4.49)
9.44** (4.42)
1.75 (.99)
Head works 9.86 (.43)
18.43 (.57)
-24.90 (-.81)
Log earnings -1.61 (-.78)
-4.31 (-1.54)
3.60 (1.35)
Log income .01 (.00)
-2.16 (-.51)
.91 (.24)
Age and family size No Yes Yes Yes
Placement year Yes Yes Yes Yes
R-squared .214 .237 .228 .204
F test on individual Xs <.001 <.001 .003
N 2474 2474 1468 1006
Notes: Sample includes Gautreaux families containing males age 25 or younger at placement. OLS coefficients reported for full sample of families (N=2474) and separately for households placed before and after 1990. Tract data is based on 1980 and 1990 Censuses. Log earnings set to zero for households with non-working head. Log income set to zero for households with working head and censored from below at $160/month for others. Results omitted for the following covariates: indicator for censored log income; age of household head (cubic); family size (quadratic); and set of indicators for placement year. F test reports p-value for test of joint significance for covariates other than intake tract characteristics and placement year indicators. Robust t-statistics reported in parentheses. * = p-value <.10. ** = p-value <.05

33
Table 4 Association of Placement and Origin Neighborhood Characteristics
Dependent Variable (Placement Tract Characteristic)
Suburban Tract
Percent w/ College Degree
Percent White Collar
Employment Rate
Mean Family Income
Poverty Rate
Percent HHs on Gov’t Assistance
Percent Families Female-Headed
Panel A: Full Sample (N=2724)
Intake Tract Characteristic
1.24** (5.63)
.09** (3.14)
.02 (1.14)
.02** (2.49)
.01 (.55)
.05** (4.72)
.04** (4.16)
.07** (4.68)
R-squared .335 .130 .145 .258 .140 .265 .252 .218 Panel B: Pre-1990 Placements (N=1468)
Intake Tract Characteristic
1.70** (5.91)
.07 (1.60)
-.02 (.56)
.04** (2.71)
.12 (.39)
.07** (4.34)
.06** (4.47)
.12** (4.93)
R-squared .195 .166 .177 .213 .160 .208 .206 .207
Panel C: Post-1990 Placements (N=1006)
Intake Tract Characteristic
.25 (.66)
.11** (2.86)
.06** (2.03)
.01 (.58)
.01 (.38)
.02** (2.03)
.00 (.23)
.02 (.95)
R-squared .477 .073 .084 .248 .067 .249 .223 .158
Notes: Panels A, B, and C correspond to equation 1 as used for Table 3 in columns 2, 3, and 4 respectively -- with each entry in this table based on a separate model estimated using a different placement/origin tract characteristic instead of the fraction white used in Table 3. Sample includes Gautreaux households containing males age 25 or younger at placement. Tract data is based on 1980 and 1990 Censuses. Suburban tract results report coefficients from logit regression (and pseudo R-squared). All other models report OLS coefficients. Robust t-statistics reported in parentheses. * = p-value <.10. ** = p-value <.05
34
Table 5 Effect of Placement Tract Characteristics on Post-Placement Mortality Rates, Ages 0-35
Placement Tract Covariate 1 2 3 4
Suburban address .547** (2.34) [-487]
.907 (.36)
[-451]
.907 (.35)
[-444]
.923 (.27)
[-379]
Percent white, non-hispanic .993* (1.83) [-488]
.998 (.64)
[-451]
.998 (.61)
[-444]
.999 (.25)
[-379]
Percent w/ college degree .972** (2.59) [-486]
.979* (1.95) [-449]
.978** (1.99) [-442]
.984 (1.39) [-378]
Percent white collar .972** (2.67) [-486]
.980* (1.81) [-449]
.979* (1.81) [-442]
.984 (1.30) [-379]
Percent labor force employed .955** (3.08) [-486]
.972* (1.67) [-449]
.971* (1.68) [-443]
.979 (1.10) [-379]
Mean family income (1979 $1000s)
.966** (2.22) [-487]
.982 (1.31) [-450]
.982 (1.31) [-443]
.986 (.99)
[-379]
100 - Poverty rate .983** (2.48) [-487]
.994 (.81)
[-450]
.994 (.78)
[-444]
.995 (.58)
[-379]
100 - Percent on government assistance
.976** (2.75) [-486]
.988 (1.27) [-450]
.988 (1.23) [-443]
.991 (.91)
[-379]
100 - Percent families female-headed
.988** (2.06) [-488]
.995 (.90)
[-450]
.995 (.91)
[-444]
.996 (.66)
[-379]
Sample size 3580 3580 3580 2137
HH covariates included NO YES YES YES
Intake tract covars included NO NO YES YES
Pre-1990 placements only NO NO NO YES
Notes: Each cell in this table is based on results from a separate estimation of equation 2 (i.e., only one placement tract characteristic was included in each regression). Post-placement mortality rates estimated through age 35 under Cox Proportional Hazard specification. The effect on the log of the hazard rate is reported for the covariate of interest, with z-statistics in parentheses and log-likelihood for the regression in brackets. Sample consists of males age 25 or younger at placement. Tract data is based on 1980 and 1990 Censuses. HH covariates include controls for sex and marital status of head (indicators), age of head (cubic), bedrooms requested (quadratic), family size (quadratic), car ownership (indicator), head working (indicator), log employment income (if head working), log total income (if head non-working), placement age (quadratic), and date of placement (quadratic). Intake tract covariates include (quadratic) controls for percent non-white, percent with less than college degree, percent workers in white collar jobs, employment rate, mean family income, non-elderly poverty rate, percent households receiving public assistance, and percent households headed by a female, and an indicator for suburban intake address. Column 4 excludes males who were placed after 1989. * = p-value <.10. ** = p-value <.05.
35
Table 6 Effect of Placement Tract Characteristics on Post-Placement Mortality Rates, Ages 13-30
Placement Tract Covariate 1 2 3 4
Suburban address .723 (1.17) [-394]
.786 (.82)
[-381]
.780 (.82)
[-373]
.787 (.74)
[-312]
Percent white, non-hispanic .995 (1.32) [-394]
.995 (1.23) [-381]
.995 (1.21) [-372]
.996 (.79)
[-311]
Percent w/ college degree .975** (2.18) [-392]
.974** (2.19) [-379]
.973** (2.22) [-370]
.980 (1.60) [-310]
Percent white collar .974** (2.26) [-392]
.975** (2.11) [-379]
.974** (2.14) [-370]
.978* (1.66) [-310]
Percent labor force employed .964** (2.19) [-392]
.963** (2.12) [-380]
.962** (2.12) [-371]
.972 (1.46) [-311]
Mean family income (1979 $1000s)
.972* (1.79) [-392]
.972* (1.67) [-380]
.971* (1.71) [-371]
.977 (1.31) [-311]
100 - Poverty rate .989 (1.50) [-393]
.989 (1.37) [-381]
.988 (1.38) [-372]
.990 (1.12) [-311]
100 - Percent on government assistance
.984* (1.71) [-393]
.984* (1.66) [-380]
.983 (1.63) [-372]
.986 (1.25) [-311]
100 - Percent families female-headed
.992 (1.32) [-394]
.991 (1.37) [-381]
.991 (1.37) [-372]
.993 (1.06) [-311]
Sample size 2850 2850 2850 2072
HH covariates included NO YES YES YES
Intake tract covars included NO NO YES YES
Pre-1990 placements only NO NO NO YES
Notes: Each cell in this table is based on results from a separate estimation of equation 2 (i.e., only one placement tract characteristic was included in each regression). Post-placement mortality rates estimated over ages 13 through 30 under Cox Proportional Hazard specification. The effect on the log of the hazard rate is reported for the covariate of interest, with z-statistics in parentheses and log-likelihood for the regression in brackets. Otherwise, all notes for Table 5 apply. * = p-value <.10. ** = p-value <.05.

36
Table 7 Correlates of Five-Year Mortality Rates in Chicago Community Areas,
Black Males Ages 0-29 and 15-29 in 1980
Age Range of Mortality Rate Variable
Covariate Ages 0-29 in 1980 Ages 15-29 in 1980
Percent white, non-hispanic -.00002 (.85)
[1.00]
-.00007 (1.38) [.99]
Percent w/ college degree -.00010* (1.90) [.99]
-.00025** (2.85) [.97]
Percent white collar -.00013** (2.49) [.98]
-.00032** (3.46) [.96]
Percent labor force employed -.00037** (4.03) [.94]
-.00084** (5.02) [.91]
Mean family income (1979 $1000s)
-.000003** (3.54) [.96]
-.000006** (3.98) [.94]
100 - Poverty Rate -.00017** (5.70) [.97]
-.00035** (6.32) [.96]
100 - Percent on government assistance
-.00017** (4.97) [.97]
-.00036** (5.89) [.96]
100 - Percent families female-headed
-.00012** (3.79) [.98]
-.00026** (4.21) [.97]
Sample size 56 56
Notes: Each cell in this table reports results from a separate, univariate OLS regression model (i.e., only one placement tract characteristic was included in each regression). The dependent variable is a community area’s five-year mortality rate for black males over the age ranges specified (see text for details). Of the original 65 community areas in Chicago, nine were dropped due to black male youth population equal to zero in 1980. Regressions are weighted by the count of black males in the community area used in calculating the mortality rate. Robust t-statistics are in parentheses. Implied proportional mortality risk associated with one unit increase in covariate is reported in brackets. * = p-value <.1. ** = p-value <.05.
37
Table A1 Gautreaux Placements
Placement Year Male Youth (count) Households (count)
1976-1979 44 37
1980 18 15
1981 45 32
1982 52 39
1983 483 315
1984 360 248
1985 323 213
1986 253 172
1987 190 135
1988 147 103
1989 222 159
1990 197 136
1991 247 176
1992 322 243
1993 431 274
1994 246 177
Total 3580 2474
38
Table A2 Placement Tract Characteristic Correlations
Suburban
Placement Percent
White Race Percent w/
College Deg. Percent
White Collar Employment
Rate Mean Family
Income 100 - Poverty
Rate 100 - Percent on Govt Asst.
Percent White Race .78
Percent with College Degree .24 .53
Percent White Collar .25 .51 .89
Employment Rate .69 .86 .61 .54
Mean Family Income .37 .62 .71 .68 .59
100 - Poverty Rate .78 .86 .50 .48 .89 .59
100 - Percent HHs on Govt Assistance .72 .86 .54 .49 .92 .57 .94
100 - Percent families Female-Headed .72 .88 .46 .36 .87 .57 .89 .89
Notes: All correlations are significant with p-values < .0001.

39
Table A3 Effect of Placement Tract Characteristics on Post-Placement Homicide Rates
Homicide Rate Age Range
Placement Tract Covariate Ages 0-35 Ages 13-30
Suburban address .631 (1.15) [-226]
.594 (1.23) [-197]
Percent white, non-hispanic .994 (1.18) [-226]
.992 (1.34) [-197]
Percent w/ college degree .964** (2.10) [-224]
.964** (2.00) [-195]
Percent white collar .973* (1.68) [-225]
.972* (1.67) [-196]
Percent labor force employed .960* (1.79) [-225]
.955** (1.99) [-196]
Mean family income (1979 $1000s) .953* (1.91) [-224]
.946** (2.03) [-195]
100 - Poverty rate .989 (1.03) [-226]
.984 (1.39) [-197]
100 - Percent on government assistance .984 (1.22) [-226]
.979 (1.57) [-196]
100 - Percent families female-headed .990 (1.29) [-226]
.988 (1.44) [-197]
Sample size 3580 2850
Notes: Each cell in this table is based on results from a separate estimation of equation 2 (i.e., only one placement tract characteristic was included in each regression), with non-homicide mortalities treated as random censoring events. Results based on Cox Proportional Hazard specification estimated over the age range specified. The effect on the log of the hazard rate is reported for the covariate of interest, with z-statistics in parentheses and log-likelihood for the regression in brackets. HH covariates and Intake tract covariates included in all models (see Table 5 notes). * = p-value <.10. ** = p-value <.05.
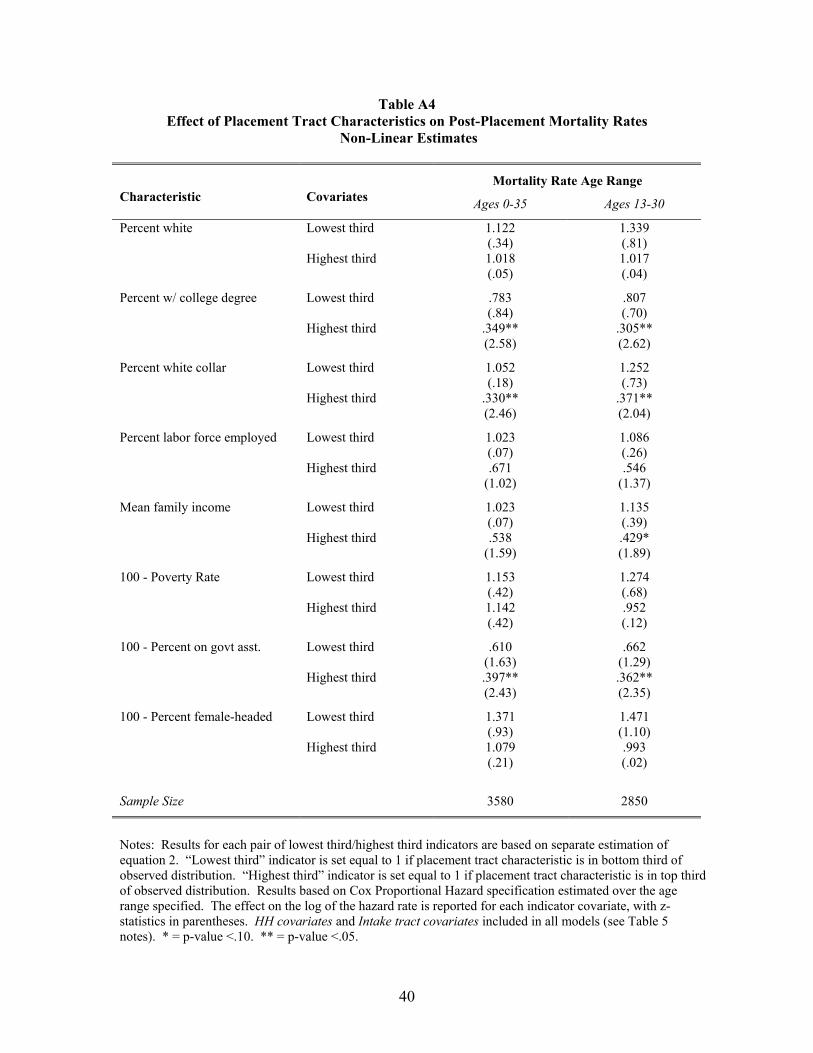
40
Table A4 Effect of Placement Tract Characteristics on Post-Placement Mortality Rates
Non-Linear Estimates
Mortality Rate Age Range Characteristic Covariates Ages 0-35 Ages 13-30
Percent white Lowest third 1.122 (.34)
1.339 (.81)
Highest third 1.018 (.05)
1.017 (.04)
Percent w/ college degree Lowest third .783 (.84)
.807 (.70)
Highest third .349** (2.58)
.305** (2.62)
Percent white collar Lowest third 1.052 (.18)
1.252 (.73)
Highest third .330** (2.46)
.371** (2.04)
Percent labor force employed Lowest third 1.023 (.07)
1.086 (.26)
Highest third .671 (1.02)
.546 (1.37)
Mean family income Lowest third 1.023 (.07)
1.135 (.39)
Highest third .538 (1.59)
.429* (1.89)
100 - Poverty Rate Lowest third 1.153 (.42)
1.274 (.68)
Highest third 1.142 (.42)
.952 (.12)
100 - Percent on govt asst. Lowest third .610 (1.63)
.662 (1.29)
Highest third .397** (2.43)
.362** (2.35)
100 - Percent female-headed Lowest third 1.371 (.93)
1.471 (1.10)
Highest third 1.079 (.21)
.993 (.02)
Sample Size 3580 2850
Notes: Results for each pair of lowest third/highest third indicators are based on separate estimation of equation 2. “Lowest third” indicator is set equal to 1 if placement tract characteristic is in bottom third of observed distribution. “Highest third” indicator is set equal to 1 if placement tract characteristic is in top third of observed distribution. Results based on Cox Proportional Hazard specification estimated over the age range specified. The effect on the log of the hazard rate is reported for each indicator covariate, with z-statistics in parentheses. HH covariates and Intake tract covariates included in all models (see Table 5 notes). * = p-value <.10. ** = p-value <.05.