effects of motor imagery on finger force responses to transcranial magnetic stimulation
TRANSCRIPT
www.elsevier.com/locate/cogbrainres
Cognitive Brain Research 20 (2004) 273–280
Research report
Effects of motor imagery on finger force responses to transcranial
magnetic stimulation
Sheng Li*, Mark L. Latash, Vladimir M. Zatsiorsky
Department of Kinesiology, Pennsylvania State University, University Park, PA 16802, USA
Accepted 11 March 2004
Available online 27 April 2004
Abstract
The purpose of this study was to investigate whether characteristics of finger interaction seen in voluntary finger force production tasks
could also be observed during motor imagery. Transcranial magnetic stimulation (TMS) was applied over the contralateral M1 hand area. Three
conditions were tested in eight young healthy volunteers: At rest, during motor imagery of maximal force production by the index finger (ImIn),
and during motor imagery of maximal force production by all four fingers simultaneously (ImAll). We obtained measures of motor threshold
(MT), motor-evoked potentials (MEP) from the contralateral flexor digitorium superficialis, and TMS-induced forces from individual fingers.
Increased MEP and decreased MT during motor imagery tasks suggested enhanced excitability of structures involved in the generation of
TMS-induced responses. TMS-induced forces were larger during motor imagery tasks than at rest. This effect was present, albeit significantly
smaller, in the middle, ring, and little fingers during ImIn as compared to ImAll. This finding has been interpreted as a correlate of the
phenomenon of unintended finger force production (enslaving). The motor imagery effect on finger forces evoked by TMS was significantly
larger during ImIn (4% MVC) than during ImAll (2.8% MVC) tasks, corresponding to the phenomenon of force deficit. These results provide
direct evidence of the neural origin of the main phenomena of finger interaction. Furthermore, the similarities between characteristics of finger
interaction during motor imagery and during voluntary movement suggest the involvement of similar neural structures (including M1).
D 2004 Elsevier B.V. All rights reserved.
Theme: Motor systems and sensorimotor integration
Topic: Control of posture and movement
Keywords: Motor imagery; Transcranial magnetic stimulation; Finger; Enslaving; Deficit
1. Introduction However, there has been some controversy in the litera-
Motor imagery, i.e., imagining doing a certain movement
without executing them, has been an object of several
research papers [8,12–14,18,19,34,45,46,48–50]. Repeated
evidence in the literature shows that motor imagery shares
features involved in the actual movement, such as involve-
ments of common neural structures [1,3,8], kinematic con-
straints [43], temporal properties [9,43], effects on motor
performances [52], the role in skill acquisition [33] and in
motor recovery after stroke [31,51].
0926-6410/$ - see front matter D 2004 Elsevier B.V. All rights reserved.
doi:10.1016/j.cogbrainres.2004.03.003
* Corresponding author. Sensory Motor Performance Program, Reha-
bilitation Institute of Chicago, Northwestern University, 345 E. Superior St.
Room 1406, Chicago, IL 60611, USA. Tel.: +1-312-238-2227; fax: +1-312-
238-2208.
E-mail address: [email protected] (S. Li).
ture regarding the involvement of the primary motor cortex
(M1) during motor imagery. On one hand, evidence of the
M1 involvement in motor imagery includes reports on focal
enhancement of corticospinal excitability during the appli-
cation of transcranial magnetic stimulation (TMS) over M1
[12,13,15,19] and increased M1 activity revealed in fMRI
experiments [30,36,38]. We use the term ‘‘corticospinal
excitability’’ to refer to the excitability of all the structures
involved in the generation of finger responses to TMS; these
responses may be mediated by the corticospinal tract as well
as by other descending pathways [35]. On the other hand, the
conclusion on an M1 involvement in motor imagery has not
been supported by other neuroimaging studies [10,16,32,47].
Due to its unique and complex peripheral anatomy and
representations in M1, the human hand is an appealing object
to study the physiology of motor imagery. In particular,
S. Li et al. / Cognitive Brain Research 20 (2004) 273–280274
cortical control of the distal hand muscles in monkeys is the
most direct of any of the muscles of the extremities [37].
Finger representations in M1 are highly interconnected [42].
Convergence and divergence of des-cending pathways as
well as widespread finger representations lead to an exten-
sive activity in the cortical network, even during a single-
finger movement [41]. A few characteristics of finger inter-
action during multi-finger voluntary force production have
been attributed to this complex organization—unfortunately,
without a direct proof of the hypothesis [4,23,26,29]. When a
finger produces force, other uninstructed fingers also pro-
duce forces. The phenomenon, named enslaving, has been
repeatedly observed during voluntary contraction tasks at
maximal [20,21,25,54], moderate [44], and low levels
[20,21]. Another characteristic is force deficit: a finger
produces less peak force during a multi-finger task than
during its single-finger maximal voluntary contraction
(MVC) task [24]. Enslaving and force deficit have been
interpreted as reflecting both the peripheral design of the
hand muscles and their neural control [53].
Within this study, we accept a hypothesis that motor
imagery and actual movements involve common neural
structures, including M1. In particular, if phenomena of
force deficit and enslaving are predominantly defined by
neural factors the phenomena are expected to be revealed in
responses of fingers to TMS applied over the contralateral
M1 area during motor imagery. Specifically, motor imagery
of an action by a finger should be reflected in TMS-induced
responses of other fingers (cf. enslaving) and larger effects
on TMS-induced finger responses during motor imagery of
a one-finger MVC than during imagery of a four-finger
MVC (cf. force deficit). Alternatively, if these phenomena
are crucially dependent on the peripheral factors, such as the
presence of multi-digit muscles and connective tissue inter-
digit connections, they are not expected to be reflected in
modulation of TMS-induced finger force responses during
motor imagery.
2. Materials and methods
2.1. Subjects
Eight healthy volunteers, all males, participated in the
experiments. All of them were right-handed according to
their preferential use of the right hand during writing and
eating. The age of the subjects was 27F 4 (meanF S.D.)
years. Their weight was 80.3F 15.5 kg, and their height was
1.79F 0.11 m. All the subjects gave informed consent
according to the procedures approved by the Office for
Regulatory Compliance of the Pennsylvania State University.
2.2. Apparatus
During testing, the subject was seated in a chair in front of
a testing table. Two upper limbs were symmetrical with
respect to the body midline with the upper arms at approx-
imately 45j of abduction in the frontal plane and 45j of
flexion in the sagittal plane, elbow joints at approximately
135j of flexion. The right hand and fingers were positioned
and stabilized into a suspension device for force measure-
ment using four unidirectional piezoelectric force sensors
(208A03, PCB Piezotronics, Depew, NY) (cf. Ref. [23]). The
resolution of sensors was 2.714 mN/byte. In the suspension
device, the sensors were each connected in series with wire
cables that were suspended by swivel attachments from slots
in the top plate of the inverted U-shaped frame. The rubber-
coated loops, located at the bottom of each wire, were placed
in the middle of the distal phalanxes. Due to the employed
experimental procedure, all four-finger forces were parallel.
A hand-fixation device was located at the bottom of the
frame and used to stabilise the palm of the hand and to ensure
a constant hand configuration throughout the experiment
(the wrist was fixed at approximately 20j of extension and
the fingers were positioned so that there was also approxi-
mately 20j of flexion at the metacarpophalangeal joints).
The left forearm and hand rested on the testing table at the
same height as the right forearm.
2.3. EMG recordings
Bipolar electromyographic (EMG) recordings from the
flexor digitorum superficialis (FDS) of the right forearm
were obtained from pairs of disposable surface electrodes
placed over the muscle belly. The diameter of each
electrode was 1 cm, the distance between the centres of
two electrodes within a pair was 3 cm. The EMG signals
were amplified, high pass filtered at 10 Hz and low pass
filtered at 500 Hz. The signal from the right forearm was
displayed on-line on the monitor. EMG signals were set
at a high gain (25 AV per division) to ensure complete
EMG silence during the experiment.
2.4. Magnetic stimulation of the brain
The method and procedures of application of TMS was
the same as previously described (cf. Ref. [7]). Briefly, focal
TMS was performed with a figure-of-8-shaped stimulation
coil (mean diameter of each wing 45 mm) connected to a
Magstim 200 magnetic stimulator with the maximal mag-
netic field strength of 2.2 Tesla (Magstim, UK). A tight
elastic cap was placed on the subject’s head. A grid of 1�1
cm was marked on the left side of the scalp, with its centre
positioned 2 cm to the left of Cz. The intersection of the
coils was placed tangentially to the center of the grid with
the handle pointing backward and laterally at a 45j angle
away from the midline. In this way, the current induced in
the neural tissue was directed approximately perpendicular
to the line of the central sulcus in a direction parallel to the
mid-line between the two coils and therefore optimal for
activating the corticospinal pathways transsynaptically [2].
First, the stimulus intensity was set at 60% of the stimulator
S. Li et al. / Cognitive Brain Res
output, and an optimal position for eliciting the largest
increment in the total force of all fingers that was stable
in three consecutive trials was found by moving the coil
over the scalp in steps of 1 cm. The optimal position was
then marked with a pen to ensure constant positioning of the
coil throughout the experiment. Keeping the coil at the
optimal location, the intensity of the stimulation was slowly
decreased until the motor threshold (MT) was found. The
MT was defined as the lowest stimulus capable of evoking
at least three of six motor-evoked potentials (MEPs) with
the amplitude of at least 50 AV for both the rest condition
and the conditions of motor imagery (see below). The coil
position and orientation was ensured with double-sided
adhesive tape; besides, at all times, the coil position was
stabilized by an experimenter.
A Gateway 450 MHz computer was used for data
acquisition and processing. All signals were sampled at
1000 Hz by a 16-bit A/D board using LabView software
(National Instrument).
2.5. Procedures
During the experiment, the instruction for motor imag-
ery was to mentally press down with the intended finger(s)
as hard as possible (MVCI). Subjects were asked to
practice this mental task for a few minutes prior to testing
to ensure that they are able to keep the EMG silent during
motor imagery. EMG silence was defined as the absence of
any background activity at the sensitivity of 25 AV per
division. Three experimental conditions were investigated:
(1) Rest: the absence of motor imagery; (2) ImIn: motor
imagery of MVCI by the right index finger only; (3)
ImAll: motor imagery of MVCI by all four fingers of the
right hand simultaneously. At the end of the experiment,
subjects were asked to produce MVCs at the fingertips
using the index finger only and using all four fingers
simultaneously. The highest peak value from three trials
was considered as MVC forces for the index finger and
four-finger tasks, respectively.
The subject was asked to start to imagine pressing
finger down as hard as possible after a verbal command
and sustain this condition until a TMS stimulus was
delivered (unexpectedly, within 3 s). Then the subject
was instructed to relax. Due to the employed high resolu-
tion of EMG/force sensing systems, deviation of EMG and
force signals from the background levels due to the
slightest movement of individual fingers was able to be
detected by the sensing systems during the experiment.
Such trials, if happened, were discarded by the experi-
menter to ensure motor imagery tasks purely imagined.
The stimulation intensity was the same for the rest and
motor imagery conditions at 150% of the resting MT
(rMT), on average 60.9% of the stimulator output. The
order of conditions was randomized. Five trials were
conducted for each condition. The interval between two
consecutive trials was approximately 15 s.
2.6. Data processing
Changes in individual and combined finger forces
were used as the main indices to evaluate the effects
of TMS and motor imagery, while EMG signals were
used to monitor the background activity during motor
imagery tasks and to quantify changes in the cortico-
spinal excitability.
Two parameters were calculated from the measured
finger forces—TMS-induced force increments (DF) and
changes in DF due to the motor imagery (DFIMAG). The
former index (DF) for a finger was defined as the
difference between its force at the time of peak force
response to TMS of all fingers and its background force,
defined as the mean force from � 100 ms to the moment
of TMS application (t0 = 0 ms). This index was also
calculated for all four fingers, DFTOTAL=SDFi (i = I, M,
R, and L—the index, middle, ring, and little fingers,
respectively), for the index finger (DFINDEX), and for
the three other fingers DFMRL=SDFi (i =M, R, and L).
To quantify effects of motor imagery on DF indices
during different motor imagery tasks, DF at rest was
subtracted from DF during a motor imagery test resulting
in a DFIMAG index. DF was expressed in absolute units
(N). DFIMAG was expressed in percent with respect to the
peak force value (MVC) observed in its corresponding
voluntary task. The normalized DFIMAG was used to
compare the motor imagery effect for different imagery
tasks. The latency of TMS-induced force responses was
defined as the time interval between the application of the
stimulation and the time when the total force exceeded
two standard deviations (S.D.) of its background value,
i.e., the weight of fingers (offset to zeros).
The EMG signal was rectified and low-pass filtered at
100 Hz using a second-order, zero-lag Butterworth filter.
The background EMG (EMGBG) was defined as the mean
rectified, filtered EMG calculated from � 100 ms to the
moment of TMS application. The MEP latency was
computed as the time it took the baseline EMG to increase
by 2 S.D. The size of the MEP was defined as the
difference between the peak EMG in the rectified signal
and EMGBG. The MEP size was expressed in arbitrary
units (AU). Both the force and EMG indices were aver-
aged across five trials for each condition. Other data
processing techniques were similar to those described
earlier [7].
2.7. Statistics
The data in the text are presented as means while figures
show means and standard error bars. Repeated-measures
ANOVAs were used with a factor CONDITION (three
levels, Rest, ImIn, and ImAll). Whenever necessary, post
hoc Tukey’s honest significant difference tests were used to
compare the various levels of the factors. Paired Student’s t-
test was also used.
earch 20 (2004) 273–280 275
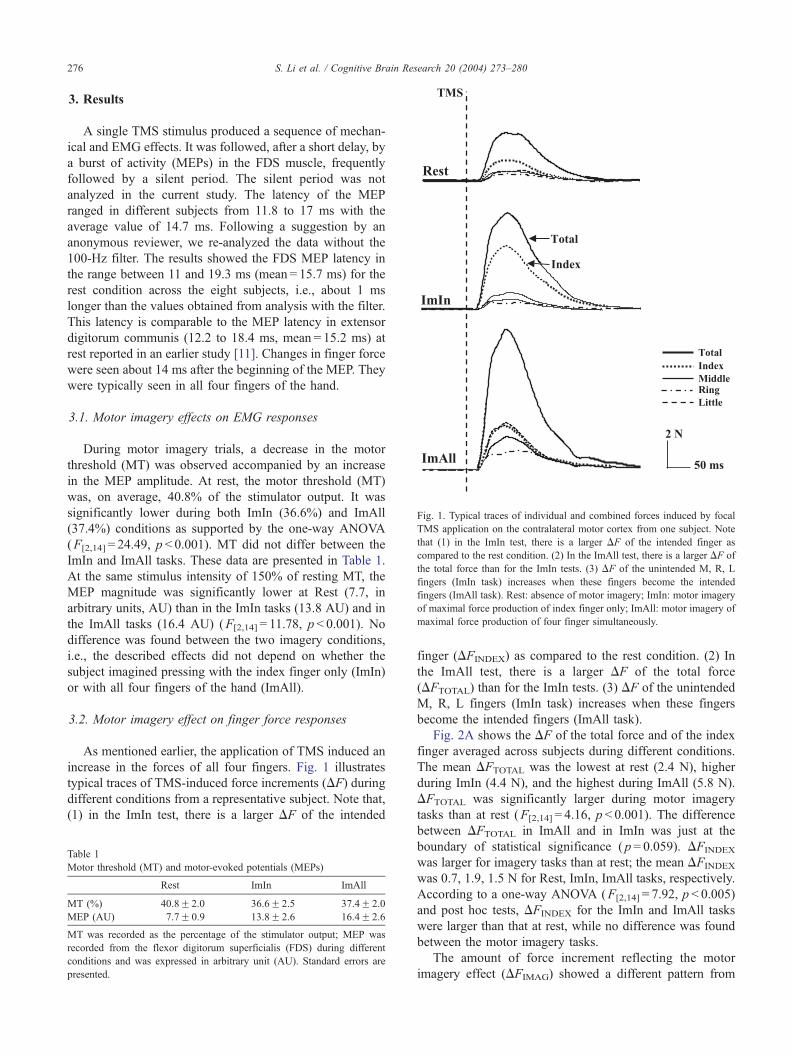
Fig. 1. Typical traces of individual and combined forces induced by focal
TMS application on the contralateral motor cortex from one subject. Note
that (1) in the ImIn test, there is a larger DF of the intended finger as
compared to the rest condition. (2) In the ImAll test, there is a larger DF of
the total force than for the ImIn tests. (3) DF of the unintended M, R, L
fingers (ImIn task) increases when these fingers become the intended
fingers (ImAll task). Rest: absence of motor imagery; ImIn: motor imagery
of maximal force production of index finger only; ImAll: motor imagery of
maximal force production of four finger simultaneously.
S. Li et al. / Cognitive Brain Research 20 (2004) 273–280276
3. Results
A single TMS stimulus produced a sequence of mechan-
ical and EMG effects. It was followed, after a short delay, by
a burst of activity (MEPs) in the FDS muscle, frequently
followed by a silent period. The silent period was not
analyzed in the current study. The latency of the MEP
ranged in different subjects from 11.8 to 17 ms with the
average value of 14.7 ms. Following a suggestion by an
anonymous reviewer, we re-analyzed the data without the
100-Hz filter. The results showed the FDS MEP latency in
the range between 11 and 19.3 ms (mean = 15.7 ms) for the
rest condition across the eight subjects, i.e., about 1 ms
longer than the values obtained from analysis with the filter.
This latency is comparable to the MEP latency in extensor
digitorum communis (12.2 to 18.4 ms, mean = 15.2 ms) at
rest reported in an earlier study [11]. Changes in finger force
were seen about 14 ms after the beginning of the MEP. They
were typically seen in all four fingers of the hand.
3.1. Motor imagery effects on EMG responses
During motor imagery trials, a decrease in the motor
threshold (MT) was observed accompanied by an increase
in the MEP amplitude. At rest, the motor threshold (MT)
was, on average, 40.8% of the stimulator output. It was
significantly lower during both ImIn (36.6%) and ImAll
(37.4%) conditions as supported by the one-way ANOVA
(F[2,14] = 24.49, p < 0.001). MT did not differ between the
ImIn and ImAll tasks. These data are presented in Table 1.
At the same stimulus intensity of 150% of resting MT, the
MEP magnitude was significantly lower at Rest (7.7, in
arbitrary units, AU) than in the ImIn tasks (13.8 AU) and in
the ImAll tasks (16.4 AU) (F[2,14] = 11.78, p< 0.001). No
difference was found between the two imagery conditions,
i.e., the described effects did not depend on whether the
subject imagined pressing with the index finger only (ImIn)
or with all four fingers of the hand (ImAll).
3.2. Motor imagery effect on finger force responses
As mentioned earlier, the application of TMS induced an
increase in the forces of all four fingers. Fig. 1 illustrates
typical traces of TMS-induced force increments (DF) during
different conditions from a representative subject. Note that,
(1) in the ImIn test, there is a larger DF of the intended
Table 1
Motor threshold (MT) and motor-evoked potentials (MEPs)
Rest ImIn ImAll
MT (%) 40.8F 2.0 36.6F 2.5 37.4F 2.0
MEP (AU) 7.7F 0.9 13.8F 2.6 16.4F 2.6
MT was recorded as the percentage of the stimulator output; MEP was
recorded from the flexor digitorum superficialis (FDS) during different
conditions and was expressed in arbitrary unit (AU). Standard errors are
presented.
finger (DFINDEX) as compared to the rest condition. (2) In
the ImAll test, there is a larger DF of the total force
(DFTOTAL) than for the ImIn tests. (3) DF of the unintended
M, R, L fingers (ImIn task) increases when these fingers
become the intended fingers (ImAll task).
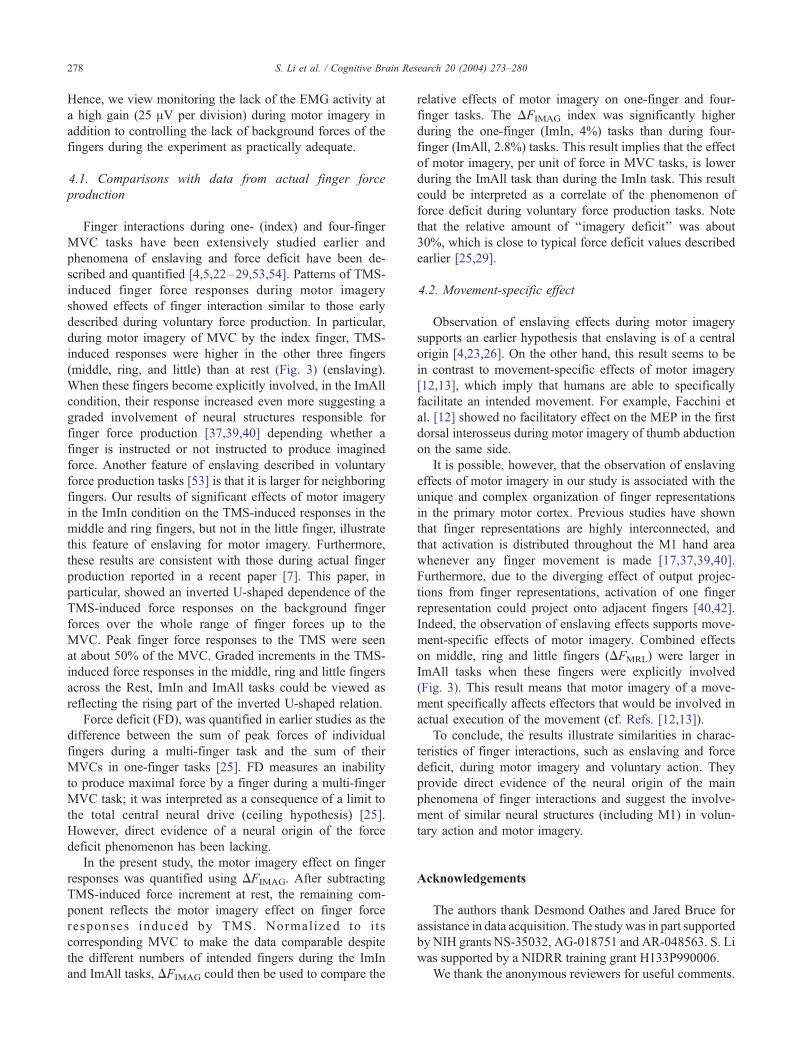
Fig. 2A shows the DF of the total force and of the index
finger averaged across subjects during different conditions.
The mean DFTOTAL was the lowest at rest (2.4 N), higher
during ImIn (4.4 N), and the highest during ImAll (5.8 N).
DFTOTAL was significantly larger during motor imagery
tasks than at rest (F[2,14] = 4.16, p < 0.001). The difference
between DFTOTAL in ImAll and in ImIn was just at the
boundary of statistical significance ( p= 0.059). DFINDEX
was larger for imagery tasks than at rest; the mean DFINDEX
was 0.7, 1.9, 1.5 N for Rest, ImIn, ImAll tasks, respectively.
According to a one-way ANOVA (F[2,14] = 7.92, p < 0.005)
and post hoc tests, DFINDEX for the ImIn and ImAll tasks
were larger than that at rest, while no difference was found
between the motor imagery tasks.
The amount of force increment reflecting the motor
imagery effect (DFIMAG) showed a different pattern from
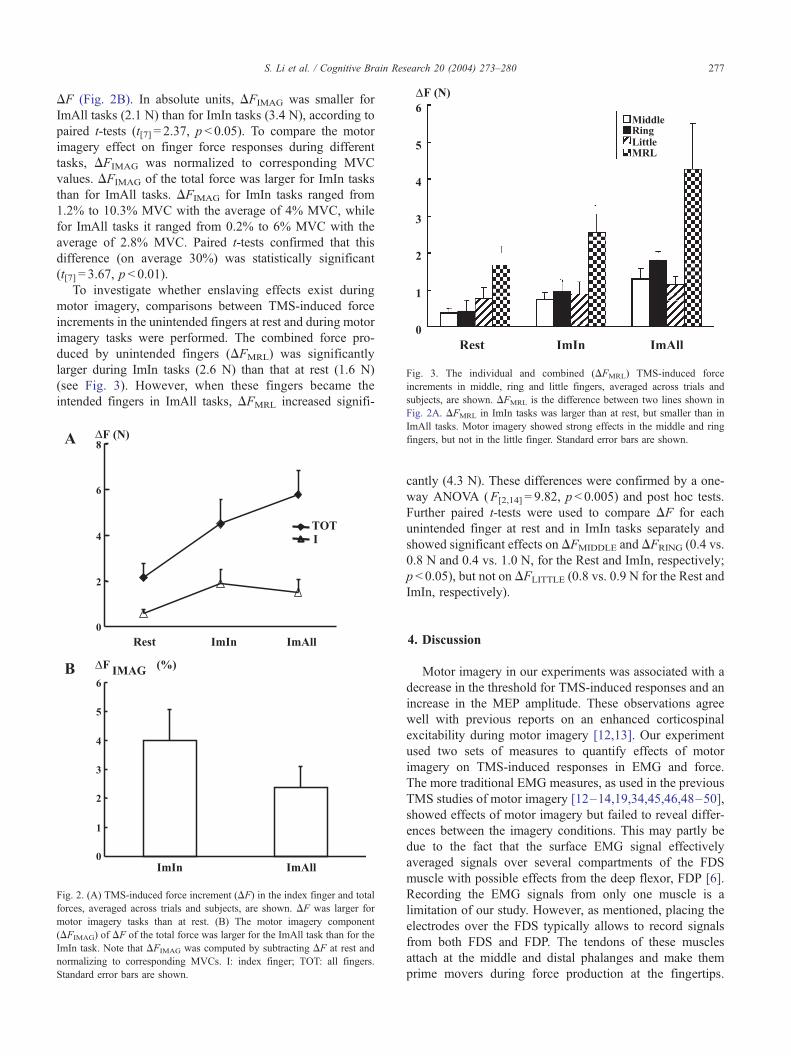
Fig. 3. The individual and combined (DFMRL) TMS-induced force
increments in middle, ring and little fingers, averaged across trials and
subjects, are shown. DFMRL is the difference between two lines shown in
S. Li et al. / Cognitive Brain Research 20 (2004) 273–280 277
DF (Fig. 2B). In absolute units, DFIMAG was smaller for
ImAll tasks (2.1 N) than for ImIn tasks (3.4 N), according to
paired t-tests (t[7] = 2.37, p < 0.05). To compare the motor
imagery effect on finger force responses during different
tasks, DFIMAG was normalized to corresponding MVC
values. DFIMAG of the total force was larger for ImIn tasks
than for ImAll tasks. DFIMAG for ImIn tasks ranged from
1.2% to 10.3% MVC with the average of 4% MVC, while
for ImAll tasks it ranged from 0.2% to 6% MVC with the
average of 2.8% MVC. Paired t-tests confirmed that this
difference (on average 30%) was statistically significant
(t[7] = 3.67, p < 0.01).
To investigate whether enslaving effects exist during
motor imagery, comparisons between TMS-induced force
increments in the unintended fingers at rest and during motor
imagery tasks were performed. The combined force pro-
duced by unintended fingers (DFMRL) was significantly
larger during ImIn tasks (2.6 N) than that at rest (1.6 N)
(see Fig. 3). However, when these fingers became the
intended fingers in ImAll tasks, DFMRL increased signifi-
Fig. 2. (A) TMS-induced force increment (DF) in the index finger and total
forces, averaged across trials and subjects, are shown. DF was larger for
motor imagery tasks than at rest. (B) The motor imagery component
(DFIMAG) of DF of the total force was larger for the ImAll task than for the
ImIn task. Note that DFIMAG was computed by subtracting DF at rest and
normalizing to corresponding MVCs. I: index finger; TOT: all fingers.
Standard error bars are shown.
Fig. 2A. DFMRL in ImIn tasks was larger than at rest, but smaller than in
ImAll tasks. Motor imagery showed strong effects in the middle and ring
fingers, but not in the little finger. Standard error bars are shown.
cantly (4.3 N). These differences were confirmed by a one-
way ANOVA (F[2,14] = 9.82, p< 0.005) and post hoc tests.
Further paired t-tests were used to compare DF for each
unintended finger at rest and in ImIn tasks separately and
showed significant effects on DFMIDDLE and DFRING (0.4 vs.
0.8 N and 0.4 vs. 1.0 N, for the Rest and ImIn, respectively;
p < 0.05), but not on DFLITTLE (0.8 vs. 0.9 N for the Rest and
ImIn, respectively).
4. Discussion
Motor imagery in our experiments was associated with a
decrease in the threshold for TMS-induced responses and an
increase in the MEP amplitude. These observations agree
well with previous reports on an enhanced corticospinal
excitability during motor imagery [12,13]. Our experiment
used two sets of measures to quantify effects of motor
imagery on TMS-induced responses in EMG and force.
The more traditional EMG measures, as used in the previous
TMS studies of motor imagery [12–14,19,34,45,46,48–50],
showed effects of motor imagery but failed to reveal differ-
ences between the imagery conditions. This may partly be
due to the fact that the surface EMG signal effectively
averaged signals over several compartments of the FDS
muscle with possible effects from the deep flexor, FDP [6].
Recording the EMG signals from only one muscle is a
limitation of our study. However, as mentioned, placing the
electrodes over the FDS typically allows to record signals
from both FDS and FDP. The tendons of these muscles
attach at the middle and distal phalanges and make them
prime movers during force production at the fingertips.
S. Li et al. / Cognitive Brain Research 20 (2004) 273–280278
Hence, we view monitoring the lack of the EMG activity at
a high gain (25 AV per division) during motor imagery in
addition to controlling the lack of background forces of the
fingers during the experiment as practically adequate.
4.1. Comparisons with data from actual finger force
production
Finger interactions during one- (index) and four-finger
MVC tasks have been extensively studied earlier and
phenomena of enslaving and force deficit have been de-
scribed and quantified [4,5,22–29,53,54]. Patterns of TMS-
induced finger force responses during motor imagery
showed effects of finger interaction similar to those early
described during voluntary force production. In particular,
during motor imagery of MVC by the index finger, TMS-
induced responses were higher in the other three fingers
(middle, ring, and little) than at rest (Fig. 3) (enslaving).
When these fingers become explicitly involved, in the ImAll
condition, their response increased even more suggesting a
graded involvement of neural structures responsible for
finger force production [37,39,40] depending whether a
finger is instructed or not instructed to produce imagined
force. Another feature of enslaving described in voluntary
force production tasks [53] is that it is larger for neighboring
fingers. Our results of significant effects of motor imagery
in the ImIn condition on the TMS-induced responses in the
middle and ring fingers, but not in the little finger, illustrate
this feature of enslaving for motor imagery. Furthermore,
these results are consistent with those during actual finger
production reported in a recent paper [7]. This paper, in
particular, showed an inverted U-shaped dependence of the
TMS-induced force responses on the background finger
forces over the whole range of finger forces up to the
MVC. Peak finger force responses to the TMS were seen
at about 50% of the MVC. Graded increments in the TMS-
induced force responses in the middle, ring and little fingers
across the Rest, ImIn and ImAll tasks could be viewed as
reflecting the rising part of the inverted U-shaped relation.
Force deficit (FD), was quantified in earlier studies as the
difference between the sum of peak forces of individual
fingers during a multi-finger task and the sum of their
MVCs in one-finger tasks [25]. FD measures an inability
to produce maximal force by a finger during a multi-finger
MVC task; it was interpreted as a consequence of a limit to
the total central neural drive (ceiling hypothesis) [25].
However, direct evidence of a neural origin of the force
deficit phenomenon has been lacking.
In the present study, the motor imagery effect on finger
responses was quantified using DFIMAG. After subtracting
TMS-induced force increment at rest, the remaining com-
ponent reflects the motor imagery effect on finger force
responses induced by TMS. Normalized to i ts
corresponding MVC to make the data comparable despite
the different numbers of intended fingers during the ImIn
and ImAll tasks, DFIMAG could then be used to compare the
relative effects of motor imagery on one-finger and four-
finger tasks. The DFIMAG index was significantly higher
during the one-finger (ImIn, 4%) tasks than during four-
finger (ImAll, 2.8%) tasks. This result implies that the effect
of motor imagery, per unit of force in MVC tasks, is lower
during the ImAll task than during the ImIn task. This result
could be interpreted as a correlate of the phenomenon of
force deficit during voluntary force production tasks. Note
that the relative amount of ‘‘imagery deficit’’ was about
30%, which is close to typical force deficit values described
earlier [25,29].
4.2. Movement-specific effect
Observation of enslaving effects during motor imagery
supports an earlier hypothesis that enslaving is of a central
origin [4,23,26]. On the other hand, this result seems to be
in contrast to movement-specific effects of motor imagery
[12,13], which imply that humans are able to specifically
facilitate an intended movement. For example, Facchini et
al. [12] showed no facilitatory effect on the MEP in the first
dorsal interosseus during motor imagery of thumb abduction
on the same side.
It is possible, however, that the observation of enslaving
effects of motor imagery in our study is associated with the
unique and complex organization of finger representations
in the primary motor cortex. Previous studies have shown
that finger representations are highly interconnected, and
that activation is distributed throughout the M1 hand area
whenever any finger movement is made [17,37,39,40].
Furthermore, due to the diverging effect of output projec-
tions from finger representations, activation of one finger
representation could project onto adjacent fingers [40,42].
Indeed, the observation of enslaving effects supports move-
ment-specific effects of motor imagery. Combined effects
on middle, ring and little fingers (DFMRL) were larger in
ImAll tasks when these fingers were explicitly involved
(Fig. 3). This result means that motor imagery of a move-
ment specifically affects effectors that would be involved in
actual execution of the movement (cf. Refs. [12,13]).
To conclude, the results illustrate similarities in charac-
teristics of finger interactions, such as enslaving and force
deficit, during motor imagery and voluntary action. They
provide direct evidence of the neural origin of the main
phenomena of finger interactions and suggest the involve-
ment of similar neural structures (including M1) in volun-
tary action and motor imagery.
Acknowledgements
The authors thank Desmond Oathes and Jared Bruce for
assistance in data acquisition. The studywas in part supported
by NIH grants NS-35032, AG-018751 and AR-048563. S. Li
was supported by a NIDRR training grant H133P990006.
We thank the anonymous reviewers for useful comments.

S. Li et al. / Cognitive Brain Research 20 (2004) 273–280 279
References
[1] G. Abbruzzese, A. Assini, A. Buccolieri, R. Marchese, C. Trompetto,
Changes of intracortical inhibition during motor imagery in human
subjects, Neurosci. Lett. 263 (1999) 113–116.
[2] J.P. Brasil-Neto, L.G. Cohen, M. Panizza, J. Nilsson, B.J. Roth, M.
Hallett, Optimal focal transcranial magnetic activation of the human
motor cortex: effects of coil orientation, shape of the induced cur-
rent pulse, and stimulus intensity, J. Clin. Neurophysiol. 9 (1992)
132–136.
[3] D.J. Crammond, Motor imagery: never in your wildest dream, Trends
Neurosci. 20 (1997) 54–57.
[4] F. Danion, M.L. Latash, Z.M. Li, V.M. Zatsiorsky, The effect of
fatigue on multifinger co-ordination in force production tasks in
humans, J. Physiol. 523 (Pt. 2) (2000) 523–532.
[5] F. Danion, M.L. Latash, Z.M. Li, V.M. Zatsiorsky, The effect of a
fatiguing exercise by the index finger on single- and multi-finger
force production tasks, Exp. Brain Res. 138 (2001) 322–329.
[6] F. Danion, S. Li, V.M. Zatsiorsky, M.L. Latash, Relations between
surface EMG of extrinsic flexors and individual finger forces support
the notion of muscle compartments, Eur. J. Appl. Physiol. 88 (2002)
185–188.
[7] F. Danion, M. Latash, S. Li, Finger interactions studied with trans-
cranial magnetic stimulation during multi-finger force production
tasks, Clin. Neurophysiol. 114 (2003) 1445–1455.
[8] J. Decety, The neurophysiological basis of motor imagery, Behav.
Brain Res. 77 (1996) 45–52.
[9] J. Decety, M. Jeannerod, C. Prablanc, The timing of mentally repre-
sented actions, Behav. Brain Res. 34 (1989) 35–42.
[10] M.P. Deiber, V. Ibanez, M. Honda, N. Sadato, R. Raman, M. Hallett,
Cerebral processes related to visuomotor imagery and generation of
simple finger movements studied with positron emission tomography,
NeuroImage 7 1998, pp. 73–85.
[11] A.A. Eisen, W. Shtybel, AAEM minimonograph #35: clinical expe-
rience with transcranial magnetic stimulation, Muscle Nerve 13
(1990) 995–1011.
[12] S. Facchini, W. Muellbacher, F. Battaglia, B. Boroojerdi, M. Hallett,
Focal enhancement of motor cortex excitability during motor imag-
ery: a transcranial magnetic stimulation study, Acta Neurol. Scand.
105 (2002) 146–151.
[13] L. Fadiga, G. Buccino, L. Craighero, L. Fogassi, V. Gallese, G.
Pavesi, Corticospinal excitability is specifically modulated by motor
imagery: a magnetic stimulation study, Neuropsychologia 37 (1999)
147–158.
[14] M.M. Filippi, M. Oliveri, P. Pasqualetti, P. Cicinelli, R. Traversa, F.
Vernieri, M.G. Palmieri, P.M. Rossini, Effects of motor imagery on
motor cortical output topography in Parkinson’s disease, Neurology
57 (2001) 55–61.
[15] G. Ganis, J.P. Keenan, S.M. Kosslyn, A. Pascual-Leone, Transcranial
magnetic stimulation of primary motor cortex affects mental rotation,
Cereb. Cortex 10 (2000) 175–180.
[16] E. Gerardin, A. Sirigu, S. Lehericy, J.B. Poline, B. Gaymard, C.
Marsault, Y. Agid, D. Le Bihan, Partially overlapping neural net-
works for real and imagined hand movements, Cereb. Cortex 10
(2000) 1093–1104.
[17] M.C. Hepp-Reymond, Functional Organization of Motor Cortex and
its Participation in Voluntary Movements, Alan R. Liss, New York,
1988, pp. 501–624.
[18] M. Jeannerod, Mental imagery in the motor context, Neuropsycholo-
gia 33 (1995) 1419–1432.
[19] T. Kasai, S. Kawai, M. Kawanishi, S. Yahagi, Evidence for facilitation
of motor evoked potentials (MEPs) induced by motor imagery, Brain
Res. 744 (1997) 147–150.
[20] S.L. Kilbreath, S.C. Gandevia, Limited independent flexion of the
thumb and fingers in human subjects, J. Physiol. 479 (1994)
487–497.
[21] S.L. Kilbreath, R.B. Gorman, J. Raymond, S.C. Gandevia, Distribu-
tion of the forces produced by motor unit activity in the human flexor
digitorum profundus, J. Physiol. 543 (2002) 289–296.
[22] M.L. Latash, I.M. Gelfand, Z.M. Li, V.M. Zatsiorsky, Changes in the
force sharing pattern induced by modifications of visual feedback
during force production by a set of fingers, Exp. Brain Res. 123
(1998) 255–262.
[23] M.L. Latash, S. Li, F. Danion, V.M. Zatsiorsky, Central mecha-
nisms of finger interaction during one- and two-hand force pro-
duction at distal and proximal phalanges, Brain Res. 924 (2002)
198–208.
[24] Z.M. Li, M.L. Latash, K.M. Newell, V.M. Zatsiorsky, Motor redun-
dancy during maximal voluntary contraction in four-finger tasks, Exp.
Brain Res. 122 (1998) 71–78.
[25] Z.M. Li, M.L. Latash, V.M. Zatsiorsky, Force sharing among fingers
as a model of the redundancy problem, Exp. Brain Res. 119 (1998)
276–286.
[26] S. Li, F. Danion, M.L. Latash, Z.M. Li, V.M. Zatsiorsky, Character-
istics of finger force production during one and two-hand tasks, Hum.
Mov. Sci. 19 (2000) 897–924.
[27] S. Li, F. Danion, M.L. Latash, Z.M. Li, V.M. Zatsiorsky, Finger
coordination in multi-finger force production tasks involving fingers
of the right hand and/or fingers of the left hand, J. Appl. Biomech. 16
(2000) 379–391.
[28] S. Li, F. Danion, M.L. Latash, Z.M. Li, V.M. Zatsiorsky, Bilateral
deficit and symmetry in finger force production during two-hand
multifinger tasks, Exp. Brain Res. 141 (2001) 530–540.
[29] S. Li, M.L. Latash, V.M. Zatsiorsky, Finger interaction during multi-
finger tasks involving finger addition and removal, Exp. Brain Res.
150 (2003) 230–236.
[30] M. Lotze, P. Montoya, M. Erb, E. Hulsmann, H. Flor, U. Klose, N.
Birbaumer, W. Grodd, Activation of cortical and cerebellar motor
areas during executed and imagined hand movements: an fMRI study,
J. Cogn. Neurosci. 11 (1999) 491–501.
[31] S.J. Page, P. Levine, S.A. Sisto, M.V. Johnston, Mental practice com-
bined with physical practice for upper-limb motor deficit in subacute
stroke, Phys. Ther. 81 (2001) 1455–1462.
[32] L.M. Parsons, P.T. Fox, J.H. Downs, T. Glass, T.B. Hirsch, C.C.
Martin, P.A. Jerabek, J.L. Lancaster, Use of implicit motor imagery
for visual shape discrimination as revealed by PET, Nature 375 (1995)
54–58.
[33] A. Pascual-Leone, D. Nguyet, L.G. Cohen, J.P. Brasil-Neto, A.
Cammarota, M. Hallett, Modulation of muscle responses
evoked by transcranial magnetic stimulation during the acquisi-
tion of new fine motor skills, J. Neurophysiol. 74 (1995)
1037–1045.
[34] S. Patuzzo, A. Fiaschi, P. Manganotti, Modulation of motor cortex
excitability in the left hemisphere during action observation: a
single- and paired-pulse transcranial magnetic stimulation study
of self- and non-self-action observation, Neuropsychologia 41 (2003)
1272–1278.
[35] T. Paus, R. Jech, C.J. Thompson, R. Comeau, T. Peters, A.C. Evans,
Transcranial magnetic stimulation during positron emission tomogra-
phy: a new method for studying connectivity of the human cerebral
cortex, J. Neurosci. 17 (1997) 3178–3184.
[36] C.A. Porro, M.P. Francescato, V. Cettolo, M.E. Diamond, P. Baraldi,
C. Zuiani, M. Bazzocchi, P.E. di Prampero, Primary motor and sen-
sory cortex activation during motor performance and motor imagery:
a functional magnetic resonance imaging study, J. Neurosci. 16
(1996) 7688–7698.
[37] R. Porter, R.N. Lemon, Corticospinal Function and Voluntary Move-
ment, Clarendon Press, Oxford, 1993.
[38] M. Roth, J. Decety, M. Raybaudi, R. Massarelli, C. Delon-Martin,
C. Segebarth, S. Morand, A. Gemignani, M. Decorps, M. Jean-
nerod, Possible involvement of primary motor cortex in mentally
simulated movement: a functional magnetic resonance imaging
study, NeuroReport 7 (1996) 1280–1284.
[39] M.H. Schieber, Somatotopic gradients in the distributed organization
S. Li et al. / Cognitive Brain Research 20 (2004) 273–280280
of the human primary motor cortex hand area: evidence from small
infarcts, Exp. Brain Res. 128 (1999) 139–148.
[40] M.H. Schieber, Constraints on somatotopic organization in the prima-
ry motor cortex, J. Neurophysiol. 86 (2001) 2125–2143.
[41] M.H. Schieber, Training and synchrony in the motor system, J. Neu-
rosci. 22 (2002) 5277–5281.
[42] M.H. Schieber, L.S. Hibbard, How somatotopic is the motor cortex
hand area? Science 261 (1993) 489–492.
[43] A. Sirigu, L. Cohen, J.R. Duhamel, B. Pillon, B. Dubois, Y. Agid, C.
Pierrot-Deseilligny, Congruent unilateral impairments for real and
imagined hand movements, NeuroReport 6 (1995) 997–1001.
[44] S. Slobounov, J. Johnston, H. Chiang, W. Ray, The role of sub-max-
imal force production in the enslaving phenomenon, Brain Res. 954
(2002) 212–219.
[45] Y.H. Sohn, N. Dang, M. Hallett, Suppression of corticospinal excit-
ability during negative motor imagery, J. Neurophysiol. 90 (2003)
2303–2309.
[46] R. Sparing, F.M. Mottaghy, G. Ganis, W.L. Thompson, R. Topper,
S.M. Kosslyn, A. Pascual-Leone, Visual cortex excitability increases
during visual mental imagery—a TMS study in healthy human sub-
jects, Brain Res. 938 (2002) 92–97.
[47] K.M. Stephan, G.R. Fink, R.E. Passingham, D. Silbersweig, A.O.
Ceballos-Baumann, C.D. Frith, R.S. Frackowiak, Functional anatomy
of the mental representation of upper extremity movements in healthy
subjects, J. Neurophysiol. 73 (1995) 373–386.
[48] C.M. Stinear, W.D. Byblow, Motor imagery of phasic thumb abduc-
tion temporally and spatially modulates corticospinal excitability,
Clin. Neurophysiol. 114 (2003) 909–914.
[49] S. Yahagi, T. Kasai, Motor evoked potentials induced by motor
imagery reveal a functional asymmetry of cortical motor control in
left- and right-handed human subjects, Neurosci. Lett. 276 (1999)
185–188.
[50] S. Yahagi, K. Shimura, T. Kasai, An increase in cortical excitability
with no change in spinal excitability during motor imagery, Percept.
Mot. Skills 83 (1996) 288–290.
[51] E. Yoo, E. Park, B. Chung, Mental practice effect on line-tracing
accuracy in persons with hemiparetic stroke: a preliminary study,
Arch. Phys. Med. Rehabil. 82 (2001) 1213–1218.
[52] G. Yue, K.J. Cole, Strength increases from the motor program: com-
parison of training with maximal voluntary and imagined muscle
contractions, J. Neurophysiol. 67 (1992) 1114–1123.
[53] V.M. Zatsiorsky, Z.M. Li, M.L. Latash, Coordinated force production
in multi-finger tasks: finger interaction and neural network modeling,
Biol. Cybern. 79 (1998) 139–150.
[54] V.M. Zatsiorsky, Z.M. Li, M.L. Latash, Enslaving effects in multi-
finger force production, Exp. Brain Res. 131 (2000) 187–195.