effects of mining on benthic macroinvertebrate … of mining on benthic macroinvertebrate...
TRANSCRIPT

Effects of Mining on Benthic Macroinvertebrate Communities and Monitoring Strategy
By Chester R. Anderson
Chapter E20 ofIntegrated Investigations of Environmental Effects of Historical Mining in the Animas River Watershed, San Juan County, ColoradoEdited by Stanley E. Church, Paul von Guerard, and Susan E. Finger
Professional Paper 1651
U.S. Department of the InteriorU.S. Geological Survey

Contents
Abstract .......................................................................................................................................................853Introduction.................................................................................................................................................853
Purpose and Scope ..........................................................................................................................854Acknowledgments ............................................................................................................................854
Methods.......................................................................................................................................................854Results .........................................................................................................................................................859
Macroinvertebrate Communities in Reference Tributaries .......................................................859Taxa Richness and Densities of Specific Taxa in the Animas River .........................................859Evenness of Taxa in the Animas River ...........................................................................................861Similarity Among Animas River and Reference Tributary Sites ................................................861
Discussion ...................................................................................................................................................861Proposed Sampling Plan and Analysis ..................................................................................................863
Pre-Remediation Baseline Sampling .............................................................................................863Post-Remediation Sampling ............................................................................................................865Statistical Analysis to Assess Effectiveness of Remediation ...................................................865
Summary......................................................................................................................................................871References Cited........................................................................................................................................871Appendix. 1997 pre-remediation baseline data (mean number of taxa per square meter)
[included as file on accompanying CD-ROM; Sole and others, this volume, Chapter G]
Figures 1. Map showing sample sites in Animas River watershed study area ................................855 2. Map showing sample sites from study area south to Colorado State line .....................856 3–8. Diagrams showing: 3. Number of invertebrate taxa in the major stream Orders (stoneflies,
mayflies, true flies, caddis flies, beetles, non-insects) ...............................................860 4. Densities (number of individuals per square meter) of taxa within
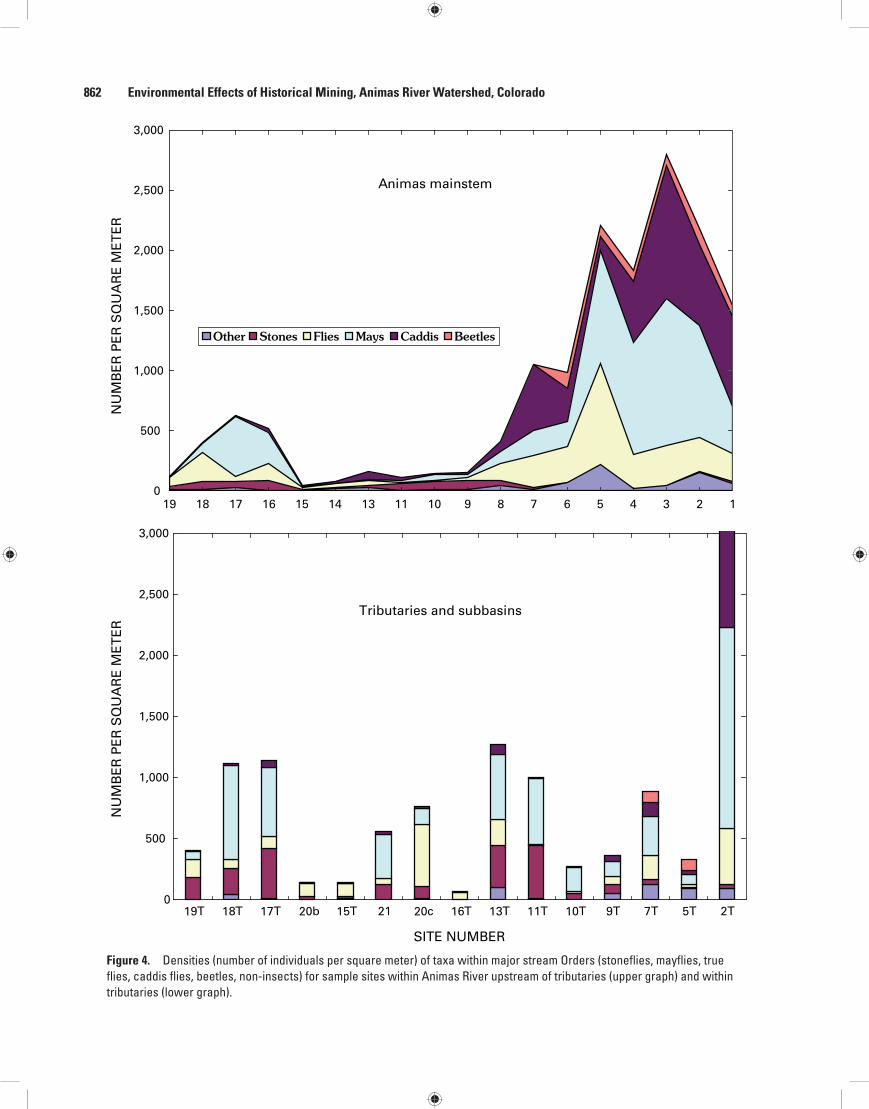
major stream Orders (stoneflies, mayflies, true flies, caddis flies, beetles, non-insects) ........................................................................................................862
5. Densities of taxa within mayfly Order (Ephemeroptera) .............................................864 6. Densities of taxa within caddis fly Order (Trichoptera)...............................................866 7. Densities of taxa within stonefly Order (Plecoptera) ..................................................867 8. Densities of taxa within true fly Order (Diptera) ...........................................................868 9. Graph showing similarity indices ...........................................................................................869 10. Graph showing pre-remediation baseline data for a Multiple Site Assessment ..........870
Tables 1. Sample sites ..............................................................................................................................858 2. Pre-remediation baseline data for the Animas River canyon ...........................................869

AbstractThe benthic macroinvertebrate community of the Animas
River watershed study area has been impaired by more than a century of hard-rock mining. Currently, remediation of mine sites is being done to restore ecosystem health in this water-shed. Ecological recovery of the community depends on the degree that remediation improves water quality and reduces erosion of mill tailings into the river, resulting in improved habitat quality. Benthic macroinvertebrate data were collected in fall 1996, spring 1997, and fall 1997 to measure existing ecosystem health and to evaluate the response of the ben-thic community to remediation activities. Macroinvertebrate samples were obtained from 25 impaired and 11 unimpaired sites. Sampling methods were proposed to determine time of year, frequency, and location for collection of pre-remediation data and to qualitatively and statistically compare those data to the post-remediation data. Two methods were proposed: (1) a single site assessment where only one sample site exists downstream from each remediation site, and (2) a multiple site assessment where a minimum three sample sites are used for each remediation site. At least 3 years of pre-remediation data and 3 years of post-remediation data from the same site must be collected to distinguish between the effectiveness of reme-diation and temporal variation inherent in natural populations. If post-remediation data are not significantly different from pre-remediation data, then subsequent data collection should be delayed until further remediation is completed, the benthos has had more time to recover, or macroinvertebrates have had more time to recolonize the impaired reaches. If a significant difference is evident between pre- and post-remediation data, a minimum of 2 years of additional post-remediation data should be collected.
IntroductionThe Animas River watershed study area has been
extensively affected by more than a century of hard-rock mining, resulting in impaired benthic macroinvertebrate and fish communities throughout the watershed. The purpose of
remediating abandoned mine sites is to restore ecosystem health (von Guerard and others, this volume, Chapter B). Two indicators of aquatic ecosystem health are species composition and species diversity, which researchers can evaluate by deter-mining number of taxa (taxa richness) and relative densities of the taxa or the taxa evenness (May, 1988). In general, healthy aquatic ecosystems are reflected by high numbers of taxa and even taxa distribution across their habitat.
Benthic biological communities include periphyton, macroinvertebrates, and some species of fish. Periphyton (or biofilm) is composed mostly of the primary producer, algae, and grows on top of rocks and other benthic sub-strates. Benthic macroinvertebrates feed on periphyton, dead organic material and a wide range of small organisms, and are themselves an important food resource for fish, amphib-ians, reptiles, birds, and mammals. Of the fish, some species, such as suckers and fathead minnows, graze primarily upon periphyton. Trout and speckled dace, however, rely primarily upon benthic macroinvertebrates for their food.
Acid mine drainage may reduce species diversity in stream ecosystems through both acute and chronic mecha-nisms, including toxicity of metals in stream water, sedi-ment, and interstitial water (Besser and others, this volume, Chapter D; Besser and Brumbaugh, this volume, Chapter E18; Besser and Leib, this volume, Chapter E19) as well as physical effects of metal-bearing precipitates (colloids) on aquatic organisms and their habitats (Milhous, this volume, Chapter E21).
One of the major goals of the Animas River water-shed study was to evaluate the effectiveness of remediation (Buxton and others, 1997). Although monitoring water chem-istry in streams provides information on exposure concen-trations and chemical loading, it does not directly address species composition and diversity or the quality of benthic community habitat (Karr and others, 1986; Yoder and Rankin, 1999). Because of the abundance and mobility of benthic macroinvertebrates, coupled with their ability to recolonize impaired ecosystems, this group of taxa is commonly selected for use in monitoring studies of aquatic ecosystem health throughout the United States (Davis and others, 1996). The methods for collection, analysis, and interpretation of benthic macroinvertebrate data are well established through works
Chapter E20Effects of Mining on Benthic Macroinvertebrate Communities and Monitoring Strategy
By Chester R. Anderson
including the Rapid Bioassessment Protocol (RBP) developed for the Environmental Protection Agency (Shackleford, 1988; Plafkin and others, 1989; Barbour and others, 1992, 1995, 1996; Hayslip, 1993), the benthic Index of Biotic Integrity (IBI; Kerans and Karr, 1994; Fore and others, 1996), and the Invertebrate Community Index (DeShon, 1995). Their use as indicators of water and habitat quality has been justified by Hutchinson (1993), Karr and Chu (1999), Resh and Jackson (1993), and Rosenburg and Resh (1993). In addition, long holding times for preserved samples and the establishment of voucher collections that may be evaluated by other investiga-tors for quality control are advantageous. Moreover, using macroinvertebrates for monitoring and assessing the health of an aquatic ecosystem directly addresses the concept of spe-cies diversity by recognizing that benthic macroinvertebrates integrate a variety of variables of concern over both space (such as benthic habitat and water quality) and time (because they live in the stream year-round and any ephemeral change in water quality will appear in the composition of the mac-roinvertebrate community). Limitations to the use of macro-invertebrates for monitoring include the relative difficulty of sampling. In contrast to invertebrates, periphyton is relatively difficult to identify.
Community metrics can be calculated from counts of individuals or counts of individual taxa in an ecosystem. Most metrics incorporate knowledge of the type of taxa, taxa rich-ness, and relative numbers (evenness). There have been several attempts to apply a single number to taxa richness and even-ness. The most widely accepted attempt is the Shannon-Weiner diversity index. The problem is that such an integrative index loses important information and may not wholly define and encompass all the intricacies of a macroinvertebrate community (Hurlbert, 1971; Purvis and Hector, 2000).
How the community will respond to remediation efforts (Stone and Wallace, 1998; O’Neill, 1999) is also unknown. The response will depend on existing macroinvertebrate communities within the watershed as well as the effect that remediation has on water and substrate quality. Potential responses include additions of or increasing densities of intol-erant taxa and (or) loss of or decreasing densities of tolerant taxa. Therefore, descriptions of the macroinvertebrate commu-nity data should include species identification and the number of taxa as well as relative densities With this information, a variety of community metrics may be used to evaluate the effectiveness of remediation and to compare pre-remediation data to post-remediation data (Resh and others, 1988). Because the exact response of the macroinvertebrate commu-nity to remediation is unknown, identifying specific metrics for the purpose of evaluating the effectiveness of remediation cannot be completed until post-remediation data are obtained and thoroughly compared to the pre-remediation data. Dis-tinguishing between temporal variability and actual recovery of the ecosystem is also necessary to accurately evaluate the effectiveness of remediation (Chapman, 1999).
Other processes may also help in evaluation of the effec-tiveness of remediation and may help identify underlying or mechanistic reasons for recovery or lack thereof. They include measurements at the suborganismal (for example, bioassays, Besser and Leib, this volume) to the ecosystem level (for example, nutrient cycles, Stone and Wallace, 1998; Adams and others, 2002; Resh and others, 1988). However, such pro-cedures may not be feasible because of their complexity and cost. In conjunction with other research, both included in this volume and by other agencies, this study is an attempt to meet some of the objectives outlined by Michener (1997), Kondolf (1995), and Kondolf and Micheli (1995) in assessment of the effectiveness of remediation practices.
Purpose and Scope
The primary purpose of this study was to
Gather benthic macroinvertebrate pre-remediation • data to evaluate whether mine-site remediation in the Animas River watershed study area will increase the diversity of benthic macroinvertebrates
Propose guidelines for conducting post-remediation • sampling of the benthic community in the Animas River
Propose methods to evaluate the effectiveness of • remediation using biological data.
Acknowledgments
I acknowledge the help of Dave Gerhardt of the USDA Forest Service, San Juan National Forest; William Simon, Animas River Stakeholders; and Barbara Horn, Colorado Division of Wildlife. Each contributed significantly to the design and implementation of this research. The San Juan National Forest provided funds, personnel, and equipment for the collection and processing of the macroinvertebrate samples. Bob Brantlinger and Jamey O’Leary helped consid-erably in the data collection.
MethodsWe used biomonitoring and assessment methods to
obtain pre-remediation data in 1996 and 1997 at 25 impaired and 11 reference sites, from the northernmost headwaters of the Animas River (the watershed study area as such) to the confluence with the San Juan River (figs. 1 and 2; table 1). The pre-remediation data were collected prior to the bulk of
854 Environmental Effects of Historical Mining, Animas River Watershed, Colorado

Monitoring Benthic Invertebrate Communities 855
Elk Creek
Mo las
Creek
South
For
k Mi neral Creek
Kendall Gulch
Cun
ningham
Creek
Boul
der
Gul
ch
Eureka Gulch
formerLake
Emma
Elk Park
M
iner
a l
C
reek
A
nimas
R
iver
C
emen
t C
reek
ChattanoogaEureka
Silverton
AnimasForks
Howardsville18
19
23
2224
2120a-c
11
12
13
14
1516
17
Deer P ark Creek
EXPLANATION
Localities for invertebrates
Animas Riverwatershed study area
C O L O R A D O
Durango0
0 1
1 2 MILES
2 KILOMETERS
107º50'30" 107º45' 107º37'30" 107º30'
37º 52'30"
37º45'
37º 58'
AnimasRiver
tributary
Figure 1. Sample sites, Animas River watershed study area, from confluence of Elk Creek north to the headwaters of the study area streams. Dot indicates two samples taken at site, one in mainstem upstream of confluence and one in the tributary (see inset in figure).

EXPLANATION
Localities for invertebrates
0 3 5 MILES
0 3 5 KILOMETERS
Durango
37º00'
Silverton
NA I MAS
CAN
YON
Cascade
Creek
Creek
Flor
ida
River
Florida Rive
r
Riv
er
108º00'
Base from U.S. Geological Survey1:100,000 digital line maps, 1989
Cement Creek
Area of figure 1
AnimasRiver
tributary
107º45' 107º30'
37º15'
37º30'
37º45'
38º00'
He rm
osa
Ani
mas
AnimasRiverMineral Creek
NeedleCreek
LightnerCreek
Animas Riverwatershed study area
C O L O R A D O
Durango
1211
910
7
5
2
1
upstream from confluence with San Juan River
8
6
4
3
856 Environmental Effects of Historical Mining, Animas River Watershed, Colorado

Monitoring Benthic Invertebrate Communities 857
remediation work (Finger and others, this volume, Chapter F). Sites were sampled in fall 1996, and spring and fall 1997. The majority of the sample sites were at major tributaries of the Animas River where, for the response variable, samples were taken from the Animas River immediately upstream from the tributaries. These sample sites were chosen for two reasons: (1) to use the tributary as a reference and (2) to avoid mixing zones. Where tributaries were far apart, especially downstream from the Animas River canyon, samples were taken at estab-lished sample sites that were not necessarily associated with a tributary but where we knew that data had been collected previously (Peter Butler, Robert Owen, and William Simon, Unpublished report to Colorado Water Quality Control Commission, Animas River Stakeholders Group, 2001).
Reference samples were obtained for the purpose of measuring potential community metrics given various levels of remediation. Each tributary station had similar physical habitat features as the associated Animas River stations, such as substrate type (granite, sandstone, limestone, for example) and composition (boulder, cobble, gravel, for example) but were dissimilar in stream order (size) and gradient. At each sample site, we also obtained data for benthic habitat.
Field sampling procedures were modeled after the EPA’s Rapid Bioassessment Protocol (RBP) for macroinvertebrates. Because macroinvertebrate habitat in the Animas River is primarily boulder-cobble substrate, the single-habitat approach was selected as opposed to the multi-habitat approach. RBP protocol emphasizes compositing samples over an area of greater than 2 m2, but the primary goal of RBP is assessment of stream ecosystem health. The goal of this research was to establish pre-remediation data from which to gauge the effectiveness of mine-site remediation. To accomplish this, we needed to determine sampling errors and densities of particu-lar taxa. Therefore, instead of compositing the samples as in the RBP protocol, we took from 3 to 6 samples from each site. The area sampled for each one was limited to an area of 0.5 m directly upstream of the net, resulting in an area of 0.25 m2. Because of the high flows and volumes of water found in the incised Animas River canyon (sites 8–14, figs. 1 and 2), a modified rectangular dip-net was constructed for this research. The net had more surface area to allow greater quantities of water to flow into and through the net. The opening measured 23 cm high by 50 cm wide. The net measured 50 cm long and had approximately 1,000 cm2 of 500-µm mesh netting. Laboratory sample processing of the macroinvertebrate
samples followed protocols outlined by the National Aquatic Monitoring Center (Vinson and Hawkins, 1996). Taxa were identified to the lowest possible level (see Appendix, included on CD-ROM, Sole and others, this volume, Chapter G), and voucher specimens are stored at the USDA San Juan National Forest aquatics laboratory.
The total number of taxa per sample site and the means of the densities of each taxon per sample site were calculated, tabulated, and graphed to determine the pre-remediation baseline. Unknown specimens that clearly did not fit in any of the other taxonomic categories were not included in calcula-tions of taxa richness. Data were assessed on the basis of (1) the composition of a diverse macroinvertebrate commu-nity within the Animas River watershed, (2) the total number of taxa (taxa richness) for each sample site and how this metric varies by river mile within the Animas River and in the tributaries, and (3) the relative densities of taxa (number of individuals/taxon/m2) within each of the most important lotic (flowing streams and rivers) aquatic groups: true flies (Diptera), mayflies (Ephemeroptera), stoneflies (Plecoptera), caddis flies (Trichoptera), beetles, and non-insects for both the Animas River and tributaries.
Minor modifications were made to the original 1996 sampling plan. In 1997, the sampling plan included stations upstream of and in Hermosa Creek (fig. 2, site 7) and Kendall Gulch (site 14, fig. 1 and table 1). Note: Because of the large number of springs along the Animas River upstream from Molas Creek (site 12T), data from this site were not included in the analysis.
Macroinvertebrate communities at impaired sites were compared to reference sites using Morisita’s index of similar-ity and percent similarity index for the following: upstream from Cunningham Creek site (site 18) to Cunningham Creek at mouth (site 18T), upstream from Boulder Gulch (site 17) to Boulder Gulch at mouth (site 17T), upstream from Deer Park Creek (site 13) to Deer Park Creek at mouth (site 13T), upstream from Elk Creek (site 11) to Elk Creek at mouth (site 11T), upstream from Needle Creek (site 10) to Needle Creek at mouth (site 10T), upstream from Cascade Creek (site 9) to Cascade Creek at mouth (site 9T), upstream from Hermosa Creek (site 7) to Hermosa Creek at mouth (site 7T), and Mineral Creek upstream from South Fork Mineral Creek (site 20a) to South Fork Mineral Creek at mouth (site 20b, fig. 1).
Annual variation of pre-remediation data was estimated utilizing 1992, 1996, and 1997 data both within the Animas River canyon (sites 8–14, figs. 1, 2) and at Mineral Creek upstream from South Fork Mineral Creek (site 20a, fig. 1). Within the canyon a regression line was fit, utilizing least-squares analysis, to total taxa data collected at each station for each year. At the Mineral Creek site the mean and stan-dard error of the 1992, 1996, and 1997 total taxa data was calculated.
Figure 2 (facing page). Sample sites, Animas River watershed south of study area to Colorado State line. Sample site 1 on the Animas River upstream from the confluence with the San Juan River in New Mexico is not shown. Dot indicates two samples taken at site, one in mainstem at confluence and another in the tributary (see inset in figure).

Table 1. Sample sites.
[Site number (T denotes associated tributary); distance in river miles upstream from confluence of Animas River with San Juan River, N. Mex., see figs. 1 and 2, degree of impairment and reference sites]
Site No.1 Site name River distance ImpairmentAnimas River sites
19 Upstream from Eureka Gulch 82.1 Impaired
18 Upstream from Cunningham Creek 78.2 Impaired
17 Upstream from Boulder Gulch 75.8 Impaired
16 Upstream from Cement Creek 74.2 Impaired
15 Upstream from Mineral Creek 73 Impaired
14 Upstream from Kendall Gulch 72 Impaired
13 Upstream from Deer Park Creek 71.7 Impaired
11 Upstream from Elk Creek 67.4 Impaired
10 Upstream from Needle Creek 61 Impaired
9 Upstream from Cascade Creek 54.7 Impaired
8 Downstream from Bakers Bridge 43.3 Impaired
7 Upstream from Hermosa Creek 38.5 Impaired
6 32nd St. Bridge, Durango 25.8 Impaired
5 Upstream from Lightner Creek 23.5 Impaired
4 Purple Cliffs 21 Impaired
3 Weaselskin Bridge 19 Impaired
2 Upstream from Florida River 17 Impaired
1 Mouth 0.3 Impaired
Animas River tributary sites19T Eureka Gulch mouth 82 Impaired
18T Cunningham Creek mouth 78.1 Slightly Impaired/Reference
17T Boulder Gulch mouth 74.2 Unimpaired/Reference
13T Deer Park Creek mouth 71.6 Unimpaired/Reference
11T Elk Creek mouth 67.3 Unimpaired/Reference
10T Needle Creek mouth 60.9 Unimpaired/Reference
9T Cascade Creek mouth 54.7 Unimpaired/Reference
7T Hermosa Creek mouth 38.5 Unimpaired/Reference
5T Lightner Creek mouth 23.1 Unimpaired/Reference
2T Florida River mouth 17 Unimpaired/Reference
Cement Creek basin16T Mouth 74.1 Impaired
22 Downstream from South Fork Cement Creek 80.5 Impaired
23 Upstream from North Fork Cement Creek 81.4 Impaired
24 South Fork Cement Creek Mouth 80.6 Impaired
Mineral Creek basin15T Mouth 73 Impaired
20a Upstream from South Fork Mineral Creek 76.5 Impaired
South Fork Mineral Creek subbasin20b Mouth 76.5 Slightly Impaired/Reference
21 South Fork Mineral Creek Forest Service Campground 80.1 Slightly Impaired/Reference1See figures 1 and 2.
858 Environmental Effects of Historical Mining, Animas River Watershed, Colorado

Monitoring Benthic Invertebrate Communities 859
Results
Macroinvertebrate Communities in Reference Tributaries
Data from the unimpaired tributaries, when compared with data from the Animas River and Cement and Mineral Creeks, showed relatively higher numbers of taxa and densi-ties and an even distribution of the number of taxa within the Orders (figs. 3, 4; table 1). Except for South Fork Mineral Creek mouth (site 20b, fig. 1) and Lightner Creek mouth (site 5T, fig. 2), the communities in the tributaries were domi-nated by mayflies (fig. 4). As in the Animas River upstream from Boulder Gulch, Cunningham Creek at mouth, and Boulder Gulch at mouth (sites 17T and 18T, fig. 1; table 1), macroinvertebrate communities were dominated by the hep-tageniid mayflies, Rhithrogena and Epeorus, and the ephe-merelid mayfly, Drunella (fig. 5). South Fork Mineral Creek at mouth and South Fork Mineral Creek at the United States Department of Agriculture (USDA) Forest Service camp-ground (site 21, fig. 1) had fairly diverse and even macroin-vertebrate communities reflected in both taxa richness (23 and 17 respectively) and evenness (fig. 4). Because this tributary, as well as Cunningham Creek and lower Boulder Gulch, was affected by mineralization, the composition of the macroin-vertebrate community of these tributaries may be important in determining what community compositions to expect as the Animas River macroinvertebrate community recovers. (See objective 4, Appendix 6b, Macroinvertebrate Report, Unpub. Report to Colorado Water Quality Commission, ARSG, 2001.)
Boulder Gulch is a high-gradient drainage wholly within the Silverton caldera. Since this subbasin was set aside as the community water supply, essentially no mining activity has occurred within the subbasin. The subbasin is underlain by propylitically altered bedrock (Bove and others, this volume, Chapter E3), and the water quality is good (Wright and oth-ers, this volume, Chapter E10). The stream contains a diverse assemblage of macroinvertebrates (figs. 3–8). This tributary represents the best reference reach for the macroinvertebrate community in the caldera. It is easily accessible for sampling, and pre-remediation geochemical and biological baseline data are available.
A diverse macroinvertebrate community in a tributary outside the Silverton caldera was best represented by Deer Park Creek (site 13T, fig. 1), 1.3 miles downstream from the caldera margin (Yager and Bove, this volume, Chapter E1). Deer Park Creek had a relatively large number of taxa (35) existing at relatively high densities (1,274 individuals per square meter; fig. 3). The numbers of taxa within each Order were distributed relatively evenly with a slight dominance by mayflies (fig. 4). Within the mayfly Order, there were seven taxa dominated by two genera, Rhithrogena and Drunella (303 and 130/m2, fig. 5 and Appendix (Sole and others, this
volume)). Although the density of mayflies in Deer Park Creek (533/m2) was less than in Cunningham Creek (773/m2), there were more mayfly taxa in Deer Park Creek (7) than in Cunningham Creek (4) as well as more taxa of the other major Orders such as caddis flies (fig. 6 and Appendix). In Deer Park Creek, there were six taxa of caddis flies dominated by Rhya-cophila (Appendix) and seven taxa of stoneflies dominated by both Zapada (142/m2) and a taeniopterygid (120/m2; fig. 7 and Appendix). There were relatively few dipterans (fig. 8) in Deer Park Creek compared to South Fork Mineral Creek at mouth site (20b, fig. 1).
Similarity of macroinvertebrate communities in the Animas River mainstem to reference tributaries reflected pat-terns in taxa richness and evenness in the mainstem (fig. 9) except at Hermosa Creek (sites 7 and 7T). Similarity declined due to changes in taxa composition in Hermosa Creek at mouth compared to other tributaries and the mainstem.
Examples of less diverse and even macroinvertebrate communities exist in Cement and Mineral Creeks (sites 20a, 16T, and 22–24, fig. 1). Both tributaries had relatively few taxa (9 and 16 respectively, collected at confluence with Animas River) with either low densities (64 and 143/m2) or communi-ties that were dominated by only one or two taxa (figs. 3 and 4; Appendix).
Taxa Richness and Densities of Specific Taxa in the Animas River
Compared to conditions in Boulder Gulch and other reference tributaries, both taxa richness and density of macro-invertebrates in the Animas River upstream from Eureka Gulch (site 19, fig. 1) were low, but both metrics increased from Eureka Gulch to Boulder Gulch (sites 19 through 17T, fig. 1 and fig. 3). The peak in taxa richness and densities in the Animas River from the reach upstream of Cunningham Creek and Boulder Gulch represented a fairly diverse macroinvertebrate community, although not as diverse as the communities within either the mouth of Cunningham Creek or Boulder Gulch themselves. Taxa richness and densities in the Animas River decreased dramatically downstream from Boulder Gulch to Mineral Creek. Downstream, the taxa rich-ness in the Animas River increased to previous levels found around Cunningham Creek near the confluence with Deer Park Creek, but invertebrate densities did not increase sub-stantially until 28 miles downstream at the Downstream from Bakers Bridge site (site 8, fig. 2 and fig. 3; table 2). Presumably this recovery of the invertebrate community is attributable to improved water and habitat quality and changes in toxic-ity of dissolved metals. Taxa richness more or less levels off from Bakers Bridge to the confluence with the San Juan River (sites 8 through 1, fig. 2), but densities continue to increase downstream to Weaselskin Bridge (site 3, figs. 2, 4).

Tributaries and subbasins
0
5
10
15
20
25
30
35
40
19T 18T 17T 20b 15T 21 20c 16T 13T 11T 10T 9T 7T 5T 2T
SITE NUMBER
Animas mainstem
0
5
10
15
20
25
30
35
40
19 18 17 16 15 14 13 11 10 9 8 7 6 5 4
NU
MB
ER
OF
TA
XA
NU
MB
ER
OF
TA
XA
Other Stones Flies Mays Caddis Beetles
860 Environmental Effects of Historical Mining, Animas River Watershed, Colorado

Monitoring Benthic Invertebrate Communities 861
Evenness of Taxa in the Animas River
The number of taxa found within each Order of macro-invertebrates is relatively even throughout the Animas River. The evenness, however, as illustrated by the number of indi-viduals per taxon/m2 within the Animas River upstream from Cunningham Creek, shows domination by dipterans (240/m2 out of total of 399/m2; fig. 3 and Appendix). Within the mayfly community in the Animas River upstream from Cunningham Creek, Rhithrogena (36/m2) and Baetis (27/m2, total mayfly density=73/m2) are dominant (fig. 5 and Appendix). In the reach from Eureka Gulch to Boulder Gulch, the composition of the mayfly community improves: an increase in taxa rich-ness (from two to four) and densities (from 2.67 to 500/m2) with dominance by Rhithrogena (385/m2), Baetis (59/m2), Epeorus (38/m2), and Drunella (18/m2). The number of taxa of mayflies remains relatively constant throughout the reach (fig. 3), but the densities of the mayfly community do not recover in the Animas River until south of Durango, 55 mi downstream (site 5, fig. 2; fig. 5). Rhithrogena essentially dis-appears downstream at Cement Creek (site 16, to 0.67/m2) and reappears upstream from Elk Creek (site 11, fig. 1; 9.33/m2) reaching a peak density of 42/m2 at the site upstream from Needle Creek (site 10, fig. 2).
Upstream from Boulder Gulch, there is less disparity of relative densities of mayflies (500 mayflies per square meter compared to 630 total taxa per square meter) between the Animas River and its associated tributaries—Cunningham Creek (site 18T; 773 / 1,121) and Boulder Gulch (site 17T; 564 / 1,138)—than there is in the Animas River downstream from the confluence with Mineral Creek, where a greater disparity exists between relative densities of mayflies in the Animas River and associated tributaries—Deer Park, Elk, Needle, Cascade, and Hermosa Creeks (figs. 1, 2, 5; Appendix). In the Animas River upstream from the confluence with Mineral Creek (site 15, fig. 1), dipteran communities were dominated by orthoclads and an unknown chironomid, whereas associated tributaries, Boulder Gulch and Cunningham Creek, had relatively high diversity of true flies (fig. 8).
Downstream from the confluence of Cascade Creek (site 9, fig. 2), the number of taxa and their densities increased sharply in the Animas River. Upstream from Bakers Bridge (site 8, fig. 2), densities of caddis flies (fig. 6) were low (84/m2), dominated by Arctopsyce (75/m2). Downstream from Bakers Bridge, additional taxa were found along with a dramatic increase in densities (fig. 6). The Animas River
caddis fly community, when compared to that of tributaries such as Boulder Gulch and Deer Park Creek, appeared to be reduced more than the other Orders of macroinvertebrates (fig. 6). The densities of Brachycentrus increased substan-tially upstream from Hermosa Creek (site 7, fig. 2), but the total number of taxa of caddis flies did not increase in the Animas River until downstream from Durango (Appendix). Below Bakers Bridge, the Animas River’s setting changes dramatically from a steep, incised canyon to a relatively wide valley and a meandering stream. Agriculture, gravel mining, housing developments as well as urban landscapes dominate land use.
Stonefly densities throughout the Animas River were low (fig. 7). The communities were dominated by Zapada upstream from Deer Park Creek with the greatest diversity upstream from the confluence with Cement Creek. Down-stream from the Mineral Creek confluence, an unknown taeniopterigid dominated the stoneflies in the Animas River south to Bakers Bridge through the Animas River canyon. Relatively high numbers of taxa of stoneflies occurred in the Animas River upstream from Boulder Gulch (five), but this community was absent in the reach downstream from the con-fluence with Cement Creek and did not reappear until Needle Creek (fig. 7), reflecting the effects of more acidic and metal-rich water flowing from Cement and Mineral Creeks into the Animas River (Kimball and others, this volume, Chapter E9).
Similarity Among Animas River and Reference Tributary Sites
The composition of the macroinvertebrate communities in the Animas River when compared to reference tributaries utilizing Morisita’s and Percent Similarity Indices revealed similar trends to the number of taxa and evenness metrics. Similarity peaked upstream of Silverton with a decline at and downstream from Silverton, and a recovery of the community in the Animas River canyon. At the Hermosa Creek sites (site 7 versus 7T) a decline in similarity occurred (fig. 9).
DiscussionThe rate of recovery of the macroinvertebrate community
after remediation depends on (1) the rate that water quality improves, (2) the rate that the benthos (stream substrate and associated organisms and detritus) recovers, and (3) the rate of recolonization by macroinvertebrates. Therefore, when and how often to conduct post-remediation sampling should depend on the rate that all the components (physical, chemical, and biological) of impaired segments recover after remediation. The processes by which these components recover operate along different spatial and temporal scales and may be specific to a particular location in the watershed.
Figure 3 (facing page). Number of taxa in the major stream Orders (stoneflies, mayflies, true flies, caddis flies, beetles, non-insects) for sample sites in Animas River upstream of tributaries (upper graph) and in tributaries (lower graph). Sample stations sorted from upstream (left) to downstream (right) on X-axis. Sample site with asterisk, reference site.
Tributaries and subbasins
Animas mainstem
0
500
1,000
1,500
2,000
2,500
3,000
19 18 17 16 15 14 13 11 10 9 8 7 6 5 4 3 2 1
Other Stones Flies Mays Caddis Beetles
0
500
1,000
1,500
2,000
2,500
3,000
19T 18T 17T 20b 15T 21 20c 16T 13T 11T 10T 9T 7T 5T 2T
SITE NUMBER
NU
MB
ER
PE
R S
QU
AR
E M
ET
ER
NU
MB
ER
PE
R S
QU
AR
E M
ET
ER
Figure 4. Densities (number of individuals per square meter) of taxa within major stream Orders (stoneflies, mayflies, true flies, caddis flies, beetles, non-insects) for sample sites within Animas River upstream of tributaries (upper graph) and within tributaries (lower graph).
862 Environmental Effects of Historical Mining, Animas River Watershed, Colorado

Monitoring Benthic Invertebrate Communities 863
The assumption is that water quality from remediation sites will improve almost immediately after remediation is completed, but how long it will take for the sediment qual-ity (Church, Fey, and Unruh, this volume, Chapter E12) and the biological community to recover (Besser and others, this volume; Milhous, 1998) is unknown. The physical and chemi-cal processes that may affect the recovery of the benthos are stream gradient, stream size, frequency and extent of floods, and changes in pH and background concentrations of metals in the water (Mast and others, this volume, Chapter E7).
Aluminum and iron have many common sources in the Cement and Mineral Creek basins (Bove and others, this volume), and the substrate of the Animas River has been significantly affected by aluminum and iron precipitates (Church, Fey, and Unruh, this volume; Kimball and others, this volume). These precipitates have coated rock surfaces and filled interstitial spaces, reducing the habitat available to macroinvertebrates (Parkhurst, 1999; Church, Fey, and Unruh, this volume; Milhous, this volume).
Parkhurst and others (1999) found significant relation-ships between invertebrate metrics and total aluminum, iron, and manganese concentrations, but found no such relationship with cadmium, copper, and zinc. Iron and aluminum were present primarily in the particulate phase, and manganese, cadmium, copper, and zinc were present primarily in dissolved forms. Their conclusion was that the physical effects of the precipitate, not the toxic effects of dissolved metals, were the primary reason for the suppression of the benthic macroinver-tebrate community. Current research has found correlations between dissolved metals that are at or near toxic levels for fish and invertebrates, levels of these metals in tissues of fish and invertebrates and impacts on populations of trout and invertebrates (Besser and others, this volume; Besser and Brumbaugh, this volume; Besser and Leib, this volume).
A scenario may be hypothesized wherein the majority of sources of mining impacts are eliminated from the Animas River and the remaining metals affecting water quality and benthic habitat exist only in the benthos. The rate that these metals move through the river system and out of the benthos will be a function of the depth of contamination and the rate that metals are brought to the surface of the benthos. Floods will have a greater impact where the stream gradient is high and will tend to move metals to depositional areas (margins of the streams or pools) and farther down the Animas River where the gradient is lower. As metals move downstream, they become less available to erosion and their concentrations become more dilute.
Chemical processes that govern metal bioavailability of the benthos include changes in pH (from ground-water infiltra-tion, surface water, and geology), amount of dissolved metal in surface water, and bioaccumulation of primary producers (Besser and Brumbaugh, this volume). An increase in the pH will reduce the potential for toxic metals to be dissolved from the benthos into the water column and will also increase the rate of precipitation of most metals, contributing to the toxicity of precipitates to benthic organisms (Church, Fey, and Unruh,
this volume). Suspended precipitates, as colloids or floccu-lates, will work their way downstream and out of the water-shed and are flushed out each year during high flow.
Biological processes may also significantly contribute to cleaning up the benthos. Studies have shown that macroinver-tebrates can move large quantities of particulates downstream through their foraging behaviors (Wallace and Whiles, 1993). Therefore, as the macroinvertebrate community recovers through time, the rate that metals could move out of the water-shed will increase by this mechanism alone. Biological pro-cesses will also produce more organic matter that tends to bind metals in less toxic, more innocuous or unavailable forms.
Because the adult stages of macroinvertebrates are winged and terrestrial, and larvae can easily drift downstream into impaired reaches from unimpaired or from less impaired reaches of the Animas River and its tributaries where there are more diverse communities of macroinvertebrates, colonization is most likely not a limiting factor to the rate of recovery of the macroinvertebrate community.
Proposed Sampling Plan and Analysis
Pre-Remediation Baseline Sampling
The overall concept of sampling upstream of major tributaries and utilizing the mouth of unimpaired tributaries for macroinvertebrate reference sites appeared to be adequate and sound, and has historical precedence (Clements and others, 2000; Hughes and others, 1986). In any design of an evalua-tion of remediation practices, pre-remediation baseline sample sites should be located downstream from proposed remedia-tion sites and upstream from significant changes in water or habitat quality. For economic reasons, the number of sample sites should be kept at a minimum as long as the accuracy and efficacy of the program are not compromised. Sample sites must be located in segments where, other than remediation, no anthropogenic changes occurred to the segments upstream from or between the sample stations. For this reason, stations downstream from Bakers Bridge should be eliminated from the analysis (sites 7–1, fig. 2) because they were subject to a variety of anthropogenic disturbances, including non-point pollution from erosion, agriculture, livestock, and septic tanks, as well as municipal discharge and gravel mining.
Pre-remediation baseline data should include data on water chemistry and benthic habitat. Such data will not only allow for assessments of particular remediation strategies and insight into the mechanisms and underlying processes of recovery (Adams and others, 2002), but will also help in deci-sions on when and where to conduct post-remediation sam-pling for biological indices.
Both physical accessibility and cost must be considered in a decision on which season to sample. High flow, low tem-peratures, and snow severely inhibit access and limit the effi-ciency and accuracy of sampling in the Animas River during

Animas mainstem
0
100
200
300
400
500
600
19 18 17 16 15 14 13 11 10 9 8 7
Baetidae Acentrella Baetidae Baetis Ephemerellidae unknown
Ephemerellidae Drunella Ephemerellidae Ephemerella Heptageniidae Cinygmula
Heptageniidae Epeorus Heptageniidae Rhithrogena Heptageniidae unknown
Siphlonuriidae Ameletus Tricorythidae Tricorythodes
Tributaries and subbasins
0
100
200
300
400
500
600
700
800
900
19T 18T 17T 20b 15T 21 20c 16T 13T 11T 10T 9T 7T
NU
MB
ER
PE
R S
QU
AR
E M
ET
ER
NU
MB
ER
PE
R S
QU
AR
E M
ET
ER
SITE NUMBER
864 Environmental Effects of Historical Mining, Animas River Watershed, Colorado

Monitoring Benthic Invertebrate Communities 865
Figure 5 (facing page). Densities of taxa within mayfly Order (Ephemeroptera) for stations within Animas River upstream of tributaries (upper graph) and within tributaries (lower graph).
winter, spring, and late fall. At high flow, difficulty of access is compounded by the high gradient in the Animas River canyon (Blair and others, 2002). In the spring, a small window opens between snowmelt and high flow. If this window is missed due to weather or some other circumstance such as accessibility, then biomonitoring for that season will not be accomplished. In the fall, the sampling window between the time that high flow has receded and the time of inhibiting snowfall is much larger. Therefore it is suggested that macroinvertebrate sam-pling be done in the fall. Sampling in the fall, during low flow, was and will be necessary for efficiency and consistency of results between the pre- and post-remediation sampling.
Post-Remediation Sampling
Post-remediation sampling is important to conduct during the same season that the pre-remediation data were gathered, and procedures for field sampling, sample processing, and taxonomic identification must be exactly the same. Given the scarcity of data on how benthic macroinvertebrate com-munities will react to mine-site remediation, sample process-ing should include at least a 300-count subsample, and taxa should be identified to the lowest possible level. Furthermore, if taxonomic unknowns are included in the data analysis, they must be systematically used in the same way throughout the study period and must be known to not fit into any of the other taxonomic classifications.
When and how soon post-remediation sampling occurs after remediation is completed must be decided based on when and where mine-site remediation occurs (which is governed by factors not related to testing the effectiveness of remediation) and by the effect that remediation has on water quality. Reme-diation in the Animas River watershed is currently underway and will continue in various amounts in various subbasins (William Simon, written commun., 2003). Robert Owens (Unpub. water quality and metal loading report, Colo. Dept. of Public Health and Environment, 1997) predicted that remediation must occur at several sites throughout each basin before appreciable reductions in metal loading will be detected. Walton-Day and others (this volume, Chapter E24) have shown that remediation in Cement Creek will have little difference in instream metal loads, but that remediation in the Animas River downstream from Eureka could result in lowering of toxic metal loads. Therefore, after an appreciable amount of remediation has taken place in the Animas River basin, the effects of this remediation should be detected in changes in the water chemistry, and post-remediation mac-roinvertebrate sampling should be conducted to demonstrate possible improvement in the macroinvertebrate community. After there has been remediation throughout the study area, post-remediation sampling should take place downstream
from Silverton. This scenario implies that an adequate pre-remediation data set for water chemistry exists to detect changes in water chemistry (Unpub. report to Colorado Water Quality Control Commission, ARSG, 2001).
Statistical Analysis to Assess Effectiveness of Remediation
At least 3 years of pre- and post-remediation data is nec-essary to adequately assess the degree of annual variation of the invertebrate community and to determine if the difference between the post-remediation and the pre-remediation data is significant or is simply within the limits of annual variation (Chapman, 1999; O’Neill, 1999). If possible, a better strategy would be to sample annually while remediation procedures were implemented and sufficiently beyond the remediation period until the metrics reach some level of stability. Stations used to assess annual variation should include ones that vary in degree of impairment, from highly impaired to unimpaired. Unimpaired tributaries essentially have saturated macroinver-tebrate communities and thus will not vary from year to year in the same manner that an impaired stream with only a few species will vary. Although not as accurate, year-to-year varia-tion may be defined using historical data as long as the differ-ences in sampling methods, sample processing, and taxonomic identification are defined.
Two types of analysis may be performed to evaluate the effectiveness of remediation. The analyses may be per-formed on a number of metrics, including richness, percent Ephemeroptera–Plecoptera–Trichoptera genera, percent Chironomidae individuals, Hilsenhoff Biotic Index (Plafkin and others, 1989), and others. In impaired tributaries where the number of stations was limited, it would be necessary to assess the effectiveness of remediation using only one sample site, a “Single Site Assessment.” Downstream from such a site where the tributary enters the Animas River, any changes to the tributary due to remediation would be masked by the influence of the water chemistry in the Animas River. At such sites, pre-remediation baseline means may be calculated from three uncomposited samples taken from an equal area of benthic habitat and statistically compared to post-remediation means. If a significant difference between the pre- and the post-remediation means is found, then the difference should be compared to and be greater than the annual variation in order to imply that the difference is attributable to remedia-tion efforts. Annual variation may be determined by obtaining at least 3 years of pre-remediation data and 3 years of post-remediation data. Instead of obtaining three uncomposited samples from an equal area of benthic habitat, a composited sample may be obtained and, from processing the whole sam-ple and through rarefaction analysis (Hurlbert, 1971), means and variances may be calculated for each sample site and com-pared to post-remediation data (for example, ECOSIM, Gotelli and Entsminger, 2001).

Animas mainstem
0
100
200
300
400
500
600
19 18 17 16 15 14 13 11 10 9 8 7
Unknown Brachycentridae Brachycentrus Brachycentridae MicrasemaGlossosomatidae Glossosoma Helicophsychidae Helicopsyche Hydrophsychidae ArctopsycheHydrophsychidae Cheumatopsyche Hydrophsychidae Hydropsyche Hydroptilidae unknown
Hydroptilidae Hydroptila Lepidostomatidae Lepidostoma Leptoceridae Nectopsyche
Leptoceridae Oecetis Limnephilidae unknown Limnephilidae Ecclisomyia
Uenoidae Neophylax Uenoidae Oligophlebodes Rhyacophilidae Rhyacophila
Rhyacophilidae Neothremma
Tributaries and subbasins
0
20
40
60
80
100
120
19T 18T 17T 20b 15T 21 20c 16T 13T 11T 10T 9T 7T
SITE NUMBER
NU
MB
ER
PE
R S
QU
AR
E M
ET
ER
NU
MB
ER
PE
R S
QU
AR
E M
ET
ER
Figure 6. Densities of taxa within caddis fly Order (Trichoptera) for stations within Animas River upstream of tributaries (upper graph) and within tributaries (lower graph).
866 Environmental Effects of Historical Mining, Animas River Watershed, Colorado

Monitoring Benthic Invertebrate Communities 867
Animas mainstem
0
10
20
30
40
50
60
70
80
90
19 18 17 16 15 14 13 11 10 9 8 7
Unknown Capniidae unknown Chloroperlidae unknownChloroperlidae Sweltsa Leuctridae unknown Nemouridae unknownNemouridae Zapada Perlidae unknown Perlidae CalineuriaPerlidae Hesperoperla Perlodidae unknown Perlodidae IsoperlaPerlodidae Megarcys Perlodidae Skwala Pteronarcyidae PteronarcellaPteronarcyidae Pteronarcys Taeniopterygidae unknown
Tributaries and subbasins
0
50
100
150
200
250
300
350
400
450
500
19T 18T 17T 20b 15T 21 20c 16T 13T 11T 10T 9T 7T
NU
MB
ER
PE
R S
QU
AR
E M
ET
ER
NU
MB
ER
PE
R S
QU
AR
E M
ET
ER
SITE NUMBER
Figure 7. Densities of taxa within stonefly Order (Plecoptera) for stations within Animas River upstream of tributaries (upper graph) and within tributaries (lower graph).

Animas mainstem
0
50
100
150
200
250
300
19 18 17 16 15 14 13 11 10 9 8 7
Unknown Athericidae Atherix Blephariceridae BibiocephalaCeratopogonidae unknown Ceratopogonidae Bezzia Ceratopogonidae ProbezziaEmpididae unknown Empididae Chelifera Empididae ClinoceraEmpididae Hemerodromia Empididae Oreogeton Empididae LimnophoraEmpididae Pericoma Empididae Psychoda Simulidae unknownSimulidae Prosimulium Simulidae Simulium Tipulidae unknownTipulidae Rhabdomastix Tipulidae Antocha Tipulidae DicranotaTipulidae Hexatoma Tipulidae Tipula Chironomidae unknownChironomidae Chironominae Chironomidae Orthocladiinae Chironomidae Tanypodinae
Tributaries and subbasins
0
100
200
300
400
500
600
19T 18T 17T 20b 15T 21 20c 16T 13T 11T 10T 9T 7T
NU
MB
ER
PE
R S
QU
AR
E M
ET
ER
NU
MB
ER
PE
R S
QU
AR
E M
ET
ER
SITE NUMBER
Figure 8. Densities of taxa within true fly Order (Diptera) for stations within Animas River upstream of tributaries (upper graph) and within tributaries (lower graph).
868 Environmental Effects of Historical Mining, Animas River Watershed, Colorado

Monitoring Benthic Invertebrate Communities 869
An example where a Single Site Assessment is appropriate is on Mineral Creek upstream from South Fork Mineral Creek (site 20a, fig. 1). South Fork Mineral Creek is similar in size to Mineral Creek, and 3.5 miles downstream, Mineral Creek drains into the Animas River. Any assessment of remediation that occurred in the Mineral Creek drainage at a site down-stream from the confluence with South Fork Mineral Creek would be masked by the influence of the quantity and quality of water from South Fork Mineral Creek. The annual variation may be estimated from fall 1992 data collected by the Colorado Department of Public Health and Environment and the fall 1996 and 1997 data collected for this study. The range is from a low
of 2 taxa in 1992 to a high of 12 taxa in 1997. To assume that mine-site remediation has improved the diversity and evenness of the macroinvertebrate communities, 3 years of consecutive, fall, post-remediation data collected at the same sample sites must be statistically different from the pre-remediation data and the annual variation. For a Single Site Assessment, the statisti-cal test to determine the effectiveness of mine-site remediation is a t-test, thus the necessity of at least three samples.
In the Animas River, where at least three sample sites were available to establish pre-remediation data and where (1) the tributaries or the Animas River between the stations will not have any type of anthropogenic interference other than
Figure 9. Morisita’s Index of similarity (Cλ) and Percent Similarity between upstream sites in Animas River and associated reference tributaries (north is at left, that is, upstream). Mileages coordinated with sites in tables 1 and 2.
5
10
15
20
25
30
35
40
354045505560657075
NU
MB
ER
OF
TA
XA
1992 1996 1997
RIVER MILE
Table 2. Pre-remediation baseline data for the Animas River canyon.
[Total number of taxa for macroinvertebrates per square meter by year from upstream of Mineral Creek downstream to Bakers Bridge; distance given in river miles upstream from confluence of Animas River with San Juan River, N. Mex.; --, no data]
Sample siteDistance
(mi)1992 1996 1997
Downstream from Bakers Bridge 43.3 -- 30 30
Upstream from Cascade Creek 54.7 15 20 16
Upstream from Needle Creek 61.0 -- 18 12
Upstream from Elk Creek 67.4 13 18 15
Upstream from Deer Park Creek 71.7 -- 5 11
Upstream from Kendall Gulch 72.0 9 -- 12
Upstream from Mineral Creek 73.0 -- 7 7
Regression equation y = –0.3027 ln(x)+ 31.968
y = –41.10 ln(x)+ 185.64
y = –24.803 ln(x)+ 118.24
R2 value R2 = 0.8248 R2 = 0.8371 R2 = 0.6003

remediation occurring between the time the pre-remediation data were collected and the time the post-remediation sampling was conducted or (2) a regression line can be fitted to the data such that the R 2 value is not unreasonably high, the effective-ness of remediation may be evaluated using multiple sample sites on the Animas River, a “Multiple Site Assessment.” At such sample sites, samples may be composited. Examples within the Animas River where a Multiple Site Assessment may be utilized are in the reach from Eureka Gulch to Boulder Gulch (sites 19–17, fig. 1), from Boulder Gulch to Cement Creek (sites 17–16, fig. 1), and from Mineral Creek to Bakers Bridge (sites 15–8, figs. 1 and 2). Regression lines fitted to the pre-remediation data may be compared to post-remediation regressions using an analysis such as ANOVA. If a signifi-cant difference between the pre- and the post-remediation data is found, then the difference must be compared to and be greater than the annual variation to imply that the differ-ence is attributable to remediation efforts. For example, in the reach from the confluence with Mineral Creek to Bakers Bridge (sites 15–8, figs. 1 and 2), regression analysis of the data may be fitted to 3 years of pre-remediation data: 1992 data collected by the Colorado Department of Public Health
0
10
20
30
40
50
60
70
18 17 13 11 10 9 7
SITE NUMBER
PE
RC
EN
T S
IMIL
AR
ITY
0.00
0.10
0.20
0.30
0.40
0.50
0.60
0.70
0.80
0.90
1.00
MO
RIS
ITA
'S S
IMIL
AR
ITY
IND
EX
Percent similarity Morisita's C
Figure 10. Pre-remediation baseline data for a Multiple Site Assessment. Variation of taxa richness within the Animas River canyon downstream from Silverton to the upstream from Hermosa Creek site for fall 1992 data collected by Colorado Department of Public Health; fall 1996 and fall 1997 data collected by USDA Forest Service, San Juan National Forest, and Animas River Stakeholders Group. Three years of consecutive, fall, post-remediation data collected at the same sample sites must be statistically different from the pre-remediation data to imply that mine-site remediation has improved diversity of macroinvertebrate communities. Variable for Y-axis may include any appropriate population metric.
and Environment and the fall 1996 and 1997 data collected for this study (table 2 and fig. 10). To assume that mine-site remediation has improved the diversity and evenness of the macroinvertebrate communities, 3 years of consecutive, fall, post-remediation data collected at the same sample sites must be statistically greater than the pre-remediation data. If no significant difference is observed between the pre-remediation data and the post-remediation data, then either further remedia-tion is required or more time for recovery of the benthos or colonization by macroinvertebrates is necessary before more post-remediation data are collected. In statistical assessment of the effectiveness of remediation, critical statistical values, α and β, do not necessarily have to be at the generally accepted 0.05 and 0.20 but may rather be set by the regulatory process and may be more or less stringent (Fleiss, 1981).
For either of these scenarios, composited samples should be taken from unimpaired streams to determine the degree that impaired communities are becoming more similar to unimpaired communities (fig. 10). Unimpaired streams are assumed to have healthy macroinvertebrate communities and thus accurately represent the goal of stream remediation.
870 Environmental Effects of Historical Mining, Animas River Watershed, Colorado

Monitoring Benthic Invertebrate Communities 871
SummaryThe primary objectives of establishing pre-remediation
baseline data were achieved by our obtaining multiple uncomposited samples for three sampling dates: fall 1996, spring 1997, and fall 1997, from 25 impaired sites in the Animas River watershed study area and beyond (figs. 1 and 2). These samples will allow for a statistical analysis to post-remediation data. Multiple, uncomposited samples from 11 ref-erence streams in the watershed were also collected (table 1). Specimens have been archived at the USDA Forest Service, San Juan National Forest laboratory, and identifications may be validated for comparison to post-remediation data. Meth-ods were proposed to evaluate the effectiveness of mine-site remediation and to decide when and where to conduct post-remediation sampling. The greatest limitation to the use of this data set in assessing the success of remediation will be the lack of information on temporal variation. A long-term, annual sampling program at a variety of sites with differing degrees of impairment will be important to an assessment of the effective-ness of future mine-site remediation (Chapman, 1999).
References Cited
Adams, S.M., Hill, W.R., Peterson, M.J., Ryon, M.G., Smith, J.G., and Stewart, A.J., 2002, Assessing recovery in a stream ecosystem—Applying multiple chemical and biological endpoints: Ecological Applications, v. 12, p. 1510–1527.
Barbour, M.T., Diamond, J.M., and Yoder, C.O., 1996, Biolog-ical assessment strategies—Applications and limitations, in Grothe, D.R., Dickson, K.L., and Reed-Judkins, D.K., eds., Whole effluent toxicity testing—An evaluation of methods and prediction of receiving system impacts: Pensacola, Fla., SETAC Press, p. 245–270.
Barbour, M.T., and Gerritsen, J., 1996, Subsampling of benthic samples—A defense of the fixed-count method: Journal of the North American Benthological Society, v. 15, p. 386–391.
Barbour, M.T., Plafkin, J.L., Bradley, B.P., Graves, C.G., and Wisseman, R.W., 1992, Evaluation of EPA’s rapid bioas-sessment benthic metrics—Metric redundancy and variabil-ity among reference stream sites: Environmental Toxicology and Chemistry, v. 11, p. 437–449.
Barbour, M.T., Stribling, J.B., and Karr, J.R., 1995, Multi-metric approach for establishing biocriteria and measur-ing biological condition, in Davis, W.S., and Simon, T.P., eds., Biological assessment and criteria—Tools for water resource planning and decision making: Boca Raton, Fla., Lewis Publishers, p. 63–77.
Blair, R.W., Jr., Yager, D.B., and Church, S.E., 2002, Surficial geologic maps along the riparian zone of the Animas River and its headwater tributaries, Silverton to Durango, Colo-rado, with upper Animas River watershed gradient profiles: U.S. Geological Survey Digital Data Series DDS–71.
Buxton, H.T., Nimick, D.A., von Guerard, Paul, Church, S.E., Frazier, Ann, Gray, J.R., Lipin, B.R., Marsh, S.P., Woodward, Daniel, Kimball, Briant, Finger, Susan, Ischinger, Lee, Fordham, J.C., Power, M.S., Bunck, Christine, and Jones, J.W., 1997, A science-based, watershed strategy to support effective remediation of abandoned mine lands: Proceedings of the Fourth International Conference on Acid Rock Drain-age, Vancouver, B.C., May 31–June 6, 1997, p. 1869–1880.
Chapman, M.G., 1999, Improving sampling design for mea-suring restoration in aquatic habitats: Journal of Aquatic Ecosystem Stress and Recovery, v. 6, p. 235–251.
Clements, W.H., Carlisle, D.M., Lazorchak, J.M., and Johnson, P.C., 2000, Heavy metals structure benthic com-munities in Colorado mountain streams: Ecological Appli-cations, v. 10, p. 626–638.
Davis, W.S., Syder, B.D., Stribling, J.B., and Stoughton, C., 1996, Summary of State biological assessment program for streams and wadeable rivers: Washington, D.C., U.S. Envi-ronmental Protection Agency; Office of Policy, Planning and Evaluation, EPA 230–R–96–007, 168 p.
DeShon, J.E., 1995, Development and application of the inver-tebrate community index (ICI), in Davis, W.S., and Simon, T.P., eds., Biological assessment and criteria—Tools for water resource planning and decision making: Boca Raton, Fla., Lewis Publishers, p. 217–243.
Fleiss, J.L., 1981, Statistical methods for rates and propor-tions, Second Edition: New York, John Wiley, 321 p.
Fore, L.S., Karr, J.R., and Wisseman, R.W., 1996, Assess-ing invertebrate responses to human activities—Evaluating alternative approaches: Journal of the North American Benthological Society, v. 15, p. 212–231.
Gotelli, N.J., and Entsminger, G.L., 2001, EcoSim—Null models software for ecology, Version 6.0 (03/04/02): Acquired Intelligence Inc. & Kesey-Bear, http://homepages.together.net/~gentsmin/ecosim.htm.
Hayslip, G.A., 1993, EPA Region 10 in-stream biological monitoring handbook (for wadeable streams in the Pacific Northwest): Seattle, Wash., U.S. Environmental Protec-tion Agency–Region 10, Environmental Services Division, EPA–910–9–92–013, 75 p.
Hurlbert, S.H., 1971, The nonconcept of species diversity—A critique and alternative parameters: Ecology, v. 52, p. 577–585.

Hutchinson, G.E., 1993, The zoobenthos, Volume IV, in Edmondson, Y.H., ed., A treatise on limnology: New York, John Wiley, 944 p.
Karr, J.R., and Chu, E.W., 1999, Restoring life in running waters: Covelo, Calif., Island Press, 206 p.
Karr, J.R., Fausch, K.D., Angermeier, P.L., Yant, P.R., and Schlosser, I.J., 1986, Assessment of biological integrity in running water—A method and its rationale: Champaign, Ill., Illinois Natural History Survey Special Publication 5, 28 p.
Kerans, B.L., and Karr, J.R., 1994, A benthic index of biotic integrity (B-IBI) for rivers of the Tennessee Valley: Ecologi-cal Applications, v. 4, p. 768–785.
Kondolf, G.M., 1995, Five elements for effective evaluation of stream restoration: Restoration Ecology, v. 3, p. 133–136.
Kondolf, G.M., and Micheli, E.R., 1995, Evaluating stream restoration projects: Environmental Management, v. 19, p. 1–15.
May, R.M., 1988, How many species on earth?: Science, v. 241, p. 1441–1449.
Michener, W.K., 1997, Quantitatively evaluating restoration experiments—Research design, statistical analysis, and data management considerations: Restoration Ecology, v. 5, p. 324–337.
Milhous, R.T., 1998, On sediment and habitat in the upper Animas River watershed, Colorado: Water Resources Engi-neering 98, v. 1, p. 678–693.
O’Neill, R.V., 1999, Recovery in complex ecosystems: Journal of Aquatic Ecosystem Stress and Recovery, v. 6, p. 181–187.
Parkhurst, B.R., Warren-Hicks, W.T., Cardwell, R.D., Volosin, J.S., Etchison, Tonya, Butcher, J., and Covington, S., 1999, Risk managing methods: Water Environment & Technology, v. 7, p. 39–43.
Plafkin, J.L., Barbour, M.T., Porter, K.D., Gross, S.K., and Hughes, R.M., 1989, Rapid bioassessment protocols for use in streams and rivers—Benthic macroinvertebrates and fish: Washington, D.C., U.S. Environmental Protection Agency, Office of Water Regulations and Standards, EPA 440–4–89–001, 192 p.
Purvis, A., and Hector, A., 2000, Getting the measure of biodi-versity: Nature, v. 405, p. 212–219.
Resh, V.H., Brown, A.V., Covich, A.P., Gurtz, M.E., Li, H.W., Minshall, G.W., Reice, S.R., Sheldon, A.L., Wallace, J.B., and Wissmar, R., 1988, The role of disturbance in stream ecology: Journal of the North American Benthological Society, v. 7, p. 433–455.
Resh, V.H., and Jackson, J.K., 1993, Rapid assessment approaches to biomonitoring and benthic macroinverte-brates: New York, Chapman and Hall, 488 p.
Rosenburg, D.M., and Resh, V.H., eds., 1993, Freshwater biomonitoring and benthic macroinvertebrates: New York, Chapman and Hall, 512 p.
Shackleford, B., 1988, Rapid bioassessments of lotic macro-invertebrate communities—Biocriteria development: Little Rock, Ark., Arkansas Department of Pollution Control and Ecology, 45 p.
Stone, M.K., and Wallace, J.B., 1998, Long term recovery of a mountain stream from clear-cut logging—The effects of for-est succession on benthic invertebrate community structure: Freshwater Biology, v. 39, p. 151–169.
Vinson, M.R., and Hawkins, C.P., 1996, Effect of sampling area and subsampling procedure—Comparisons of taxa richness among stream insects: Journal of the North Ameri-can Benthological Society, v. 15, p. 392–399.
Wallace, J.B., and Whiles, M.R., 1993, Dynamics of inorganic particles in headwater streams—Linkages with inverte-brates: Journal of the North American Benthological Soci-ety, v. 12, p. 112–125.
Yoder, C.O., and Rankin, E.T., 1999, Biological criteria for water resource management, in Schulze, P.C., ed., Measures of environmental performance and ecosystem condition: National Academy of Engineering, p. 227–259.
872 Environmental Effects of Historical Mining, Animas River Watershed, Colorado