effects of long term storage factors on nutritional value
TRANSCRIPT
Journal of Food and Nutrition Sciences 2019; 7(6): 87-95 http://www.sciencepublishinggroup.com/j/jfns doi: 10.11648/j.jfns.20190706.12 ISSN: 2330-7285 (Print); ISSN: 2330-7293 (Online)
Effects of Long Term Storage Factors on Nutritional Value of Conserved Barley Accessions in Ethiopia
Asnakech Senbeta*, Dejene Dida
Crop & Horticulture Biodiversity Directorate, Ethiopian Biodiversity Institute, Addis Ababa, Ethiopia
Email address:
*Corresponding author
To cite this article: Asnakech Senbeta, Dejene Dida. Effects of Long Term Storage Factors on Nutritional Value of Conserved Barley Accessions in Ethiopia. Journal of Food and Nutrition Sciences. Vol. 7, No. 6, 2019, pp. 87-95. doi: 10.11648/j.jfns.20190706.12
Received: August 23, 2019; Accepted: October 22, 2019; Published: November 8, 2019
Abstract: Ethiopia is one of the world centers of genetic diversity and origin of barley crop. Now a day the country is conserve many cereal crops under cold room storage, gene bank. One of the conserved crops is barley. Barley is the cereal crop, that mainly grown in the central highland of Ethiopia. The samples of 45 barley accessions were used for the current analysis. The aim of this study is to evaluate the effects of long term storage factors on nutritional value of barley that tested in 1993 and compare the results with nutritional value of barley that tested after 25 years (2018). Sample preparation and nutritional values were determined by using appropriate standard official procedures, AOAC (Association of Official Analytical Chemists). Descriptive graphs and paired t-test were used to analyze the data obtained on nutritional values of barley crop from two test years. The nutritional value of barley crop after 25 years of storage time was decreased as compared with its nutritional value tested in 1993, except total carbohydrate. As a result, the study found statistically significant difference of average percentage content of crude protein, total mineral ash, moisture and total carbohydrate between 1993 and after 25 years of storage time. The current study concluded that, when the storage time increases, the nutritional values of barley crop were significantly decreased for all nutritional values except crude fat content and total carbohydrate.
Keywords: Barley, Ethiopia, Long Term Storage, Nutritional Value, Paired T-test
1. Introduction
Ethiopia is known as a center of genetic diversity and origin for a number of cultivated and wild plants [1, 2]. The richness and range of genetic diversity in Ethiopia, particularly of landraces, is currently subject to serious genetic erosion and irreversible losses due to the changing nature of agricultural production. Widespread adoption of modern varieties, technological change (such as use of fertilizer and irrigation), land use change, habitat destruction and drought, among other important factors have lowered the demand for landraces adapted to marginal growing conditions in Ethiopia [3-5]. With the objective of addressing conservation of this diminishing plant genetic diversity in the country, the Plant Genetic Resources Centre of Ethiopia (PGRC/E), now the Ethiopian Biodiversity Institute (EBI) was established in 1976. The primary mandates of Ethiopian Biodiversity Institute include the preservation of genetic diversity of crop plants, their wild relatives, and native
species important to Ethiopian agriculture and biodiversity. The conservation of plant genetic materials depended on
collection. The collection priorities have been expeditions for agriculturally important, rare and threatened genotypes, to minimize genetic erosion and loss of varieties. Over 84 000 accessions from more than 120 plant species have been collected from across the country and preserved ex-situ at Ethiopian Biodiversity Institute. The ex-situ collection is managed in accordance with international standards for gene banks, with optimum treatment developed for seeds of most food crops [6]. The gene bank serves as a reservoir of genes potentially useful for many purposes, including resistance to diseases, pests and other environmental stresses, as well as for traits that increase yield or food quality. The storing seeds requirements are adequately dried (moisture contents as low as 5% for starchy seeds such as barley), careful production of high quality seed for maximum longevity, and carefully avoiding any sub-optimal effect of very low moisture content [7].

88 Asnakech Senbeta and Dejene Dida: Effects of Long Term Storage Factors on Nutritional Value of Conserved Barley Accessions in Ethiopia
Hermetically sealed aluminum foil bags are used for long-term (-10°C) and short-term (+4°C) seed storage. From the base and active collections, the seeds are regularly regenerated and multiplied, based on thresholds for viability or seed quantity. In addition to this, for some of conserved materials the nutritional values were analyzed. One of the most conserved materials in Ethiopian Biodiversity Institute is Barley. Barley (Hordeum vulgare L.) is the fourth most important cereal crop worldwide, after wheat, corn and rice, belonging to family Poaceae [8]. Ethiopia is a center of diversity for barley, because of the presence of great diversity in ecology [9]. It has a long history of cultivation in the highlands [10]. The principal uses of barley are as feed for animals, in the form of barley meal, and as grain for malting and brewing in the manufacture of beer and whisky [11, 12]. But barley in Ethiopia is mainly used for making local recipes and drinks, such as: Bread, Injera, kolo, Genfo, Animal feed, Beso, Tela and Borde. Over the last forty years Ethiopian Biodiversity Institute was conserved 16,224 accessions of barley, by ten years interval viability tested were done and the status of the material is evaluate, when it failed below standard it must be regenerate and multiply it. Accessions are tested and monitored both at the conserved time and during conservation in order to ensure the quality of the material in the gene bank. In the case of nutritional values analysis some of barley accessions were analyzed at the conserved time (25 years ago) but the conserved material was not analyzed again for the second time or during conservation. Due to this reason do not know the statuses of the nutritional values of the conserved materials were distorted or not. Now the current study is fill this research gaps. 45 accessions of conserved barley materials were used for analysis and observe the difference of nutritional values of the same barley accessions that analyzed 25 years ago. And compare the nutritional values performance of the results of these accessions. Therefore the objective of this study was to evaluate and determine the significant difference of the effect of long-term storage conditions on nutritional value of conserved barley grain at gene bank. This help to profile the overall barley nutritional information and long term storage effect for both consumption and research purpose.
2. Materials and Methods
2.1. Sample Size and Sample Preparations
45 barley accessions were used for the current research experiment. 30 g of each samples accession were received from cold room storage of Ethiopian biodiversity institute. The Seeds were hand-sorted to clean and remove foreign materials. The raw barely seeds prepared without removing the seed coat and made to flour with electric grinder or Retch sample mill (Retsch, ISO9001) until to pass through 0.5 mm sieve mesh size, and finally packed into airtight polyethylene plastic bags. The nutritional analysis was performed in 2 replicates. All laboratory experiment was conducted in
Ethiopian biodiversity institute
2.2. Nutritional Content Analysis
The nutritional value of the samples was carried out according to Association of Official Analytical Chemists (AOAC, 2000) method for nutrient analysis [13].
2.2.1. Determination of Moisture Content
The moisture content of the barley samples was determined by oven drying method. A clean, empty aluminum dishes, and its lids were dried in drying oven (Memment, Germany) at 100°C for 1hr, and cooled in a desiccator (with granular silica gel) for about 30 min, and weighed. The samples prepared for each accession were mixed thoroughly, and about 3.0 g of flour was weighed in duplicate. The dishes and the samples were placed in the drying oven, and dried for 3hr at 105°C. After drying, the samples were cooled in a desiccator for 30 min, and weighed it. Then percentage of moisture calculates as follow:
%������ =(( ���������������������)–( �������������������))× !!
��������� (1)
2.2.2. Determination of Crude Protein
The Protein content of the barley flour samples was determined by the Kjeldahl method. 1g of barely sample was used for this process, the experiment was passed three steps, such as digestion, Distillation and titration was involved. All nitrogen is converted to ammonia by digestion with a mixture of concentrated sulfuric acid and Kjeldahl tablet containing copper sulfate and potassium sulfate as a catalyst by 420°C temperature. The ammonia released after alkalization with sodium hydroxide is steam distilled into boric acid and titrated with 0.1N hydrochloric acid. Then the result is calculated as based on conversion factor form Nitrogen to Protein. Protein content (% N × 5.83) was determined by the Kjeldahl method described by [13].
%���"#$���% = (%& × 5.83) (2)
Where, % N = Percentage of Nitrogen. 5.83 = barley conversion factor.
2.2.3. Determination of Crude Fat Content
The crude fat content of barley flour samples was determined according to AOAC (2000) by Soxtec using Petroleum ether (b. pt 40-60°C) solvent. About 3.00 g of barley flour sample was added into the extraction thimbles and covered it with fat free cotton. The thimbles with the sample content were placed into soxtec extraction chamber and then switched on the heater. The cooling water was switched on, and a 25 ml of Petroleum ether was added to the extraction can and attached it into corresponding thimbles in soxtec extraction chamber. Over all extraction processes was conducted for about 1hr including solvent recover and evaporate. Then the extraction can with their content were removed from the extraction chamber and placed in the

Journal of Food and Nutrition Sciences 2019; 7(6): 87-95 89
drying oven at 100°C for about 30 min, cooled to room temperature in the desiccator for about 30 min and weighed it. The amount of fat was quantified gravimetrically and calculated from the difference in weight of the extraction can before and after extraction as percentage.
Calculate the fat content as follows:
%+�,-"�(( ��.����/�0����)–( ��.����/�0))× !!
��.���������� (3)
2.2.4. Determination of Total Ash Content
Total ash content of barely flour samples was determined by the dry ash method in a muffle furnace according to AOAC (2000). The crucible were placed in the muffle furnace (Carbolite CSF 1200) at 550°C overnight to ensure that impurities on the surface of crucible are burned off and the crucible cooled in the desiccator for 30 min. Then the crucible was weighed. About 3.0 g of barely flour of each sample in duplicate was added into each crucible, then put it in to the muffle furnace and heated at 550°C overnight. Finally, taken out of the crucible from the Muffle Furnace and immediately place it in a desiccator till cooled to room temperature, and each crucible with ash was weighed. Weight of total ash was calculated by difference, and expressed as percentage of samples.
Calculate the percentage ash content (wet weight basis) as follows:
%ash(wet)
=((7�8ℎ��-:�:�;# + "�ℎ)–(7�8ℎ��-:�:�;#)) × 100
7�8ℎ��-�"?@#
Calculation of ash content on dry basis (when moisture content is known) as follows:
%ABC(,D) =%���( ��)× !!
( !!E%�����F��) (4)
2.2.5. Total Carbohydrate Content
Total Carbohydrate content was obtained by difference from the combined percent of moisture, protein, ash and fat from 100. The result was calculated as follows;
Total Carbohydrate content = 100 – {moisture (g %) + crude protein (g %) + total fat (g %) + total ash (g %)} (5)
Where (g %) = grams per 100 grams.
3. Statistical Analysis
All laboratory experiments were carried out duplicate for each extract (n=2). The mean, tables, graphs, charts and standard deviation (SD) of means were used to describe the research data. The statistical analyses were performed by paired t-test of mean comparisons at 5% level of significance.
4. Results and Discussion
The nutritional values of 45 conserved barley accessions
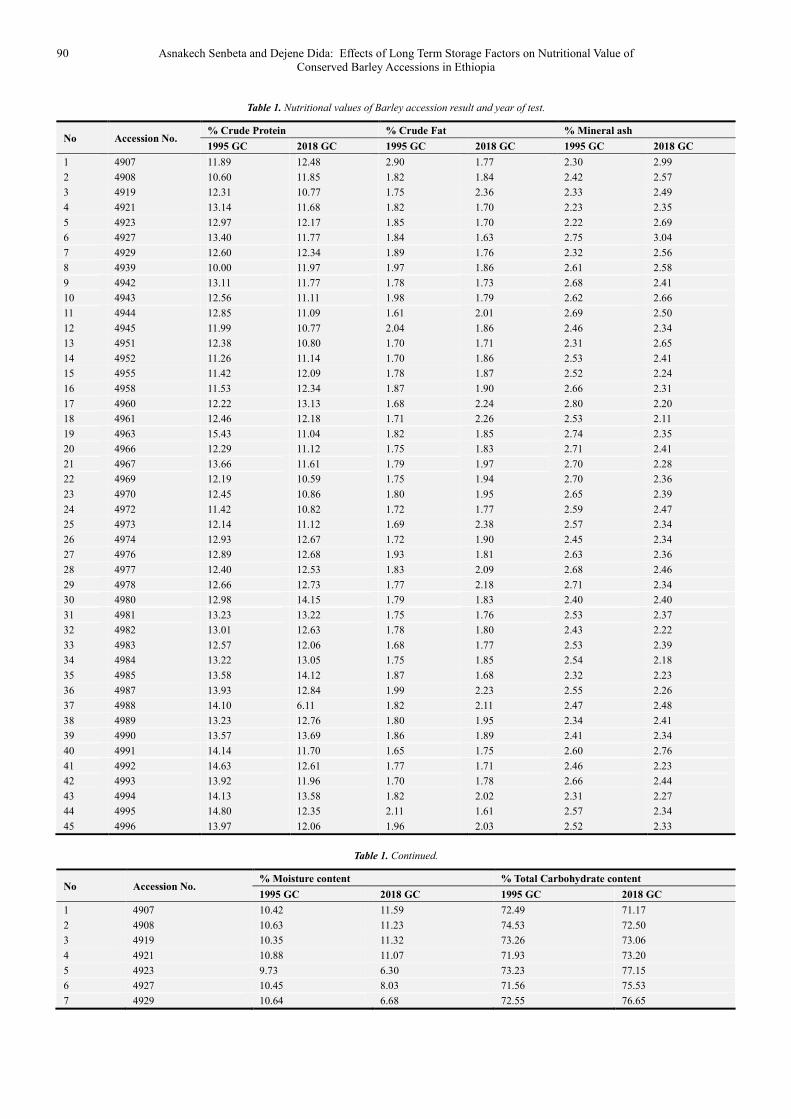
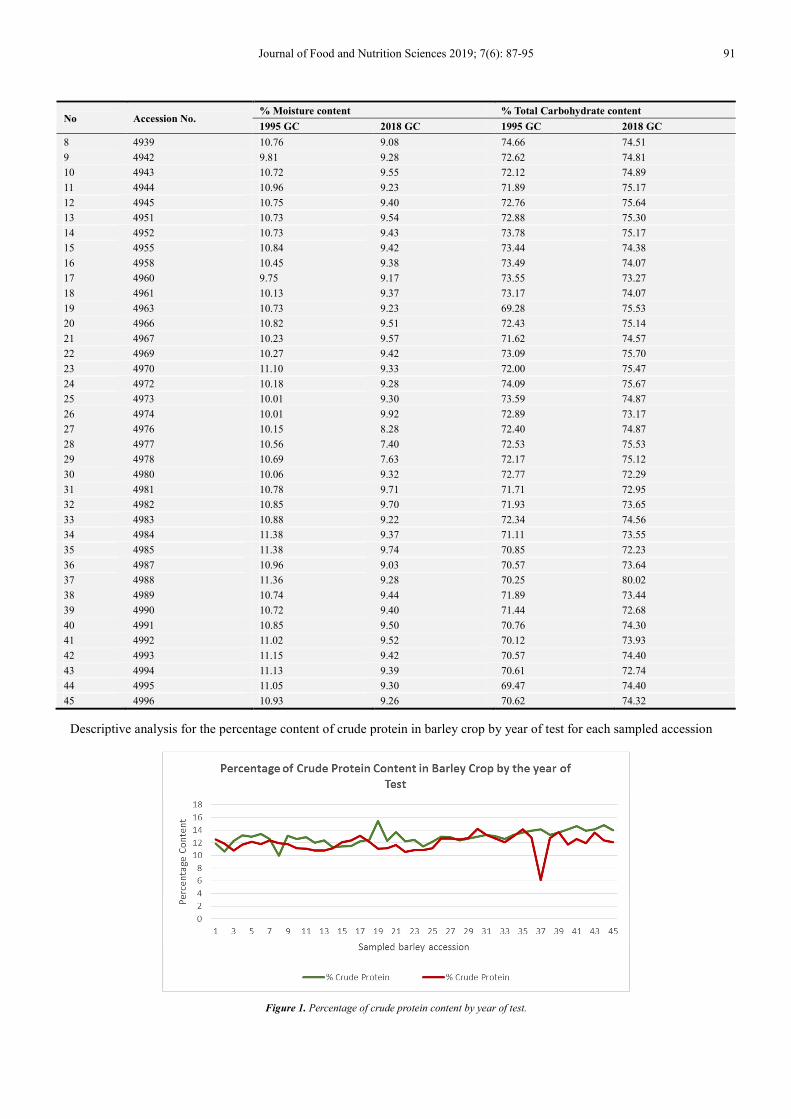
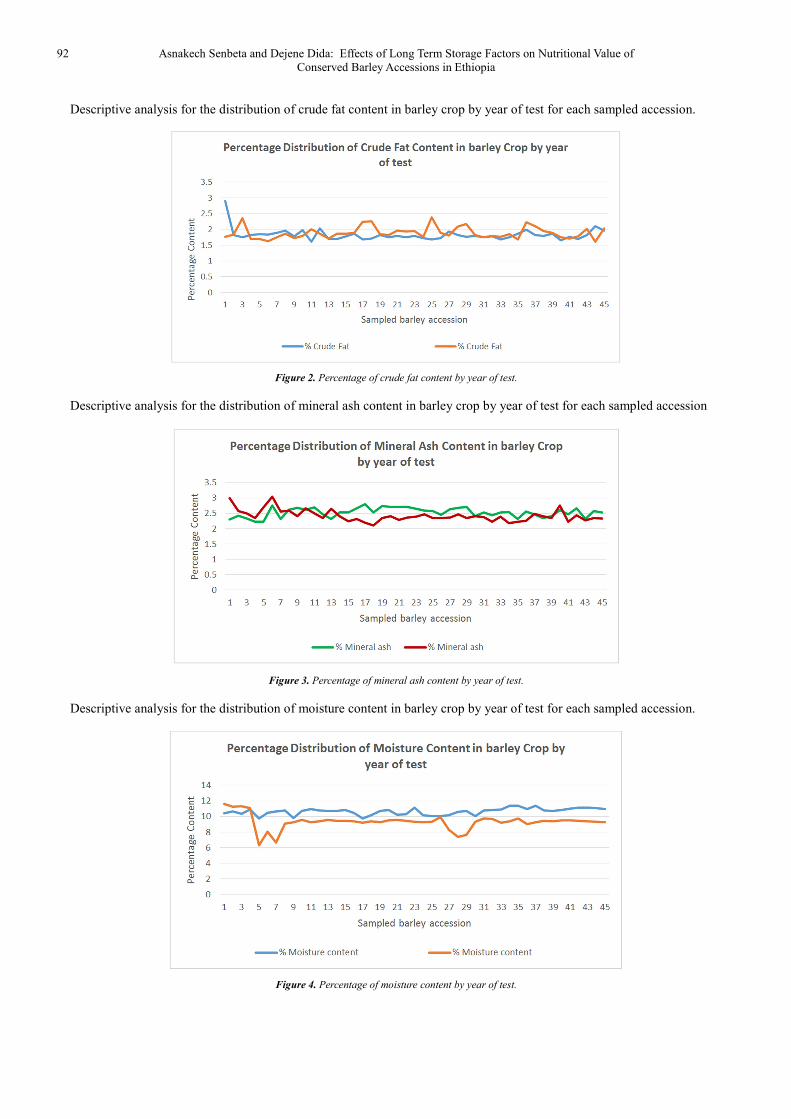
were tested in 1993 were evaluated for the second time on the same barley accession after 25 years in 2018. The result of all accessions analysis for nutritional values was presented in the table 1. The long term storage time was influenced the nutritional composition results of the barley samples. The graph illustrate below shows different result of the same accession by different years of test; crude protein, crude fat, total mineral ash, moisture content and total Carbohydrate content. As indicated in the figure 1, the percentage content of crude protein was slightly decreases and fluctuates as storage time increase. The highest percentage of crude protein (%15.43) was obtained in accession number 4963 that test in 1993, and the lowest (%6.11) was observed in accession number 4988 that test in 2018. Therefore a storage time is affecting the percentage content of crude protein in barley crop. On contrary, the figure 2 shows the percentage content of crude fat was fluctuate randomly when the storage time increases. But the highest percentage of crude fat (%2.90) was determined in accession number 4907 in test year 1993 whereas, the lowest (%1.61) was determined in accession number 4944 in 1993 and accession number 4995 in the test year of 2018. More or less a storage time is affecting the percentage content of crude fat in barley.
Moreover, figure 3 shows, the percentage content of total mineral ash was slightly decreased and sometimes fluctuated as storage time increase. The highest percentage of total mineral ash (%3.04) was obtained in accession number 4927 that test in 2018, and the lowest amount of total mineral ash content (%2.11) was observed in accession number 4961 that test in 2018. But percentage of total mineral ash decreases as storage time increases. It indicates that, a storage time is affecting the percentage of total mineral ash in barley. Similarly, in figure 4, it indicates percentage of moisture content was decreased and sometime fluctuated as storage time increase. Thus, it indicate that when storage time increase, the conserved material is loss its moisture. The highest percentage of moisture content (%11.59) was determined in accession number 4907 that test in 2018, and the lowest amount of moisture content (%6.30) was obtained in accession number 4923 that test in 2018. Logically, moisture content decrease as storage time increase. So that storage time is affecting the moisture content of barley accession. Furthermore, figure 5 indicates that percentage of total carbohydrate content was increase as storage time increase. The highest percentage of total carbohydrate (%80.02) was obtained in accession number 4988 that test in 2018, and the lowest percentage of total carbohydrate content (%69.28) was obtained in accession number 4963 that test in 1993. But percentage of total carbohydrate content increase as storage time increase. This is due to the material loss its moisture content and the substance concentrates. Therefore storage time is affecting total carbohydrate content of barley.
90 Asnakech Senbeta and Dejene Dida: Effects of Long Term Storage Factors on Nutritional Value of Conserved Barley Accessions in Ethiopia
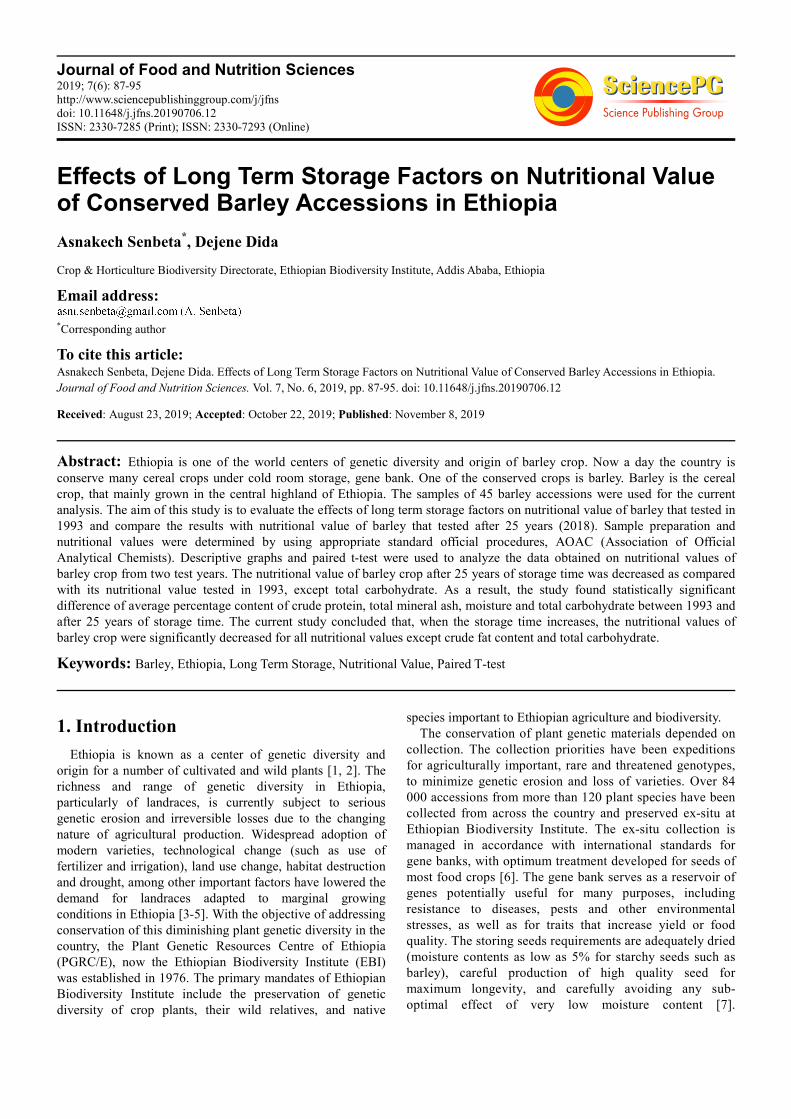
Table 1. Nutritional values of Barley accession result and year of test.
No Accession No. % Crude Protein % Crude Fat % Mineral ash
1995 GC 2018 GC 1995 GC 2018 GC 1995 GC 2018 GC
1 4907 11.89 12.48 2.90 1.77 2.30 2.99
2 4908 10.60 11.85 1.82 1.84 2.42 2.57
3 4919 12.31 10.77 1.75 2.36 2.33 2.49
4 4921 13.14 11.68 1.82 1.70 2.23 2.35
5 4923 12.97 12.17 1.85 1.70 2.22 2.69
6 4927 13.40 11.77 1.84 1.63 2.75 3.04
7 4929 12.60 12.34 1.89 1.76 2.32 2.56
8 4939 10.00 11.97 1.97 1.86 2.61 2.58
9 4942 13.11 11.77 1.78 1.73 2.68 2.41
10 4943 12.56 11.11 1.98 1.79 2.62 2.66
11 4944 12.85 11.09 1.61 2.01 2.69 2.50
12 4945 11.99 10.77 2.04 1.86 2.46 2.34
13 4951 12.38 10.80 1.70 1.71 2.31 2.65
14 4952 11.26 11.14 1.70 1.86 2.53 2.41
15 4955 11.42 12.09 1.78 1.87 2.52 2.24
16 4958 11.53 12.34 1.87 1.90 2.66 2.31
17 4960 12.22 13.13 1.68 2.24 2.80 2.20
18 4961 12.46 12.18 1.71 2.26 2.53 2.11
19 4963 15.43 11.04 1.82 1.85 2.74 2.35
20 4966 12.29 11.12 1.75 1.83 2.71 2.41
21 4967 13.66 11.61 1.79 1.97 2.70 2.28
22 4969 12.19 10.59 1.75 1.94 2.70 2.36
23 4970 12.45 10.86 1.80 1.95 2.65 2.39
24 4972 11.42 10.82 1.72 1.77 2.59 2.47
25 4973 12.14 11.12 1.69 2.38 2.57 2.34
26 4974 12.93 12.67 1.72 1.90 2.45 2.34
27 4976 12.89 12.68 1.93 1.81 2.63 2.36
28 4977 12.40 12.53 1.83 2.09 2.68 2.46
29 4978 12.66 12.73 1.77 2.18 2.71 2.34
30 4980 12.98 14.15 1.79 1.83 2.40 2.40
31 4981 13.23 13.22 1.75 1.76 2.53 2.37
32 4982 13.01 12.63 1.78 1.80 2.43 2.22
33 4983 12.57 12.06 1.68 1.77 2.53 2.39
34 4984 13.22 13.05 1.75 1.85 2.54 2.18
35 4985 13.58 14.12 1.87 1.68 2.32 2.23
36 4987 13.93 12.84 1.99 2.23 2.55 2.26
37 4988 14.10 6.11 1.82 2.11 2.47 2.48
38 4989 13.23 12.76 1.80 1.95 2.34 2.41
39 4990 13.57 13.69 1.86 1.89 2.41 2.34
40 4991 14.14 11.70 1.65 1.75 2.60 2.76
41 4992 14.63 12.61 1.77 1.71 2.46 2.23
42 4993 13.92 11.96 1.70 1.78 2.66 2.44
43 4994 14.13 13.58 1.82 2.02 2.31 2.27
44 4995 14.80 12.35 2.11 1.61 2.57 2.34
45 4996 13.97 12.06 1.96 2.03 2.52 2.33
Table 1. Continued.
No Accession No. % Moisture content % Total Carbohydrate content
1995 GC 2018 GC 1995 GC 2018 GC
1 4907 10.42 11.59 72.49 71.17
2 4908 10.63 11.23 74.53 72.50
3 4919 10.35 11.32 73.26 73.06
4 4921 10.88 11.07 71.93 73.20
5 4923 9.73 6.30 73.23 77.15
6 4927 10.45 8.03 71.56 75.53
7 4929 10.64 6.68 72.55 76.65
Journal of Food and Nutrition Sciences 2019; 7(6): 87-95 91
No Accession No. % Moisture content % Total Carbohydrate content
1995 GC 2018 GC 1995 GC 2018 GC
8 4939 10.76 9.08 74.66 74.51
9 4942 9.81 9.28 72.62 74.81
10 4943 10.72 9.55 72.12 74.89
11 4944 10.96 9.23 71.89 75.17
12 4945 10.75 9.40 72.76 75.64
13 4951 10.73 9.54 72.88 75.30
14 4952 10.73 9.43 73.78 75.17
15 4955 10.84 9.42 73.44 74.38
16 4958 10.45 9.38 73.49 74.07
17 4960 9.75 9.17 73.55 73.27
18 4961 10.13 9.37 73.17 74.07
19 4963 10.73 9.23 69.28 75.53
20 4966 10.82 9.51 72.43 75.14
21 4967 10.23 9.57 71.62 74.57
22 4969 10.27 9.42 73.09 75.70
23 4970 11.10 9.33 72.00 75.47
24 4972 10.18 9.28 74.09 75.67
25 4973 10.01 9.30 73.59 74.87
26 4974 10.01 9.92 72.89 73.17
27 4976 10.15 8.28 72.40 74.87
28 4977 10.56 7.40 72.53 75.53
29 4978 10.69 7.63 72.17 75.12
30 4980 10.06 9.32 72.77 72.29
31 4981 10.78 9.71 71.71 72.95
32 4982 10.85 9.70 71.93 73.65
33 4983 10.88 9.22 72.34 74.56
34 4984 11.38 9.37 71.11 73.55
35 4985 11.38 9.74 70.85 72.23
36 4987 10.96 9.03 70.57 73.64
37 4988 11.36 9.28 70.25 80.02
38 4989 10.74 9.44 71.89 73.44
39 4990 10.72 9.40 71.44 72.68
40 4991 10.85 9.50 70.76 74.30
41 4992 11.02 9.52 70.12 73.93
42 4993 11.15 9.42 70.57 74.40
43 4994 11.13 9.39 70.61 72.74
44 4995 11.05 9.30 69.47 74.40
45 4996 10.93 9.26 70.62 74.32
Descriptive analysis for the percentage content of crude protein in barley crop by year of test for each sampled accession
Figure 1. Percentage of crude protein content by year of test.
92 Asnakech Senbeta and Dejene Dida: Effects of Long Term Storage Factors on Nutritional Value of Conserved Barley Accessions in Ethiopia
Descriptive analysis for the distribution of crude fat content in barley crop by year of test for each sampled accession.
Figure 2. Percentage of crude fat content by year of test.
Descriptive analysis for the distribution of mineral ash content in barley crop by year of test for each sampled accession
Figure 3. Percentage of mineral ash content by year of test.
Descriptive analysis for the distribution of moisture content in barley crop by year of test for each sampled accession.
Figure 4. Percentage of moisture content by year of test.

Journal of Food and Nutrition Sciences 2019; 7(6): 87-95 93
Descriptive analysis of the distribution of total carbohydrate content in barley crop by year of test for each sampled accession.
Figure 5. Percentage of total carbohydrate content by year of test.
Figure 6. Average percentage contents of Barley crop by ingredients and year of test.
Test of average percentage contents of nutritional values in the barley crop in 1993 and after 25 years of storage time (in 2018) were decreased. The data was obtained from the test of percentage crude protein, crude fat, Mineral ash, moisture and total carbohydrate contents conducted on the same
sampled barley accession in 1993 and 2018. The paired t-test of mean difference of percentage content ingredients in barley crop in 1993 and after 25 years of storage (in 2018), Significant at 5% level
Table 2. Test of difference in average percentage contents of nutritional values of barley accession in 1993 and after 25 years (2018).
Paired Samples Statistics for Barley Crop between percentage content in
1993 and after 25 years of storage time (2018)
Percentage Content Paired Differences
95% Conf. Interval t
Mean Lower Upper
Pair 1 Crude Protein Contents in 1993 test 12.848±0.16
0.407 1.373 3.714* Crude Protein Contents in 2018 test 11.958±0.19
Pair 2 Crude Fat Contents in 1993 test 1.83±0.029
-0.154 0.024 -1.477 Crude Fat Contents in 2018 test 1.895±0.028
Pair 3 Mineral Ash Contents in 1993 test 2.53±0.023
0.033 0.185 2.876* Mineral Ash Contents in 2018 test 2.42±0.028
Pair 4 Moisture Contents in 1993 test 10.638±0.063
1.036 1.639 8.936* Moisture Contents in 2018 test 9.3±0.147
Pair 5 Total Carbohydrate Contents in 1993 test 72.156±0.191
-2.875 -1.670 -7.601* Total Carbohydrate content in 2018 test 74.428±0.223
*Significant at 5% level.

94 Asnakech Senbeta and Dejene Dida: Effects of Long Term Storage Factors on Nutritional Value of Conserved Barley Accessions in Ethiopia
As it can be depicted in the Table 2, the average
percentage difference of crude protein contents in barley crop was found statistically significant. It indicates that, there is significant difference in average percentage contents of crude protein of barley after 25 years of storage time. The high average percentage of crude protein shown in 1993 test year (12.848±0.16) and the lowest was shown in 2018 test year (11.958±0.19). The percentage of crude protein in barley were in general agreement with the values (7.50–12.12%) [14]. But this study shows little different for that agreement value, but still in the range. Such a difference could be due to variety and environmental conditions [15]. Other studies have also found that protein content of barley is highly dependent on the cultivar [16] and differs with growth conditions, particularly with the rate and timing of nitrogen fertilization [17]. According to [18] the crude protein concentration in barley varieties ranged from 9.44% to 13.57% it is similar to these studies. The average percentage difference of average crude fat contents in barley crop was found statistically insignificant. The average crude fat concentration in 1993 test year was (1.83±0.029) and 2018 test year was (1.895±0.028). A crude fat value is similar in barley varieties that determined in earlier studies [19].
As indicated in the Table 2, average percentage difference of mineral ash contents in barley crop was found statistically significant. It indicates that, there is significant difference in average percentage contents of mineral ash of barley after 25 years of storage time and before. The results shows that the high mineral ash content was in test year 1993 (2.53±0.023) and the lowest result obtained after 25 years of storage time (2.42±0.028). The obtained results, of the chemical composition in barley grains are comparable with those reported by [20].
As it can be depicted in the Table 2, the average percentage difference of moisture content in barley crop was found statistically significant. It indicates that, there is significant difference in average percentage contents of moisture of barley after 25 years of storage time and before. The result showed that the percentage content of moisture was obtained (10.638±0.063) and (9.3±0.147) in 1993 and 2018 respectively. Notably, the value of moisture content was decreases as storage time increases. This was because of the moisture content depends on the storage condition and hydroscopic capacity of the seed [21].
Moreover, the average percentage difference of total carbohydrate contents in barley crop was found statistically significant. It indicates that, there is significant difference in average percentage contents of total carbohydrate of barley after 25 years of storage time. The result showed that the percentage content of total carbohydrate was found (72.156±0.191) and (74.428±0.223) respectively in 1993 and 2018. As storage time increases percentage value of total carbohydrate also increase, this is due to all nutritional value of the sample decrease. Barley was higher in total carbohydrate than other crops as many reviewers indicated in their studies.
5. Conclusion
The study revealed that long term storage was affect nutritional value of conserved barley crop. As a result, the study found; statistically significant difference of average percentage content of crude protein, mineral ash, moisture and total carbohydrate between 1993 and after 25 years of storage time. The current study concluded that, when the storage time increases, the nutritional values of barley crop were significantly decreased for all nutritional values except crude fat content and total carbohydrate. Thus, it helps to profile the overall barley nutritional information and long term storage effect for both consumption and research purpose. Therefore, this study recommends that, the conserved material in Gene Bank should regenerate at possible short period of time.
Conflict of Interest
The author declares that there is no conflict of interests regarding the publication of this paper.
Acknowledgements
Author would like to acknowledge Ethiopian Biodiversity Institute, Tinsaye Dagmawi and Miss Mabert Belay to all others who directly or indirectly contributed to the success of this work. Again special thanks go to Mr. Ashenafi Senbeta.
References
[1] Vavilov, N. R. (1951). The origin, variation, immunity and breeding of cultivated plants. Chronica Botanica, 13: 1–366.
[2] Harlan, J. R. (1969). Ethiopia: A centre of diversity. Economic Botany, 23: 305–314.
[3] Melaku Worede & Hailu Mekbib. (1993). Linking genetic resource conservation to farmers in Ethiopia. pp. 78–84, in: W. de Boef, K. Amanor, K. Wellard and A. Bebbington (eds.). Cultivating Knowledge. Intermediate Technology Publications, London, UK.
[4] FAO (1998). State of the World’s Plant Genetic Resources for Food and Agriculture. FAO, Rome, Italy.
[5] Tripp, R. & van der Heide, W. (1996). The Erosion of Crop Genetic Diversity: Challenges, Strategies and Uncertainties. Natural Resource Perspectives [series]. Overseas Development Institute, London, UK.
[6] Harrington, J. F. (1970). Seed and pollen storage for conservation of plant gene resources. pp 501–521, in: O. H. Frankel and E. Bennett (eds.). Genetic Resources in Plants—Their Exploration and Conservation. IBP Handbook No. 11. Blackwell Scientific, Oxford, UK.
[7] Rao, N. K. & Jackson, M. T. (1996). Seed production environment and storage longevity of japonica rices (Oryza sativa L.). Seed Science Research, 6: 17–21.
Journal of Food and Nutrition Sciences 2019; 7(6): 87-95 95
[8] Marwat S. K., et al. (2012). Barley (Hordeum vulgare L.) A Prophetic Food Mentioned in Ahadith and its Ethnobotanical Importance. American-Eurasian Journal of Agricultural and Environmental Sciences, 12 (7). P. 835–841. Marwat S. K., et. al, 2012.
[9] Berhane, L. (1991). Barley Dependence Cereal in Ethiopia, IAR, News Letter Agricultural Research (2): 3.
[10] Fridissa, E., Woldeyeseus, S., Heinrich, G., (2010). On farm Diversity and Characterization of Barley (Hordeum vulgare L.) Landraces in the Highlands of West Shewa, Ethiopia vol. 8: 025 034.
[11] Molina Cano, J. L., et al (2002) Relationship between barley hordeins and malting quality in a mutant of cv. Triumph II. Genetic and environmental effects of water uptake. J of Cereal Sci 36: 39-50.
[12] Edney, M. J., Mather, D. E. (2004). Quantitative trait loci affecting germination traits and malt friability in a two-rowed by six -rowed barley cross. J of Cereal Sci 39: 283-290.
[13] AOAC (2000). Methods of analysis (15th Ed.). Washington, DC: Association of Official Analytical Chemists.
[14] Jood, S., Kalra, S (2001). Chemical composition and nutritional characteristics of some hull less and hulled barley cultivars grown in India. Nahrung/Food. 2001. 45 (1). P. 35–39.
[15] Oscarsson, M., et al. (1996). Chemical composition of barley samples focusing on dietary fibre components. Journal of Cereal Science. 24 (2). P. 161–170.
[16] Qi, J. C., Zhang, G. P., Zhou, M. X. (2006). Protein and hordein content in barley seeds as affected by nitrogen level and their relationship to beta-amylase activity. Journal of Cereal Science. 43 (1). P. 102–107.
[17] Arendt, E. K., Zannini, E (2013). Cereal Grains for the Food and Beverage Industries. Woodhead Publishing, Cambridge. 485.
[18] Kliseviciute, V., et al. (2016). Nutritional value and digestible energy of different genotypes of barley in the horses and rabbits nutrition. Tagungsband: 15. BOKU-Symposium Tierernährung: Verarbeitung von Futtermitteln für die Mischfutterherstellung. Wien. P. 103–107.
[19] Šterna, V., Zute, S., Jākobsone, I. (2015) Grain composition and functional ingredients of barley varieties created in Latvia. Proceedings of the Latvian academy of sciences. Section B. 69 (4). P. 158–162.
[20] Makeri, M. U., Nkama, I., Badau, M. H (2013). Physicochemical, malting and biochemical properties of some improved Nigerian barley cultivars and their malts. International Food Research Journal. 20 (4). P. 1563–1568.