effects of long duration earthquakes on bridge structures · effects of long duration earthquakes...
TRANSCRIPT

EFFECTS OF LONG DURATION EARTHQUAKES ON BRIDGE
STRUCTURES
By
BLANDINE C. VALLE
A thesis submitted in partial fulfillment of the requirements for the degree of
MASTER OF SCIENCE IN CIVIL ENGINEERING
WASHINGTON STATE UNIVERSITY Department of Civil and Environmental Engineering
DECEMBER 2005

To the faculty of Washington State University:
The members of the Committee appointed to examine the thesis of BLANDINE
VALLE find it satisfactory and recommend that it be accepted.
____________________________________ Chair
____________________________________
____________________________________
ii

ACKNOWLEDGMENTS
This research was carried out in the Department of Civil and Environmental
Engineering at Washington State University, Pullman, Washington. Funding was
provided by The Washington State Department of Transportation (WSDOT).
I wish to express my gratitude to the chairman of my committee, Dr. McDaniel,
for his patience, guidance and support throughout the project. Special thanks are extended
to Drs. McLean and Cofer for serving on my committee. I would also like to thank Cody
Cox for his generous help and advice.
I am thankful to Maureen Clausen and Vicky Ruddick for helping me with the
administrative issues throughout the project.
Most of all, I would like to thank my family for supporting and encouraging me
all through my studies and I am deeply grateful to Tom for his love, encouragement and
advice throughout the past five years.
iii

EFFECTS OF LONG DURATION EARTHQUAKES ON BRIDGE
STRUCTURES
ABSTRACT
By Blandine C Valle, M.S.
Washington State University December 2005
Chair: Cole C. McDaniel
The main objective of this research was to assess the response of multi-column
bent bridges, with columns expected to behave primarily in shear, subject to long-
duration earthquake. Recent geological evidence indicates that the potential exists for
large earthquakes resulting in long-duration ground motions in the Pacific Northwest due
to rupturing of the locked interface between the Juan de Fuca and the North American
Plate. Three Washington State Department of Transportation bridges were selected for
this study, bridges 5/227, 5/649 and 512/29. All three bridges are located in close
proximity to Olympia and Seattle. Ten earthquake records with return periods ranging
from 475 to 2475 years were used to study the effect of duration on bridge response; six
long-duration and four short-duration.
Since the column aspect ratios were similar for the three bridges (approximately
3), other bridge characteristics were more influential on the variation of the bridge
seismic responses. The bridge deck design, monolithic or non-monolithic, and the bridge
geometry greatly influenced the behavior. Each bridge was unique enough that in order
iv

to accurately assess the seismic vulnerability of each bridge, nonlinear time history
analyses were needed rather than basing predictions merely on bridge member detailing,
as is often the case due to limited resources.
In general, the 475-year return period earthquakes induced light to moderate
cracking in the column plastic hinge regions for all bridges. The 975-year return period
earthquakes created more severe cracking with bearing pad failures in one of the bridges.
The 2475-year return period earthquakes induced failures in the center bent columns as
well as numerous bearing pad failures for all three bridges. The damage estimations for
each earthquake were based on damage recorded in experimental column testing.
Overall, long-duration earthquakes created more damage in the three bridges than
short-duration earthquakes. For the smaller earthquakes, the duration had little effect on
the bridge response since multiple cycles at low ductility demands did not lead to damage
of the columns. As the intensity of the earthquake and the duration increased, damage in
the columns increased. Therefore, both earthquake intensity and ground motion duration
affect the bridge response; however, large intensity alone can lead to significant demand
on the bridges, while duration is not influential on the bridge demand unless the intensity
is high as well.
v

TABLE OF CONTENTS
Abstract .............................................................................................................................. iv
Table of Contents............................................................................................................... vi
List of Figures .................................................................................................................... ix
List of Tables ................................................................................................................... xvi
CHAPTER ONE ................................................................................................................. 1
Introduction......................................................................................................................... 1
1.1 Background............................................................................................. 1
1.2 Objectives ............................................................................................... 1
1.3 Seismic Activity in the Pacific Northwest .............................................. 2
CHAPTER TWO ................................................................................................................ 7
Literature Review................................................................................................................ 7
2.1 Definition of Earthquake Duration ......................................................... 7
2.2 Damage Indices..................................................................................... 11
2.3 Effect of Earthquake Duration on the Damage in Reinforced Concrete
Structures ............................................................................................................... 13
CHAPTER THREE .......................................................................................................... 15
Bridge Modeling ............................................................................................................... 15
3.1 Bridge Descriptions .................................................................................... 15
3.1.1 Bridge 5/227......................................................................................... 15
• Geographical Location...................................................................... 15
• Bridge Properties .............................................................................. 15
• Bridge Material Properties................................................................ 20
vi

3.1.2. Bridge 5/649........................................................................................ 21
• Geographical Location...................................................................... 21
• Bridge Properties .............................................................................. 21
• Bridge Material Properties................................................................ 25
3.1.3 Bridge 512/19....................................................................................... 26
• Geographical Location...................................................................... 26
• Bridge Properties .............................................................................. 26
• Bridge Material Properties................................................................ 31
3.2 Bridge Calibration....................................................................................... 31
3.2.1 Jaradat Specimens................................................................................ 31
3.2.2 Scaling.................................................................................................. 33
• Scaling the Forces and Moments: ..................................................... 34
• Scaling the Displacements ................................................................ 36
3.2.3 Modeling .............................................................................................. 39
• Calculating the Spring Values .......................................................... 41
CHAPTER FOUR............................................................................................................. 44
Seismic Analysis............................................................................................................... 44
4.1 Seismic Excitations..................................................................................... 44
CHAPTER FIVE .............................................................................................................. 57
Bridge 5/649 Skew Comparison ....................................................................................... 57
5.1 Bridge 5/649 Skew or Straight Model ........................................................ 57
5.1.1 Maximum Demands.......................................................................... 58
5.1.2 Hysteresis Curves.............................................................................. 61
vii

5.1.3 Time History Comparison................................................................. 64
CHAPTER SIX................................................................................................................. 67
Bridge Response ............................................................................................................... 67
6.1 Bridge 5/227.......................................................................................... 67
6.2 Bridge 512/19........................................................................................ 83
6.3 Bridge 5/649.......................................................................................... 93
CHAPTER SEVEN ........................................................................................................ 103
Conclusions..................................................................................................................... 103
References....................................................................................................................... 107
APPENDICES ................................................................................................................ 109
APPENDIX A-1.............................................................................................................. 110
APPENDIX A-2.............................................................................................................. 113
A-2-1 Ruaumoko 3D Input File Calculations............................................. 114
A-2-1 Bridge 5/227 Ruaumoko Input File.................................................. 115
A-2-2 Bridge 512/19 Ruamoko Input File.................................................. 125
A-2-3 Bridge 5/649 Ruaumoko Input File.................................................. 132
APPENDIX A-3.............................................................................................................. 141
APPENDIX A-4.............................................................................................................. 142
viii

LIST OF FIGURES
Figure 1.3-1 Cascadia Subduction Zone (from The Pacific Northwest Seismograph
Network) ..................................................................................................................... 3
Figure 1.3-2 Map of the Bridge Locations.......................................................................... 5
Figure 2.1-1 Difference Between Rock Site and Soil Site Acceleration Spectra ............... 9
Figure 2.1-2 Duration versus Magnitude for Rock Sites in the Western United States. .. 10
Figure 2.2-1 Reliability Index Versus Earthquake Duration from Lindt et al. (2004) ..... 12
Figure 2.3-1 Expected Damage versus Normalized Duration for Representative Linear
Reinforced Concrete Structure.................................................................................. 14
Figure 3.1.1-1 Bridge 5/227 Location............................................................................... 15
Figure 3.1.1-2 Bridge 5/227 Plan View............................................................................ 16
Figure 3.1.1-3 Bridge 5/227 Elevation View.................................................................... 16
Figure 3.1.1-4 Bridge 5/227 50 ft. Series Girder .............................................................. 17
Figure 3.1.1-5 Bridge 5/227 Column Detail ..................................................................... 18
Figure 3.1.1-6 Bridge 5/227 Intermediate Bent Footings ................................................. 19
Figure 3.1.1-7 Bridge 5/227 Expansion Joint Detail ........................................................ 19
Figure 3.1.1-8 Bridge 5/227 Abutment Sub-Ground Column and Footing...................... 20
Figure 3.1.2-1 Bridge 5/649 Location............................................................................... 21
Figure 3.1.2-2 Bridge 5/649 Plan View............................................................................ 22
Figure 3.1.2-3 Bridge 5/649 Elevation View.................................................................... 22
Figure 3.1.2-4 Bridge 5/649 Girder Detail........................................................................ 23
Figure 3.1.2-5 Bridge 5/649 Column Detail ..................................................................... 24
ix

Figure 3.1.2-6 Bridge 5/649 Footing Detail...................................................................... 24
Figure 3.1.2-7 Bridge 5/649 Abutment Footing detail: (a) Cross-section, (b) Elevation . 25
Figure 3.1.3-1 Bridge 512/19 Intersection........................................................................ 26
Figure 3.1.3-2 Bridge 512/19 Plan View.......................................................................... 27
Figure 3.1.3-3 Bridge 512/19 Elevation View.................................................................. 27
Figure 3.1.3-4 Bridge 512/19 Girder Detail...................................................................... 28
Figure 3.1.3-5 Bridge 512/19 Column Detail ................................................................... 29
Figure 3.1.3-6 Bridge 512/19 Abutment Cross-section .................................................... 30
Figure 3.1.3-7 Bridge 512/19 Girder Stop : (a) Plan View and (b) Locations ................. 30
Figure 3.2.1-1 Specimen T2 Lateral Load-Displacement Hysteresis Curve .................... 32
Figure 3.2.1-2 Specimen T2 Force-Displacement Envelope of Specimen T2 ................. 33
Figure 3.2.2-1 Relationship Between “D-a/2” Experimental and Model ......................... 35
Figure 3.2.2-2 Bilinear Relationship Between Moment and Curvature ........................... 37
Figure 3.2.2-3 Linear Relationship Between Фu - Фy Factor............................................ 38
Figure 3.2.3-1 Column Reinforcement Pattern................................................................. 39
Figure 3.2.3-2 Comparison Between Force-Displacement Curves with Strain Penetration
and Without............................................................................................................... 40
Figures 4.1-1 Time Histories for the Large Return Period Earthquakes: Chile 2475....... 45
Figures 4.1-2 Time Histories for the Large Return Period Earthquakes: Peru 2475........ 45
Figures 4.1-3 Time Histories for the Large Return Period Earthquakes: Kobe 975........ 45
Figures 4.1-4 Time Histories for the Large Return Period Earthquakes: Olympia 975 ... 46
Figures 4.1-5 Time Histories for the Large Return Period Earthquakes: Mexico City 975
................................................................................................................................... 46
x

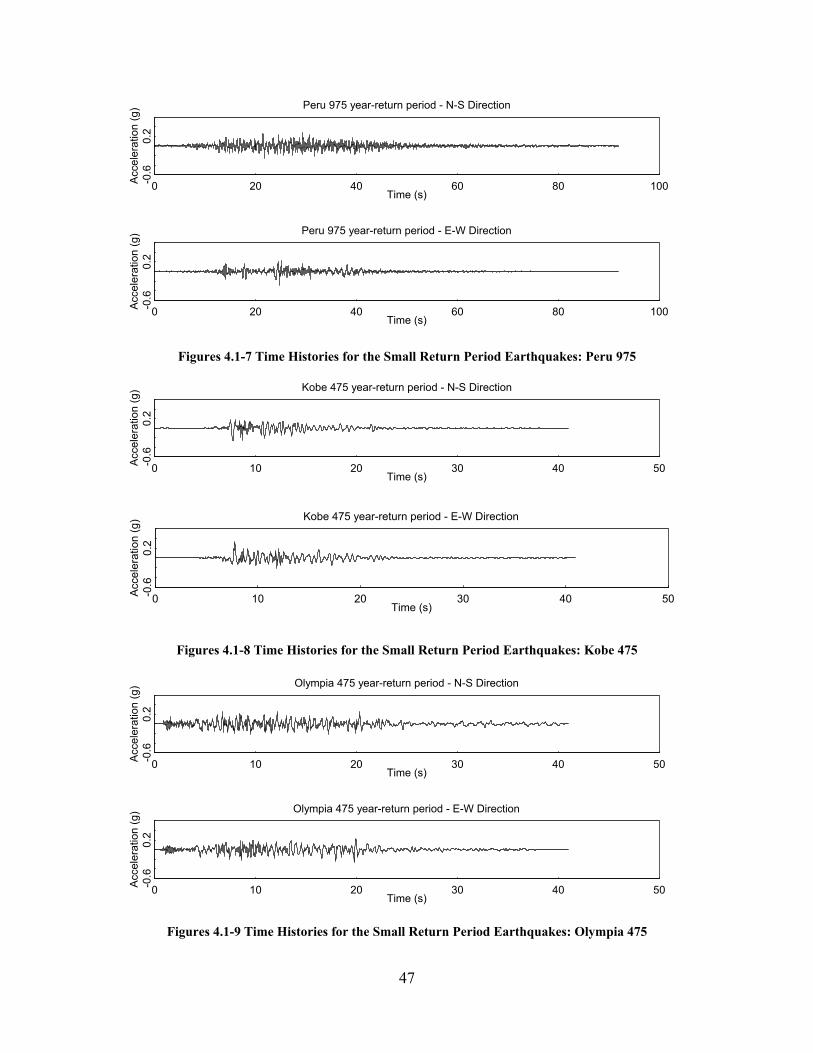
Figures 4.1-6 Time Histories for the Small Return Period Earthquakes: Chile 975......... 46
Figures 4.1-7 Time Histories for the Small Return Period Earthquakes: Peru 975.......... 47
Figures 4.1-8 Time Histories for the Small Return Period Earthquakes: Kobe 475......... 47
Figures 4.1-9 Time Histories for the Small Return Period Earthquakes: Olympia 475 ... 47
Figures 4.1-10 Time Histories for the Small Return Period Earthquakes: Mexico City 475
................................................................................................................................... 48
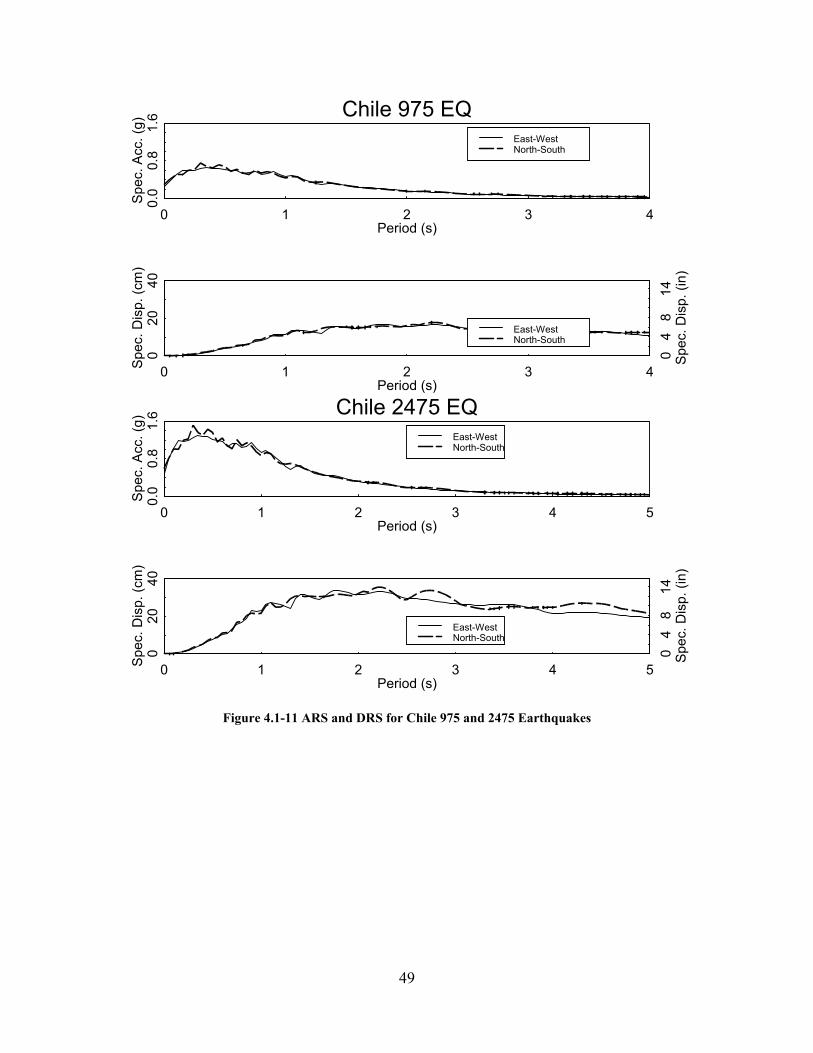
Figure 4.1-11 ARS and DRS for Chile 975 and 2475 Earthquakes.................................. 49
Figure 4.1-12 ARS and DRS for Peru 975 and 2475 Earthquakes................................... 50
Figure 4.1-13 ARS and DRS for Kobe 475 and 975 Earthquakes.................................... 51
Figure 4.1-14 ARS and DRS for Olympia 475 and 975 Earthquakes .............................. 52
Figure 4.1-15 ARS and DRS for Mexico City 475 and 975 Earthquakes ........................ 53
Figure 4.1-16 ARS for the 2001 Nisqually, Peru 2475 and Olympia 975 Earthquakes ... 56
Figure 5.1-1 5/649 Bridge Spine Model with Skew ......................................................... 57
Figure 5.1-2 5/649 Bridge Spine Model without Skew .................................................... 58
Figure 5.1.2-1 South Bent, Center Column: Hysteresis Curves for Bridge 5/649 –
Without Skew; Olympia 975 EQ; Es=47.9 MPa (1000ksf); 861.9 MPa (18000 ksf)
................................................................................................................................... 62
Figure 5.1.2-2 South Bent, Center Column: Hysteresis Curves for Bridge 5/649 - With
Skew; Olympia 975 EQ; Es=287.3 MPa (6000 ksf); 861.9 MPa (18000 ksf) ......... 62
Figure 5.1.2-3 South Bent, Center Column: Hysteresis Curves for Bridge 5/649 -
Without Skew; Peru 2475 EQ; Es=47.9 MPa (1000ksf); 861.9 MPa (18000 ksf) ... 63
Figure 5.1.2-4 South Bent, Center Column: Hysteresis Curves for Bridge 5/649 - With
Skew; Peru 2475 EQ; Es=287.3 MPa (6000 ksf); 861.9 MPa (18000 ksf) .............. 63
xi

Figure 5.1.3-1 Displacement Versus Time for the Olympia 975 and Peru 2475
Earthquakes, 287.3 MPa Spring Models With Skew................................................ 64
Figure 5.1.3-2 Displacement Versus Time for the Olympia 975 and Peru 2475
Earthquakes, 287.3 MPa Spring Models Without Skew........................................... 65
Figure 5.1.3-3 Displacement Versus Time for the Olympia 975 and Peru 2475
Earthquakes, 861.9 MPa Spring Models With Skew................................................ 65
Figure 5.1.3-4 Displacement Versus Time for the Olympia 975 and Peru 2475
Earthquakes, 861.9 MPa Spring Models Without Skew........................................... 66
Figure 6.1-1 Center Bent, Center Column: Hysteresis Curves for Bridge 5/227; Chile 975
and Peru 975 EQ; Fixed Column Bases/Roller Abutment Boundary Conditions .... 73
Figure 6.1-2 Center Bent, Center Column: Hysteresis Curves for Bridge 5/227; Kobe 975
EQ, Mexico City 975 EQ; Olympia 975 EQ; Chile 2475 EQ and Peru 2475 EQ;
Fixed Column Bases/Roller Abutment Boundary Conditions.................................. 74
Figure 6.1-3 Center Bent, Center Column: Hysteresis Curves for Bridge 5/227; Kobe 975
EQ; Es=47.9 MPa (1000ksf); 861.9 MPa (18000 ksf) ............................................. 75
Figure 6.1-4 Center Bent, Center Column: Hysteresis Curves for Bridge 5/227; Mexico
City 975 EQ; Es= 47.9 MPa (1000ksf); 861.9 MPa (18000 ksf).............................. 75
Figure 6.1-5 Center Bent, Center Column: Hysteresis Curves for Bridge 5/227; Olympia
975 EQ; Es=47.9 MPa (1000ksf); 861.9 MPa (18000 ksf) ...................................... 76
Figure 6.1-6 Center Bent, Center Column: Hysteresis Curves for Bridge 5/227; Chile
2475 EQ; Es=47.9 MPa (1000ksf); 861.9 MPa (18000 ksf) .................................... 76
Figure 6.1-7 Center Bent, Center Column: Hysteresis Curves for Bridge 5/227; Peru 2475
EQ; Es=47.9 MPa (1000ksf); 861.9 MPa (18000 ksf) ............................................. 77
xii

Figure 6.1-8 Center Bent, Center Column: Displacement Time History for Bridge 5/227;
Peru 2475 EQ; Es=287.3 MPa.................................................................................. 78
Figure 6.1-9 Center Bent, Center Column: Displacement Time History for Bridge 5/227;
Peru 2475 EQ; Es=861.9 MPa.................................................................................. 79
Figure 6.1-10 Specimen T2 Lateral Load-Displacement Hysteresis Curve ..................... 80
Figure 6.1-11 Spalling of the Concrete (Stapelton, 2004) ................................................ 80
Figure 6.1-12 Vertical Cracks at Tension Face (Stapelton, 2004).................................... 81
Figure 6.2-1 Center Bent, Middle East Column: Hysteresis Curves for Bridge 512/19;
Chile 975 EQ and Peru 975 EQ; Fixed Column Base/Roller Abutment Boundary
Conditions ................................................................................................................. 85
Figure 6.2-2 Center Bent, Middle East Column: Hysteresis Curves for Bridge 512/19;
Chile 975 EQ; Es=47.9 MN/m2 (1000ksf); 861.9 MN/m2 (18000 ksf) .................... 86
Figure 6.2-3 Center Bent, Middle East Column: Hysteresis Curves for Bridge 512/19;
Peru 975 EQ; Es=47.9 MN/m2 (1000ksf); 861.9 MN/m2 (18000 ksf) ..................... 86
Figure 6.2-4 Center Bent, Middle East Column: Hysteresis Curves for Bridge 512/19;
Kobe 975 EQ, Mexico City 975 EQ, Olympia 975 EQ, Chile 2475 EQ and Peru
2475 EQ; Fixed Column Base/Roller Abutment Boundary Conditions.................. 87
Figure 6.2-5 Center Bent, Middle East Column: Hysteresis Curves for Bridge 512/19;
Kobe 975 EQ; Es=287.3 MN/m2 (6000 ksf); 861.9 MN/m2 (18000 ksf) ................ 88
Figure 6.2-6 Center Bent, Middle East Column: Hysteresis Curves for Bridge 512/19;
Mexico City 975 EQ; Es=287.3 MPa (6000 ksf); 861.9 MPa (18000 ksf) .............. 88
Figure 6.2-7 Center Bent, Middle East Column: Hysteresis Curves for Bridge 512/19;
Olympia 975 EQ; Es=287.3 MN/m2 (6000 ksf); 861.89 MN/m2 (18000 ksf).......... 89
xiii

Figure 6.2-8 Center Bent, Middle East Column: Hysteresis Curves for Bridge 512/19;
Chile 2475 EQ; Es=287.3 MN/m2 (6000 ksf); 861.9 MN/m2 (18000 ksf) ............... 89
Figure 6.2-9 Center Bent, Middle East Column: Hysteresis Curves for Bridge 512/19;
Peru 2475 EQ; Es=287.3 MN/m2 (6000 ksf); 861.9 Pa (18000 ksf) ........................ 90
Figure 6.2-10 Center Bent, Middle East Column: Displacement Time History for Bridge
512/19; Peru 2475 EQ; Es=287.3 MPa..................................................................... 91
Figure 6.2-11 Center Bent, Middle East Column: Displacement Time History for Bridge
512/19; Peru 2475 EQ; Es=861.9 MPa..................................................................... 91
Figure 6.3-1 South Bent, Center Column: Hysteresis Curves for Bridge 5/649 E; Chile
975 EQ, Peru 975 EQ; Fixed Column Bases/Roller Abutment Boundary Conditions
................................................................................................................................... 95
Figure 6.3-2 South Bent, Center Column: Hysteresis Curves for Bridge 5/649E; Chile
975 EQ; Es=287.3 MPa (6000 ksf); 861.9 MPa (18000 ksf) ................................... 95
Figure 6.3-3 South Bent, Center Column: Hysteresis Curves for Bridge 5/649E; Peru 975
EQ; Es=287.3 MPa (6000 ksf); 861.9 MPa (18000 ksf) .......................................... 96
Figure 6.3-4 South Bent, Center Column: Hysteresis Curves for Bridge 5/649 E; Kobe
975 EQ, Mexico City 975 EQ, Olympia 975 EQ, Chile 2475 EQ and Peru 2475 EQ;
Fixed Column Base/Roller Abutment Boundary Conditions ................................... 97
Figure 6.3-5 South Bent, Center Column: Hysteresis Curves for Bridge 5/649E; Kobe
975 EQ; Es=287.3 MPa (6000 ksf); 861.9 MPa (18000 ksf) ................................... 98
Figure 6.3-6 South Bent, Center Column: Hysteresis Curves for Bridge 5/649E; Mexico
City 975 EQ; Es=287.3 MPa (6000 ksf); 861.9 MPa (18000 ksf)............................ 98
xiv
Figure 6.3-7 South Bent, Center Column: Hysteresis Curves for Bridge 5/649E; Olympia
975 EQ; Es=287.3 MPa (6000 ksf); 861.9 MPa (18000 ksf) ................................... 99
Figure 6.3-8 South Bent, Center Column: Hysteresis Curves for Bridge 5/649E; Chile
2475 EQ; Es=287.3 MPa (6000 ksf); 861.9 MPa (18000 ksf) ................................. 99
Figure 6.3-9 South Bent, Center Column: Hysteresis Curves for Bridge 5/649E; Peru
2475 EQ; Es=287.3 MPa (6000 ksf); 861.9 MPa (18000 ksf) ............................... 100
Figure 6.3-10 South Bent, Center Column: Displacement Time History for Bridge
5/649E; Peru 2475 EQ; Es=287.3 MPa .................................................................. 101
Figure 6.3-11 South Bent, Center Column: Displacement Time History Bridge 5/649E;
Peru 2475 EQ; Es=861.9 MPa................................................................................ 101
Appendix A-1 Scaling calculations for the center column, center bent of Bridge 5/227.
................................................................................................................................. 112
Appendix A-3 Spring values for all bridges in US units ................................................ 141
xv
LIST OF TABLES
Table 3.1.1-1 Bridge 5/227 Material Properties ............................................................... 20
Table 3.1.2-1 Bridge 5/649 Material Properties ............................................................... 25
Table 3.1.3-1 Bridge 512/19 Material Properties ............................................................. 31
Table 3.2.1-1 Jaradat Specimen and Existing Bridge Properties...................................... 31
Table 3.2.3-1 Calculation Factors for Estimating Soil Spring Stiffness........................... 42
Table 3.2.3-2 Spring Values for Each Bridge................................................................... 43
Table 4.1-1 Bridge Periods, Spectral Accelerations and Spectral Displacement Values . 54
Table 5.1.1-1 Bridge 5/649 Displacement and Shear Force Demands Due to the Olympia
975 Earthquake ......................................................................................................... 59
Table 5.1.1-2 Bridge 5/649 Displacement and Shear Force Demands Due to the Peru
2475 Earthquake ....................................................................................................... 60
Table 6.1-1 Maximum Earthquake Demands for Bridge 5/227 Subject to the Olympia
975 Loading .............................................................................................................. 68
Table 6.1-2 Maximum Bearing Pad Displacements for Bridge 5/227 Subject to the
Olympia 975 Earthquake .......................................................................................... 69
Table 6.1-3 Maximum Earthquake demands for Bridge 5/227 Subject to the Peru 2475
Loading ..................................................................................................................... 70
Table 6.1-4 Maximum Bearing Pad Displacements for Bridge 5/227 Subject to the Peru
2475 Earthquake ....................................................................................................... 71
Table 6.1-5 Pounding in the Deck and Abutments for Bridge 5/227 with the 287.3 MPa
Soil Values ................................................................................................................ 71
xvi

Table 6.1-6 Pounding in the Deck and Abutments for Bridge 5/227 with the 861.9 MPa
Soil Values ................................................................................................................ 72
Table 6.1-7 Pounding in the Deck and Abutments for Bridge 5/227 with Fixed Column
Base Boundary Conditions ....................................................................................... 72
Table 6.2-1 Maximum Earthquake demands for Bridge 512/19 Subject to the Olympia
975 Loading .............................................................................................................. 83
Table 6.2-2 Maximum Earthquake Demands for Bridge 512/19 Subject to the Peru 2475
Loading ..................................................................................................................... 84
Table 6.3-1 Maximum Earthquake demands for Bridge 5/649 Subject to the Olympia 975
Loading ..................................................................................................................... 93
Table 6.3-2 Maximum Earthquake demands for Bridge 5/649 Subject to the Peru 2475
Loading ..................................................................................................................... 94
xvii

CHAPTER ONE
INTRODUCTION
1.1 BACKGROUND
Recent geological studies have shown that the Pacific Northwest region may be
subjected to earthquakes of large-magnitude and long-duration as the result of rupturing
of the locked interface between the Juan de Fuca and the North American Plate. Bridge
design has evolved in the past forty years and existing bridges have been left potentially
vulnerable due to limited funds for seismic upgrade. For example, transverse
reinforcement was typically No. 3 or No. 4 hoops placed at 12 in (30.5 cm) on center in
pre-1975 Washington State bridge columns. Today, the code requires a minimum of No.
3 reinforcement bars spaced at 4 in. (10.2 cm) on center. Also, lap splice length has
greatly increased from values ranging between 25db and 45db for columns built before
1975, to a 60db minimum splice length since 2003.
1.2 OBJECTIVES
The main goals of this research were to assess multi-column bent, concrete
bridges constructed prior to 1975, located in the Seattle/Olympia regions, under long-
duration seismic loading. A suite of earthquakes were used to simulate a range of
possible earthquake excitation. The main objectives included:
o 3-D modeling of three existing multi-column bent, concrete bridges in the
Seattle/Olympia region
1

o Non-linear time history analysis of the bridges under short-duration and long-
duration earthquake loading
o To assess the influence of soil-structure-interaction on the bridge response
o To draw conclusions on the effect of long duration earthquakes on pre-1975
Washington State bridges.
1.3 SEISMIC ACTIVITY IN THE PACIFIC NORTHWEST
Western Washington State lies above the intersection of two tectonic plates, the
North America continental plate and the Juan de Fuca plate, colliding together at a rate of
approximately 2 in. (about 5 cm) per year (from The Pacific Northwest Seismograph
Network). In addition, the Pacific plate forces the Juan de Fuca plate north.
2

Figure 1.3-1 Cascadia Subduction Zone (from The Pacific Northwest Seismograph Network)
The most damaging earthquakes in Western Washington State in recent years
have been the Nisqually Earthquake in 2001 (magnitude 6.8), Sea-Tac in 1965
(magnitude 6.5), and the 1949 Olympia earthquake (magnitude 7.1). They were
respectively 52 km, 63 km and 53 km deep beneath the continent (PNSN, 2005). The
largest earthquake in Western Washington State since 1790, when historical recording
started, occurred in 1872 in the North Cascades with a magnitude of 7.4. Subduction zone
earthquakes tend to be the rarest and strongest. Geological evidence shows that this type
of earthquake occurred in the region about 300 years ago. Subduction zones around the
3

world have produced earthquakes of magnitude 8 and higher. Seismologists predict that
an earthquake of this magnitude could occur again in the Pacific Northwest.
Since seismic recordings of large subduction zone earthquakes in the Pacific
Northwest are not available, earthquakes from other regions of the world were used in
this research and scaled to represent possible seismic activity in the Puget Sound region
(Stapelton, 2004 and PanGEO Inc., 2005). These earthquakes were the Moquegua, Peru
earthquake (2001), the Mexico City, Mexico earthquake (1985), the Kobe, Japan
earthquake (1995), the Olympia, Washington earthquake (1949) and the Lloledo, Chile
earthquake (1985).
4

Figure 1.3-2 Map of the Bridge Locations
Bridges 5/227 and 512/19 are located 24 km (15 miles) south and 45 km (28
miles) east respectively of Olympia and bridge 5/649 is situated 56 km (35 miles) north
of Seattle. Depending on the location of the bridges, the return periods for a given
earthquake vary. The larger Peru and Chile records had a return period of 2475 years or
greater and the smaller Peru and Chile records had a return period of 975 years or greater.
We will refer to these earthquakes as Peru 2475, Chile 2475 for the large earthquakes and
5

Peru 975, Chile 975 for the smaller earthquakes throughout the following study. The
return periods for the other earthquakes, Olympia, Kobe and Mexico City were
determined by PanGeo Inc., a geotechnical subconsultant of WSDOT, and were found to
be 975 years and 475 years. The origin of these records will be explained in greater depth
in chapter four.
6

CHAPTER TWO
LITERATURE REVIEW
There are three parameters that are typically used to characterize earthquakes: the
magnitude of shaking, the frequency content and the significant duration of motion. The
first two have been researched more thoroughly than the last.
2.1 DEFINITION OF EARTHQUAKE DURATION
Several ways to define earthquake duration have been proposed over the last
thirty years. Bolt (1973) defined “bracketed duration” as the time between the first and
last accelerations of a magnitude higher than 0.05g or 0.1g. In this definition, earthquakes
with a peak ground motion (PGA) smaller than 0.05g are considered as having no
duration. Other definitions focus on the shape of the record rather than on numerical
values. Overall, a single definition of earthquake duration has not been accepted. The
most widely accepted is Abrahamson and Silva’s (1996) “Arias Duration of Horizontal
Strong Shaking Attenuation Relation”:
7

SE = standard error = 0.493 for I=0.95
a3 0.262−
a2 0.552
a1 0.532−
lnD0.05_I
D0.05_0.75
a1 a2 ln
I 0.05−
I 1−
⋅+ a3 lnI 0.05−
I 1−
2⋅+
rc 10km
r = closest distance to the effective fault rupture plane in km
c2 0.063
c1 0.805
for soil sitesS 1for rock sites, orS 0
β 3.2
b2 0.851
b1 5.204M = Moment Magnitude
∆σ exp b1 b2 M 6−( )⋅+
D0.05_I = Arias Duration (sec) from 0.05 to I Normalized Arias Itensity (typically, I=0.95)
Where :
Ln D0.05_I( ) Ln
∆σ M( )
101.5M 16.05+
1−
3
4.9 106⋅ β⋅
Sc1+
lnD0.05_I
D0.05_0.75
+
for near-fault rupture
Ln D0.05_I( ) Ln
∆σ M( )
101.5M 16.05+
1−
3
4.9 106⋅ β⋅
Sc1+ c2 r rc−( )⋅+
lnD0.05_I
D0.05_0.75
+
for ruptures away from fault (> 10 km or 6.2 miles)
Duration also depends on soil conditions. R. Dobry, I. M. Idriss and E. NG (1978)
studied the difference in the duration for the 1971 San Fernando horizontal strong ground
motion records for a rock site and a soft-to-medium soil site. The following duration plots
illustrate the differences between the two.
8

Figure 2.1-1 Difference Between Rock Site and Soil Site Acceleration Spectra
A correlation was found between the duration, D, and the magnitude, M, for rock
motions, as illustrated below.
9

Figure 2.1-2 Duration versus Magnitude for Rock Sites in the Western United States.
The equation developed above is valid only for earthquake magnitudes of 4.5 to
7.6. For higher magnitudes, the duration of rupture at the source, d, increases much more
rapidly than the significant duration of the earthquake, D, rendering the logarithmic
correlation false. This study assumed a constant velocity of rupture, the dislocation at the
source was considered to be an approximately continuous process (Bolt, 1970).
The following conclusion was obtained from the study: “Accelerograms at rock
sites have more consistent and reasonably predictable durations, while durations of
records on soil show much larger scatter, with the duration of rock being a lower bound.”
10

2.2 DAMAGE INDICES
Lindt et al. (2004) studied the effect of earthquake duration on the reliability of
structures, especially for the integration of reliability indices in the LRFD code. Lindt
investigated the relationship between earthquake duration and very-low-cycle damage
estimates through a combination of nonlinear structural dynamics and the theory of order
statistics. A suite of ten earthquakes used for this research and were based on the
earthquake spectra of three US cities: Los Angeles, Seattle and Boston. The return
periods used for the earthquakes were 475 years and 2475 years which correspond to a
probability of occurrence of 10% and 2% in 50 years. This research concluded that
earthquake duration has a significant effect on the damage of a structure, as the duration
increases the reliability index decreases as shown on figure 2.3-1 below.
11
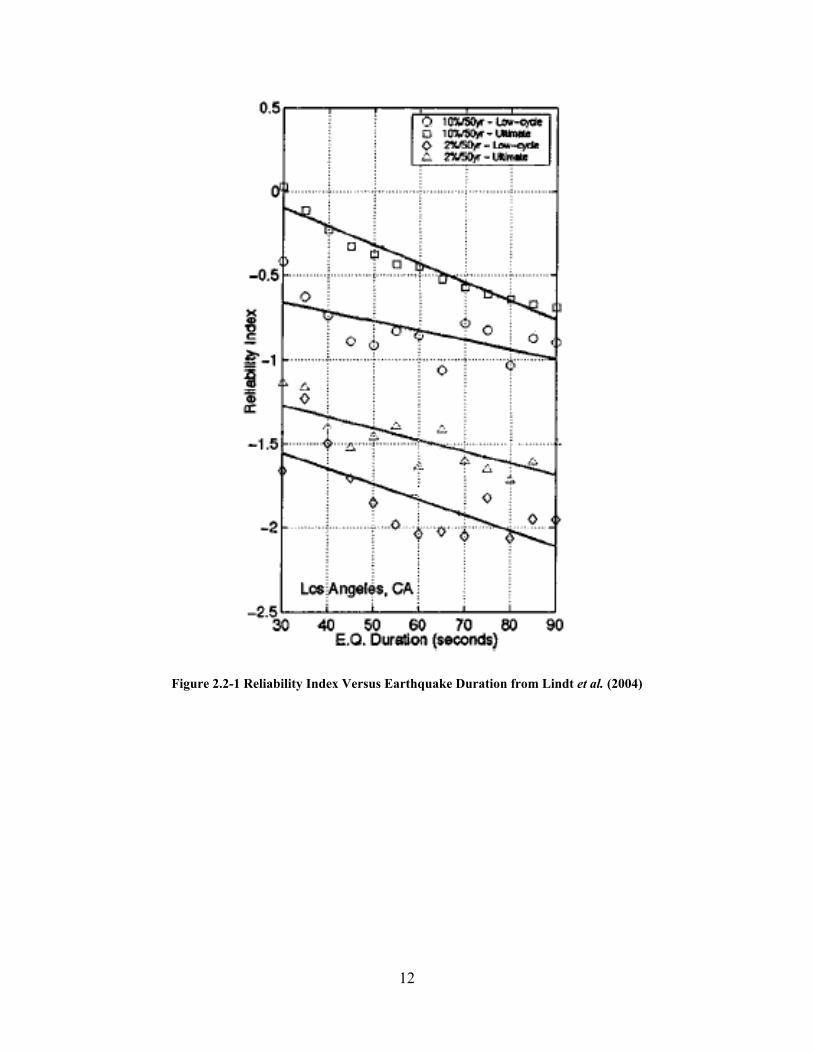
Figure 2.2-1 Reliability Index Versus Earthquake Duration from Lindt et al. (2004)
12

2.3 EFFECT OF EARTHQUAKE DURATION ON THE DAMAGE IN
REINFORCED CONCRETE STRUCTURES
In 1988, Jeong et al. conducted a study on the damage observed in reinforced
concrete and steel simple structures versus earthquake duration. The damage model used
in this research was relatively crude but nevertheless qualitatively correct of the impact of
damage on a structure as duration varies. The total damage for varying ductility levels
was calculated with the following equations: ∑=i
iDD where siii n
CD µ⋅=
1
and ni: number of cycles
µi: ductility level of cycle i
C and s: positive empirical constants whose values were taken as 416 and 6
respectively for a reinforced concrete structure
Failure occurs when D reaches unity. This model was modified to take the
maximum deformation and the absorbed hysteretic energy of the structure into account.
Below is the final equation for the accumulative damage in a linear system for a specific
earthquake duration.
[ ] tddtC
tDE dt sd ∫ ∫
∞⋅
∂∂
⋅−
=0 0
),(1)( µµµνµ
where is the duration of the excitation and dt ),( tµν is the average frequency of
up-crossings of the level µ.
Figure 2.4-1 below shows the plot of the previous equation for different values of
ductility.
13

Figure 2.3-1 Expected Damage versus Normalized Duration for Representative Linear Reinforced Concrete Structure
It is clear from the above figure that total damage increases with duration. The
slope of increase becomes steeper as the ductility level of the structure increases.
In 1975, Housner concluded that a large acceleration and spectral value but small
duration earthquake will cause little structural damage (Housner, 1975). However, more
recent studies have shown opposite trends. Jeong et al. (1988) showed that duration and
ductility greatly affect structural damage and should therefore be taken into account when
designing in seismic regions. Moreover, the study showed that for an increasing number
of cycles for a given earthquake model, structural damage increases. Jeong et al.’s study
was based on analytical excitations and not actual earthquake records.
14

CHAPTER THREE
BRIDGE MODELING
3.1 BRIDGE DESCRIPTIONS
3.1.1 Bridge 5/227
• Geographical Location
Figure 3.1.1-1 Bridge 5/227 Location
• Bridge Properties
The four span bridge has a total length of 53.24 m (184.50 ft). The outer spans are
each 13.64 m (44.75 ft) long, the middle-west span is 15.7 m (51.50 ft) long and the
15

middle-east span is 13.26 m (43.50 ft) long. The bridge elevation and plan views are
shown in figures 3.1.1-2 and 3.1.1-3.
Figure 3.1.1-2 Bridge 5/227 Plan View
Figure 3.1.1-3 Bridge 5/227 Elevation View
The deck is supported by six 50 ft series standard WSDOT I-girders running
longitudinally under each span. The girders are 1.8 m (5 ft, 11 in) on center and are pre-
and post-tensioned (see figure 3.1.1-4). The girders support a 14 cm (5.5 in) thick
reinforced concrete slab.
16

Figure 3.1.1-4 Bridge 5/227 50 ft. Series Girder
At each bent, a 91.44 cm (3 ft) by 1.22 m (4 ft) transverse crossbeam distributes
the bridge loads to the three columns. The outer columns of each bent are of equal
heights and the middle columns are slightly smaller. For the east bent, the outer columns
are 5.68 m (18.64 ft) high and the middle columns are 5.53 m (18.14 ft) high. The middle
bent outer and inner columns are 5.83 m (19.12 ft) and 5.68 m (18.62 ft) high
respectively. The west bent is comprised of 5.92 m (19.42 ft) high outer columns, and a
5.77 m (18.92 ft) high inner column. The columns are 0.91 m (3 ft) in diameter with a
cover of 9.2 cm (35/8 in), reinforced by No. 3 hoops spaced 30.48 cm (12 in) on center.
Longitudinal reinforcement is comprised of eight equally spaced No. 10 bars. The lap
splice length is 20db or 66 cm (2ft, 2in) along the base of each column.
17

Figure 3.1.1-5 Bridge 5/227 Column Detail
The spread footings are supported by concrete piles. The exterior footings are
76.2 cm (2.5 ft) deep, 1.83 m (6 ft) wide (along the transverse direction of the bridge) and
3.66 m (12 ft) long. The interior footings are 91.44 cm (3 ft) deep, 2.74 m (9 ft) wide and
3.66 m (12 ft) long. The reinforcement for the exterior footings is a grillage of ten no. 9
bars spaced at 17.78 cm (7 in) on center along the length of the footing and twelve no. 6
bars spaced at 30.48 cm (12 in) on center along the width of the footing. For the interior
footings, fourteen no. 9 bars spaced at 20.32 cm (8 in) on center longitudinally and
twenty no. 6 bars spaced at 17.78 cm (7 in) on center in the transverse direction make up
18

the reinforcement. The piles form two rows of three along the length of the exterior
footings, and three rows of three longitudinally as well under the interior footings as
shown in figure 3.1.1-6 below.
Figure 3.1.1-6 Bridge 5/227 Intermediate Bent Footings
Rubber expansion joints are situated at each bent and at the abutments. They are
5.08 cm (2 in) wide and run the width of the roadway.
Figure 3.1.1-7 Bridge 5/227 Expansion Joint Detail
The end bents run across the width of the bridge, are 2m (6 ft, 6.5 in) deep and
30.48 cm (1 ft) long for the top half and 91.44 cm (3 ft) long for the bottom half.
19

Transverse and longitudinal reinforcements are placed throughout the cross-section as
displayed in figure 3.1.1-8. Sub-ground columns support the abutments and run about 6.1
m (20 ft) deep below the abutment. The columns are tapered along the depth and are
anchored down by a 3.7 m (12 ft) by 4.6 m (15 ft) by 84 cm (2.75 ft) reinforced concrete
block. Four rows of five concrete piles support the footings as detailed in figure 3.1.1-8.
Figure 3.1.1-8 Bridge 5/227 Abutment Sub-Ground Column and Footing
• Bridge Material Properties
Table 3.1.1-1 Bridge 5/227 Material Properties
Material Properties Steel Yield Strength 44 ksi (303.5 MPa) Steel Ultimate Strength 75 ksi (517.24 MPa) Concrete Strength after 28 days 4 ksi (27.58 MPa)
20

3.1.2. Bridge 5/649
• Geographical Location
Figure 3.1.2-1 Bridge 5/649 Location
Bridge 5/649 is made up of two independent bridges. The east bridge is 4.88 m
(16 ft) longer than the west bridge and therefore will be more prone to damage than the
west bridge in the event of an earthquake, which is why the modeling was limited to the
east bridge.
• Bridge Properties
Bridge 5/649 is made up of two bents with three columns each, supported by
treated timber pile footings. The deck is 74.68 m (245 ft) long divided into three spans:
21

the north ramp which is 23.5 m (77 ft) long, the middle span 29.3 m (96 ft) long and the
south ramp 21.95 m (72 ft) long. The bridge carries a 22.5 m (73.8 ft) wide roadway
(dimension taken along the back of the pavement seat). The bridge has a 45 degree skew
and no curvature.
Figure 3.1.2-2 Bridge 5/649 Plan View
Figure 3.1.2-3 Bridge 5/649 Elevation View
The non-monolithic deck includes a 16.5 cm (6.50 in) thick reinforced concrete
slab resting on a series of pre- and post-tensioned I-girders detailed in figure 3.1.2-4
below. The girder layout varies for each span. The south ramp is supported by six girders
spaced at 4.3 m (14 ft, 7/8 in) on center, the middle span counts seven girders spaced at 3
m (9 ft, 11 in) on center and the north ramp has five girders spaced at 4.2 m (13 ft, 8 in)
on center. The girders are reinforced by no. 4 bars longitudinally and no. 4 stirrups in the
transverse direction.
22

Figure 3.1.2-4 Bridge 5/649 Girder Detail
The girders rest on crossbeams that are 1.22 m (4 ft) by 1 m (3.25 ft) reinforced
concrete rectangular beams than run 22.35 m (73.33 ft) across the width of the bridge.
The bridge has a downward slope creating a difference in the column heights. The
north bent has three columns: the north-east column measuring 5.41 m (17.74 ft) high,
the north-middle column at 5.23 m (17.15 ft) high and the north-west column at 5 m
(16.35 ft) high. The south bent has a similar configuration with slightly taller columns:
the south-east column is 5.9 m (19.23 ft) high, the south-middle is 5.7 m (18.7 ft) high
and the south-west is 5.5 m (17.98 ft) high. Each column is reinforced longitudinally by
eleven evenly spaced no. 9 bars and in the traverse direction by no. 3 hoops spaced at
30.48 cm (12 in) on center. The lap splice length is 1 m (3 ft, 4 in) which represents 35
db.
23

Figure 3.1.2-5 Bridge 5/649 Column Detail
Each column rests on concrete spread footings with treated timber piles. The
footings are 2.9 m (9.5 ft) squares, 1 m (3.25 ft) deep. The timber piles are arranged in a
grid of three rows of three.
Figure 3.1.2-6 Bridge 5/649 Footing Detail
The expansion joints at each bent and at the abutments contribute to a release of
energy in the longitudinal direction during seismic activity. The rubber joints are 3.17 cm
(1.25 in) wide.
The abutments are inverted T-beams about 22.25 m (73 ft) long, 1.98 m (6.5 ft )
wide and 1.98 m (6.5 ft) high. The stems are cut-out to support the girders and provide
24

transverse girder stops in both directions for each girder. Two rows of ten concrete piles
spaced in the transverse direction at 2.36 m (7.75 ft) on center, support each abutment.
(a) (b)
Figure 3.1.2-7 Bridge 5/649 Abutment Footing detail: (a) Cross-section, (b) Elevation
• Bridge Material Properties
Table 3.1.2-1 Bridge 5/649 Material Properties
Material Properties Steel Yield Strength 44 ksi (303.5 MPa) Steel Ultimate Strength 75 ksi (517.24 MPa) Concrete Strength after 28 days 4 ksi (27.58 MPa)
25

3.1.3 Bridge 512/19
• Geographical Location
Figure 3.1.3-1 Bridge 512/19 Intersection
• Bridge Properties
This bridge is the largest of all three bridges. The roadway is 23.5 m (77 ft) wide
and 75.6 m (248 ft) long. The roadway rests on three bents of four columns each
anchored into the ground by concrete spread footings. The deck is monolithic and has a
slight skew of about 3 degrees.
26

E
SN
W
Figure 3.1.3-2 Bridge 512/19 Plan View
Figure 3.1.3-3 Bridge 512/19 Elevation View
The bridge is made up of four spans: the north ramp is 15 m (49 ft) long, the two
middle spans are 23.16 m (76 ft) long and the south ramp is 14.33 m (47 ft) long. The
slab is 16.51 cm (6.5 in) thick and is supported by twelve I-girders spaced evenly at 2.23
m (7 ft, 4 in) apart. The girders are 1.27 m (4 ft, 2 in) tall. The bottom flange is reinforced
by no. 4 bars and the top flange by no. 5 bars. The stirrups are no. 4 bars.
27

Figure 3.1.3-4 Bridge 512/19 Girder Detail
The girders rest on crossbeams at intermediate piers. These crossbeams are 1.1 m
(3.5 ft) square reinforced concrete beams that run 23.47 m (77 ft) across the bridge. The
crossbeams join the columns and form the bents supporting the bridge. The columns all
have the same height of 6.13 m (20.1 ft). The columns are 91.44 cm (3 ft) in diameter and
are reinforced longitudinally by eleven evenly spaced no. 9 bars and by no. 3 hoops
spaced 30.48 cm (12 in) on center. Lap splice length is 35 db, which totals 1 m (3 ft, 4 in).
28

Figure 3.1.3-5 Bridge 512/19 Column Detail
The abutments are reinforced concrete piers supported by sub-ground columns of
different heights. The north abutment is the deepest one at 7 m (23 ft) deep from the top
of the deck, and the south abutment is 4.88 m (16 ft) deep from the top of the deck. They
are L-shaped beams 2.5 m (8 ft, 2 in) high and 30.48 cm (1 ft) wide for the stem and 1.13
m (3 ft, 9 in) for the seat. The abutments are anchored into the ground by spread footings
that are 2.13 m (7 ft) by 3.66 m (12 ft) by 61 cm (2 ft) concrete blocks for the north
abutment and 1.83 m (6 ft) by 3.05 m (10 ft) by 61 cm (2 ft) deep reinforced concrete
blocks for the south abutment.
29

Figure 3.1.3-6 Bridge 512/19 Abutment Cross-section
The abutments were built to provide transverse support to the girders through
girder stops. Four girder stops are positioned on both abutments, two in each direction.
They are 45.72 cm (1.5 ft) by 50.8 cm (1 ft, 8 in) by 22.86 cm (9 in) high concrete blocks
poured once the girders are in place. Figure 3.1.3-7 illustrates the locations of the girder
stops along the abutments as well as a plan view.
(a) (b)
Figure 3.1.3-7 Bridge 512/19 Girder Stop : (a) Plan View and (b) Locations
30

• Bridge Material Properties
Table 3.1.3-1 Bridge 512/19 Material Properties
Material Properties Steel Yield Strength 44 ksi (303.5 MPa) Steel Ultimate Strength 75 ksi (517.24 MPa) Concrete Strength after 28 days 4 ksi (27.58 MPa)
3.2 BRIDGE CALIBRATION
3.2.1 Jaradat Specimens
In order to model the bridge columns, it was necessary to compare the model to
experimental data. A previous WSU graduate student, Jaradat (1996), tested several
columns in the laboratory at 1/3 scale. The one that best fit the existing bridges was
specimen T2. The concrete compressive strength of the bridges is specified in the plans
as 4000 psi. An increase of 1.5 was recommended by WSDOT and Priestley (1991) to
account for the natural gain in strength over the last 40 to 50 years.
Table 3.2.1-1 below is a presentation of the test specimen’s properties compared
to the bridge column properties.
Table 3.2.1-1 Jaradat Specimen and Existing Bridge Properties
Jaradat Specimen T2 Bridge5/649 Bridge 5/227 Bridge 512/19 Material PropertiesSteel Yield Strength 371 MPa (53.8 ksi) 303 MPa (44 ksi) 303 MPa (44 ksi) 303 MPa (44 ksi)Steel Ultimate Strength 578 MPa (83.9 ksi) 517 MPa (75 ksi) 517 MPa (75 ksi) 517 MPa (75 ksi)Concrete Strength after 28 days 29 MPa (4.2 ksi) 41 MPa (6 ksi) 41 MPa (6 ksi) 41 MPa (6 ksi)Geometric properties
Column length 177.8 cm (70 in) 5.2 - 6.1 m (204-240 in)
5.4 - 5.9 m (211-233 in) 6.1 m (241 in)
Column diameter 25.4 cm (10 in) 91.4 cm (36 in) 91.4 cm (36 in) 91.4 cm (36 in)Reinforcement PropertiesLongitudinal reinforcement ratio 0.011 0.0113 0.011 0.0113Transverse reinforcement ratio 0.00194 0.00194 0.00194 0.00194Longitudinal bars 8 #3 11 #9 8 #10 11 #9Hoops 9 gauge (3.2 in o.c.) #3 (12 in sp) #3 (12 in sp) #3 (12 in sp)Lap splice 20 db 35 db 20 db 35 db
31

Specimen T2 was tested under cyclic loading with a peak lateral load of 35.6 kN
(8.0 kips) and an axial load of 84.5 kN (19 kips) to represent the dead loads applied to the
columns. Figure 3.2.1-1 shows the hysteresis curves obtained for specimen T2.
Figure 3.2.1-1 Specimen T2 Lateral Load-Displacement Hysteresis Curve
An envelope representing a force-displacement pushover curve for the specimen
was extracted from this hysteresis. This envelope was used to calibrate each column of
the existing bridges.
32

0
1
2
3
4
5
6
7
8
0 0.05 0.1 0.15 0.2 0.25
Displacement (ft)
Forc
e (k
ips)
0
5
10
15
20
25
30
35
0 1 2 3 4 5 6 7
Displacement (cm)
Forc
e (k
N)
Figure 3.2.1-2 Specimen T2 Force-Displacement Envelope of Specimen T2
3.2.2 Scaling
Jaradat (1996) tested several columns under cyclic loading. These columns were
scaled down to be conducted in a laboratory. Therefore, the results needed to be scaled up
to fit the analytical assessment of the columns in the existing bridge. The material
properties for the test and the bridge are different; therefore, each column of the bridge
was modeled with the same material properties as the test column in order to compare the
force-displacement prediction to the test results. Once the behavior of each column of the
bridge approached the specimen’s, the entire bridge model was run with the existing
material properties of the bridge. In the following equations, subscript “ex” specifies the
test specimen and “mod” the bridge model. Since the length and the diameter of the
columns aren’t scaled linearly, it is necessary to differentiate the two dimensions.
33

• Scaling the Forces and Moments:
The internal forces of the column can be defined as follows:
ex
exex L
MF = with
−=
2.aDfAM exyexsex (For the test data)
mod
modmod L
MF = with
−=
2modmod.modaDfAM ys (For the model data)
Therefore to scale the forces, the moments must be scaled. The first term is the
steel reinforcement area, which can be scaled as follows:
exsex
s AD
DA .
2
modmod. ⋅
=
The steel yield strength (fy) is identical for each column in the scaling process.
The second term is a function of the column diameter and the distance to the neutral axis.
To be as exact as possible in the scaling process, two moment-curvature analyses were
run. Since the steel reinforcement area and yield strength of both the specimen and the
bridge column are known, a plot of
−
2aDex vs.
−
2modaD was drawn.
34

0
0.2
0.4
0.6
0.8
1
1.2
1.4
1.6
1.8
2
0 0.05 0.1 0.15 0.2 0.25 0.3 0.35 0.4 0.45 0.5
Dmoda2
−
Dexa2
−
Figure 3.2.2-1 Relationship Between “D-a/2” Experimental and Model
The graph clearly shows that both quantities vary linearly with a slope of 0.259.
The ratio of column diameters in this case is: 278.03610
mod
==DDex
Therefore, the last term in the moment equation can be scaled as such:
−⋅=−
22mod
modaD
DDaD ex
ex
Using the two previous equations, the moment at the base of the model column
can be expressed as a function of the moment at the base of the specimen.
exex
MD
DM ⋅
=
3
modmod
The same factor can be used to scale the forces, taking the column lengths into
account:
exex
ex
FLL
DD
F ⋅⋅
=
mod
3
modmod
35

Therefore the moment varies with the diameter cubed and the force varies with
the diameter cubed times the ratio of lengths.
• Scaling the Displacements
For the displacements, the following equations were used:
6
2.
.exexy
exy
L⋅=∆
φ with
ex
yexy D
εφ 25.2. =
6
2modmod.
mod.
Lyy
⋅=∆
φ with
modmod. 25.2
Dy
y
εφ =
These equations can be combined to express the model displacements as a function of the
specimen displacements. The curvature will vary with the inverse of the diameter and the
displacement will vary with the length squared.
exyex
exy L
LDD
.2
2mod
modmod. ∆⋅
=∆
However, for a displacement larger than the yield displacement, the equations
differ. There is an additional term, Δ p which can be calculated using the following
equation:
( )
−⋅−⋅+∆⋅
−=∆
21 p
yupyn
up
LLL
MM
φφ
Where, Mu is the ultimate moment, Mn the moment at yield, Φu the ultimate
curvature and Lp the plastic hinge length of the column :
In US units: byp dfLL ⋅⋅+⋅= 15.02
08.0
In metric units: byp dfLL ⋅⋅+⋅= 22.02
08.0
36

The deck is assumed to be infinitely rigid which makes the column react as if it
were fixed at the base and constrained with a roller at the free end, making it behave in
double bending. This is why half the length of the column is used to compute Lp.
∆y has already been factored. For the second term of the equation, the factored
term is the following:
( )
( )
−⋅−⋅
−⋅−⋅
2
2
mod..
.modmodmod.
pexexyuexp
expyup
LLL
LLL
φφ
φφ
Figure 3.2.2-2 Bilinear Relationship Between Moment and Curvature
To correctly determine how to scale Фu - Фy, a moment-curvature analysis was
run, identical to the one used to determine the scaling factors for the moment values.
37

Moment-curvature scaling
0
0.005
0.01
0.015
0.02
0.025
0.03
0 0.01 0.02 0.03 0.04 0.05 0.06 0.07 0.08 0.09 0.1
φu φy−( )ex
φu φy−( )mod
Figure 3.2.2-3 Linear Relationship Between Фu - Фy Factor
The plot illustrates the linear relationship between both plastic curvatures. The
slope in this case is of 3.593, which is comparable to a scaling factor of: 6.31036mod ==
exDD
Therefore, to correctly scale up the displacements these are the equations used:
For use y∆≤∆ exex
ex
LL
DD
∆⋅
⋅=∆ 2
2mod
modmod
For use y∆≥∆ ( )exyexp
exexp
expexp
exex
ex
LLDL
LLDL
LL
DD
.mod.
mod.
.modmod.
2
2mod
modmod
2
2∆−∆⋅
−⋅⋅
−⋅⋅
+∆⋅
⋅=∆
The last component to factor is the axial load. The axial load varies with the
cross-section of the column, therefore with the diameter squared:
exex
PD
DP ⋅
=
2
modmod
38

See Appendix A-1 for an example of the scaling up of the center column of the
center bent of Bridge 5/227 fitted column to Jaradat T2 specimen scaled up.
3.2.3 Modeling
In order to determine the properties of the columns, a moment/curvature analysis
was run to determine the values at actual yield, idealized yield and at failure.
With the values obtained the effective moment of inertia of the column can be
determined: yc
neff E
MI
Φ= where Mn is the moment at idealized yield and φy is the
curvature at idealized yield.
However, this inertia value doesn’t represent the inertia of the actual bridge
columns. Longitudinal reinforcement of the column penetrates into the footing and in the
deck as detailed in figure 3.2.3-3 below.
Figure 3.2.3-1 Column Reinforcement Pattern
39

The effect of the reinforcement penetration can be added to the clear height of the
column: spLLL ⋅+= 2'
Where L is the clear height, the strain penetration term is defined by , bysp dfL ⋅⋅= 15.0
fy is the reinforcing steel yield strength and db, the diameter of the longitudinal bars.
Running a pushover analysis with these two different lengths shows how the
strain penetration affects the yield force and the inertia of the column:
Bridge 5/227- Center column - Center bent
0
20
40
60
80
100
120
0.00 0.20 0.40 0.60 0.80 1.00 1.20 1.40
Disp (ft)
Forc
e (k
ip)
0
100
200
300
400
500
0 5 10 15 20 25 30 35 40 45
Disp (cm)
Forc
e (k
N)
Without strain penetration With strain penetration
Figure 3.2.3-2 Comparison Between Force-Displacement Curves with Strain Penetration and Without
The stiffness of the column, k, can be found using the following equation:
312LIEk c ⋅⋅= .
40

To match the test data, the model column and the scaled test column must have
approximately the same stiffness. Therefore, the final moment of inertia of the column
can be calculated as follows: c
test ELkI⋅
⋅=12
'3
See Appendix A-2 for a plot of a fitted column to Jaradat T2 specimen scaled up
and the input files for each bridge.
• Calculating the Spring Values
The existing soil properties of each bridge are unknown. However, a previous
WSU graduate student, Cody Cox (2005), has done an extensive study of the possible soil
conditions in the Olympia region. The spring stiffness values for bridges 227, 512 and
649 were determined after comparison with Cody’s bridges.
The soil properties for Bridge 5/227 have already been calculated by Cody using
several different programs.
Bridge 5/649 presented similarities with bridge 826. They both had timber pile
footings and the abutments were approximately the same height, however, the overall
width of the bridges differed. Soil properties depend mainly on soil pressure surrounding
the footing. Soil pressure varies in a non-linear manner with the depth of the footing but
is assumed to be constant throughout the width of the footing. Therefore the assumption
that the soil stiffness values at the abutments varied linearly with the width of the
abutment was made.
Bridge 512/19 presented similarities with bridge 518. Both bridges were built on
spread footings, however the abutment height and overall width of the bridges varied. As
for Bridge 5/649, the spring values at the abutments were scaled linearly with the width
41

of the bridge. Regarding the abutment height, it is known that the deeper the footing, the
stiffer the spring model should be. However, this relationship is not linear, nor does it
follow any type of mathematical equation. Looking through Cody’s work on abutment
stiffness, the relationship was dependant on several factors: the dimensions of the spread
footings, the material properties of the bridge as well as two factors alpha and beta
different for each spring direction. These two factors varied with the ratio length by width
of the footings.
Table 3.2.3-1 Calculation Factors for Estimating Soil Spring Stiffness
L/B alpha beta alpha beta alpha beta alpha beta alpha beta alpha beta0.194 1.025 1.420 1.025 1.420 1.035 1.125 1.050 1.700 1.050 1.150 1.050 1.1501.263 1.030 1.480 1.030 1.480 1.035 1.100 1.050 1.700 1.050 1.750 1.050 1.7501.412 1.040 1.500 1.025 1.500 1.040 1.100 1.060 1.700 1.060 1.750 1.060 2.1001.600 1.050 1.520 1.060 1.520 1.060 1.110 1.060 1.740 1.060 1.760 1.060 2.2001.667 1.055 1.480 1.060 1.480 1.060 1.100 1.060 1.700 1.060 1.750 1.060 1.9000.600 1.025 1.450 1.025 1.450 1.035 1.100 1.050 1.700 1.050 1.380 1.050 1.380
Translation Rocking Rocking RotationX Direction Y Direction Z Direction about X Dir. about Y Dir. about Z Dir.Translation Translation
With these values were calculated the spring stiffness at each abutment in all six
directions. Since the spring values were calculated with approximate soil properties, a
range of soil elastic modulus were used to model each bridge. These values are presented
below in metric units (for US units see Appendix A-3) .
42

Table 3.2.3-2 Spring Values for Each Bridge
Bridge 512/19 Es (MN/m2) K11 (Trans) MN/m
K22 (Long.) MN/m
K33 ( Vert.) MN/m
K44 (Trans.) MN/m/rad
K55 (Long.) MN/m/rad
K66 (Vert.) MN/m/rad
47.88 2.0427E+03 2.0427E+03 2.1346E+03 5.9570E+04 1.6292E+05 1.2418E+05287.28 1.2256E+04 1.2256E+04 1.2807E+04 3.5742E+05 9.7754E+05 7.4510E+05861.84 3.6768E+04 3.6768E+04 3.8422E+04 1.0723E+06 2.9326E+06 2.2353E+0647.88 2.3082E+02 2.3082E+02 2.3851E+02 1.0903E+04 6.6909E+03 1.1950E+04287.28 1.3849E+03 1.3849E+03 1.4311E+03 6.5417E+04 4.0145E+04 7.1701E+04861.84 4.1547E+03 4.1547E+03 4.2932E+03 1.9625E+05 1.2044E+05 2.1510E+0547.88 2.3845E+02 2.3845E+02 2.5094E+02 1.1739E+04 8.5124E+03 1.1385E+04287.28 1.4307E+03 1.4307E+03 1.5056E+03 7.0437E+04 5.1074E+04 6.8312E+04861.84 4.2920E+03 4.2920E+03 4.5169E+03 2.1131E+05 1.5322E+05 2.0494E+0547.88 2.2182E+02 2.2182E+02 2.3043E+02 1.0159E+04 5.0775E+03 1.0759E+04287.28 1.3309E+03 1.3309E+03 1.3826E+03 6.0957E+04 3.0465E+04 6.4554E+04861.84 3.9927E+03 3.9927E+03 4.1477E+03 1.8287E+05 9.1395E+04 1.9366E+0547.88 8.2237E+02 8.2237E+02 8.5937E+02 2.3983E+04 6.5593E+04 4.9996E+04287.28 4.9342E+03 4.9342E+03 5.1562E+03 1.4390E+05 3.9356E+05 2.9998E+05861.84 1.4803E+04 1.4803E+04 1.5469E+04 4.3169E+05 1.1807E+06 8.9993E+05
Bridge 5/227 Es (MN/m2)0.24 1.1485E+03 1.2372E+03 4.6675E+03 2.0087E+05 2.0096E+05 4.5472E+02
47.88 2.0784E+03 2.1598E+03 5.6232E+03 2.5356E+05 2.7206E+05 9.0945E+04287.28 6.7512E+03 6.7961E+03 1.0426E+04 5.1836E+05 6.2934E+05 5.4567E+05861.84 1.7966E+04 1.7923E+04 2.1952E+04 1.1539E+06 1.4868E+06 1.6370E+06
0.24 2.8936E+02 2.8936E+02 1.3613E+03 7.7936E+03 7.7740E+03 6.4175E+0147.88 5.3621E+02 5.3621E+02 1.6247E+03 1.9522E+04 1.5598E+04 1.2835E+04287.28 1.7766E+03 1.7766E+03 2.9486E+03 7.8461E+04 5.4912E+04 7.7010E+04861.84 4.7536E+03 4.7536E+03 6.1259E+03 2.1991E+05 1.4927E+05 2.3103E+05
0.24 2.8936E+02 2.8936E+02 1.3613E+03 7.7936E+03 7.7740E+03 6.4175E+0147.88 5.3621E+02 5.3621E+02 1.6247E+03 1.9522E+04 1.5598E+04 1.2835E+04287.28 1.7766E+03 1.7766E+03 2.9486E+03 7.8461E+04 5.4912E+04 7.7010E+04861.84 4.7536E+03 4.7536E+03 6.1259E+03 2.1991E+05 1.4927E+05 2.3103E+05
0.24 2.8936E+02 2.8936E+02 1.3613E+03 7.7936E+03 7.7740E+03 6.4175E+0147.88 5.3621E+02 5.3621E+02 1.6247E+03 1.9522E+04 1.5598E+04 1.2835E+04287.28 1.7766E+03 1.7766E+03 2.9486E+03 7.8461E+04 5.4912E+04 7.7010E+04861.84 4.7536E+03 4.7536E+03 6.1259E+03 2.1991E+05 1.4927E+05 2.3103E+05
0.24 1.1485E+03 1.2373E+03 4.6677E+03 2.0087E+05 2.0096E+05 4.5472E+0247.88 2.0784E+03 2.1598E+03 5.6232E+03 2.5356E+05 2.7206E+05 9.0945E+04287.28 6.7512E+03 6.7961E+03 1.0426E+04 5.1836E+05 6.2934E+05 5.4567E+05861.84 1.7966E+04 1.7923E+04 2.1952E+04 1.1539E+06 1.4868E+06 1.6370E+06
Bridge 5/649 Es (MN/m2)47.88 1.0839E+03 1.1804E+03 2.6482E+03 8.9691E+03 1.4740E+05 1.1481E+05287.28 2.7672E+03 2.8637E+03 4.6792E+03 5.1353E+04 8.8195E+05 6.8887E+05861.84 6.8071E+03 6.9036E+03 9.5536E+03 1.5308E+05 2.6449E+06 2.0666E+0647.88 4.9103E+02 4.9103E+02 9.2741E+02 1.7840E+04 1.7840E+04 2.4969E+04287.28 1.9461E+03 1.9461E+03 2.4257E+03 1.0666E+05 1.0666E+05 1.4981E+05861.84 5.4383E+03 5.4383E+03 6.0216E+03 3.1984E+05 3.1984E+05 4.4944E+0547.88 3.0897E+02 3.0897E+02 9.2741E+02 1.7808E+04 1.7808E+04 2.4969E+04287.28 1.7641E+03 1.7641E+03 2.4257E+03 1.0663E+05 1.0663E+05 1.4981E+05861.84 5.2563E+03 5.2563E+03 6.0216E+03 3.1980E+05 3.1980E+05 4.4944E+0547.88 1.2430E+03 1.3395E+03 2.8724E+03 9.0303E+03 1.4746E+05 1.1481E+05287.28 2.9263E+03 3.0228E+03 4.9034E+03 5.1415E+04 8.8201E+05 6.8887E+05861.84 6.9662E+03 7.0627E+03 9.7778E+03 1.5314E+05 2.6449E+06 2.0666E+06
Translational Springs Rotational Springs
North Abut
Translational Springs Rotational Springs
West Abut
North Pier
Center Pier
South Pier
South Abut
North Abut
Rotational Springs
South Abut
South Pier
North Pier
Translational Springs
West Pier
Center Pier
East Pier
East Abut
43
CHAPTER FOUR
SEISMIC ANALYSIS
4.1 SEISMIC EXCITATIONS
Ten seismic excitations were used to assess the bridges: four short-duration and
six long-duration motions. The short-duration motions were the Olympia and Kobe
excitations, with the Kobe excitation being also a near-fault motion. The long-duration
motions were the Mexico, Peru and Chile excitations. Figures 4.1-1 to 4.1-10 show the
time histories for the longitudinal and transverse directions of these earthquakes. The
Peru and Chile earthquake time histories were generated by modifying the ground
motions from South American, inter-plate, subduction zone earthquakes to fit a target
acceleration spectrum for the Seattle area. The spectrum was derived from the Atkinson
and Boore (2003) relationship which includes several terms including soil classification
and a near-source saturation term.
The other six earthquakes (Olympia, Mexico and Kobe, both 475 and 975-year
return periods), were provided by WSDOT. These three time histories were modified by
PanGeo Inc., a geotechnical subconsultant of WSDOT for The Aurora Avenue bridge
retrofit project in Seattle. Probalistic and deterministic approaches were used to develop
the ground motion. They relied on several design requirement criteria (The current
WSDOT (500-yr return period), CalTrans (1000 year), UBC (1000 year) and the 2000
IBC (2500 year)) for the probalistic approach.
44

Time (s)0 20 40 60 80 100-0
.60.
2
Chile 2475 year-return period - N-S Direction
Acc
eler
atio
n (g
)
Time (s)0 20 40 60 80 100-0
.60.
2
Chile 2475 year-return period - E-W Direction
Acc
eler
atio
n (g
)
Figures 4.1-1 Time Histories for the Large Return Period Earthquakes: Chile 2475
Time (s)0 20 40 60 80 100-0
.60.
2
Peru 2475 year-return period - N-S Direction
Acc
eler
atio
n (g
)
Time (s)0 20 40 60 80 100-0
.60.
2
Peru 2475 year-return period - E-W Direction
Acc
eler
atio
n (g
)
Figures 4.1-2 Time Histories for the Large Return Period Earthquakes: Peru 2475
Time (s)0 10 20 30 40 50-0
.60.
2
Kobe 975 year-return period - N-S Direction
Acc
eler
atio
n (g
)
Time (s)0 10 20 30 40 50-0
.60.
2
Kobe 975 year-return period - E-W Direction
Acc
eler
atio
n (g
)
Figures 4.1-3 Time Histories for the Large Return Period Earthquakes: Kobe 975
45

Time (s)0 10 20 30 40 50-0
.60.
2
Olympia 975 year-return period - N-S Direction
Acc
eler
atio
n (g
)
Time (s)0 10 20 30 40 50-0
.60.
2
Olympia 975 year-return period - E-W Direction
Acc
eler
atio
n (g
)
Figures 4.1-4 Time Histories for the Large Return Period Earthquakes: Olympia 975
Time (s)0 20 40 60 80 100-0
.60.
2
Mexico City 975 year-return period - N-S Direction
Acc
eler
atio
n (g
)
Time (s)0 20 40 60 80 100-0
.60.
2
Mexico City 975 year-return period - E-W Direction
Acc
eler
atio
n (g
)
Figures 4.1-5 Time Histories for the Large Return Period Earthquakes: Mexico City 975
Time (s)0 20 40 60 80 100-0
.60.
2
Chile 975 year-return period - N-S Direction
Acc
eler
atio
n (g
)
Time (s)0 20 40 60 80 100-0
.60.
2
Chile 975 year-return period - E-W Direction
Acc
eler
atio
n (g
)
Figures 4.1-6 Time Histories for the Small Return Period Earthquakes: Chile 975
46
Time (s)0 20 40 60 80 100-0
.60.
2
Peru 975 year-return period - N-S Direction
Acc
eler
atio
n (g
)
Time (s)0 20 40 60 80 100-0
.60.
2
Peru 975 year-return period - E-W Direction
Acc
eler
atio
n (g
)
Figures 4.1-7 Time Histories for the Small Return Period Earthquakes: Peru 975
Time (s)0 10 20 30 40 50-0
.60.
2
Kobe 475 year-return period - N-S Direction
Acc
eler
atio
n (g
)
Time (s)0 10 20 30 40 50-0
.60.
2
Kobe 475 year-return period - E-W Direction
Acc
eler
atio
n (g
)
Figures 4.1-8 Time Histories for the Small Return Period Earthquakes: Kobe 475
Time (s)0 10 20 30 40 50-0
.60.
2
Olympia 475 year-return period - N-S Direction
Acc
eler
atio
n (g
)
Time (s)0 10 20 30 40 50-0
.60.
2
Olympia 475 year-return period - E-W Direction
Acc
eler
atio
n (g
)
Figures 4.1-9 Time Histories for the Small Return Period Earthquakes: Olympia 475
47

Time (s)0 20 40 60 80 100-0
.60.
2
Mexico City 475 year-return period - N-S Direction
Acc
eler
atio
n (g
)
Time (s)0 20 40 60 80 100-0
.60.
2
Mexico City 475 year-return period - E-W Direction
Acc
eler
atio
n (g
)
Figures 4.1-10 Time Histories for the Small Return Period Earthquakes: Mexico City 475
A typical way of characterizing a bridge’s response under seismic loading is to
use acceleration and displacement spectra, which in this case were created using the
software SPECTRA (Carr, 2004). The vertical excitation being a linear scaled version of
the highest between the transverse and the longitudinal directions, it would be redundant
to display it. Figures 4.1-11 to 4.1-16 show the acceleration and displacement spectra for
each earthquake.
48
0 1 2 3 4
0.0
0.8
1.6 Chile 975 EQ
Spe
c. A
cc. (
g)
Period (s)
East-WestNorth-South
0 1 2 3 4
020
40
East-WestNorth-South
04
814
Spe
c. D
isp.
(cm
)
Period (s)
Spe
c. D
isp.
(in)
0 1 2 3 4 5
0.0
0.8
1.6 Chile 2475 EQ
Spe
c. A
cc. (
g)
Period (s)
East-WestNorth-South
0 1 2 3 4 5
020
40
East-WestNorth-South
04
814
Spe
c. D
isp.
(cm
)
Period (s)S
pec.
Dis
p. (i
n)
Figure 4.1-11 ARS and DRS for Chile 975 and 2475 Earthquakes
49

0 1 2 3 4
0.0
0.8
1.6 Peru 975 EQ
Spe
c. A
cc. (
g)
Period (s)
East-WestNorth-South
0 1 2 3 4
020
40
East-WestNorth-South
04
814
Spe
c. D
isp.
(cm
)
Period (s)
Spe
c. D
isp.
(in)
0 1 2 3 4 5
0.0
0.8
1.6 Peru 2475 EQ
Spe
c. A
cc. (
g)
Period (s)
East-WestNorth-South
0 1 2 3 4 5
020
40
East-WestNorth-South
04
814
Spe
c. D
isp.
(cm
)
Period (s)
Spe
c. D
isp.
(in)
Figure 4.1-12 ARS and DRS for Peru 975 and 2475 Earthquakes
50

0 1 2 3 4
0.0
0.8
1.6
East-WestNorth-South
Kobe 475 EQS
pec.
Acc
. (g)
Period (s)
0 1 2 3 4
010
2030
East-WestNorth-South
04
8
Spe
c. D
isp.
(cm
)
Period (s)
Spe
c. D
isp.
(in)
0 1 2 3 4 5
0.0
0.8
1.6
East-WestNorth-South
Kobe 975 EQ
Spe
c. A
cc. (
g)
Period (s)
0 1 2 3 4 5
010
2030
East-WestNorth-South
04
8
Spe
c. D
isp.
(cm
)
Period (s)S
pec.
Dis
p. (i
n)
Figure 4.1-13 ARS and DRS for Kobe 475 and 975 Earthquakes
51

0 1 2 3 4
0.0
0.8
1.6
East-WestNorth-South
Olympia 475 EQS
pec.
Acc
. (g)
Period (s)
0 1 2 3 4
010
2030
East-WestNorth-South
04
8
Spe
c. D
isp.
(cm
)
Period (s)
Spe
c. D
isp.
(in)
0 1 2 3 4 5
0.0
0.8
1.6
East-WestNorth-South
Olympia 975 EQ
Spe
c. A
cc. (
g)
Period (s)
0 1 2 3 4 5
010
2030
East-WestNorth-South
04
8
Spe
c. D
isp.
(cm
)
Period (s)S
pec.
Dis
p. (i
n)
Figure 4.1-14 ARS and DRS for Olympia 475 and 975 Earthquakes
52

0 1 2 3 4
0.0
0.8
1.6
East-WestNorth-South
Mexico City 475 EQS
pec.
Acc
. (g)
Period (s)
0 1 2 3 4
010
2030
East-WestNorth-South
04
8
Spe
c. D
isp.
(cm
)
Period (s)
Spe
c. D
isp.
(in)
0 1 2 3 4 5
0.0
0.8
1.6
East-WestNorth-South
Mexico City 975 EQ
Spe
c. A
cc. (
g)
Period (s)
0 1 2 3 4 5
010
2030
East-WestNorth-South
04
8
Spe
c. D
isp.
(cm
)
Period (s)S
pec.
Dis
p. (i
n)
Figure 4.1-15 ARS and DRS for Mexico City 475 and 975 Earthquakes
It is interesting to note that the displacement spectra for the Olympia, Kobe and
Mexico earthquake have a displacement that increases with the period. However, the
Chile and Peru earthquakes reach a peak displacement at around 1.5 to 2.5 second periods
and then displacement is reduced as the period increases.
53
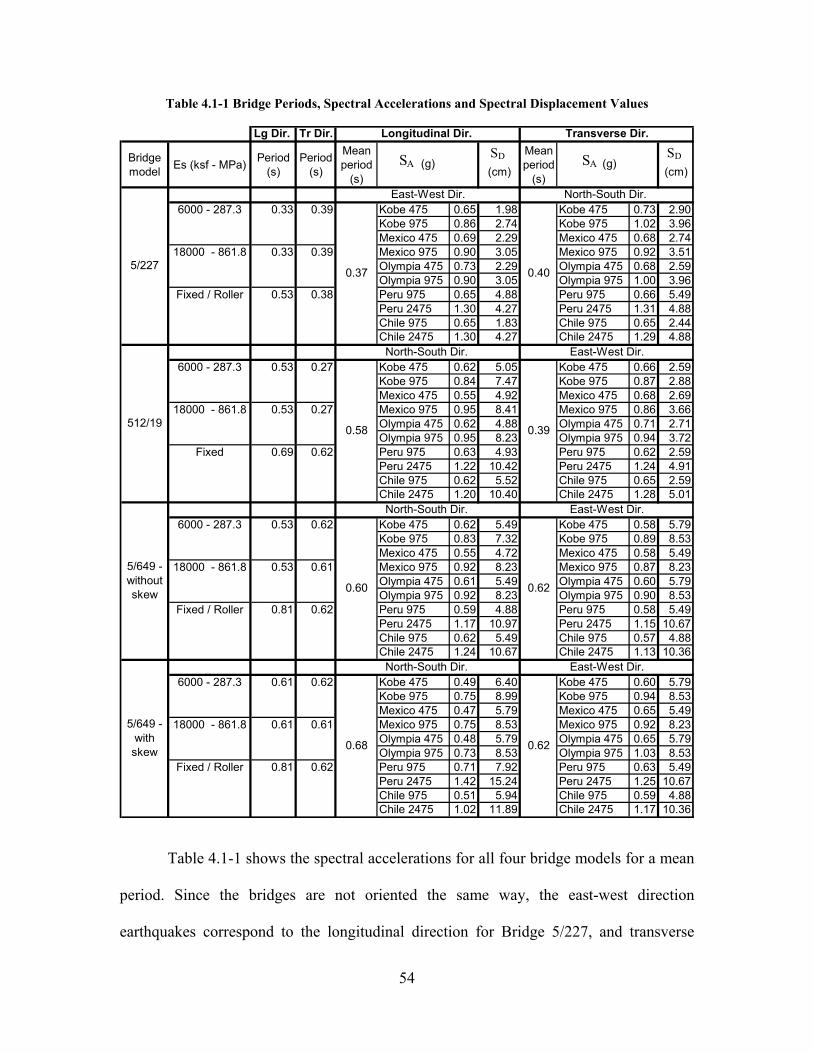
Table 4.1-1 Bridge Periods, Spectral Accelerations and Spectral Displacement Values
Lg Dir. Tr Dir.
Bridge model Es (ksf - MPa) Period
(s)Period
(s)
Mean period
(s)
(cm)
Mean period
(s)
(cm)
6000 - 287.3 0.33 0.39 Kobe 475 0.65 1.98 Kobe 475 0.73 2.90Kobe 975 0.86 2.74 Kobe 975 1.02 3.96Mexico 475 0.69 2.29 Mexico 475 0.68 2.74
18000 - 861.8 0.33 0.39 Mexico 975 0.90 3.05 Mexico 975 0.92 3.51Olympia 475 0.73 2.29 Olympia 475 0.68 2.59Olympia 975 0.90 3.05 Olympia 975 1.00 3.96
Fixed / Roller 0.53 0.38 Peru 975 0.65 4.88 Peru 975 0.66 5.49Peru 2475 1.30 4.27 Peru 2475 1.31 4.88Chile 975 0.65 1.83 Chile 975 0.65 2.44Chile 2475 1.30 4.27 Chile 2475 1.29 4.88
6000 - 287.3 0.53 0.27 Kobe 475 0.62 5.05 Kobe 475 0.66 2.59Kobe 975 0.84 7.47 Kobe 975 0.87 2.88Mexico 475 0.55 4.92 Mexico 475 0.68 2.69
18000 - 861.8 0.53 0.27 Mexico 975 0.95 8.41 Mexico 975 0.86 3.66Olympia 475 0.62 4.88 Olympia 475 0.71 2.71Olympia 975 0.95 8.23 Olympia 975 0.94 3.72
Fixed 0.69 0.62 Peru 975 0.63 4.93 Peru 975 0.62 2.59Peru 2475 1.22 10.42 Peru 2475 1.24 4.91Chile 975 0.62 5.52 Chile 975 0.65 2.59Chile 2475 1.20 10.40 Chile 2475 1.28 5.01
6000 - 287.3 0.53 0.62 Kobe 475 0.62 5.49 Kobe 475 0.58 5.79Kobe 975 0.83 7.32 Kobe 975 0.89 8.53Mexico 475 0.55 4.72 Mexico 475 0.58 5.49
18000 - 861.8 0.53 0.61 Mexico 975 0.92 8.23 Mexico 975 0.87 8.23Olympia 475 0.61 5.49 Olympia 475 0.60 5.79Olympia 975 0.92 8.23 Olympia 975 0.90 8.53
Fixed / Roller 0.81 0.62 Peru 975 0.59 4.88 Peru 975 0.58 5.49Peru 2475 1.17 10.97 Peru 2475 1.15 10.67Chile 975 0.62 5.49 Chile 975 0.57 4.88Chile 2475 1.24 10.67 Chile 2475 1.13 10.36
6000 - 287.3 0.61 0.62 Kobe 475 0.49 6.40 Kobe 475 0.60 5.79Kobe 975 0.75 8.99 Kobe 975 0.94 8.53Mexico 475 0.47 5.79 Mexico 475 0.65 5.49
18000 - 861.8 0.61 0.61 Mexico 975 0.75 8.53 Mexico 975 0.92 8.23Olympia 475 0.48 5.79 Olympia 475 0.65 5.79Olympia 975 0.73 8.53 Olympia 975 1.03 8.53
Fixed / Roller 0.81 0.62 Peru 975 0.71 7.92 Peru 975 0.63 5.49Peru 2475 1.42 15.24 Peru 2475 1.25 10.67Chile 975 0.51 5.94 Chile 975 0.59 4.88Chile 2475 1.02 11.89 Chile 2475 1.17 10.36
0.39
Longitudinal Dir. Transverse Dir.
(g)
0.37
0.58
North-South Dir. East-West Dir.
North-South Dir. East-West Dir.
(g)
0.40
0.620.68
0.60 0.62
North-South Dir. East-West Dir.
North-South Dir. East-West Dir.
5/649 - with skew
5/649 - without skew
512/19
5/227
SA SA SDSD
Table 4.1-1 shows the spectral accelerations for all four bridge models for a mean
period. Since the bridges are not oriented the same way, the east-west direction
earthquakes correspond to the longitudinal direction for Bridge 5/227, and transverse
54

direction for Bridges 512/19 and 5/649. Similarly, the north-south direction earthquakes
correspond to the transverse direction for Bridge 5/227 and longitudinal direction for
Bridges 512/19 and 5/649. It can be seen that the Peru 2475 earthquake will pose the
largest demand for all bridge models.
The Nisqually earthquake of 2001 had a moment magnitude of 6.8. Figure 4.1-16
shows the acceleration response spectra (ARS) for the Nisqually earthquake at two
different locations as well as the acceleration spectra for the Peru 2475 and the Olympia
975 earthquakes. The Olympia DNR building was the location where the highest peak
ground acceleration was recorded (374.4 cm/s2). The SeaTac fire station is a better
location for an estimate of the ground motions that loaded the three bridges modeled in
this study. Based on the target acceleration spectra for the Seattle area, the Nisqually
earthquake at the SeaTac fire station has a return period that can be estimated at
approximately 475 years depending on the location and based on a structure with a period
of 0.5 seconds. The ground motion recorded at the Olympia DNR building has a return
period of approximately 975 years (based on the USGS target acceleration spectra for the
Seattle and Olympia regions, 2003).
55

0.00
0.20
0.40
0.60
0.80
1.00
1.20
1.40
1.60
0.00 1.00 2.00 3.00 4.00 5.00 6.00 7.00 8.00
Period (s)
Acc
eler
atio
n (g
)
Nisqually SEA-TAC (g) Nisqually Olympia (g) Peru 2475 Olympia 975
Figure 4.1-16 ARS for the 2001 Nisqually, Peru 2475 and Olympia 975 Earthquakes
56

CHAPTER FIVE
BRIDGE 5/649 SKEW COMPARISON
5.1 BRIDGE 5/649 SKEW OR STRAIGHT MODEL
Modeling a structure requires that simplifications be made in describing the
elements. Cox (2005) compared the response of a spine bridge model and a grillage
bridge model. He concluded that although the global bridge response varied between the
two models, the changes were not significant when the deck was modeled as a spine
versus a grillage. A similar study was conducted in this research to determine if the skew
of a bridge deck significantly influenced the overall response of the bridge. Bridge 5/649
was modeled in two different ways as illustrated below. The existing bridge was built
with a 45º skew. Dimensions were taken parallel to the skew so that the length of the
bents in both models was identical.
Figure 5.1-1 5/649 Bridge Spine Model with Skew
57

Figure 5.1-2 5/649 Bridge Spine Model without Skew
5.1.1 Maximum Demands
To evaluate the difference in behaviors of the models, several parameters were
studied: the maximum total shear in the columns (V), the maximum relative displacement
at the top of the columns (∆), the maximum moments at the top and at the bottom of he
columns (M) and the maximum curvature at the top of the columns (F). Both models
were run under two earthquakes, Olympia 975 and Peru 2475, for this comparison. Two
different boundary conditions were used in the models: the spring values for an elastic
modulus of 287.3 MPa (6000 ksf) and 861.9 MPa (18000 ksf). Tables 5.1.1-1 and -2
present the results obtained.
58

Table 5.1.1-1 Bridge 5/649 Displacement and Shear Force Demands Due to the Olympia 975 Earthquake
Bent 649 - O - 283.7 649 - O - 861.9 649 - O - fixed
North - East 8.24 8.92 8.02North - Center 7.38 7.49 8.02North - West 7.33 7.35 8.02South - East 8.28 8.55 10.05South - Center 8.27 8.27 10.05South - West 8.26 8.17 10.06
North - East 271 272 331North - Center 200 205 245North - West 323 455 404South - East 282 298 333South - Center 170 225 263South - West 315 316 402
Bent 649 - O - 283.7 649 - O - 861.9 649 - O - fixed
North - East 7.88 7.79 8.67North - Center 7.46 7.45 8.10North - West 7.08 7.15 7.56South - East 8.08 8.73 11.06South - Center 8.09 8.73 10.59South - West 8.09 8.74 10.15
North - East 282 282 353North - Center 203 200 257North - West 309 318 374South - East 287 294 359South - Center 183 188 267South - West 311 327 403
With skew
Without skew
Max ∆ (cm)
Max V (kN)
Max ∆ (cm)
Max V (kN)
The maximum variation in displacement demands between the skewed and the
straight model occurred for the fixed model, at the east column of the south bent (9%).
59

The shear demands varied by 43% for the 861.9 MPa elastic soil modulus value model,
between the skewed and the straight model at the west column of the north bent.
Table 5.1.1-2 Bridge 5/649 Displacement and Shear Force Demands Due to the Peru 2475
Earthquake
Bent 649 - P - 283.7 649 - P - 861.9 649 - P - fixed
North - East 17.70 18.48 20.17North - Center 17.54 17.37 20.08North - West 17.41 16.61 19.99South - East 16.46 17.14 22.32South - Center 17.32 16.58 22.25South - West 18.22 17.11 22.20
North - East 522 537 715North - Center 455 552 755North - West 584 634 836South - East 389 421 584South - Center 377 420 613South - West 509 487 759
Bent 649 - P - 283.7 649 - P - 861.9 649 - P - fixed
North - East 17.11 18.13 23.13North - Center 17.00 18.13 19.78North - West 16.89 18.13 16.63South - East 17.19 18.16 22.40South - Center 17.00 17.61 21.39South - West 17.10 17.27 20.39
North - East 474 519 747North - Center 453 568 699North - West 568 640 773South - East 428 458 622South - Center 433 420 564South - West 532 464 657
With skew
Without skew
Max V (kN)
Max ∆ (cm)
Max ∆ (cm)
Max V (kN)
60

The variation in demands was larger for the Peru 2475 earthquake. There was an
increase of 20%, approximately 3.3 cm (1.3 in), in displacement demands for the west
column of the north bent, between the skew and straight models. There was a 15%
increase, approximately 102 kN (23 kips), in the shear force demands between the
skewed and straight fixed column base/roller abutment models at the south bent, west
column.
5.1.2 Hysteresis Curves
Another way to compare the effect of the skew on the response of the bridge is to
study the force versus displacement hysteresis curves for both models. Below are
displayed the hysteresis curves for the bridge with two different soil types and two
earthquakes. The column with the highest demand is displayed, the center column of the
south bent.
61

Trans Disp (cm)Tran
s C
ol B
ase
She
ar (k
N)
-20 -10 0 10 20-800
-200
400
Es - 287.3 MPaSouth Bent, Middle Column
-6 -4 -2 0 2 4 6
-100
010
0
Trans Disp (in)
Tran
s C
ol B
ase
She
ar (k
ip)
Long Disp (cm)
Long
Col
Bas
e S
hear
(kN
)
-20 -10 0 10 20-800
-200
400
-6 -4 -2 0 2 4 6
-100
010
0
Long Disp (in)
Long
Col
Bas
e S
hear
(kip
)
Trans Disp (cm)Tran
s C
ol B
ase
She
ar (k
N)
-20 -10 0 10 20-800
-200
400
Es - 861.9 MPaSouth Bent, Middle Column
-6 -4 -2 0 2 4 6
-100
010
0
Trans Disp (in)
Tran
s C
ol B
ase
She
ar (k
ip)
Long Disp (cm)
Long
Col
Bas
e S
hear
(kN
)
-20 -10 0 10 20-800
-200
400
-6 -4 -2 0 2 4 6
-100
010
0
Long Disp (in)
Long
Col
Bas
e S
hear
(kip
)
Figure 5.1.2-1 South Bent, Center Column: Hysteresis Curves for Bridge 5/649 – Without Skew; Olympia 975 EQ; Es=47.9 MPa (1000ksf); 861.9 MPa (18000 ksf)
Trans Disp (cm)Tran
s C
ol B
ase
She
ar (k
N)
-20 -10 0 10 20-800
-200
400
Es - 287.3 MPaSouth Bent, Middle Column
-6 -4 -2 0 2 4 6
-100
010
0
Trans Disp (in)
Tran
s C
ol B
ase
She
ar (k
ip)
Long Disp (cm)
Long
Col
Bas
e S
hear
(kN
)
-20 -10 0 10 20-800
-200
400
-6 -4 -2 0 2 4 6
-100
010
0
Long Disp (in)
Long
Col
Bas
e S
hear
(kip
)
Trans Disp (cm)Tran
s C
ol B
ase
She
ar (k
N)
-20 -10 0 10 20-800
-200
400
Es - 861.9 MPaSouth Bent, Middle Column
-6 -4 -2 0 2 4 6
-100
010
0
Trans Disp (in)
Tran
s C
ol B
ase
She
ar (k
ip)
Long Disp (cm)
Long
Col
Bas
e S
hear
(kN
)
-20 -10 0 10 20-800
-200
400
-6 -4 -2 0 2 4 6
-100
010
0
Long Disp (in)
Long
Col
Bas
e S
hear
(kip
)
Figure 5.1.2-2 South Bent, Center Column: Hysteresis Curves for Bridge 5/649 - With Skew; Olympia 975 EQ; Es=287.3 MPa (6000 ksf); 861.9 MPa (18000 ksf)
62

Trans Disp (cm)Tran
s C
ol B
ase
She
ar (k
N)
-20 -10 0 10 20-800
-200
400
Es - 287.3 MPaSouth Bent, Middle Column
-6 -4 -2 0 2 4 6
-100
010
0
Trans Disp (in)
Tran
s C
ol B
ase
She
ar (k
ip)
Long Disp (cm)
Long
Col
Bas
e S
hear
(kN
)
-20 -10 0 10 20-800
-200
400
-6 -4 -2 0 2 4 6
-100
010
0
Long Disp (in)
Long
Col
Bas
e S
hear
(kip
)
Trans Disp (cm)Tran
s C
ol B
ase
She
ar (k
N)
-20 -10 0 10 20-800
-200
400
Es - 861.9 MPaSouth Bent, Middle Column
-6 -4 -2 0 2 4 6
-100
010
0
Trans Disp (in)
Tran
s C
ol B
ase
She
ar (k
ip)
Long Disp (cm)
Long
Col
Bas
e S
hear
(kN
)-20 -10 0 10 20-8
00-2
0040
0
-6 -4 -2 0 2 4 6
-100
010
0
Long Disp (in)
Long
Col
Bas
e S
hear
(kip
)
Figure 5.1.2-3 South Bent, Center Column: Hysteresis Curves for Bridge 5/649 - Without Skew; Peru 2475 EQ; Es=47.9 MPa (1000ksf); 861.9 MPa (18000 ksf)
Trans Disp (cm)Tran
s C
ol B
ase
She
ar (k
N)
-20 -10 0 10 20-800
-200
400
Es - 287.3 MPaSouth Bent, Middle Column
-6 -4 -2 0 2 4 6
-100
010
0
Trans Disp (in)
Tran
s C
ol B
ase
She
ar (k
ip)
Long Disp (cm)
Long
Col
Bas
e S
hear
(kN
)
-20 -10 0 10 20-800
-200
400
-6 -4 -2 0 2 4 6
-100
010
0
Long Disp (in)
Long
Col
Bas
e S
hear
(kip
)
Trans Disp (cm)Tran
s C
ol B
ase
She
ar (k
N)
-20 -10 0 10 20-800
-200
400
Es - 861.9 MPaSouth Bent, Middle Column
-6 -4 -2 0 2 4 6
-100
010
0
Trans Disp (in)
Tran
s C
ol B
ase
She
ar (k
ip)
Long Disp (cm)
Long
Col
Bas
e S
hear
(kN
)
-20 -10 0 10 20-800
-200
400
-6 -4 -2 0 2 4 6
-100
010
0
Long Disp (in)
Long
Col
Bas
e S
hear
(kip
)
Figure 5.1.2-4 South Bent, Center Column: Hysteresis Curves for Bridge 5/649 - With Skew; Peru 2475 EQ; Es=287.3 MPa (6000 ksf); 861.9 MPa (18000 ksf)
63

The general shape of the hysteresis curves is the same for both models.
5.1.3 Time History Comparison
Another way to compare the response of a bridge under earthquake loading is to
investigate the relative displacement between the column tops and column bottoms
versus time. Below are plotted the relative displacement versus time for the Olympia 975
and Peru 2475 earthquakes, for the middle column of the south bent, for the two soil
spring elastic modulus values of 287.3 MPa and 861.9 MPa.
Time (s)
Tran
s D
isp(
cm)
0 10 20 30 40 50
-10
-50
510
Es - 287.3 MPa - 6000 ksf - OlympiaSouth Bent, Middle Column
-2-1
01
2Tr
ans
Dis
p (in
)
Time (s)
Long
Dis
p (c
m)
0 10 20 30 40 50
-10
-50
510
-2-1
01
2Lo
ng D
isp
(in)
Time (s)
Tran
s D
isp(
cm)
0 20 40 60 80 100
-10
-50
510
Es - 287.3 MPa - 6000 ksf - PeruSouth Bent, Middle Column
-2-1
01
2Tr
ans
Dis
p (in
)
Time (s)
Long
Dis
p (c
m)
0 20 40 60 80 100
-10
-50
510
-2-1
01
2Lo
ng D
isp
(in)
Figure 5.1.3-1 Displacement Versus Time for the Olympia 975 and Peru 2475 Earthquakes, 287.3 MPa Spring Models With Skew
64

Time (s)
Tran
s D
isp(
cm)
0 10 20 30 40 50
-10
-50
510
Es - 287.3 MPa - 6000 ksf - OlympiaSouth Bent, Middle Column
-2-1
01
2Tr
ans
Dis
p (in
)
Time (s)
Long
Dis
p (c
m)
0 10 20 30 40 50
-10
-50
510
-2-1
01
2Lo
ng D
isp
(in)
Time (s)
Tran
s D
isp(
cm)
0 20 40 60 80 100
-10
-50
510
Es - 287.3 MPa - 6000 ksf - PeruSouth Bent, Middle Column
-2-1
01
2Tr
ans
Dis
p (in
)Time (s)
Long
Dis
p (c
m)
0 20 40 60 80 100
-10
-50
510
-2-1
01
2Lo
ng D
isp
(in)
Figure 5.1.3-2 Displacement Versus Time for the Olympia 975 and Peru 2475 Earthquakes, 287.3 MPa Spring Models Without Skew
Time (s)
Tran
s D
isp(
cm)
0 10 20 30 40 50
-10
-50
510
Es - 861.3 MPa - 18000 ksf - OlympiaSouth Bent, Middle Column
-2-1
01
2Tr
ans
Dis
p (in
)
Time (s)
Long
Dis
p (c
m)
0 10 20 30 40 50
-10
-50
510
-2-1
01
2Lo
ng D
isp
(in)
Time (s)
Tran
s D
isp(
cm)
0 20 40 60 80 100
-10
-50
510
Es - 861.3 MPa - 18000 ksf - PeruSouth Bent, Middle Column
-2-1
01
2Tr
ans
Dis
p (in
)
Time (s)
Long
Dis
p (c
m)
0 20 40 60 80 100
-10
-50
510
-2-1
01
2Lo
ng D
isp
(in)
Figure 5.1.3-3 Displacement Versus Time for the Olympia 975 and Peru 2475 Earthquakes, 861.9 MPa Spring Models With Skew
65

Time (s)
Tran
s D
isp(
cm)
0 10 20 30 40 50
-10
-50
510
Es - 861.3 MPa - 18000 ksf - OlympiaSouth Bent, Middle Column
-2-1
01
2Tr
ans
Dis
p (in
)
Time (s)
Long
Dis
p (c
m)
0 10 20 30 40 50
-10
-50
510
-2-1
01
2Lo
ng D
isp
(in)
Time (s)
Tran
s D
isp(
cm)
0 20 40 60 80 100
-10
-50
510
Es - 861.3 MPa - 18000 ksf - PeruSouth Bent, Middle Column
-2-1
01
2Tr
ans
Dis
p (in
)Time (s)
Long
Dis
p (c
m)
0 20 40 60 80 100
-10
-50
510
-2-1
01
2Lo
ng D
isp
(in)
Figure 5.1.3-4 Displacement Versus Time for the Olympia 975 and Peru 2475 Earthquakes, 861.9 MPa Spring Models Without Skew
The plots of transverse and longitudinal displacement versus time show that the
differences between the skew model and the non-skew model of Bridge 5/649 are not
significant. However, the maximum displacement and shear demands are significant,
approximately 20% and 40% variation respectively. For Bridge 5/649, the skew affected
the bridge response enough that modeling the skew is necessary to assess successfully the
seismic response of the bridge. In addition, further investigations are needed to draw a
general conclusion as to how important an existing bridge skew is to the overall behavior
of the bridge.
66

CHAPTER SIX
BRIDGE RESPONSE
The main goal of this research was to assess the response of multicolumn bent
prestressed concrete bridges subject to long-duration earthquake excitations. Ten
earthquake records were used to evaluate the bridge response (see Chapter four). To
avoid numerous pages of data, selected results will be displayed. However, conclusions
will be drawn based on all the analyses. The maximum demands obtained and the force-
displacement hysteresis curves are presented below. The following notations are used in
the tables and figures in this chapter: ∆ (cm) represents the relative displacement between
the top and bottom of the column, V (kN) is the shear in the column, M top (kN-m) is the
moment at the top of the column, M bot (kN-m) is the moment at the bottom of the
column, and Φ top (1/m) is the curvature at the top of the column. When comparing
analyses, the percentile indicates the variation between the considered model and the
model with the lowest soil spring stiffnesses.
6.1 BRIDGE 5/227
Bridge 5/227 has three bents with three columns per bent, a non-monolithic deck and
spread footings resting on concrete piles. In an effort to assess the bridge’s seismic
vulnerability, the maximum demands obtained during the analysis of Bridge 5/227 under
the Olympia 975 earthquake and the Peru 2475 earthquake are presented in tables 6.1-1
67

and 6.1-3 for soil springs based on a soil modulus of elasticity of 287.3 MPa (6000 ksf),
861.9 MPa (18000 ksf) and fixed-column/roller-abutment boundary condition.
Table 6.1-1 Maximum Earthquake Demands for Bridge 5/227 Subject to the Olympia 975 Loading
Bent 227 - O - 283.7 227 - O - 861.9 227 - O - fixed
West - South 3.07 6.23 11.01West - Center 2.70 5.99 10.88West - North 2.38 5.79 10.80Center - South 5.37 7.59 7.79Center - Center 4.24 7.59 5.41Center - North 3.92 7.59 7.73East - South 1.72 5.06 3.00East - Center 2.10 5.06 3.00East - North 2.10 5.06 3.00
West - South 378 307 652West - Center 388 251 686West - North 378 307 669Center - South 391 321 628Center - Center 412 274 685Center - North 391 321 538East - South 308 280 456East - Center 334 291 496East - North 308 280 456
Max ∆ (cm)
Max V (kN)
The bridge displacements increased as the soil spring stiffness increased. There
was a 144% (approximately 3.41 cm, 1.34 in) increase in the displacement demands
between the two spring models at the west bent. Similarly, a 355% increase in
displacement in the east bent occurred between the 287.3 MPa model and the fixed
condition model, which corresponds to an increase of approximately 6.5 cm (2.6 in).
There was approximately a 20% variation in the shear demands between both spring
models and a 60% variation between the 861.9 MPa spring model and the fixed column
base model.
68

The bearing pad displacements can be found in Table 6.1-2 below. Each gap
between consecutive deck slabs at the intermediate bents is filled by a rubber bearing pad
that was modeled as two springs with identical stiffnesses. Table 6.1-2 summarizes the
relative displacements between the deck and the middle of the bearing pad for the
intermediate bents and the relative displacement between the deck and the abutment.
These results show a significant increase in the bearing pad displacement between the
west bent and the west abutment (+215%) for the fixed model.
Table 6.1-2 Maximum Bearing Pad Displacements for Bridge 5/227 Subject to the Olympia 975 Earthquake
West AbutWest bent west padWest bent east padCenter bent west padCenter bent east padEast bent west padEast bent east padEast Abut
Bearing Pad disp (cm)
2.38 2.91 5.661.28 1.15 1.791.94 1.36 1.17
1.26 1.71
1.21 1.57 1.621.02 1.11 1.46
1.93 2.33 5.47
227 - O - 283.7 227 - O - 861.9 227 - O - fixed
2.16 1.76 1.400.77
Failure in the bearing pads was defined by a bearing pad displacement greater
than 3.66 cm (1.44 in.) (Cox, 2005). Bridge 5/227 bearing pads failed at the abutments
under the Olympia 975 earthquake for the fixed column base boundary conditions.
69

Table 6.1-3 Maximum Earthquake demands for Bridge 5/227 Subject to the Peru 2475 Loading
Bent 227 - P - 283.7 227 - P - 861.9 227 - P - fixed
West - South 9.58 7.53 16.07West - Center 9.58 7.53 13.95West - North 9.58 7.53 13.88Center - South 11.87 13.66 13.57Center - Center 11.96 13.66 13.61Center - North 12.06 13.66 14.72East - South 8.13 4.43 12.85East - Center 8.13 4.41 12.68East - North 8.13 4.48 12.50
West - South 364 355 431West - Center 425 347 452West - North 364 355 425Center - South 403 380 436Center - Center 422 414 476Center - North 403 380 432East - South 429 341 425East - Center 422 481 440East - North 429 369 431
Max V (kN)
Max ∆ (cm)
The Peru 2475 earthquake is a larger magnitude and longer duration earthquake
than Olympia 975. The displacements obtained during the analysis, were highest in the
center bent. The displacements in the center bent increased by 45% (+ 3.5 cm, 1.4 in)
between the two spring models and by 55% (+ 4.4 cm, 1.7 in) between the lowest spring
value and the fixed column base model. The base shear demands varied by approximately
15% between the two spring models, and 8% between the lowest spring model and fixed
column base model.
70
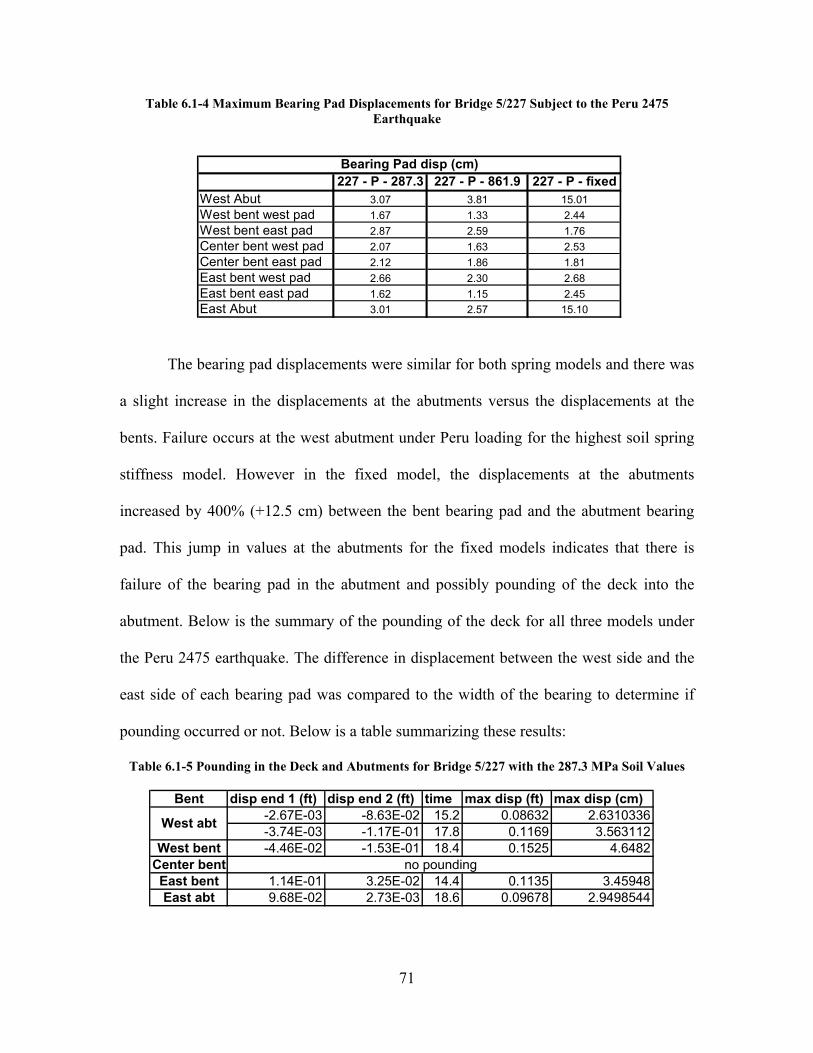
Table 6.1-4 Maximum Bearing Pad Displacements for Bridge 5/227 Subject to the Peru 2475 Earthquake
West AbutWest bent west padWest bent east padCenter bent west padCenter bent east padEast bent west padEast bent east padEast Abut 3.01 2.57 15.10
227 - P - 287.3 227 - P - 861.9 227 - P - fixed
2.66 2.30 2.681.62 1.15 2.45
2.07 1.63 2.532.12 1.86 1.81
1.67 1.33 2.442.87 2.59 1.76
Bearing Pad disp (cm)
3.07 3.81 15.01
The bearing pad displacements were similar for both spring models and there was
a slight increase in the displacements at the abutments versus the displacements at the
bents. Failure occurs at the west abutment under Peru loading for the highest soil spring
stiffness model. However in the fixed model, the displacements at the abutments
increased by 400% (+12.5 cm) between the bent bearing pad and the abutment bearing
pad. This jump in values at the abutments for the fixed models indicates that there is
failure of the bearing pad in the abutment and possibly pounding of the deck into the
abutment. Below is the summary of the pounding of the deck for all three models under
the Peru 2475 earthquake. The difference in displacement between the west side and the
east side of each bearing pad was compared to the width of the bearing to determine if
pounding occurred or not. Below is a table summarizing these results:
Table 6.1-5 Pounding in the Deck and Abutments for Bridge 5/227 with the 287.3 MPa Soil Values
Bent disp end 1 (ft) disp end 2 (ft) time max disp (ft) max disp (cm)-2.67E-03 -8.63E-02 15.2 0.08632 2.6310336-3.74E-03 -1.17E-01 17.8 0.1169 3.563112
West bent -4.46E-02 -1.53E-01 18.4 0.1525 4.6482Center bentEast bent 1.14E-01 3.25E-02 14.4 0.1135 3.45948East abt 9.68E-02 2.73E-03 18.6 0.09678 2.9498544
West abt
no pounding
71

Table 6.1-6 Pounding in the Deck and Abutments for Bridge 5/227 with the 861.9 MPa Soil Values
Bent disp end 1 (ft) disp end 2 (ft) time max disp (ft) max disp (cm)-3.11E-04 -8.29E-02 15.2 0.08291 2.5270968-3.66E-04 -9.43E-02 17.8 0.09429 2.8739592
West bentCenter bentEast bent 1.22E-01 3.46E-02 14.4 0.1224 3.730752East abt no pounding
West abt
no poundingno pounding
Table 6.1-7 Pounding in the Deck and Abutments for Bridge 5/227 with Fixed Column Base Boundary Conditions
Bent times disp end 1 (ft) disp end 2 (ft) time max disp (ft) max disp (cm)
West abt 12 times 0.00E+00 -4.32E-01 24.6 0.4324 13.179552West bent
Center bentEast bentEast abt 43 times 3.76E-01 0.00E+00 25 3.76E-01 11.472672
no poundingno pounding
no pounding
For the spring models, pounding occurred only once or twice and at the outer
bents and abutments. The maximum displacements reached by those two models were
4.65 cm (1.8 in) for the lowest spring value at the west bent, and 3.73 cm (1.5 in) at the
east bent for the 861.9 MPa soil elastic modulus value. However, the fixed boundary
condition model did result in numerous poundings in both abutments, the maximum
displacements being 13.2 cm (5.2 in) for the west abutment and 11.5 cm (4.5 in) at the
east abutment.
Figures 6.1-1 to 6.1-7 represent the force-displacement hysteresis curves for the
column with the largest demands, the center column of the center bent, under different
earthquake loadings. The dotted line located in the corners of the graphs represents the
column shear capacity envelope. The capacity envelopes were calculated using equations
developed by Kowalsky and Priestley (2000).
72

Transverse Displacement (cm)Tran
s C
ol B
ase
She
ar (k
N)
-20 -10 0 10 20-600
040
0
Chile 975 EQ - Fixed/rollerCenter Bent, Center Column
-6 -4 -2 0 2 4 6
-100
050
Transverse Displacement (in)
Tran
s C
ol B
ase
She
ar (k
ip)
Longitudinal Displacement (cm)
Long
Col
Bas
e S
hear
(kN
)
-20 -10 0 10 20-600
040
0
-6 -4 -2 0 2 4 6
-100
050
Longitudinal Displacement (in)
Long
Col
Bas
e S
hear
(kip
)
Transverse Displacement (cm)Tran
s C
ol B
ase
She
ar (k
N)
-20 -10 0 10 20-600
040
0
Peru 975 EQ - Fixed/rollerCenter Bent, Center Column
-6 -4 -2 0 2 4 6
-100
050
Transverse Displacement (in)
Tran
s C
ol B
ase
She
ar (k
ip)
Longitudinal Displacement (cm)
Long
Col
Bas
e S
hear
(kN
)-20 -10 0 10 20-6
000
400
-6 -4 -2 0 2 4 6
-100
050
Longitudinal Displacement (in)
Long
Col
Bas
e S
hear
(kip
)
Figure 6.1-1 Center Bent, Center Column: Hysteresis Curves for Bridge 5/227; Chile 975 and Peru 975 EQ; Fixed Column Bases/Roller Abutment Boundary Conditions
73

Transverse Displacement (cm)Tran
s C
ol B
ase
She
ar (k
N)
-20 -10 0 10 20-600
040
0
Kobe 975 EQ - Fixed/rollerCenter Bent, Center Column
-6 -4 -2 0 2 4 6
-100
050
Transverse Displacement (in)
Tran
s C
ol B
ase
She
ar (k
ip)
Longitudinal Displacement (cm)
Long
Col
Bas
e S
hear
(kN
)
-20 -10 0 10 20-600
040
0
-6 -4 -2 0 2 4 6
-100
050
Longitudinal Displacement (in)
Long
Col
Bas
e S
hear
(kip
)
Transverse Displacement (cm)Tran
s C
ol B
ase
She
ar (k
N)
-20 -10 0 10 20-600
040
0
Mexico City 975 EQ - Fixed/rollerCenter Bent, Center Column
-6 -4 -2 0 2 4 6
-100
050
Transverse Displacement (in)
Tran
s C
ol B
ase
She
ar (k
ip)
Longitudinal Displacement (cm)
Long
Col
Bas
e S
hear
(kN
)
-20 -10 0 10 20-600
040
0
-6 -4 -2 0 2 4 6
-100
050
Longitudinal Displacement (in)
Long
Col
Bas
e S
hear
(kip
)
Transverse Displacement (cm)Tran
s C
ol B
ase
She
ar (k
N)
-20 -10 0 10 20-600
040
0
Olympia 975 EQ - Fixed/rollerCenter Bent, Center Column
-6 -4 -2 0 2 4 6
-100
050
Transverse Displacement (in)
Tran
s C
ol B
ase
She
ar (k
ip)
Longitudinal Displacement (cm)
Long
Col
Bas
e S
hear
(kN
)
-20 -10 0 10 20-600
040
0
-6 -4 -2 0 2 4 6
-100
050
Longitudinal Displacement (in)
Long
Col
Bas
e S
hear
(kip
)
Transverse Displacement (cm)Tran
s C
ol B
ase
She
ar (k
N)
-20 -10 0 10 20-600
040
0
Chile 2475 EQ - Fixed/rollerCenter Bent, Center Column
-6 -4 -2 0 2 4 6
-100
050
Transverse Displacement (in)
Tran
s C
ol B
ase
She
ar (k
ip)
Longitudinal Displacement (cm)
Long
Col
Bas
e S
hear
(kN
)
-20 -10 0 10 20-600
040
0
-6 -4 -2 0 2 4 6-1
000
50
Longitudinal Displacement (in)
Long
Col
Bas
e S
hear
(kip
)
Transverse Displacement (cm)Tran
s C
ol B
ase
She
ar (k
N)
-20 -10 0 10 20-600
040
0
Peru 2475 EQ - Fixed/rollerCenter Bent, Center Column
-6 -4 -2 0 2 4 6
-100
050
Transverse Displacement (in)
Tran
s C
ol B
ase
She
ar (k
ip)
Longitudinal Displacement (cm)
Long
Col
Bas
e S
hear
(kN
)
-20 -10 0 10 20-600
040
0
-6 -4 -2 0 2 4 6
-100
050
Longitudinal Displacement (in)
Long
Col
Bas
e S
hear
(kip
)
Figure 6.1-2 Center Bent, Center Column: Hysteresis Curves for Bridge 5/227; Kobe 975 EQ, Mexico City 975 EQ; Olympia 975 EQ; Chile 2475 EQ and Peru 2475 EQ; Fixed Column Bases/Roller
Abutment Boundary Conditions
74

Trans Disp (cm)Tran
s C
ol B
ase
She
ar (k
N)
-15 -10 -5 0 5 10 15-600
040
0
Es - 47.9 MPaCenter Bent, Center Column
-4 -2 0 2 4
-100
050
Trans Disp (in)
Tran
s C
ol B
ase
She
ar (k
ip)
Long Disp (cm)
Long
Col
Bas
e S
hear
(kN
)
-15 -10 -5 0 5 10 15-600
040
0
-4 -2 0 2 4
-100
050
Long Disp (in)
Long
Col
Bas
e S
hear
(kip
)
Trans Disp (cm)Tran
s C
ol B
ase
She
ar (k
N)
-15 -10 -5 0 5 10 15-600
040
0
Es - 861.9 MPaCenter Bent, Center Column
-4 -2 0 2 4
-100
050
Trans Disp (in)
Tran
s C
ol B
ase
She
ar (k
ip)
Long Disp (cm)
Long
Col
Bas
e S
hear
(kN
)-15 -10 -5 0 5 10 15-6
000
400
-4 -2 0 2 4
-100
050
Long Disp (in)
Long
Col
Bas
e S
hear
(kip
)
Figure 6.1-3 Center Bent, Center Column: Hysteresis Curves for Bridge 5/227; Kobe 975 EQ; Es=47.9 MPa (1000ksf); 861.9 MPa (18000 ksf)
Trans Disp (cm)Tran
s C
ol B
ase
She
ar (k
N)
-15 -10 -5 0 5 10 15-600
040
0
Es - 47.9 MPaCenter Bent, Center Column
-4 -2 0 2 4
-100
050
Trans Disp (in)
Tran
s C
ol B
ase
She
ar (k
ip)
Long Disp (cm)
Long
Col
Bas
e S
hear
(kN
)
-15 -10 -5 0 5 10 15-600
040
0
-4 -2 0 2 4
-100
050
Long Disp (in)
Long
Col
Bas
e S
hear
(kip
)
Trans Disp (cm)Tran
s C
ol B
ase
She
ar (k
N)
-15 -10 -5 0 5 10 15-600
040
0
Es - 861.9 MPaCenter Bent, Center Column
-4 -2 0 2 4
-100
050
Trans Disp (in)
Tran
s C
ol B
ase
She
ar (k
ip)
Long Disp (cm)
Long
Col
Bas
e S
hear
(kN
)
-15 -10 -5 0 5 10 15-600
040
0
-4 -2 0 2 4
-100
050
Long Disp (in)
Long
Col
Bas
e S
hear
(kip
)
Figure 6.1-4 Center Bent, Center Column: Hysteresis Curves for Bridge 5/227; Mexico City 975 EQ; Es= 47.9 MPa (1000ksf); 861.9 MPa (18000 ksf)
75

Trans Disp (cm)Tran
s C
ol B
ase
She
ar (k
N)
-15 -10 -5 0 5 10 15-600
040
0
Es - 47.9 MPaCenter Bent, Center Column
-4 -2 0 2 4
-100
050
Trans Disp (in)
Tran
s C
ol B
ase
She
ar (k
ip)
Long Disp (cm)
Long
Col
Bas
e S
hear
(kN
)
-15 -10 -5 0 5 10 15-600
040
0
-4 -2 0 2 4
-100
050
Long Disp (in)
Long
Col
Bas
e S
hear
(kip
)
Trans Disp (cm)Tran
s C
ol B
ase
She
ar (k
N)
-15 -10 -5 0 5 10 15-600
040
0
Es - 861.9 MPaCenter Bent, Center Column
-4 -2 0 2 4
-100
050
Trans Disp (in)
Tran
s C
ol B
ase
She
ar (k
ip)
Long Disp (cm)
Long
Col
Bas
e S
hear
(kN
)-15 -10 -5 0 5 10 15-6
000
400
-4 -2 0 2 4
-100
050
Long Disp (in)
Long
Col
Bas
e S
hear
(kip
)
Figure 6.1-5 Center Bent, Center Column: Hysteresis Curves for Bridge 5/227; Olympia 975 EQ; Es=47.9 MPa (1000ksf); 861.9 MPa (18000 ksf)
Trans Disp (cm)Tran
s C
ol B
ase
She
ar (k
N)
-15 -10 -5 0 5 10 15-600
040
0
Es - 47.9 MPaCenter Bent, Center Column
-4 -2 0 2 4
-100
050
Trans Disp (in)
Tran
s C
ol B
ase
She
ar (k
ip)
Long Disp (cm)
Long
Col
Bas
e S
hear
(kN
)
-15 -10 -5 0 5 10 15-600
040
0
-4 -2 0 2 4
-100
050
Long Disp (in)
Long
Col
Bas
e S
hear
(kip
)
Trans Disp (cm)Tran
s C
ol B
ase
She
ar (k
N)
-15 -10 -5 0 5 10 15-600
040
0
Es - 861.9 MPaCenter Bent, Center Column
-4 -2 0 2 4
-100
050
Trans Disp (in)
Tran
s C
ol B
ase
She
ar (k
ip)
Long Disp (cm)
Long
Col
Bas
e S
hear
(kN
)
-15 -10 -5 0 5 10 15-600
040
0
-4 -2 0 2 4
-100
050
Long Disp (in)
Long
Col
Bas
e S
hear
(kip
)
Figure 6.1-6 Center Bent, Center Column: Hysteresis Curves for Bridge 5/227; Chile 2475 EQ; Es=47.9 MPa (1000ksf); 861.9 MPa (18000 ksf)
76

Trans Disp (cm)Tran
s C
ol B
ase
She
ar (k
N)
-20 -10 0 10 20-600
040
0
Es - 47.9 MPaCenter Bent, Center Column
-6 -4 -2 0 2 4 6
-100
050
Trans Disp (in)
Tran
s C
ol B
ase
She
ar (k
ip)
Long Disp (cm)
Long
Col
Bas
e S
hear
(kN
)
-20 -10 0 10 20-600
040
0
-6 -4 -2 0 2 4 6
-100
050
Long Disp (in)
Long
Col
Bas
e S
hear
(kip
)
Trans Disp (cm)Tran
s C
ol B
ase
She
ar (k
N)
-20 -10 0 10 20-600
040
0
Es - 861.9 MPaCenter Bent, Center Column
-6 -4 -2 0 2 4 6
-100
050
Trans Disp (in)
Tran
s C
ol B
ase
She
ar (k
ip)
Long Disp (cm)
Long
Col
Bas
e S
hear
(kN
)-20 -10 0 10 20-6
000
400
-6 -4 -2 0 2 4 6
-100
050
Long Disp (in)
Long
Col
Bas
e S
hear
(kip
)
Figure 6.1-7 Center Bent, Center Column: Hysteresis Curves for Bridge 5/227; Peru 2475 EQ; Es=47.9 MPa (1000ksf); 861.9 MPa (18000 ksf)
The overall shape of the hysteresis curves did not vary significantly with the
foundation spring stiffness values. The transverse direction of the bridge experienced a
higher demand than that of the longitudinal, largely due to the non-monolithic deck.
Yielding of the columns tended to occur at a smaller displacement for the fixed-column
base/roller-abutment models than for the soil spring models for all excitations. This was
due to the spring flexibility at the column base absorbing some of the rotational demand
of the column for a given relative displacement demand.
Both the Peru 975 and 2475 earthquakes produce high demands in the center
column of the center bent with fixed-column base/roller-abutment boundary conditions,
coming relatively close to failing the column. The column almost fails under all three
77

boundary conditions when the bridge is subject to Peru 2475, and comes close to failing
for the fixed-base column model, subject to Peru 975.
To estimate the potential damage in the columns, the number of cycles reaching a
given ductility was determined and compared to test results obtained by Jaradat (1996).
The maximum displacement demands were predicted for the center column of the center
bent under the Peru 2475 earthquake. Figures 6.1-8 and 6.1-9 show the displace e
histories for this column with the soil spring boundary conditions.
Time (s)
Tran
s D
isp(
cm)
0 20 40 60 80
-15
-10
-50
510
15
Figure 6.1-8 Center Bent, Center Column: Displacement Time History for Bridge 5/227; PEQ; Es=287.3 MPa
78
ment tim
12
3p
(in)
∆y
1.5∆y
3∆y
4∆y
5∆y
0an
s D
is
-1 Tr100-3
-2
eru 2475

Time (s)
Tran
s D
isp(
cm)
0 20 40 60 80
-15
-10
-50
510
15
3
Figure 6.1-9 Center Bent, Center Column: Displacement Time History for Bridge 5/227
EQ; Es=861.9 MPa
The following damage was observed for Jaradat’s test column. At a du
of 3 ∆y, six half-cycles occurred. Vertical cracks in the bottom splice
circumferential cracks in the top hinging region appeared. After six half-
ductility level of 4 ∆y, spalling in both top and bottom hinging regions was o
after six half-cycles at 5 ∆y, longitudinal bar buckling in the top hinging region
79
5∆y
4∆y 2 3∆y1 )
1.5∆yp (in
∆y100
-3-2
-10
Tran
s D
is
; Peru 2475
ctility level
region and
cycles at a
bserved and
occurred.
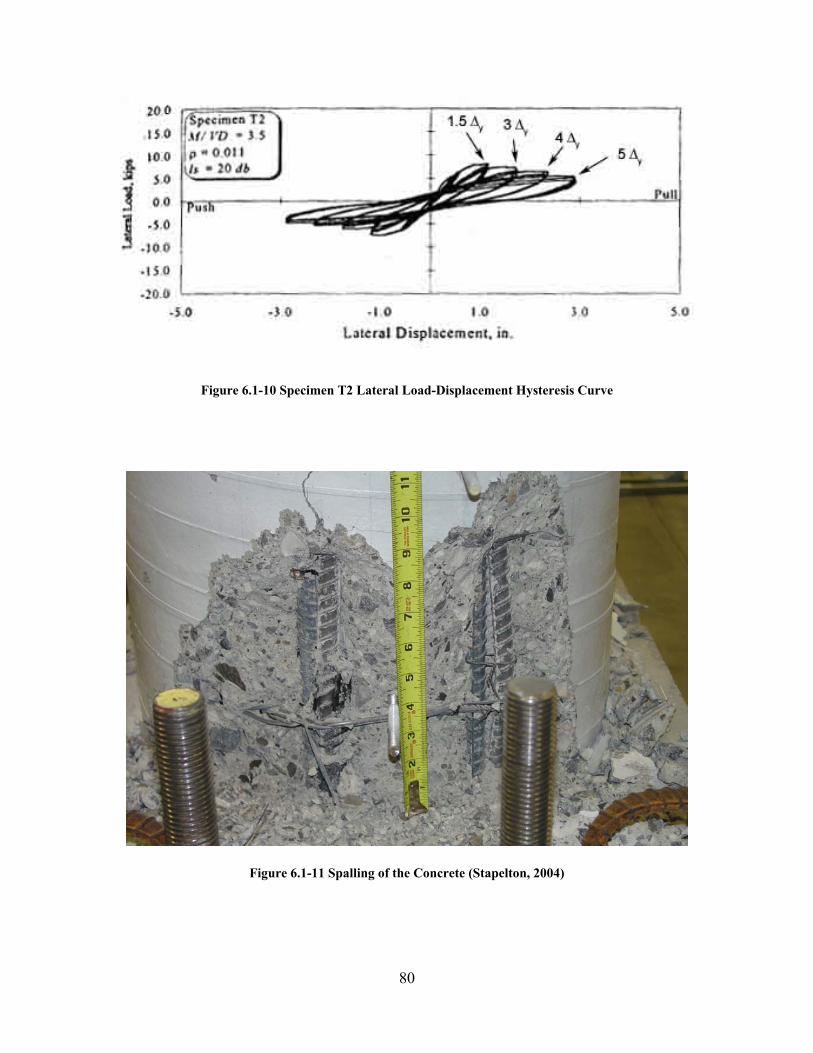
Figure 6.1-10 Specimen T2 Lateral Load-Displacement Hysteresis Curve
Figure 6.1-11 Spalling of the Concrete (Stapelton, 2004)
80

Figure 6.1-12 Vertical Cracks at Tension Face (Stapelton, 2004)
For the center column of Bridge 5/227, approximately 20 half-cycles occurred at a
ductility level of 3 ∆y, therefore damage in this column can be expected to include large
vertical cracks in the bottom splice region and circumferential cracks in the top hinging
region. 5 half-cycles at a ductility level of 4 ∆y would produce moderate spalling in both
top and bottom hinging regions. Due to the numerous cycles at 3 ∆y coupled with the
cycles at 4 ∆y, failure of Bridge 5/227 columns is likely under the Peru 2475 earthquake.
Similar damage was predicted for the 861.9 MPa soil elastic modulus model.
The shear force demand in the girders at the abutments was also investigated.
Bridge 5/227 has two girder stops at each bent and abutment, resisting displacements in
the transverse direction. Due to previous problems with bridge girders, a check was made
to determine if the shear forces coming into the girder stops would cause a shear failure
81

in the web of the prestressed I-girders supporting the deck. The results indicated that the
shear capacity of the girder webs is approximately 1312 kN (295 kips) and the maximum
shear force under Chile 2475 loading was approximately 338 kN (91 kips) in the west
abutment for the lowest spring stiffness (Es = 47.9 MPa). The shear force calculations
can be found in Appendix 4.
The shear force demand/capacity ratio in the column footings was also
investigated. The shear forces in the footing act as a combination of longitudinal and
transverse forces, creating a resultant force acting at a given angle depending on the
magnitudes of the forces. The shear force demand was studied independently for both
directions in this research. The maximum shear demands in the footings for both the
longitudinal and transverse directions were extracted from the analyses and can be found
in Appendix 4. Longitudinal shear force demands for Bridge 5/227 in the column
footings were of 476 kN (107 kips). The footing capacity is 2185 kN (492 kips) or four
times higher than the demands. Transverse shear force demands were maximum for a
value 417 kN (94 kips) and the capacity in the transverse direction for the footing was
1641 kN (369 kips), sufficient to support the shear forces. However, studies have shown
that the joint shear strength was often a cause of brittle failure in the column/footing
connection (McLean, 1999). Due to the significantly low shear forces in the column
footings, this failure mode was not investigated in this research but should however be
taken into consideration as a potential governing failure mode for future studies.
82

6.2 BRIDGE 512/19
Bridge 512/19 is the largest of all three bridges. It is made of three bents of four
columns each, a 77ft long monolithic deck, and it rests on spread footings without piles.
The analysis showed that the two center columns were subjected to the most demands,
the results will therefore concentrate on those two columns. Table 6.2-1 presents the
maximum values obtained in the analysis:
Table 6.2-1 Maximum Earthquake demands for Bridge 512/19 Subject to the Olympia 975 Loading
Bent 512 - O - 283.7 512 - O - 861.9 512 - O - fixed
North - East 8.06 8.01 9.60North - Middle East 6.61 6.53 7.91North - Middle West 6.09 6.14 8.14North - West 7.26 7.09 9.65Center - East 9.10 9.43 9.87Center - Middle East 9.13 9.42 9.84Center - Middle West 9.16 9.41 9.81Center - West 9.20 9.40 9.78South - East 7.26 7.13 9.57South - Middle East 6.08 6.16 8.07South - Middle West 6.22 6.49 7.92South - West 7.74 8.05 9.70
North - East 219 230 253North - Middle East 198 230 305North - Middle West 219 215 397North - West 222 372 257Center - East 241 239 227Center - Middle East 238 244 229Center - Middle West 250 243 227Center - West 239 235 228South - East 234 331 268South - Middle East 211 215 253South - Middle West 205 211 352South - West 212 265 253
Max ∆ (cm)
Max V (kN)
83

The maximum displacements were found at the center bent, center columns. The
displacements were similar for the two spring models and increased for the fixed column
base model (maximum increase of 30%). There was a slight increase in shear force
demands between the 287.3 MPa soil modulus model and the fixed column base/roller
abutment model, for the south bent, middle-east column.
Table 6.2-2 Maximum Earthquake Demands for Bridge 512/19 Subject to the Peru 2475 Loading
Bent 512 - P - 283.7 512 - P - 861.9 512 - P - fixed
North - East 15.07 14.24 22.19North - Middle East 14.04 12.51 19.73North - Middle West 13.02 12.04 17.30North - West 15.60 14.88 16.88Center - East 19.19 18.59 20.50Center - Middle East 19.17 18.58 20.53Center - Middle West 19.15 18.58 20.56Center - West 19.12 18.57 20.58South - East 15.35 14.63 16.83South - Middle East 12.95 11.70 17.23South - Middle West 14.06 12.47 19.72South - West 15.18 13.93 22.24
North - East 359 334 450North - Middle East 338 304 423North - Middle West 352 334 370North - West 409 375 350Center - East 366 393 420Center - Middle East 395 360 423Center - Middle West 428 398 419Center - West 418 372 421South - East 416 305 352South - Middle East 509 263 389South - Middle West 400 306 419South - West 380 322 434
Max V (kN)
Max ∆ (cm)
84

Bridge 512/19 behaved similarly under Peru 2475 but with larger demands.
Displacements were maximum in the center bent for all three models. The largest
increase (approximately 45%) in displacement occurred at the north and south bents,
between the 287.3 MPa model and the fixed columns base/roller abutment model. There
was a moderate increase in the shear force demands (25%) between the lowest spring
model and fixed column base model. Pounding of the deck at the abutments was not an
issue for this bridge. The hysteresis curves for Bridge 512/19 spring and fixed column
base models under Chile 975, Peru 975, Kobe 975, Mexico City 975, Olympia 975, Chile
2475 and Peru 2475 can be found in figures 6.2-2 through 6.2-10 .
Transverse Displacement (cm)Tran
s C
ol B
ase
She
ar (k
N)
-20 -10 0 10 20-600
040
0
Chile 975 EQ - Fixed/roller Center Bent, Middle East Column
-6 -4 -2 0 2 4 6
-50
50
Transverse Displacement (in)
Tran
s C
ol B
ase
She
ar (k
ip)
Longitudinal Displacement (cm)Long
Col
Bas
e S
hear
(kN
)
-20 -10 0 10 20-600
040
0
-6 -4 -2 0 2 4 6
-50
50
Longitudinal Displacement (in)
Long
Col
Bas
e S
hear
(kip
)
Transverse Displacement (cm)Tran
s C
ol B
ase
She
ar (k
N)
-20 -10 0 10 20-600
040
0
Peru 975 EQ - Fixed/roller Center Bent, Middle East Column
-6 -4 -2 0 2 4 6
-50
50
Transverse Displacement (in)
Tran
s C
ol B
ase
She
ar (k
ip)
Longitudinal Displacement (cm)Long
Col
Bas
e S
hear
(kN
)
-20 -10 0 10 20-600
040
0
-6 -4 -2 0 2 4 6-5
050
Longitudinal Displacement (in)Lo
ng C
ol B
ase
She
ar (k
ip)
Figure 6.2-1 Center Bent, Middle East Column: Hysteresis Curves for Bridge 512/19; Chile 975 EQ and Peru 975 EQ; Fixed Column Base/Roller Abutment Boundary Conditions
85

Trans Disp (cm)Tran
s C
ol B
ase
She
ar (k
N)
-20 -10 0 10 20-600
040
0
Es - 287.3 MPa Center Bent, Middle East Column
-6 -4 -2 0 2 4 6
-50
50
Trans Disp (in)
Tran
s C
ol B
ase
She
ar (k
ip)
Long Disp (cm)Long
Col
Bas
e S
hear
(kN
)
-20 -10 0 10 20-600
040
0
-6 -4 -2 0 2 4 6
-50
50
Long Disp (in)
Long
Col
Bas
e S
hear
(kip
)
Trans Disp (cm)Tran
s C
ol B
ase
She
ar (k
N)
-20 -10 0 10 20-600
040
0
Es - 861.9 MPa Center Bent, Middle East Column
-6 -4 -2 0 2 4 6
-50
50
Trans Disp (in)
Tran
s C
ol B
ase
She
ar (k
ip)
Long Disp (cm)Long
Col
Bas
e S
hear
(kN
)-20 -10 0 10 20-6
000
400
-6 -4 -2 0 2 4 6
-50
50
Long Disp (in)
Long
Col
Bas
e S
hear
(kip
)
Figure 6.2-2 Center Bent, Middle East Column: Hysteresis Curves for Bridge 512/19; Chile 975 EQ; Es=47.9 MN/m2 (1000ksf); 861.9 MN/m2 (18000 ksf)
Trans Disp (cm)Tran
s C
ol B
ase
She
ar (k
N)
-20 -10 0 10 20-600
040
0
Es - 287.3 MPa Center Bent, Middle East Column
-6 -4 -2 0 2 4 6
-50
50
Trans Disp (in)
Tran
s C
ol B
ase
She
ar (k
ip)
Long Disp (cm)Long
Col
Bas
e S
hear
(kN
)
-20 -10 0 10 20-600
040
0
-6 -4 -2 0 2 4 6
-50
50
Long Disp (in)
Long
Col
Bas
e S
hear
(kip
)
Trans Disp (cm)Tran
s C
ol B
ase
She
ar (k
N)
-20 -10 0 10 20-600
040
0
Es - 861.9 MPa Center Bent, Middle East Column
-6 -4 -2 0 2 4 6
-50
50
Trans Disp (in)
Tran
s C
ol B
ase
She
ar (k
ip)
Long Disp (cm)Long
Col
Bas
e S
hear
(kN
)
-20 -10 0 10 20-600
040
0
-6 -4 -2 0 2 4 6
-50
50
Long Disp (in)
Long
Col
Bas
e S
hear
(kip
)
Figure 6.2-3 Center Bent, Middle East Column: Hysteresis Curves for Bridge 512/19; Peru 975 EQ; Es=47.9 MN/m2 (1000ksf); 861.9 MN/m2 (18000 ksf)
86

Transverse Displacement (cm)Tran
s C
ol B
ase
She
ar (k
N)
-20 -10 0 10 20-600
040
0
Kobe 975 EQ - Fixed/roller Center Bent, Middle East Column
-6 -4 -2 0 2 4 6
-50
50
Transverse Displacement (in)
Tran
s C
ol B
ase
She
ar (k
ip)
Longitudinal Displacement (cm)Long
Col
Bas
e S
hear
(kN
)
-20 -10 0 10 20-600
040
0
-6 -4 -2 0 2 4 6
-50
50
Longitudinal Displacement (in)
Long
Col
Bas
e S
hear
(kip
)
Transverse Displacement (cm)Tran
s C
ol B
ase
She
ar (k
N)
-20 -10 0 10 20-600
040
0
Mexico City 975 EQ - Fixed/roller Center Bent, Middle East Column
-6 -4 -2 0 2 4 6
-50
50
Transverse Displacement (in)
Tran
s C
ol B
ase
She
ar (k
ip)
Longitudinal Displacement (cm)Long
Col
Bas
e S
hear
(kN
)
-20 -10 0 10 20-600
040
0
-6 -4 -2 0 2 4 6
-50
50
Longitudinal Displacement (in)
Long
Col
Bas
e S
hear
(kip
)
Transverse Displacement (cm)Tran
s C
ol B
ase
Shea
r (kN
)
-20 -10 0 10 20-600
040
0
Olympia 975 EQ - Fixed/roller Center Bent, Middle East Column
-6 -4 -2 0 2 4 6
-50
50
Transverse Displacement (in)
Tran
s C
ol B
ase
She
ar (k
ip)
Longitudinal Displacement (cm)Long
Col
Bas
e Sh
ear (
kN)
-20 -10 0 10 20-600
040
0
-6 -4 -2 0 2 4 6
-50
50
Longitudinal Displacement (in)
Long
Col
Bas
e Sh
ear (
kip)
Transverse Displacement (cm)Tran
s C
ol B
ase
Shea
r (kN
)
-20 -10 0 10 20-600
040
0
Chile 2475 EQ - Fixed/roller Center Bent, Middle East Column
-6 -4 -2 0 2 4 6
-50
50
Transverse Displacement (in)
Tran
s C
ol B
ase
She
ar (k
ip)
Longitudinal Displacement (cm)Long
Col
Bas
e Sh
ear (
kN)
-20 -10 0 10 20-600
040
0
-6 -4 -2 0 2 4 6-5
050
Longitudinal Displacement (in)Lo
ng C
ol B
ase
Shea
r (ki
p)
Transverse Displacement (cm)Tran
s C
ol B
ase
She
ar (k
N)
-20 -10 0 10 20-600
040
0
Peru 2475 EQ - Fixed/roller Center Bent, Middle East Column
-6 -4 -2 0 2 4 6
-50
50
Transverse Displacement (in)
Tran
s C
ol B
ase
She
ar (k
ip)
Longitudinal Displacement (cm)Long
Col
Bas
e S
hear
(kN
)
-20 -10 0 10 20-600
040
0
-6 -4 -2 0 2 4 6
-50
50
Longitudinal Displacement (in)
Long
Col
Bas
e S
hear
(kip
)
Figure 6.2-4 Center Bent, Middle East Column: Hysteresis Curves for Bridge 512/19; Kobe 975 EQ, Mexico City 975 EQ, Olympia 975 EQ, Chile 2475 EQ and Peru 2475 EQ; Fixed Column
Base/Roller Abutment Boundary Conditions
87

Trans Disp (cm)Tran
s C
ol B
ase
She
ar (k
N)
-20 -10 0 10 20-600
040
0
Es - 287.3 MPa Center Bent, Middle East Column
-6 -4 -2 0 2 4 6
-50
50
Trans Disp (in)
Tran
s C
ol B
ase
She
ar (k
ip)
Long Disp (cm)Long
Col
Bas
e S
hear
(kN
)
-20 -10 0 10 20-600
040
0
-6 -4 -2 0 2 4 6
-50
50
Long Disp (in)
Long
Col
Bas
e S
hear
(kip
)
Trans Disp (cm)Tran
s C
ol B
ase
She
ar (k
N)
-20 -10 0 10 20-600
040
0
Es - 861.9 MPa Center Bent, Middle East Column
-6 -4 -2 0 2 4 6
-50
50
Trans Disp (in)
Tran
s C
ol B
ase
She
ar (k
ip)
Long Disp (cm)Long
Col
Bas
e S
hear
(kN
)-20 -10 0 10 20-6
000
400
-6 -4 -2 0 2 4 6
-50
50
Long Disp (in)
Long
Col
Bas
e S
hear
(kip
)
Figure 6.2-5 Center Bent, Middle East Column: Hysteresis Curves for Bridge 512/19; Kobe 975 EQ; Es=287.3 MN/m2 (6000 ksf); 861.9 MN/m2 (18000 ksf)
Trans Disp (cm)Tran
s C
ol B
ase
She
ar (k
N)
-20 -10 0 10 20-600
040
0
Es - 287.3 MPa Center Bent, Middle East Column
-6 -4 -2 0 2 4 6
-50
50
Trans Disp (in)
Tran
s C
ol B
ase
She
ar (k
ip)
Long Disp (cm)Long
Col
Bas
e S
hear
(kN
)
-20 -10 0 10 20-600
040
0
-6 -4 -2 0 2 4 6
-50
50
Long Disp (in)
Long
Col
Bas
e S
hear
(kip
)
Trans Disp (cm)Tran
s C
ol B
ase
She
ar (k
N)
-20 -10 0 10 20-600
040
0
Es - 861.9 MPa Center Bent, Middle East Column
-6 -4 -2 0 2 4 6
-50
50
Trans Disp (in)
Tran
s C
ol B
ase
She
ar (k
ip)
Long Disp (cm)Long
Col
Bas
e S
hear
(kN
)
-20 -10 0 10 20-600
040
0
-6 -4 -2 0 2 4 6
-50
50
Long Disp (in)
Long
Col
Bas
e S
hear
(kip
)
Figure 6.2-6 Center Bent, Middle East Column: Hysteresis Curves for Bridge 512/19; Mexico City 975 EQ; Es=287.3 MPa (6000 ksf); 861.9 MPa (18000 ksf)
88

Trans Disp (cm)Tran
s C
ol B
ase
She
ar (k
N)
-20 -10 0 10 20-600
040
0
Es - 287.3 MPa Center Bent, Middle East Column
-6 -4 -2 0 2 4 6
-50
50
Trans Disp (in)
Tran
s C
ol B
ase
She
ar (k
ip)
Long Disp (cm)Long
Col
Bas
e S
hear
(kN
)
-20 -10 0 10 20-600
040
0
-6 -4 -2 0 2 4 6
-50
50
Long Disp (in)
Long
Col
Bas
e S
hear
(kip
)
Trans Disp (cm)Tran
s C
ol B
ase
She
ar (k
N)
-20 -10 0 10 20-600
040
0
Es - 861.9 MPa Center Bent, Middle East Column
-6 -4 -2 0 2 4 6
-50
50
Trans Disp (in)
Tran
s C
ol B
ase
She
ar (k
ip)
Long Disp (cm)Long
Col
Bas
e S
hear
(kN
)-20 -10 0 10 20-6
000
400
-6 -4 -2 0 2 4 6
-50
50
Long Disp (in)
Long
Col
Bas
e S
hear
(kip
)
Figure 6.2-7 Center Bent, Middle East Column: Hysteresis Curves for Bridge 512/19; Olympia 975 EQ; Es=287.3 MN/m2 (6000 ksf); 861.89 MN/m2 (18000 ksf)
Trans Disp (cm)Tran
s C
ol B
ase
She
ar (k
N)
-20 -10 0 10 20-600
040
0
Es - 287.3 MPa Center Bent, Middle East Column
-6 -4 -2 0 2 4 6
-50
50
Trans Disp (in)
Tran
s C
ol B
ase
She
ar (k
ip)
Long Disp (cm)Long
Col
Bas
e S
hear
(kN
)
-20 -10 0 10 20-600
040
0
-6 -4 -2 0 2 4 6
-50
50
Long Disp (in)
Long
Col
Bas
e S
hear
(kip
)
Trans Disp (cm)Tran
s C
ol B
ase
She
ar (k
N)
-20 -10 0 10 20-600
040
0
Es - 861.9 MPa Center Bent, Middle East Column
-6 -4 -2 0 2 4 6
-50
50
Trans Disp (in)
Tran
s C
ol B
ase
She
ar (k
ip)
Long Disp (cm)Long
Col
Bas
e S
hear
(kN
)
-20 -10 0 10 20-600
040
0
-6 -4 -2 0 2 4 6
-50
50
Long Disp (in)
Long
Col
Bas
e S
hear
(kip
)
Figure 6.2-8 Center Bent, Middle East Column: Hysteresis Curves for Bridge 512/19; Chile 2475 EQ; Es=287.3 MN/m2 (6000 ksf); 861.9 MN/m2 (18000 ksf)
89

Trans Disp (cm)Tran
s C
ol B
ase
She
ar (k
N)
-20 -10 0 10 20-600
040
0
Es - 287.3 MPa Center Bent, Middle East Column
-6 -4 -2 0 2 4 6
-50
50
Trans Disp (in)
Tran
s C
ol B
ase
She
ar (k
ip)
Long Disp (cm)Long
Col
Bas
e S
hear
(kN
)
-20 -10 0 10 20-600
040
0
-6 -4 -2 0 2 4 6
-50
50
Long Disp (in)
Long
Col
Bas
e S
hear
(kip
)
Trans Disp (cm)Tran
s C
ol B
ase
She
ar (k
N)
-20 -10 0 10 20-600
040
0
Es - 861.9 MPa Center Bent, Middle East Column
-6 -4 -2 0 2 4 6
-50
50
Trans Disp (in)
Tran
s C
ol B
ase
She
ar (k
ip)
Long Disp (cm)Long
Col
Bas
e S
hear
(kN
)-20 -10 0 10 20-6
000
400
-6 -4 -2 0 2 4 6
-50
50
Long Disp (in)
Long
Col
Bas
e S
hear
(kip
)
Figure 6.2-9 Center Bent, Middle East Column: Hysteresis Curves for Bridge 512/19; Peru 2475 EQ; Es=287.3 MN/m2 (6000 ksf); 861.9 Pa (18000 ksf)
The column shear in the transverse direction comes very close to failure under
Peru 2475 and Chile 2475 for all three stiffness values. The general shape of the
hysteresis curves was not affected by the variation in spring values. Bridge 512/19’s
middle-east column of the center bent fails in shear under Peru 2475 and comes close to
failing under Chile 2475 and Peru 975 for all boundary conditions.
As for Bridge 227, the damage in the columns was estimated based on Jaradat’s
(1996) test results. The maximum demands were predicted for the center bent, middle-
east column under the Peru 2475 for all spring models. Below are presented the
displacement time-histories for both soil spring boundary conditions under the Peru 2475
earthquake.
90

Time (s)
Tran
s D
isp(
cm)
0 20 40 60 80
-20
-10
010
20
4
Figure 6.2-10 Center Bent, Middle East Column: Displacement Time History for 2475 EQ; Es=287.3 MPa
Time (s)
Tran
s D
isp(
cm)
0 20 40 60 80
-20
-10
010
20
Figure 6.2-11 Center Bent, Middle East Column: Displacement Time History for 2475 EQ; Es=861.9 MPa
The soft soil spring model time history shows that one half-cycle
ductility level of 4 ∆y, while a few half cycles nearly reach 3 ∆y. Damag
can be expected to include vertical cracks and spalling in the hinging re
91
5∆y
4∆y 3∆y2)
1.5∆yp (in
Br
Br
n
e
gi
∆y
100
-4-2
0Tr
ans
Dis
idge 512/19; Peru
4
5∆y 4∆y2
3∆yin)
1.5∆yisp
(
∆y100
-4-2
0Tr
ans
D
idge 512/19; Peru
early reaches a
in the columns
ons. Due to the

small number of high ductility demand cycles, damage can be expected to be lighter than
for Bridge 227. However, the proximity of the force/displacement hysteresis curves to
the column shear capacity envelope highlights the probability of column failure.
Shear in the prestressed I-girders was investigated for Bridge 512/19. Four girder
stops were constructed on each abutment, two in each direction. The shear capacity of the
girder webs was 2096 kN (451 kips). The maximum shear force was at the north
abutment under the Peru 2475 earthquake loading and was 1372 kN (308 kips) per girder
stop. The shear in the footings was the highest in the fixed condition model under the
Peru 2475 earthquake loading. The maximum value was approximately 404 kN (91 kips)
in the transverse direction and 365 kN (82 kips) in the longitudinal direction. The shear
capacity of the footing was calculated at 972 kN (219 kips), more than twice the highest
shear demand. Shear failure in the girder webs and at the column footings is not an issue
for Bridge 512/19. The shear demand calculations are detailed in Appendix 4. As for
Bridge 227, the shear force demands in the column footings were low enough that
column/footing joint failure was not studied.
The previous analyses show that spring values have a significant effect on the
displacements in the bridge. The fixed column base model creates the highest shear and
displacements demands for all earthquake loadings. Under the Peru 2475 and Chile 2475
earthquakes, Bridge 512/19 column hysteresis demands come to close to or exceed the
shear failure envelope for all three spring models. The three 975-year return earthquakes,
Olympia, Kobe and Mexico City, produced similar hysteresis responses, with Mexico
City having slightly lower displacement demands than the other two.
92

6.3 BRIDGE 5/649
Bridge 5/649 has a 74.7 m (245 ft) long non-monolithic deck, two bents with
three columns per bent, resting on spread footings supported by timber piles. It was
determined in chapter four that the skew had a significant effect on the behavior of the
bridge and could not be neglected in the modeling process. The following maximum
demands were obtained during the analysis of Bridge 5/649.
Table 6.3-1 Maximum Earthquake demands for Bridge 5/649 Subject to the Olympia 975 Loading
Bent 649 - O - 283.7 649 - O - 861.9 649 - O - fixed
North - East 8.24 8.92 8.02North - Center 7.38 7.49 8.02North - West 7.33 7.35 8.02South - East 8.28 8.55 10.05South - Center 8.27 8.27 10.05South - West 8.26 8.17 10.06
North - East 271 272 331North - Center 200 205 245North - West 323 455 404South - East 282 298 333South - Center 170 225 263South - West 315 316 402
Max ∆ (cm)
Max V (kN)
The displacement demands slightly varied with the increase of stiffness, the
highest variation occurring between the 287.3 MPa elastic modulus value model and the
fixed model for the east column of the south bent (+22% or +1.8 cm, 0.71 in). The shear
demands followed the same trend as the displacements. A significant 82 % increase was
found in the longitudinal shear demands between the spring values for the east column of
the south bent. However, in all other columns for all three models, the variation was not
significant under the Olympia 975 earthquake.
93

Table 6.3-2 Maximum Earthquake demands for Bridge 5/649 Subject to the Peru 2475 Loading
Bent 649 - P - 283.7 649 - P - 861.9 649 - P - fixed
North - East 17.70 18.48 20.17North - Center 17.54 17.37 20.08North - West 17.41 16.61 19.99South - East 16.46 17.14 22.32South - Center 17.32 16.58 22.25South - West 18.22 17.11 22.20
North - East 522 537 715North - Center 455 552 755North - West 584 634 836South - East 389 421 584South - Center 377 420 613South - West 509 487 759
Max V (kN)
Max ∆ (cm)
The displacement demands under the Peru 2475 loading follows the same trends
as for the Olympia 975 loading. There were small variations between the two spring
models. The displacements increased by a maximum of 35% between the lowest spring
model and the fixed column base model at the south bent, east column. Shear forces were
highest for the columns that were fixed at the base, with an average increase of 60%
between the spring soil conditions and the fixed column base/roller abutment boundary
condition models.
94

Transverse Displacement (cm)Tran
s C
ol B
ase
She
ar (k
N)
-20 -10 0 10 20-100
00
500
Chile 975 EQ - Fixed/rollerSouth Bent, Middle Column
-6 -4 -2 0 2 4 6
-200
010
0
Transverse Displacement (in)
Tran
s C
ol B
ase
She
ar (k
ip)
Longitudinal Displacement (cm)
Long
Col
Bas
e S
hear
(kN
)
-20 -10 0 10 20-100
00
500
-6 -4 -2 0 2 4 6
-200
010
0
Longitudinal Displacement (in)
Long
Col
Bas
e S
hear
(kip
)
Transverse Displacement (cm)Tran
s C
ol B
ase
She
ar (k
N)
-20 -10 0 10 20-100
00
500
Peru 975 EQ - Fixed/rollerSouth Bent, Middle Column
-6 -4 -2 0 2 4 6
-200
010
0
Transverse Displacement (in)
Tran
s C
ol B
ase
She
ar (k
ip)
Longitudinal Displacement (cm)
Long
Col
Bas
e S
hear
(kN
)-20 -10 0 10 20-1
000
050
0
-6 -4 -2 0 2 4 6
-200
010
0
Longitudinal Displacement (in)
Long
Col
Bas
e S
hear
(kip
)
Figure 6.3-1 South Bent, Center Column: Hysteresis Curves for Bridge 5/649 E; Chile 975 EQ, Peru 975 EQ; Fixed Column Bases/Roller Abutment Boundary Conditions
Trans Disp (cm)Tran
s C
ol B
ase
She
ar (k
N)
-20 -10 0 10 20-800
-200
400
Es - 287.3 MPaSouth Bent, Middle Column
-6 -4 -2 0 2 4 6
-100
010
0
Trans Disp (in)
Tran
s C
ol B
ase
She
ar (k
ip)
Long Disp (cm)
Long
Col
Bas
e S
hear
(kN
)
-20 -10 0 10 20-800
-200
400
-6 -4 -2 0 2 4 6
-100
010
0
Long Disp (in)
Long
l Col
Bas
e S
hear
(kip
)
Trans Disp (cm)Tran
s C
ol B
ase
She
ar (k
N)
-20 -10 0 10 20-800
-200
400
Es - 861.9 MPaSouth Bent, Middle Column
-6 -4 -2 0 2 4 6
-100
010
0
Trans Disp (in)
Tran
s C
ol B
ase
She
ar (k
ip)
Long Disp (cm)
Long
Col
Bas
e S
hear
(kN
)
-20 -10 0 10 20-800
-200
400
-6 -4 -2 0 2 4 6
-100
010
0
Long Disp (in)
Long
l Col
Bas
e S
hear
(kip
)
Figure 6.3-2 South Bent, Center Column: Hysteresis Curves for Bridge 5/649E; Chile 975 EQ; Es=287.3 MPa (6000 ksf); 861.9 MPa (18000 ksf)
95

Trans Disp (cm)Tran
s C
ol B
ase
She
ar (k
N)
-20 -10 0 10 20-800
-200
400
Es - 287.3 MPaSouth Bent, Middle Column
-6 -4 -2 0 2 4 6
-100
010
0
Trans Disp (in)
Tran
s C
ol B
ase
She
ar (k
ip)
Long Disp (cm)
Long
Col
Bas
e S
hear
(kN
)
-20 -10 0 10 20-800
-200
400
-6 -4 -2 0 2 4 6
-100
010
0
Long Disp (in)
Long
l Col
Bas
e S
hear
(kip
)
Trans Disp (cm)Tran
s C
ol B
ase
She
ar (k
N)
-20 -10 0 10 20-800
-200
400
Es - 861.9 MPaSouth Bent, Middle Column
-6 -4 -2 0 2 4 6
-100
010
0
Trans Disp (in)
Tran
s C
ol B
ase
She
ar (k
ip)
Long Disp (cm)
Long
Col
Bas
e S
hear
(kN
)-20 -10 0 10 20-8
00-2
0040
0
-6 -4 -2 0 2 4 6
-100
010
0
Long Disp (in)
Long
l Col
Bas
e S
hear
(kip
)
Figure 6.3-3 South Bent, Center Column: Hysteresis Curves for Bridge 5/649E; Peru 975 EQ; Es=287.3 MPa (6000 ksf); 861.9 MPa (18000 ksf)
96

Transverse Displacement (cm)Tran
s C
ol B
ase
She
ar (k
N)
-20 -10 0 10 20-100
00
500
Kobe 975 EQ - Fixed/rollerSouth Bent, Middle Column
-6 -4 -2 0 2 4 6
-200
010
0
Transverse Displacement (in)
Tran
s C
ol B
ase
She
ar (k
ip)
Longitudinal Displacement (cm)
Long
Col
Bas
e S
hear
(kN
)
-20 -10 0 10 20-100
00
500
-6 -4 -2 0 2 4 6
-200
010
0
Longitudinal Displacement (in)
Long
Col
Bas
e S
hear
(kip
)
Transverse Displacement (cm)Tran
s C
ol B
ase
She
ar (k
N)
-20 -10 0 10 20-100
00
500
Mexico City 975 EQ - Fixed/rollerSouth Bent, Middle Column
-6 -4 -2 0 2 4 6
-200
010
0
Transverse Displacement (in)
Tran
s C
ol B
ase
She
ar (k
ip)
Longitudinal Displacement (cm)
Long
Col
Bas
e S
hear
(kN
)
-20 -10 0 10 20-100
00
500
-6 -4 -2 0 2 4 6
-200
010
0
Longitudinal Displacement (in)
Long
Col
Bas
e S
hear
(kip
)
Transverse Displacement (cm)Tran
s C
ol B
ase
She
ar (k
N)
-20 -10 0 10 20-100
00
500
Olympia 975 EQ - Fixed/rollerSouth Bent, Middle Column
-6 -4 -2 0 2 4 6
-200
010
0
Transverse Displacement (in)
Tran
s C
ol B
ase
She
ar (k
ip)
Longitudinal Displacement (cm)
Long
Col
Bas
e S
hear
(kN
)
-20 -10 0 10 20-100
00
500
-6 -4 -2 0 2 4 6
-200
010
0
Longitudinal Displacement (in)
Long
Col
Bas
e S
hear
(kip
)
Transverse Displacement (cm)Tran
s C
ol B
ase
She
ar (k
N)
-20 -10 0 10 20-100
00
500
Chile 2475 EQ - Fixed/rollerSouth Bent, Middle Column
-6 -4 -2 0 2 4 6
-200
010
0
Transverse Displacement (in)
Tran
s C
ol B
ase
She
ar (k
ip)
Longitudinal Displacement (cm)
Long
Col
Bas
e S
hear
(kN
)
-20 -10 0 10 20-100
00
500
-6 -4 -2 0 2 4 6-2
000
100
Longitudinal Displacement (in)
Long
Col
Bas
e S
hear
(kip
)
Transverse Displacement (cm)Tran
s C
ol B
ase
Shea
r (kN
)
-20 -10 0 10 20-100
00
500
Peru 2475 EQ - Fixed/rollerSouth Bent, Middle Column
-6 -4 -2 0 2 4 6
-200
010
0
Transverse Displacement (in)
Tran
s C
ol B
ase
Shea
r (ki
p)
Longitudinal Displacement (cm)
Long
Col
Bas
e Sh
ear (
kN)
-20 -10 0 10 20-100
00
500
-6 -4 -2 0 2 4 6
-200
010
0
Longitudinal Displacement (in)
Long
Col
Bas
e Sh
ear (
kip)
Figure 6.3-4 South Bent, Center Column: Hysteresis Curves for Bridge 5/649 E; Kobe 975 EQ, Mexico City 975 EQ, Olympia 975 EQ, Chile 2475 EQ and Peru 2475 EQ; Fixed Column Base/Roller
Abutment Boundary Conditions
97

Trans Disp (cm)Tran
s C
ol B
ase
She
ar (k
N)
-15 -10 -5 0 5 10 15-600
040
0
Es - 287.3 MPaSouth Bent, Middle Column
-4 -2 0 2 4
-100
050
Trans Disp (in)
Tran
s C
ol B
ase
She
ar (k
ip)
Long Disp (cm)
Long
Col
Bas
e S
hear
(kN
)
-15 -10 -5 0 5 10 15-600
040
0
-4 -2 0 2 4
-100
050
Long Disp (in)
Long
l Col
Bas
e S
hear
(kip
)
Trans Disp (cm)Tran
s C
ol B
ase
She
ar (k
N)
-15 -10 -5 0 5 10 15-600
040
0
Es - 861.9 MPaSouth Bent, Middle Column
-4 -2 0 2 4
-100
050
Trans Disp (in)
Tran
s C
ol B
ase
She
ar (k
ip)
Long Disp (cm)
Long
Col
Bas
e S
hear
(kN
)-15 -10 -5 0 5 10 15-6
000
400
-4 -2 0 2 4
-100
050
Long Disp (in)
Long
l Col
Bas
e S
hear
(kip
)
Figure 6.3-5 South Bent, Center Column: Hysteresis Curves for Bridge 5/649E; Kobe 975 EQ; Es=287.3 MPa (6000 ksf); 861.9 MPa (18000 ksf)
Trans Disp (cm)Tran
s C
ol B
ase
She
ar (k
N)
-15 -10 -5 0 5 10 15-600
040
0
Es - 287.3 MPaSouth Bent, Middle Column
-4 -2 0 2 4
-100
050
Trans Disp (in)
Tran
s C
ol B
ase
She
ar (k
ip)
Long Disp (cm)
Long
Col
Bas
e S
hear
(kN
)
-15 -10 -5 0 5 10 15-600
040
0
-4 -2 0 2 4
-100
050
Long Disp (in)
Long
l Col
Bas
e S
hear
(kip
)
Trans Disp (cm)Tran
s C
ol B
ase
She
ar (k
N)
-15 -10 -5 0 5 10 15-600
040
0
Es - 861.9 MPaSouth Bent, Middle Column
-4 -2 0 2 4
-100
050
Trans Disp (in)
Tran
s C
ol B
ase
She
ar (k
ip)
Long Disp (cm)
Long
Col
Bas
e S
hear
(kN
)
-15 -10 -5 0 5 10 15-600
040
0
-4 -2 0 2 4
-100
050
Long Disp (in)
Long
l Col
Bas
e S
hear
(kip
)
Figure 6.3-6 South Bent, Center Column: Hysteresis Curves for Bridge 5/649E; Mexico City 975 EQ; Es=287.3 MPa (6000 ksf); 861.9 MPa (18000 ksf)
98

Trans Disp (cm)Tran
s C
ol B
ase
She
ar (k
N)
-20 -10 0 10 20-800
-200
400
Es - 287.3 MPaSouth Bent, Middle Column
-6 -4 -2 0 2 4 6
-100
010
0
Trans Disp (in)
Tran
s C
ol B
ase
She
ar (k
ip)
Long Disp (cm)
Long
Col
Bas
e S
hear
(kN
)
-20 -10 0 10 20-800
-200
400
-6 -4 -2 0 2 4 6
-100
010
0
Long Disp (in)
Long
l Col
Bas
e S
hear
(kip
)
Trans Disp (cm)Tran
s C
ol B
ase
She
ar (k
N)
-20 -10 0 10 20-800
-200
400
Es - 861.9 MPaSouth Bent, Middle Column
-6 -4 -2 0 2 4 6
-100
010
0
Trans Disp (in)
Tran
s C
ol B
ase
She
ar (k
ip)
Long Disp (cm)
Long
Col
Bas
e S
hear
(kN
)-20 -10 0 10 20-8
00-2
0040
0
-6 -4 -2 0 2 4 6
-100
010
0
Long Disp (in)
Long
l Col
Bas
e S
hear
(kip
)
Figure 6.3-7 South Bent, Center Column: Hysteresis Curves for Bridge 5/649E; Olympia 975 EQ; Es=287.3 MPa (6000 ksf); 861.9 MPa (18000 ksf)
Trans Disp (cm)Tran
s C
ol B
ase
She
ar (k
N)
-20 -10 0 10 20-800
-200
400
Es - 287.3 MPaSouth Bent, Middle Column
-6 -4 -2 0 2 4 6
-100
010
0
Trans Disp (in)
Tran
s C
ol B
ase
She
ar (k
ip)
Long Disp (cm)
Long
Col
Bas
e S
hear
(kN
)
-20 -10 0 10 20-800
-200
400
-6 -4 -2 0 2 4 6
-100
010
0
Long Disp (in)
Long
l Col
Bas
e S
hear
(kip
)
Trans Disp (cm)Tran
s C
ol B
ase
She
ar (k
N)
-20 -10 0 10 20-800
-200
400
Es - 861.9 MPaSouth Bent, Middle Column
-6 -4 -2 0 2 4 6
-100
010
0
Trans Disp (in)
Tran
s C
ol B
ase
She
ar (k
ip)
Long Disp (cm)
Long
Col
Bas
e S
hear
(kN
)
-20 -10 0 10 20-800
-200
400
-6 -4 -2 0 2 4 6
-100
010
0
Long Disp (in)
Long
l Col
Bas
e S
hear
(kip
)
Figure 6.3-8 South Bent, Center Column: Hysteresis Curves for Bridge 5/649E; Chile 2475 EQ; Es=287.3 MPa (6000 ksf); 861.9 MPa (18000 ksf)
99

Trans Disp (cm)Tran
s C
ol B
ase
She
ar (k
N)
-20 -10 0 10 20-800
-200
400
Es - 287.3 MPaSouth Bent, Middle Column
-6 -4 -2 0 2 4 6
-100
010
0
Trans Disp (in)
Tran
s C
ol B
ase
She
ar (k
ip)
Long Disp (cm)
Long
Col
Bas
e S
hear
(kN
)
-20 -10 0 10 20-800
-200
400
-6 -4 -2 0 2 4 6
-100
010
0
Long Disp (in)
Long
l Col
Bas
e S
hear
(kip
)
Trans Disp (cm)Tran
s C
ol B
ase
She
ar (k
N)
-20 -10 0 10 20-800
-200
400
Es - 861.9 MPaSouth Bent, Middle Column
-6 -4 -2 0 2 4 6
-100
010
0
Trans Disp (in)
Tran
s C
ol B
ase
She
ar (k
ip)
Long Disp (cm)
Long
Col
Bas
e S
hear
(kN
)-20 -10 0 10 20-8
00-2
0040
0
-6 -4 -2 0 2 4 6
-100
010
0
Long Disp (in)
Long
l Col
Bas
e S
hear
(kip
)
Figure 6.3-9 South Bent, Center Column: Hysteresis Curves for Bridge 5/649E; Peru 2475 EQ; Es=287.3 MPa (6000 ksf); 861.9 MPa (18000 ksf)
The hysteresis curves show that column shear failure is likely to occur under the
Chile 2475 earthquake for the 861.9 MPa elastic modulus value model, and comes close
to failure for the other boundary conditions under the Chile 2475 earthquake as well as all
models under the Peru 2475 earthquake. The hysteresis curves all have similar shapes
with larger demands in the transverse direction than in the longitudinal direction.
Displacement time-histories for the Peru 2475 earthquake are shown in figures
6.3-10 and 6.3-11 below. A half cycle occurred at a ductility value almost reaching 4∆y
indicating that moderate spalling in the hinging region is expected.. In addition, the
proximity of the force/displacement hysteresis curves to the column shear capacity
envelope highlights the probability of column failure.
100

Time (s)
Tran
s D
isp(
cm)
0 20 40 60 80
-15
-10
-50
510
15
3
Figure 6.3-10 South Bent, Center Column: Displacement Time History for Bridge 5EQ; Es=287.3 MPa
Time (s)
Tran
s D
isp(
cm)
0 20 40 60 80
-15
-10
-50
510
15
Figure 6.3-11 South Bent, Center Column: Displacement Time History Bridge 5/6EQ; Es=861.9 MPa
The shear force demands in the girder webs at the abutments and
footings were investigated for this bridge. The abutments and intermed
101
4∆y
3∆y2
1.5∆y1in
)
∆y100
-3-2
-10
Tran
s D
isp
(
/649E; Peru 2475
3
4∆y 3∆y2
1.5∆y1 (i
n)
∆y100
-3-2
-10
Tran
s D
isp
49E; Peru 2475
in the column
iate bents were

built with girder stops on both sides of the I-girders; reducing the transverse force
significantly in each girder stop compared to the other two bridges. Therefore, the shear
accumulated in each girder web was low and shear failure of the I-girders was not
predicted.
The maximum shear force in the column footings was reached for the Chile 2475
earthquake. The shear force demand value was 632 kN (142 kips) in the longitudinal
direction and 452 kN (102 kips) in the transverse direction. The shear capacity of the
footing is 1876 kN (422 kips) in both directions. Shear failure was not predicted in the
column footings or at the abutments. In addition, column/footing joint failure was not
investigated here due to the significantly low shear force demands in the footings.
102
CHAPTER SEVEN
CONCLUSIONS
Recent geological evidence indicates that the potential exists for large earthquakes
in the Pacific Northwest as a result of rupturing of the locked interface between the Juan
de Fuca and the North American Plate, resulting in long-duration ground motions. To
investigate bridge response to long-duration motions, three multi-column bent prestressed
concrete bridges, with columns expected to behave primarily in shear, were selected in
consultation with the Washington State Department of Transportation (WSDOT). Each
bridge is characteristic of pre-1975 WSDOT design specifications and is located in close
proximity to Olympia or Seattle. Nonlinear time history analyses were performed using
the finite element analysis program, RUAUMOKO 3D, to assess the seismic
vulnerability of the bridges. Ten earthquake excitations, six long-duration (Mexico City,
Mexico (1985), Lloledo, Chile (1985) and Moquegua, Peru (2001)) and four short
duration (Olympia, Washington (1949) and Kobe, Japan (1995)) were modified to fit a
target acceleration spectrum for the Seattle area. As a point of reference, the 2001
Nisqually (M=6.8) earthquake was estimated to have a return period between 475 and
2475 years depending on the location in the Puget Sound region and the structure period
of interest.
In general, the three bridges experienced light cracking in the column plastic
hinge regions under the 475-year return period earthquakes. The 975-year return period
earthquakes increased the column damage. In addition, pounding of the expansion joints
103

led to bearing pad failures. Failure of the columns in the center bents of all bridges was
predicted by the hysteretic analyses under the 2475-year return period earthquakes,
however, displacement time-histories showed that only a small number of cycles reached
a ductility level that could lead to failure. For Bridge 5/227, damage was expected to be
more significant than for the other two bridges due to a larger number of high-ductility-
demand cycles. The damage estimations were based on damage recorded in experimental
column testing (Jaradat, 1996).
The column aspect ratios ranged from 2.7 - 3.2 for Bridge 5/649 to 3.4 for Bridge
512/19 to 3 - 3.2 for Bridge 5/227. The largest displacement demands occurred in Bridges
512/19 and 5/649; the lowest displacement demands occurred in Bridge 5/227. The shear
demands in the columns were highest for Bridge 5/649 and lowest for Bridge 5/227.
Since the column aspect ratios were similar for the three bridges, other bridge
characteristics were more influential on the variation of the bridge responses. The bridge
deck design, monolithic or non-monolithic, and the bridge geometry greatly influenced
the bridge responses. Despite the monolithic deck in Bridge 512/19, the transverse
displacement demands were high, especially in the center bent, due to the large
longitudinal stiffness of the bridge. Each bridge was unique enough in geometry and
design that in order to accurately assess the bridge seismic vulnerability, nonlinear time
history analyses were needed rather than basing predictions merely on bridge member
detailing, as is often the case due to limited resources.
Shear force demands in the column footings was investigated in this research for
all three bridges. It was predicted by the analyses that the footings would not fail in shear.
However, studies have shown that the joint shear strength was often a cause of brittle
104

failure in the column/footing connection (McLean, 1999). Due to the significantly low
shear forces in the column footings, this failure mode was not investigated in this
research but should however be taken into consideration as a potential governing failure
mode for future studies.
Modeling the soil-structure interaction was necessary to obtain realistic results
and to accurately predict the behavior of the bridges. The trends in the displacement and
shear force demands varied with each bridge as the soil-structure-interaction parameters
varied. However, the global seismic assessment of the bridges was not altered due to
variation in the soil-structure-interaction. Conversely, a significant difference in behavior
occurred when the footing and abutment soil-structure-interaction conditions were
changed from spring boundary conditions to fixed column base and roller abutment
boundary conditions. Displacement and force demands changed for all three bridges,
leading to inaccurate results that were either overly conservative or unconservative.
The effect of a 45 degree skew on the overall behavior of bridge 5/649 was also
investigated. There was a change of approximately 20% in the displacement and 40% in
the shear force demands between the skew and non-skew models. The rest of the bridge
response variables did not vary as significantly. Overall, the skew had a large enough
effect on the bridge response that it needed to be considered in the modeling process.
This particular study was based on the behavior of one bridge. Expanding the study to
several bridges with different skew angles is needed to generalize the results and
conclusions.
Overall, long-duration earthquakes created more damage in the three bridges than
short-duration earthquakes. For the smaller earthquakes, the duration had little effect on
105

the bridge response since multiple cycles at low ductility demands did not lead to damage
of the columns. Without significant ductility demands, the duration of the earthquake was
of little significance. As the intensity of the earthquake increases, the duration tends to
increase as well. Therefore, both earthquake intensity and ground motion duration affect
the bridge response; however, large intensity alone can lead to significant demand on the
bridges, while duration is not influential on the bridge demand unless the intensity is high
as well.
106

REFERENCES
Abrahamson, N. and Silva, W.J, (1996) “Empirical Ground Motion Models”.
Draft Report Prepared for Brookhaven National Laboratory.
Bozorgnia, Y., Bertero, V. (2003). “Damage Spectra: Characteristics and
Applications to Seismic Risk Reduction”. Journal of Structural Engineering, ASCE, Vol.
129, No. 10, 1330-1340.
Cox, C.J. (2005). “Seismic Assessment and Retrofit of Existing Multi-Column
Bent Bridges”. Masters Thesis, Washington State University.
Dobry, R., Idriss, I. M., and NG, E. (1978). “Duration Characteristics of
Horizontal Components of Strong-Motion Earthquake Records.” Bulletin of the
Seismology Society of America, Vol. 68, No. 5, 1487-1520.
Housner, G. W. (1975). “Measures of severity of earthquake ground shaking”,
Proc. Natl. Conf. Earthquake Engineering, Ann Harbor, Michigan.
Jeong, G.D., and Iwan, W.D. (1988) “Effect of Earthquake Duration on the
Damage of Structures.” Earthquake Engineering and Structural Dynamics, Vol. 16, No.
8, 1201-1211.
Jaradat, O.A. (1996). “Seismic Evaluation of Existing Bridge Columns”. PhD
Dissertation, Washington State University.
Kowalsky, M.J., Priestley, M.J.N. (2000). “Improved Analytical Model for Shear
Strength of Circular Reinforced Concrete Columns in Seismic Regions.” ACI Structural
Journal, 97 (3), 388-397.
Lindt, J.W., Goh, G. (2004). “Earthquake Duration Effect on Structural
Reliability.” Journal of Structural Engineering, ASCE, Vol. 129, No.5, 821-826.
107

McLean, D.I., Marsh, M.L. (1999) “Seismic Retrofitting of Bridge Foundations.”
ACI Structural Journal, 96 (2), 174-182.
PanGEO Incorporated, geotechnical and earthquake engineering consultant firm
in Seattle, WA. Information online at: http://pangeoinc.com/
PNSN (2005). “Deep Quakes in Washington and Oregon”. Pacific Northwest
Seismograph Network, University of Washington. Accessed online at:
http://www.pnsn.org//INFO_GENERAL/platecontours.html
Priestley, M.J.N, Seible, F., Calvi, G.M (1996). Seismic Design and Retrofit of
Bridges. New York. John Wiley & Sons.
Priestley, M.J.N (2003). “Myths and Fallacies in Earthquake Engineering,
Revisited.” The Mallet Milne Lecture. Rose School, Pavia, Italy.
Stapleton, S.E. (2004) “Performance of Poorly Confined Reinforced Concrete
Columns in Long-Duration Earthquakes.” Masters Thesis, Washington State University.
Williamson, E. B. (2003). “Evaluation of Damages and P-Delta Effects for
Systems under Earthquake Excitation.” Journal of Structural Engineering, ASCE, Vol.
129, No. 8, 1036-1046.
Youngs, R.R., Chiou, S.J., Silva, W.J. and Humphrey, J.R. (1997). “Strong
Ground Motion Attenuation Relationships for Subduction Zone Earthquakes”.
Seismological Research Letter, 68 (1), 58-73.
108

APPENDICES

APPENDIX A-1
Bridge 5/227 – inner column, center bent:
Scaling from Experimental Data to Model:
DmodDex
3 LexLmod
⋅ 14.617=FmodDmodDex
3 LexLmod
⋅ Fex⋅
FmodMmodLmod
DmodDex
3 MexLmod
⋅Therefore
MmodDmodDex
3
Mex⋅
MmodDmodDex
3
As.ex⋅ fy⋅ Dexa2
−
⋅MmodDmodDex
2
As.ex⋅ fy⋅DmodDex
Dexa2
−
⋅
Dmoda2
−DmodDex
Dexa2
−
As.modDmodDex
2
As.ex⋅
Mmod As.mod fy⋅ Dmoda2
−
⋅with FmodMmodLmod
Mex As.ex fy⋅ Dexa2
−
⋅with FexMexLex
Forces and moments:
Dmod 3:=Lmod
18.622
:=LmodDmod
amodaspect ratio of model:
LexDex
aexaspect ratio of exp: Dex1012
:=Lex7024
:=
110

Lpmod Dex⋅ Lmod ft⋅Lpex
2−
⋅
Lpex Dmod⋅ Lex ft⋅Lpmod
2−
⋅
3.596=ratios for ∆p:
Lmod ft⋅Lpex
2−
Lex ft⋅Lpmod
2−
4.186=ratio :
Lmod ft⋅Lpmod
2−
102.712in=
Lpmod 18.016in=Lpmod 0.08 Lmod⋅ ft⋅ 0.15 53.8⋅98
⋅ in⋅+:=Model :
Lex ft⋅Lpex
2−
32.087in=
Lpex 5.826in=Lpex 0.08 Lex⋅ ft⋅ 0.15 53.8⋅38
⋅ in⋅+:=Test :
Lp 0.08L2
⋅ 0.022 fy⋅ db⋅+Lp 0.08L2
⋅ 0.15 fy⋅ db⋅+
∆pMuMn
1−
∆y⋅ Lp φu φy−( )⋅ L
Lp2
−
⋅+
DexDmod
Lmod2
Lex2
⋅ 2.83=∆y.mod
DexDmod
Lmod2
Lex2
⋅ ∆y.ex⋅
and φy.mod 2.25εy
Dmod⋅φy.ex 2.25
εyDex
⋅
φy.mod φy.exDex
Dmod⋅
∆y.modφy.mod Lmod
2⋅
3∆y.ex
φy.ex Lex2
⋅
3
Lmod18.62
2:=Use the actual clear height of the column for the scaling of the displacements.
Displacements:
111

Finally, to scale displacements, use :
∆ ∆y≤ ∆mod 2.83 ∆ex⋅
∆ ∆y≥ ∆mod 2.83 ∆yex⋅ 3.596 ∆ex ∆yex−( )⋅+
Axial load:
PmodDmodDex
2
Pex⋅ DmodDex
2
12.96=
Appendix A-1 Scaling calculations for the center column, center bent of Bridge 5/227.
112

APPENDIX A-2
Bridge 5/227- Center column - Center bent
0.00
20.00
40.00
60.00
80.00
100.00
120.00
0.00 2.00 4.00 6.00 8.00 10.00 12.00
Disp (in)
Forc
e (k
ip)
-50.00
50.00
150.00
250.00
350.00
450.00
550.000.00 5.00 10.00 15.00 20.00 25.00 30.00
Disp (cm)
Forc
e (k
N)
Raumoko - blind Scaled Jaradat Raumoko - adjusted Raumoko - blind with strain penetration
Appendix A-2 Model of the center column, center bent of Bridge 5/227 fitted to Jaradat T2 specimen scaled up and blind model without adjustments to fit T2.

A-2-1 Ruaumoko 3D Input File Calculations
Ruaumoko 3D is an “Inelastic Dynamic Analysis” software developed by Carr at
the University of Canterbury, New Zealand in October 2004. The input file can be
divided into six parts.
o Input parameters: These define the analysis options (Pushover, time-history), the
control parameters (number of nodes, elements…), the iteration parameters
(duration of analysis, time-step).
o The nodes: This is where the geometry of the structure is defined: the lengths of
each element through nodal coordinates and boundary conditions.
o The elements: This is where the elements are defined by using the nodes
determined in the previous section, the member property each element refers to
and their orientation in space.
o Member properties: Ruaumoko 3D can model several different types of elements
(frame, spring, tendon, masonry…). In this section, each specific property of the
member is defined: inertia, cross-sectional area, weight. Also, for a frame member
for example, the P-M interaction values must be defined, the plastic hinge lengths
and a loss model can be input to account for a particular strength degradation
behavior.
o The weights and loads on the structure for each node.
o The excitation: Ruaumoko 3D can run earthquakes as a separate text files with
accelerations and time or a standard pushover loading can also be input.
Below are examples of input files for all three bridges.
114

A-2-1 Bridge 5/227 Ruaumoko Input File
227 BRIDGE MODEL; k-ft; Es=6000 ksf=287.3 MPa; Peru 2 1 0 1 3 2 0 0 ! Analysis Options 1 0 0 0 1 0 0 0 1 ! EQ Trans. (Mode Shapes for 95% Mass Part.) 77 81 29 30 1 30 32.2 5 5 0.01 92 1.0 ! Frame Control Par 0 10 10 10 1 1 1 1 ! Output Control -.866 .866 0 .5 .5 1 ! Plot Axes Tran 10 0 0.001 ! Iteration Control NODES 1 1 0 -96.250 0 0 0 0 0 0 0 ! West Ramp 2 0 -88.792 0 0 0 0 0 0 0 ! West Ramp 3 0 -81.333 0 0 0 0 0 0 0 ! West Ramp 4 0 -73.875 0 0 0 0 0 0 0 ! West Ramp 5 0 -66.417 0 0 0 0 0 0 0 ! West Ramp 6 0 -58.958 0 0 0 0 0 0 0 ! West Ramp 7 0 -51.5417 0 0 0 0 0 0 0 ! West Pier Gap (W) 8 0 -51.4583 0 0 0 0 0 0 0 ! West Pier Gap (E) 9 0 -42.917 0 0 0 0 0 0 0 ! West Deck 10 0 -34.333 0 0 0 0 0 0 0 ! West Deck 11 0 -25.750 0 0 0 0 0 0 0 ! West Deck 12 0 -17.167 0 0 0 0 0 0 0 ! West Deck 13 0 -8.583 0 0 0 0 0 0 0 ! West Deck 14 0 -0.0417 0 0 0 0 0 0 0 ! Cntr Pier Gap (W) 15 0 0.0417 0 0 0 0 0 0 0 ! Cntr Pier Gap (E) 16 0 7.250 0 0 0 0 0 0 0 ! East Deck 17 0 14.500 0 0 0 0 0 0 0 ! East Deck 18 0 21.75 0 0 0 0 0 0 0 ! East Deck 19 0 29.00 0 0 0 0 0 0 0 ! East Deck 20 0 36.25 0 0 0 0 0 0 0 ! East Deck 21 0 43.4583 0 0 0 0 0 0 0 ! East Pier Gap (W) 22 0 43.5417 0 0 0 0 0 0 0 ! East Pier Gap (E) 23 0 50.959 0 0 0 0 0 0 0 ! East Ramp 24 0 58.417 0 0 0 0 0 0 0 ! East Ramp 25 0 65.875 0 0 0 0 0 0 0 ! East Ramp 26 0 73.333 0 0 0 0 0 0 0 ! East Ramp 27 0 80.792 0 0 0 0 0 0 0 ! East Ramp 28 0 88.25 0 0 0 0 0 0 0 ! East Ramp 29 -15.583 -51.500 -2.53 2 2 2 0 0 0 39 ! West Col Top (S) (slaved) 30 0 -51.500 -2.53 2 2 2 0 0 0 40 ! West Col Top (C) (slaved) 31 15.583 -51.500 -2.53 2 2 2 0 0 0 41 ! West Col Top (N) (slaved) 32 -15.583 0 -2.53 2 2 2 0 0 0 42 ! Cntr Col Top (S) (slaved) 33 0 0 -2.53 2 2 2 0 0 0 43 ! Cntr Col Top (C) (slaved) 34 15.583 0 -2.53 2 2 2 0 0 0 44 ! Cntr Col Top (N) (slaved)
115

35 -15.583 43.500 -2.53 2 2 2 0 0 0 45 ! East Col Top (S) (slaved) 36 0 43.500 -2.53 2 2 2 0 0 0 46 ! East Col Top (C) (slaved) 37 15.583 43.500 -2.53 2 2 2 0 0 0 47 ! East Col Top (N) (slaved) 38 0 -96.333 0 0 0 0 0 0 0 ! West Abut Gap Node 39 -15.583 -51.500 0 0 0 0 0 0 0 ! West Pier X-beam (S) 40 0 -51.500 0 0 0 0 0 0 0 ! West Pier X-beam (C) 41 15.583 -51.500 0 0 0 0 0 0 0 ! West Pier X-beam (N) 42 -15.583 0 0 0 0 0 0 0 0 ! Cntr Pier X-beam (S) 43 0 0 0 0 0 0 0 0 0 ! Cntr Pier X-beam (C) 44 15.583 0 0 0 0 0 0 0 0 ! Cntr Pier X-beam (N) 45 -15.583 43.500 0 0 0 0 0 0 0 ! East Pier X-beam (S) 46 0 43.500 0 0 0 0 0 0 0 ! East Pier X-beam (C) 47 15.583 43.500 0 0 0 0 0 0 0 ! East Pier X-beam (N) 48 0 88.333 0 0 0 0 0 0 0 ! East Abut Gap Node 49 -15.583 -51.500 -21.95 0 0 0 0 0 0 ! West Col bottom (S) 50 0 -51.500 -21.45 0 0 0 0 0 0 ! West Col bottom (C) 51 15.583 -51.500 -21.95 0 0 0 0 0 0 ! West Col bottom (N) 52 -15.583 0 -21.65 0 0 0 0 0 0 ! Cntr Col bottom (S) 53 0 0 -21.15 0 0 0 0 0 0 ! Cntr Col bottom (C) 54 15.583 0 -21.65 0 0 0 0 0 0 ! Cntr Col bottom (N) 55 -15.583 43.500 -20.67 0 0 0 0 0 0 ! East Col bottom (S) 56 0 43.500 -20.17 0 0 0 0 0 0 ! East Col bottom (C) 57 15.583 43.500 -20.67 0 0 0 0 0 0 ! East Col bottom (N) 58 0 -96.333 0 1 1 1 1 1 1 ! West Abutment Spring 59 -15.583 -51.500 -23.95 1 1 1 1 1 1 ! West Col Spring (S) 60 0 -51.500 -23.45 1 1 1 1 1 1 ! West Col Spring (C) 61 15.583 -51.500 -23.95 1 1 1 1 1 1 ! West Col Spring (N) 62 -15.583 0 -23.65 1 1 1 1 1 1 ! Cntr Col Spring (S) 63 0 0 -23.15 1 1 1 1 1 1 ! Cntr Col Spring (C) 64 15.583 0 -23.65 1 1 1 1 1 1 ! Cntr Col Spring (N) 65 -15.583 43.500 -22.67 1 1 1 1 1 1 ! East Col Spring (S) 66 0 43.500 -22.17 1 1 1 1 1 1 ! East Col Spring (C) 67 15.583 43.500 -22.67 1 1 1 1 1 1 ! East Col Spring (N) 68 0 88.333 0 1 1 1 1 1 1 ! East Abutment Spring 69 -15.583 -51.500 -23.95 0 0 0 0 0 0 ! West Col FDN (S) 70 0 -51.500 -23.45 0 0 0 0 0 0 ! West Col FDN (C) 71 15.583 -51.500 -23.95 0 0 0 0 0 0 ! West Col FDN (N) 72 -15.583 0 -23.65 0 0 0 0 0 0 ! Cntr Col FDN (S) 73 0 0 -23.15 0 0 0 0 0 0 ! Cntr Col FDN (C) 74 15.583 0 -23.65 0 0 0 0 0 0 ! Cntr Col FDN (N) 75 -15.583 43.500 -22.67 0 0 0 0 0 0 ! East Col FDN (S) 76 0 43.500 -22.17 0 0 0 0 0 0 ! East Col FDN (C) 77 15.583 43.500 -22.67 0 0 0 0 0 0 ! East Col FDN (N) ELEMENTS 1 1 2 1 2 0 0 X ! Long Links: Western Ramp 2 1 2 3 0 0 X 3 1 3 4 0 0 X 4 1 4 5 0 0 X 5 1 5 6 0 0 X 6 3 6 7 0 0 X 7 5 8 9 0 0 X ! Long Links: Western Deck 8 4 9 10 0 0 X 9 4 10 11 0 0 X
116

10 4 11 12 0 0 X 11 4 12 13 0 0 X 12 6 13 14 0 0 X 13 8 15 16 0 0 X ! Long Links: Eastern Deck 14 7 16 17 0 0 X 15 7 17 18 0 0 X 16 7 18 19 0 0 X 17 7 19 20 0 0 X 18 9 20 21 0 0 X 19 2 22 23 0 0 X ! Long Links: Eastern Ramp 20 1 23 24 0 0 X 21 1 24 25 0 0 X 22 1 25 26 0 0 X 23 1 26 27 0 0 X 24 3 27 28 0 0 X 25 10 39 29 0 0 Y ! West Bent Vertical (S) 26 10 40 30 0 0 Y ! (C) 27 10 41 31 0 0 Y ! (N) 28 10 42 32 0 0 Y ! Cntr Bent Vertical (S) 29 10 43 33 0 0 Y ! (C) 30 10 44 34 0 0 Y ! (N) 31 10 45 35 0 0 Y ! East Bent Vertical (S) 32 10 46 36 0 0 Y ! (C) 33 10 47 37 0 0 Y ! (N) 34 11 39 40 0 0 Y ! West Bent Transverse (S) 35 11 40 41 0 0 Y ! (N) 36 12 42 43 0 0 Y ! Cntr Bent Transverse (S) 37 12 43 44 0 0 Y ! (N) 38 13 45 46 0 0 Y ! Cntr Bent Transverse (S) 39 13 46 47 0 0 Y ! (N) 40 14 29 49 0 0 Y ! West Column (S) 41 15 30 50 0 0 Y ! (C) 42 14 31 51 0 0 Y ! (N) 43 16 32 52 0 0 Y ! Cntr Column (S) 44 17 33 53 0 0 Y ! (C) 45 16 34 54 0 0 Y ! (N) 46 18 35 55 0 0 Y ! East Column (S) 47 19 36 56 0 0 Y ! (C) 48 18 37 57 0 0 Y ! (N) 49 20 38 1 0 0 X ! West Abutment Bearing Pad 50 20 7 40 0 0 X ! West Bearing Pad (W) 51 20 40 8 0 0 X ! (E) 52 20 14 43 0 0 X ! Cntr Bearing Pad (W) 53 20 43 15 0 0 X ! (E) 54 20 21 46 0 0 X ! East Bearing Pad (W) 55 20 46 22 0 0 X ! (E) 56 20 28 48 0 0 X ! East Abutment Bearing Pad 57 21 38 1 0 0 X ! West Abutment Gap 58 21 7 8 0 0 X ! West Gap 59 21 14 15 0 0 X ! Cntr Gap 60 21 21 22 0 0 X ! East Gap 61 21 28 48 0 0 X ! East Abutment Gap 62 22 59 69 0 0 X ! West PIER Spring (South) 63 23 60 70 0 0 X ! West PIER Spring (Center) 64 22 61 71 0 0 X ! West PIER Spring (North) 65 24 62 72 0 0 X ! Cntr PIER Spring (South) 66 25 63 73 0 0 X ! Cntr PIER Spring (Center)
117

67 24 64 74 0 0 X ! Cntr PIER Spring (North) 68 26 65 75 0 0 X ! East PIER Spring (South) 69 27 66 76 0 0 X ! East PIER Spring (Center) 70 26 67 77 0 0 X ! East PIER Spring (North) 71 28 38 58 0 0 X ! West Abut Spring 1 72 29 48 68 0 0 X ! East Abut Spring 5 73 11 49 69 0 0 Y ! West Col FDN (S) 74 11 50 70 0 0 Y ! (C) 75 11 51 71 0 0 Y ! (N) 76 12 52 72 0 0 Y ! Cntr Col FDN (S) 77 12 53 73 0 0 Y ! (C) 78 12 54 74 0 0 Y ! (N) 79 13 55 75 0 0 Y ! East Col FDN (S) 80 13 56 76 0 0 Y ! (C) 81 13 57 77 0 0 Y ! (N) PROPS 1 FRAME ! Longitudinal Deck Beams (west & east ramp) 1 0 0 0 0 0 0 ! 6.358E5 2.54E5 33.54 3161 40.401 3161 33.54 33.54 ! E,G,A,J,Izz,Ixx,Asz,Asy (K,FT) 0.0 ! End Properties 2 FRAME ! Longitudinal Deck Beams (west & east ramp) 1 1 1 0 0 0 0 ! Moment releases 6.358E5 2.54E5 33.54 3161 40.401 3161 33.54 33.54 ! E,G,A,J,Izz,Ixx,Asz,Asy (K,FT) 0.0 ! End Properties 3 FRAME ! Longitudinal Deck Beams (west & east ramp) 1 2 2 0 0 0 0 ! Moment released 6.358E5 2.54E5 33.54 3161 40.401 3161 33.54 33.54 ! E,G,A,J,Izz,Ixx,Asz,Asy (K,FT) 0.0 ! End Properties 4 FRAME ! Longitudinal Deck Beams (west deck) 1 0 0 0 0 0 0 ! 6.358E5 2.54E5 33.54 3161 40.401 3161 33.54 33.54 ! E,G,A,J,Izz,Ixx,Asz,Asy (K,FT) 0.0 ! End Properties 5 FRAME ! Longitudinal Deck Beams (west deck) 1 1 1 0 0 0 0 0 ! Moment releases 6.358E5 2.54E5 33.54 3161 40.401 3161 33.54 33.54 ! E,G,A,J,Izz,Ixx,Asz,Asy (K,FT) 0.0 ! End Properties 6 FRAME ! Longitudinal Deck Beams (west deck) 1 2 2 0 0 0 0 0 ! Moment releases
118

6.358E5 2.54E5 33.54 3161 40.401 3161 33.54 33.54 ! E,G,A,J,Izz,Ixx,Asz,Asy (K,FT) 0.0 ! End Properties 7 FRAME ! Longitudinal Deck Beams (east deck) 1 0 0 0 0 0 0 ! 6.358E5 2.54E5 33.54 3161 40.401 3161 33.54 33.54 ! E,G,A,J,Izz,Ixx,Asz,Asy (K,FT) 0.0 ! End Properties 8 FRAME ! Longitudinal Deck Beams (east deck) 1 1 1 0 0 0 0 0 ! Moment releases 6.358E5 2.54E5 33.54 3161 40.401 3161 33.54 33.54 ! E,G,A,J,Izz,Ixx,Asz,Asy (K,FT) 0.0 ! End Properties 9 FRAME ! Longitudinal Deck Beams (east deck) 1 2 2 0 0 0 0 0 ! Moment releases 6.358E5 2.54E5 33.54 3161 40.401 3161 33.54 33.54 ! E,G,A,J,Izz,Ixx,Asz,Asy (K,FT) 0.0 ! End Properties 10 FRAME ! Rigid Piers (Vert) 1 0 0 0 0 0 0 0 ! Linear Elastic 1E7 1E7 1E3 1E5 1E3 1E6 1E3 1E3 ! E,G,A,J,Izz,Iyy,Asz,Asy (K,FT) 0 ! 11 FRAME ! West Pier (bent) 1 0 0 0 0 0 0 0 ! Linear Elastic 1E7 1E7 1E3 1E5 1E3 1E6 1E3 1E3 ! E,G,A,J,Izz,Iyy,Asz,Asy (K,FT) 0 ! 12 FRAME ! Cntr Pier (bent) 1 0 0 0 0 0 0 0 ! Linear Elastic 1E7 1E7 1E3 1E5 1E3 1E6 1E3 1E3 ! E,G,A,J,Izz,Iyy,Asz,Asy (K,FT) 0 ! 13 FRAME ! Cntr Pier (bent) 1 0 0 0 0 0 0 0 ! Linear Elastic 1E7 1E7 1E3 1E5 1E3 1E6 1E3 1E3 ! E,G,A,J,Izz,Iyy,Asz,Asy (K,FT) 0 ! 14 FRAME ! West Outer Column 2 0 0 0 4 0 0 0 ! 6.358E5 2.543E5 7.07 1.168 0.826 0.826 7.07 7.07 ! E,G,A,J,Izz,Iyy,Asz,Asy (.22*I) (K,FT) 0.0 0.0 0.0 0.0 ! Ends 0.04 0.04 0.04 0.04 ! r0
119

1.464 1.464 1.464 1.464 ! Plastic Hinge Length 0.0 0.0 1.55 1.0 0.0 ! Interaction -6612 -1575 1790 1790 445.9 ! Yield Forces/Moments ! 4.2 11 0.3 15 ! Refined Loss Model 0.5 0.1 1 1 ! Modified Takeda Hyst. 15 FRAME ! West Inner Column 2 0 0 0 4 0 0 0 ! 6.358E5 2.543E5 7.069 1.167 0.825 0.825 7.07 7.07 ! E,G,A,J,Izz,Iyy,Asz,Asy (.25*I) (K,FT) 0.0 0.0 0.0 0.0 ! Ends 0.04 0.04 0.04 0.04 ! r0 1.444 1.444 1.444 1.444 ! Plastic Hinge Length 0.0 0.0 1.5 1.15 0.0 ! Interaction -6612 -1575 1790 1790 445.9 ! Yield Forces/Moments ! 4.2 11 0.3 15 ! Refined Loss Model 0.5 0.1 1 1 ! Modified Takeda Hyst. 16 FRAME ! Mid Outer Column 2 0 0 0 4 0 0 0 ! 6.358E5 2.543E5 7.069 1.169 0.827 0.827 7.07 7.07 ! E,G,A,J,Izz,Iyy,Asz,Asy (.22*I) (K,FT) 0.0 0.0 0.0 0.0 ! Ends 0.04 0.04 0.04 0.04 ! r0 1.452 1.452 1.452 1.452 ! Plastic Hinge Length 0.0 0.0 1.5 1.15 0.0 ! Interaction -6612 -1575 1790 1790 445.9 ! Yield Forces/Moments ! 4.2 11 0.3 15 ! Refined Loss Model 0.5 0.1 1 1 ! Modified Takeda Hyst. 17 FRAME ! Mid Inner Column 2 0 0 0 4 0 0 0 ! 6.358E5 2.543E5 7.069 1.169 0.827 0.827 7.07 7.07 ! E,G,A,J,Izz,Iyy,Asz,Asy (.25*I) (K,FT) 0.0 0.0 0.0 0.0 ! Ends 0.04 0.04 0.04 0.04 ! r0 1.432 1.432 1.432 1.432 ! Plastic Hinge Length 0.0 0.0 1.5 1.15 0.0 ! Interaction -6612 -1575 1790 1790 445.9 ! Yield Forces/Moments ! 4.2 11 0.3 15 ! Refined Loss Model
120

0.5 0.1 1 1 ! Modified Takeda Hyst. 18 FRAME ! East Outer Column 2 0 0 0 4 0 0 0 ! 6.358E5 2.543E5 7.069 1.169 0.826 0.826 7.07 7.07 ! E,G,A,J,Izz,Iyy,Asz,Asy (.21*I) (K,FT) 0.0 0.0 0.0 0.0 ! Ends 0.04 0.04 0.04 0.04 ! r0 1.393 1.393 1.393 1.393 ! Plastic Hinge Length 0.0 0.0 1.5 1.15 0.0 ! Interaction -6612 -1575 1790 1790 445.9 ! Yield Forces/Moments ! 4.2 11 0.3 15 ! Refined Loss Model 0.5 0.1 1 1 ! Modified Takeda Hyst. 19 FRAME ! East Inner Column 2 0 0 0 4 0 0 0 ! 6.358E5 2.543E5 7.069 1.168 0.826 0.826 7.07 7.07 ! E,G,A,J,Izz,Iyy,Asz,Asy (.23*I) (K,FT) 0.0 0.0 0.0 0.0 ! Ends 0.04 0.04 0.04 0.04 ! r0 1.413 1.413 1.413 1.413 ! Plastic Hinge Length 0.0 0.0 1.5 1.15 0.0 ! Interaction -6612 -1575 1790 1790 445.9 ! Yield Forces/Moments ! 4.2 11 0.3 15 ! Refined Loss Model 0.5 0.1 1 1 ! Modified Takeda Hyst. 20 SPRING ! Bridge Deck Bearing Pads 1 0 0 0 0 0 ! Control Parameters 1479.6 2E7 3E6 8E7 8E4 8E4 0 .3 .3 ! Section Properties 21 MULTISPRING ! Bridge Gap Elements 1 0 0 0 10 2 31 0 ! Control Parameters 3.265E3 0 0 0 0 0 .3 ! Section Properties 0 -9.265E9 0 0 0 0 0 0 0 0 0 ! Section Yield Prop. 22 SPRING ! SOIL SPRING WI 1 0 0 0 0 0 ! Control Par. 1.2177E5 1.2177E5 2.0210E5 5.3777E6 3.7637E6 5.2783E6 0 .33 .33 ! Section Prop.
121

23 SPRING ! SOIL SPRING WO 1 0 0 0 0 0 ! Control Par. 1.2177E5 1.2177E5 2.0210E5 5.3777E6 3.7637E6 5.2783E6 0 .33 .33 ! Section Prop. 24 SPRING ! SOIL SPRING CI 1 0 0 0 0 0 ! Control Par. 1.2177E5 1.2177E5 2.0210E5 5.3777E6 3.7637E6 5.2783E6 0 .33 .33 ! Section Prop. 25 SPRING ! SOIL SPRING CO 1 0 0 0 0 0 ! Control Par. 1.2177E5 1.2177E5 2.0210E5 5.3777E6 3.7637E6 5.2783E6 0 .33 .33 ! Section Prop. 26 SPRING ! SOIL SPRING EI 1 0 0 0 0 0 ! Control Par. 1.2177E5 1.2177E5 2.0210E5 5.3777E6 3.7637E6 5.2783E6 0 .33 .33 ! Section Prop. 27 SPRING ! SOIL SPRING EO 1 0 0 0 0 0 ! Control Par. 1.2177E5 1.2177E5 2.0210E5 5.3777E6 3.7637E6 5.2783E6 0 .33 .33 ! Section Prop. 28 SPRING ! Secant SOIL SPR W abt 1 0 0 0 0 0 ! Control Par. 4.6272E5 4.6580E5 7.1459E5 3.5529E7 4.3135E7 3.74E7 0 .33 .33 ! Section Prop. 29 SPRING ! Secant SOIL SPR E abt 1 0 0 0 0 0 ! Control Par. 4.6272E5 4.6580E5 7.1459E5 3.5529E7 4.3135E7 3.74E7 0 .33 .33 ! Section Prop. WEIGHTS 0 1 17.979 17.979 17.979 ! West Ramp 2 35.958 35.958 35.958 3 35.958 35.958 35.958 4 35.958 35.958 35.958 5 35.958 35.958 35.958 6 35.958 35.958 35.958 7 17.979 17.979 17.979 8 20.73 20.73 20.73 ! West Deck 9 41.46 41.46 41.46 10 41.46 41.46 41.46 11 41.46 41.46 41.46 12 41.46 41.46 41.46 13 41.46 41.46 41.46 14 20.73 20.73 20.73 15 17.496 17.496 17.496 ! East Deck 16 34.993 34.993 34.993 17 34.993 34.993 34.993
122

18 34.993 34.993 34.993 19 34.993 34.993 34.993 20 34.993 34.993 34.993 21 17.496 17.496 17.496 22 17.979 17.979 17.979 ! East Ramp 23 35.958 35.958 35.958 24 35.958 35.958 35.958 25 35.958 35.958 35.958 26 35.958 35.958 35.958 27 35.958 35.958 35.958 28 17.979 17.979 17.979 29 20.591 20.591 20.591 ! West Column (s) 30 20.061 20.061 20.061 ! (c) 31 20.591 20.591 20.591 ! (n) 32 20.273 20.273 20.273 ! Cntr Column (s) 33 19.743 19.743 19.743 ! (c) 34 20.273 20.273 20.273 ! (n) 35 19.764 19.764 19.764 ! East Column (s) 36 19.234 19.234 19.234 ! (c) 37 19.764 19.764 19.764 ! (n) 38 76.5 76.5 76.5 ! West Abutment 39 14.025 14.025 14.025 ! West X-beam 40 28.049 28.049 28.049 41 14.025 14.025 14.025 42 14.025 14.025 14.025 ! Cntr X-Beam 43 28.049 28.049 28.049 44 14.025 14.025 14.025 45 14.025 14.025 14.025 ! East X-Beam 46 28.049 28.049 28.049 47 14.025 14.025 14.025 48 76.5 76.5 76.5 ! East Abutment 77 LOADS 1 0 0 -17.9799 ! West Ramp 2 0 0 -35.958 3 0 0 -35.958 4 0 0 -35.958 5 0 0 -35.958 6 0 0 -35.958 7 0 0 -17.979 8 0 0 -20.73 ! West Deck 9 0 0 -41.46 10 0 0 -41.46 11 0 0 -41.46 12 0 0 -41.46 13 0 0 -41.46 14 0 0 -20.73 15 0 0 -17.496 ! East Deck 16 0 0 -34.993 17 0 0 -34.993 18 0 0 -34.993 19 0 0 -34.993 20 0 0 -34.993 21 0 0 -17.496 22 0 0 -17.979 ! East Ramp 23 0 0 -35.958
123

24 0 0 -35.958 25 0 0 -35.958 26 0 0 -35.958 27 0 0 -35.958 28 0 0 -17.979 29 0 0 -20.591 ! West Column (s) 30 0 0 -20.061 ! (c) 31 0 0 -20.591 ! (n) 32 0 0 -20.273 ! Cntr Column (s) 33 0 0 -19.743 ! (c) 34 0 0 -20.273 ! (n) 35 0 0 -19.764 ! East Column (s) 36 0 0 -19.234 ! (c) 37 0 0 -19.764 ! (n) 38 0 0 -76.5 ! West Abutment 39 0 0 -14.025 ! West X-beam 40 0 0 -28.049 41 0 0 -14.025 42 0 0 -14.025 ! Cntr X-Beam 43 0 0 -28.049 44 0 0 -14.025 45 0 0 -14.025 ! East X-Beam 46 0 0 -28.049 47 0 0 -14.025 48 0 0 -76.5 ! East Abutment 77 EQUAKE NSPeru9.txt 5 1 0.01 1 -1 ! File Parameters EQUAKE EWPeru9.txt 5 1 0.01 1 -1 ! File Parameters EQUAKE UPPeru9.txt 5 1 0.01 1 -1 ! File Parameters
124
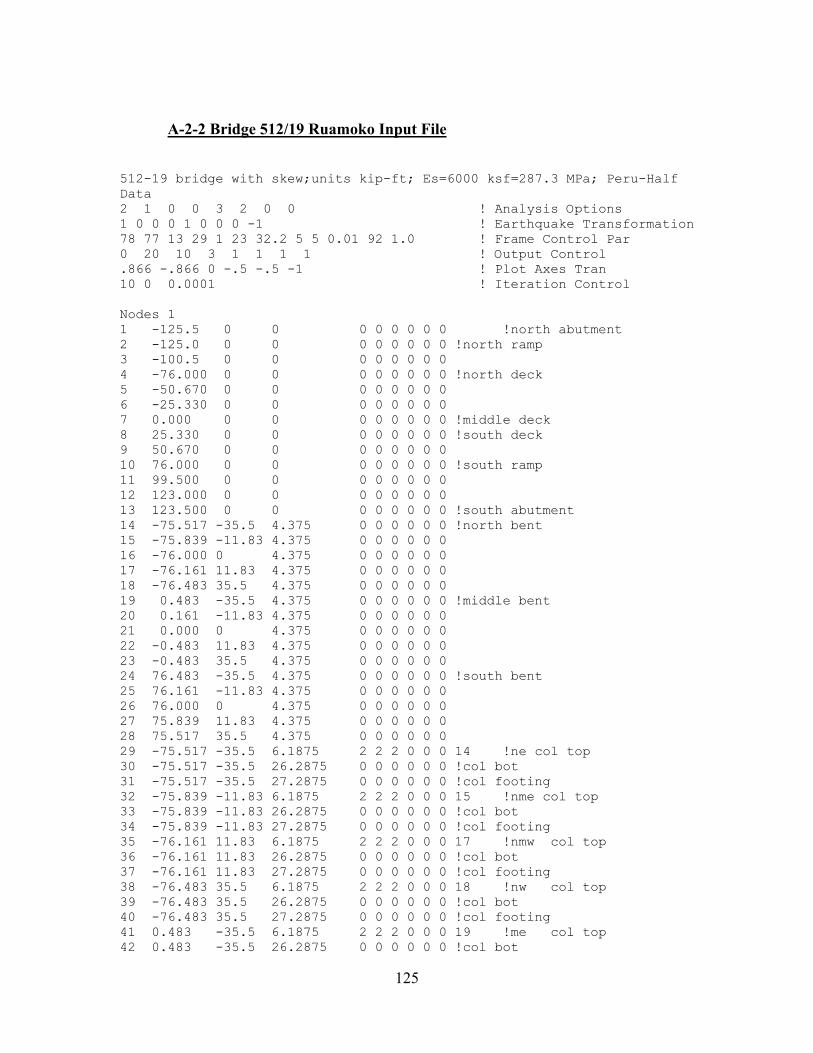
A-2-2 Bridge 512/19 Ruamoko Input File
512-19 bridge with skew;units kip-ft; Es=6000 ksf=287.3 MPa; Peru-Half Data 2 1 0 0 3 2 0 0 ! Analysis Options 1 0 0 0 1 0 0 0 -1 ! Earthquake Transformation 78 77 13 29 1 23 32.2 5 5 0.01 92 1.0 ! Frame Control Par 0 20 10 3 1 1 1 1 ! Output Control .866 -.866 0 -.5 -.5 -1 ! Plot Axes Tran 10 0 0.0001 ! Iteration Control Nodes 1 1 -125.5 0 0 0 0 0 0 0 0 !north abutment 2 -125.0 0 0 0 0 0 0 0 0 !north ramp 3 -100.5 0 0 0 0 0 0 0 0 4 -76.000 0 0 0 0 0 0 0 0 !north deck 5 -50.670 0 0 0 0 0 0 0 0 6 -25.330 0 0 0 0 0 0 0 0 7 0.000 0 0 0 0 0 0 0 0 !middle deck 8 25.330 0 0 0 0 0 0 0 0 !south deck 9 50.670 0 0 0 0 0 0 0 0 10 76.000 0 0 0 0 0 0 0 0 !south ramp 11 99.500 0 0 0 0 0 0 0 0 12 123.000 0 0 0 0 0 0 0 0 13 123.500 0 0 0 0 0 0 0 0 !south abutment 14 -75.517 -35.5 4.375 0 0 0 0 0 0 !north bent 15 -75.839 -11.83 4.375 0 0 0 0 0 0 16 -76.000 0 4.375 0 0 0 0 0 0 17 -76.161 11.83 4.375 0 0 0 0 0 0 18 -76.483 35.5 4.375 0 0 0 0 0 0 19 0.483 -35.5 4.375 0 0 0 0 0 0 !middle bent 20 0.161 -11.83 4.375 0 0 0 0 0 0 21 0.000 0 4.375 0 0 0 0 0 0 22 -0.483 11.83 4.375 0 0 0 0 0 0 23 -0.483 35.5 4.375 0 0 0 0 0 0 24 76.483 -35.5 4.375 0 0 0 0 0 0 !south bent 25 76.161 -11.83 4.375 0 0 0 0 0 0 26 76.000 0 4.375 0 0 0 0 0 0 27 75.839 11.83 4.375 0 0 0 0 0 0 28 75.517 35.5 4.375 0 0 0 0 0 0 29 -75.517 -35.5 6.1875 2 2 2 0 0 0 14 !ne col top 30 -75.517 -35.5 26.2875 0 0 0 0 0 0 !col bot 31 -75.517 -35.5 27.2875 0 0 0 0 0 0 !col footing 32 -75.839 -11.83 6.1875 2 2 2 0 0 0 15 !nme col top 33 -75.839 -11.83 26.2875 0 0 0 0 0 0 !col bot 34 -75.839 -11.83 27.2875 0 0 0 0 0 0 !col footing 35 -76.161 11.83 6.1875 2 2 2 0 0 0 17 !nmw col top 36 -76.161 11.83 26.2875 0 0 0 0 0 0 !col bot 37 -76.161 11.83 27.2875 0 0 0 0 0 0 !col footing 38 -76.483 35.5 6.1875 2 2 2 0 0 0 18 !nw col top 39 -76.483 35.5 26.2875 0 0 0 0 0 0 !col bot 40 -76.483 35.5 27.2875 0 0 0 0 0 0 !col footing 41 0.483 -35.5 6.1875 2 2 2 0 0 0 19 !me col top 42 0.483 -35.5 26.2875 0 0 0 0 0 0 !col bot
125

43 0.483 -35.5 27.2875 0 0 0 0 0 0 !col footing 44 0.161 -11.83 6.1875 2 2 2 0 0 0 20 !mme col top 45 0.161 -11.83 26.2875 0 0 0 0 0 0 !col bot 46 0.161 -11.83 27.2875 0 0 0 0 0 0 !col footing 47 -0.483 11.83 6.1875 2 2 2 0 0 0 22 !mmw col top 48 -0.483 11.83 26.2875 0 0 0 0 0 0 !col bot 49 -0.483 11.83 27.2875 0 0 0 0 0 0 !col footing 50 -0.483 35.5 6.1875 2 2 2 0 0 0 23 !mw col top 51 -0.483 35.5 26.2875 0 0 0 0 0 0 !col bot 52 -0.483 35.5 27.2875 0 0 0 0 0 0 !col footing 53 76.483 -35.5 6.1875 2 2 2 0 0 0 24 !se col top 54 76.483 -35.5 26.2875 0 0 0 0 0 0 !col bot 55 76.483 -35.5 27.2875 0 0 0 0 0 0 !col footing 56 76.161 -11.83 6.1875 2 2 2 0 0 0 25 !sme col top 57 76.161 -11.83 26.2875 0 0 0 0 0 0 !col bot 58 76.161 -11.83 27.2875 0 0 0 0 0 0 !col footing 59 75.839 11.83 6.1875 2 2 2 0 0 0 27 !smw col top 60 75.839 11.83 26.2875 0 0 0 0 0 0 !col bot 61 75.839 11.83 27.2875 0 0 0 0 0 0 !col footing 62 75.517 35.5 6.1875 2 2 2 0 0 0 28 !sw col top 63 75.517 35.5 26.2875 0 0 0 0 0 0 !col bot 64 75.517 35.5 27.2875 0 0 0 0 0 0 !col footing 65 -125.5 0 0 1 1 1 1 1 1 !north abutment spring 66 123.500 0 0 1 1 1 1 1 1 !south abutment spring 67 -75.517 -35.5 27.2875 1 1 1 1 1 1 !col footing spring 68 -75.839 -11.83 27.2875 1 1 1 1 1 1 !col footing spring 69 -76.161 11.83 27.2875 1 1 1 1 1 1 !col footing spring 70 -76.483 35.5 27.2875 1 1 1 1 1 1 !col footing spring 71 0.483 -35.5 27.2875 1 1 1 1 1 1 !col footing spring 72 0.161 -11.83 27.2875 1 1 1 1 1 1 !col footing spring 73 -0.483 11.83 27.2875 1 1 1 1 1 1 !col footing spring 74 -0.483 35.5 27.2875 1 1 1 1 1 1 !col footing spring 75 76.483 -35.5 27.2875 1 1 1 1 1 1 !col footing spring 76 76.161 -11.83 27.2875 1 1 1 1 1 1 !col footing spring 77 75.839 11.83 27.2875 1 1 1 1 1 1 !col footing spring 78 75.517 35.5 27.2875 1 1 1 1 1 1 !col footing spring Elements 1 1 1 65 2 0 0 Y !north abutment 2 1 2 3 0 0 Y !north deck 3 1 3 4 0 0 Y 4 1 4 5 0 0 Y 5 1 5 6 0 0 Y 6 1 6 7 0 0 Y 7 1 7 8 0 0 Y !south deck 8 1 8 9 0 0 Y 9 1 9 10 0 0 Y 10 1 10 11 0 0 Y 11 1 11 12 0 0 Y 12 1 12 66 0 0 Y !south abutment 13 2 14 15 0 0 X !north bent 14 2 15 16 0 0 X 15 2 16 17 0 0 X 16 2 17 18 0 0 X 17 2 19 20 0 0 X !middle bent 18 2 20 21 0 0 X 19 2 21 22 0 0 X
126
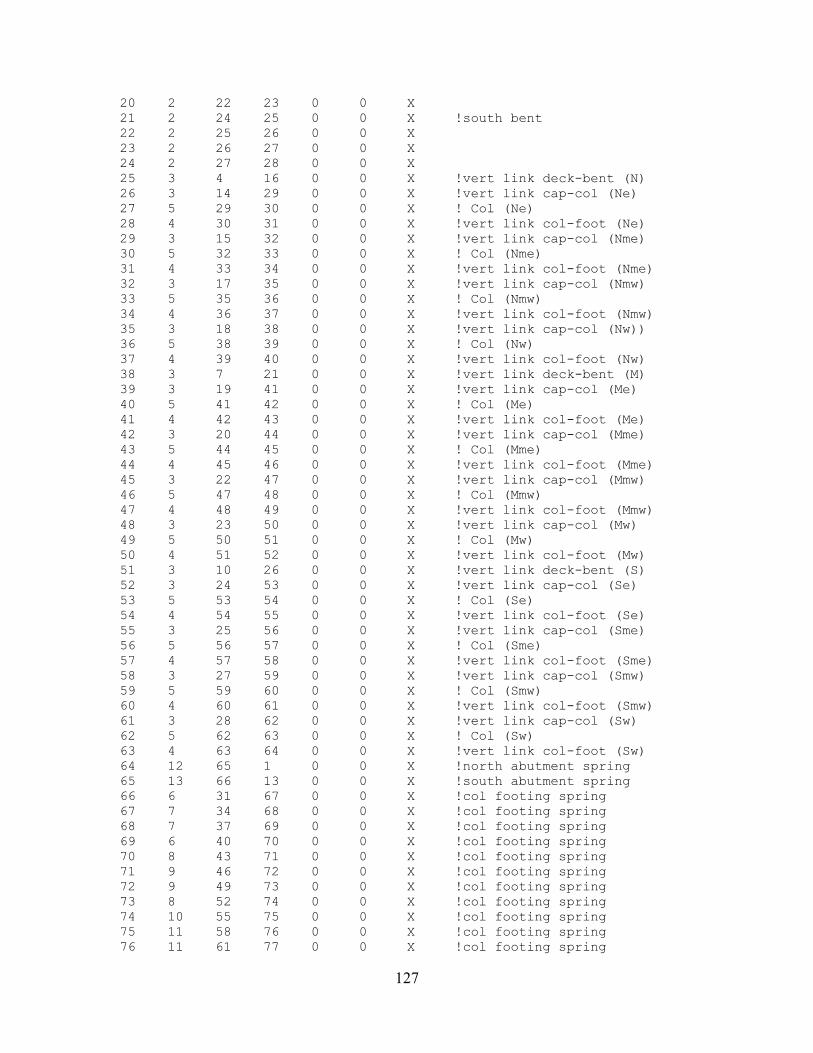
20 2 22 23 0 0 X 21 2 24 25 0 0 X !south bent 22 2 25 26 0 0 X 23 2 26 27 0 0 X 24 2 27 28 0 0 X 25 3 4 16 0 0 X !vert link deck-bent (N) 26 3 14 29 0 0 X !vert link cap-col (Ne) 27 5 29 30 0 0 X ! Col (Ne) 28 4 30 31 0 0 X !vert link col-foot (Ne) 29 3 15 32 0 0 X !vert link cap-col (Nme) 30 5 32 33 0 0 X ! Col (Nme) 31 4 33 34 0 0 X !vert link col-foot (Nme) 32 3 17 35 0 0 X !vert link cap-col (Nmw) 33 5 35 36 0 0 X ! Col (Nmw) 34 4 36 37 0 0 X !vert link col-foot (Nmw) 35 3 18 38 0 0 X !vert link cap-col (Nw)) 36 5 38 39 0 0 X ! Col (Nw) 37 4 39 40 0 0 X !vert link col-foot (Nw) 38 3 7 21 0 0 X !vert link deck-bent (M) 39 3 19 41 0 0 X !vert link cap-col (Me) 40 5 41 42 0 0 X ! Col (Me) 41 4 42 43 0 0 X !vert link col-foot (Me) 42 3 20 44 0 0 X !vert link cap-col (Mme) 43 5 44 45 0 0 X ! Col (Mme) 44 4 45 46 0 0 X !vert link col-foot (Mme) 45 3 22 47 0 0 X !vert link cap-col (Mmw) 46 5 47 48 0 0 X ! Col (Mmw) 47 4 48 49 0 0 X !vert link col-foot (Mmw) 48 3 23 50 0 0 X !vert link cap-col (Mw) 49 5 50 51 0 0 X ! Col (Mw) 50 4 51 52 0 0 X !vert link col-foot (Mw) 51 3 10 26 0 0 X !vert link deck-bent (S) 52 3 24 53 0 0 X !vert link cap-col (Se) 53 5 53 54 0 0 X ! Col (Se) 54 4 54 55 0 0 X !vert link col-foot (Se) 55 3 25 56 0 0 X !vert link cap-col (Sme) 56 5 56 57 0 0 X ! Col (Sme) 57 4 57 58 0 0 X !vert link col-foot (Sme) 58 3 27 59 0 0 X !vert link cap-col (Smw) 59 5 59 60 0 0 X ! Col (Smw) 60 4 60 61 0 0 X !vert link col-foot (Smw) 61 3 28 62 0 0 X !vert link cap-col (Sw) 62 5 62 63 0 0 X ! Col (Sw) 63 4 63 64 0 0 X !vert link col-foot (Sw) 64 12 65 1 0 0 X !north abutment spring 65 13 66 13 0 0 X !south abutment spring 66 6 31 67 0 0 X !col footing spring 67 7 34 68 0 0 X !col footing spring 68 7 37 69 0 0 X !col footing spring 69 6 40 70 0 0 X !col footing spring 70 8 43 71 0 0 X !col footing spring 71 9 46 72 0 0 X !col footing spring 72 9 49 73 0 0 X !col footing spring 73 8 52 74 0 0 X !col footing spring 74 10 55 75 0 0 X !col footing spring 75 11 58 76 0 0 X !col footing spring 76 11 61 77 0 0 X !col footing spring
127

77 10 64 78 0 0 X !col footing spring PROPS 1 FRAME ! Deck 1 0 0 0 0 0 0 ! 6.358E5 2.54E5 86.755 56170 56170 231.802 ! E,G,A,J,Izz,Iyy (K,FT) 0 2 FRAME ! Capbeam 1 0 0 0 0 0 0 ! 6.358E5 2.54E5 1E10 1E10 1E10 1E10 ! E,G,A,J,Izz,Iyy (K,FT) 0 3 FRAME ! Vertical links btw deck+col 1 0 0 0 0 0 0 ! 1E10 1E10 1E4 2E7 1E7 1E2 ! E,G,A,J,Izz,Iyy (K,FT) 0 4 FRAME ! vertical links btw col+footing 1 0 0 0 0 0 0 ! 1E10 1E10 1E4 2E7 1E7 1E2 ! E,G,A,J,Izz,Iyy (K,FT) 0 5 FRAME 2 0 0 0 4 0 0 !14a. Section Control 6.35E5 2.54E5 7.069 1.205 0.852 0.852 !14b. Section prop E,G,A,J,Izz,Iyy 0.0 !14c. End Properties 0.04 0.04 0.04 0.04 !14d. Member bilinear factor 1.423 1.423 1.423 1.423 !14e. Plastic Hinge Length 0 0 1.0 1.0 0 !14l. Interaction param -4900 -1203 1475 1475 591.4 !14m. P-M interaction ! 5.5 17 0.9 0 ! Loss Model(page 145-appendix A) 0.5 0.1 1 1 6 SPRING ! SOIL SPRING NO 1 0 0 0 0 0 ! Control Par. 9.4921E4 9.4921E4 9.8085E4 4.4837E6 2.7516E6 4.9144E6 0 .33 .33 ! Section Prop. 7 SPRING ! SOIL SPRING NI 1 0 0 0 0 0 ! Control Par. 9.4921E4 9.4921E4 9.8085E4 4.4837E6 2.7516E6 4.9144E6 0 .33 .33 ! Section Prop. 8 SPRING ! SOIL SPRING CO 1 0 0 0 0 0 ! Control Par.
128

9.8059E4 9.8059E4 1.0320E5 4.8277E6 3.5006E6 4.6821E6 0 .33 .33 ! Section Prop. 9 SPRING ! SOIL SPRING CI 1 0 0 0 0 0 ! Control Par. 9.8059E4 9.8059E4 1.0320E5 4.8277E6 3.5006E6 4.6821E6 0 .33 .33 ! Section Prop. 10 SPRING ! SOIL SPRING SO 1 0 0 0 0 0 ! Control Par. 9.1220E4 9.1220E4 9.4760E4 4.1780E6 2.0881E6 4.4245E6 0 .33 .33 ! Section Prop. 11 SPRING ! SOIL SPRING SI 1 0 0 0 0 0 ! Control Par. 9.1220E4 9.1220E4 9.4760E4 4.1780E6 2.0881E6 4.4245E6 0 .33 .33 ! Section Prop. 12 SPRING ! SOIL SPRING N Abt. 1 0 0 0 0 0 ! Control Par. 8.4002E5 8.4002E5 8.7782E5 2.4497E7 6.7001E7 5.1069E7 0 .33 .33 ! Section Prop. 13 SPRING ! SOIL SPRING S Abt. 1 0 0 0 0 0 ! Control Par. 3.3819E5 3.3819E5 3.5341E5 9.8626E6 2.6974E7 2.0560E7 0 .33 .33 ! Section Prop. Weights 0 1 1.767 1.767 1.767 !north abutment 2 88.359 88.359 88.359 !north ramp 3 173.184 173.184 173.184 4 176.12 176.12 176.12 !north deck 5 179.051 179.051 179.051 6 179.051 179.051 179.051 7 179.051 179.051 179.051 !middle deck 8 179.051 179.051 179.051 !south deck 9 179.051 179.051 179.051 10 172.584 172.584 172.584 !south ramp 11 166.116 166.116 166.116 12 84.825 84.825 84.825 13 1.767 1.767 1.767 !south abutment 14 165.881 165.881 165.881 !north bent 15 118.857 118.857 118.857 16 107.97 107.97 107.97 17 118.857 118.857 118.857 18 165.881 165.881 165.881
129

19 149.534 149.534 149.534 !middle bent 20 107.959 107.959 107.959 21 97.071 97.071 97.071 22 107.959 107.959 107.959 23 149.534 149.534 149.534 24 162.909 162.909 162.909 !south bent 25 116.875 116.875 116.875 26 105.988 105.988 105.988 27 116.875 116.875 116.875 28 162.909 162.909 162.909 30 21.312 21.312 21.312 !column bot 33 21.312 21.312 21.312 36 21.312 21.312 21.312 39 21.312 21.312 21.312 42 21.312 21.312 21.312 45 21.312 21.312 21.312 48 21.312 21.312 21.312 51 21.312 21.312 21.312 54 21.312 21.312 21.312 57 21.312 21.312 21.312 60 21.312 21.312 21.312 63 21.312 21.312 21.312 77 Loads 1 0 0 -1.767 !north abutment 2 0 0 -88.359 !north ramp 3 0 0 -173.184 4 0 0 -176.118 !north deck 5 0 0 -179.051 6 0 0 -179.051 7 0 0 -179.051 !middle deck 8 0 0 -179.051 !south deck 9 0 0 -179.051 10 0 0 -172.584 !south ramp 11 0 0 -166.116 12 0 0 -84.825 13 0 0 -1.767 !south abutment 14 0 0 -165.881 !north bent 15 0 0 -118.857 16 0 0 -107.97 17 0 0 -118.857 18 0 0 -165.881 19 0 0 -149.534 !middle bent 20 0 0 -107.959 21 0 0 -97.071 22 0 0 -107.959 23 0 0 -149.534 24 0 0 -162.909 !south bent 25 0 0 -116.875 26 0 0 -105.988 27 0 0 -116.875 28 0 0 -162.909 30 0 0 -21.312 !column bot 33 0 0 -21.312 36 0 0 -21.312 39 0 0 -21.312
130
42 0 0 -21.312 45 0 0 -21.312 48 0 0 -21.312 51 0 0 -21.312 54 0 0 -21.312 57 0 0 -21.312 60 0 0 -21.312 63 0 0 -21.312 77 EQUAKE NSPERU9.TXT 5 1 0.01 1 -1 ! File Parameters EQUAKE EWPERU9.TXT 5 1 0.01 1 -1 ! File Parameters EQUAKE UPPERU9.TXT 5 1 0.01 1 -1 ! File Parameters
131

A-2-3 Bridge 5/649 Ruaumoko Input File
5-649E east bridge with skew;units kip-ft; Es=6000 ksf=287.3 MPa; Peru; Half Data 2 1 0 0 3 2 0 0 ! Analysis Options -1 0 0 0 -1 0 0 0 -1 ! Earthquake Transformation 57 60 25 30 1 30 32.2 5 5 0.01 92 1.0 ! Frame Control Par 0 20 10 10 3 1 1 1 ! Output Control .866 -.866 0 -.5 -.5 -1 ! Plot Axes Tran 10 0 0.0001 ! Iteration Control NODES 1 1 0.000 0.000 0.000 0 0 0 0 0 0 !deck (north half) 2 12.00 0.000 0.000 0 0 0 0 0 0 3 24.00 0.000 0.000 0 0 0 0 0 0 4 36.00 0.000 0.000 0 0 0 0 0 0 5 47.91 0.000 0.000 0 0 0 0 0 0 !north ramp exp joint 6 48.09 0.000 0.000 0 0 0 0 0 0 !north ramp 7 67.25 0.000 0.000 0 0 0 0 0 0 8 86.50 0.000 0.000 0 0 0 0 0 0 9 105.75 0.000 0.000 0 0 0 0 0 0 10 125.00 0.000 0.000 0 0 0 0 0 0 !north abutment 11 125.05 0.000 0.000 1 1 1 1 1 1 !north abutment gap 12 -120.05 0.000 0.000 1 1 1 1 1 1 !south abutment gap 13 -120.00 0.000 0.000 0 0 0 0 0 0 !south abutment 14 -102.00 0.000 0.000 0 0 0 0 0 0 !south ramp 15 -84.000 0.000 0.000 0 0 0 0 0 0 16 -66.000 0.000 0.000 0 0 0 0 0 0 17 -47.906 0.000 0.000 0 0 0 0 0 0 !south ramp exp joint 18 -48.094 0.000 0.000 0 0 0 0 0 0 !deck (south half) 19 -36.000 0.000 0.000 0 0 0 0 0 0 20 -24.000 0.000 0.000 0 0 0 0 0 0 21 -12.000 0.000 0.000 0 0 0 0 0 0 22 -67.450 -20.142 0.000 0 0 0 0 0 0 !south-west bent 23 -57.725 -10.071 0.000 0 0 0 0 0 0 !mid south-west bent 24 -48.000 0.000 0.000 0 0 0 0 0 0 !center south bent 25 -38.275 10.071 0.000 0 0 0 0 0 0 !mid south-east bent 26 -28.550 20.142 0.000 0 0 0 0 0 0 !mid south-east bent 27 28.550 -20.142 0.000 0 0 0 0 0 0 !north-west bent 28 38.275 -10.071 0.000 0 0 0 0 0 0 !mid north-west bent 29 48.000 0.000 0.000 0 0 0 0 0 0 !center north bent 30 57.725 10.071 0.000 0 0 0 0 0 0 !mid north-east bent 31 67.450 20.142 0.000 0 0 0 0 0 0 !mid north-east bent 32 -67.450 -20.142 8.354 2 2 2 0 0 0 22 !west col south bent top (slaved) 33 -67.450 -20.142 26.334 0 0 0 0 0 0 !west col south bent bot 34 -67.450 -20.142 27.959 1 1 1 1 1 1 !west col south bent ftg 35 -48.000 0.000 8.354 2 2 2 0 0 0 24 !mid col south bent top (slaved) 36 -48.000 0.000 27.054 0 0 0 0 0 0 !mid col south bent bot 37 -48.000 0.000 28.679 1 1 1 1 1 1 !mid col south bent ftg 38 -28.550 20.142 8.354 2 2 2 0 0 0 26 !east col south bent top (slaved) 39 -28.550 20.142 27.584 0 0 0 0 0 0 !east col south bent bot 40 -28.550 20.142 29.209 1 1 1 1 1 1 !east col south bent ftg
132

41 28.550 -20.142 8.354 2 2 2 0 0 0 27 !west col north bent top (slaved) 42 28.550 -20.142 24.704 0 0 0 0 0 0 !west col north bent bot 43 28.550 -20.142 26.329 1 1 1 1 1 1 !west col north bent ftg 44 48.000 0.000 8.354 2 2 2 0 0 0 29 !mid col north bent top
(slaved) 45 48.000 0.000 25.504 0 0 0 0 0 0 !mid col north bent bot 46 48.000 0.000 27.129 1 1 1 1 1 1 !mid col north bent ftg 47 67.450 20.142 8.354 2 2 2 0 0 0 31 !east col north bent top (slaved) 48 67.450 20.142 26.094 0 0 0 0 0 0 !east col north bent bot 49 67.450 20.142 27.719 1 1 1 1 1 1 !east col north bent ftg 50 -67.450 -20.142 27.959 0 0 0 0 0 0 !west col south bent sp 51 -48.000 0.000 28.679 0 0 0 0 0 0 !mid col south bent sp 52 -28.550 20.142 29.209 0 0 0 0 0 0 !east col south bent sp 53 28.550 -20.142 26.329 0 0 0 0 0 0 !west col north bent sp 54 48.000 0.000 27.129 0 0 0 0 0 0 !mid col north bent sp 55 67.450 20.142 27.719 0 0 0 0 0 0 !east col north bent sp 56 125.050 0.000 0.000 0 0 0 0 0 0 !north abutment spring 57 -120.05 0.000 0.000 0 0 0 0 0 0 !south abutment spring ELEMENTS 1 1 6 1 2 0 0 Y !north deck 2 6 2 3 0 0 Y !north deck 3 6 3 4 0 0 Y !north deck 4 5 4 5 0 0 Y !north deck 5 1 6 7 0 0 Y !north ramp 6 3 7 8 0 0 Y !north ramp 7 3 8 9 0 0 Y !north ramp 8 2 9 10 0 0 Y !north ramp 9 1 13 14 0 0 Y !south ramp 10 3 14 15 0 0 Y !south ramp 11 3 15 16 0 0 Y !south ramp 12 2 16 17 0 0 Y !south ramp 13 4 18 19 0 0 Y !south deck 14 6 19 20 0 0 Y !south deck 15 6 20 21 0 0 Y !south deck 16 6 21 1 0 0 Y !south deck 17 7 24 23 0 0 X !south-west bent 18 7 23 22 0 0 X 19 7 24 25 0 0 X !south-east bent 20 7 25 26 0 0 X 21 7 29 28 0 0 X !north-west bent 22 7 28 27 0 0 X 23 7 29 30 0 0 X !north-east bent 24 7 30 31 0 0 X 25 8 22 32 0 0 X !vert link deck-col 26 10 32 33 0 0 X !west col south bent 27 9 33 50 0 0 X !vert link col-foot 28 8 24 35 0 0 X !vert link deck-col 29 11 35 36 0 0 X !mid col south bent 30 9 36 51 0 0 X !vert link col-foot 31 8 26 38 0 0 X !vert link deck-col 32 12 38 39 0 0 X !east col south bent 33 9 39 52 0 0 X !vert link col-foot 34 8 27 41 0 0 X !vert link deck-col 35 13 41 42 0 0 X !west col north bent
133
36 9 42 53 0 0 X !vert link col-foot 37 8 29 44 0 0 X !vert link deck-col 38 14 44 45 0 0 X !mid col north bent 39 9 45 54 0 0 X !vert link col-foot 40 8 31 47 0 0 X !vert link deck-col 41 15 47 48 0 0 X !east col north bent 42 9 48 55 0 0 X !vert link col-foot 43 16 5 29 0 0 Y !north bent bearing pad (S) 44 16 29 6 0 0 Y !north bent bearing pad (N) 45 16 17 24 0 0 Y !south bent bearing pad (S) 46 16 24 18 0 0 Y !south bent bearing pad (N) 47 16 10 56 0 0 Y !north abutment bearing pad 48 16 13 57 0 0 Y !south abutment bearing pad 49 17 5 6 0 0 Y !north bent gap 50 17 17 18 0 0 Y !south bent gap 51 17 10 56 0 0 Y !north abutment gap 52 17 13 57 0 0 Y !south abutment gap 53 21 34 50 0 0 X !west col south bent footing 54 22 37 51 0 0 X !mid col south bent sp ftg 55 23 40 52 0 0 X !east col south bent sp ftg 56 18 43 53 0 0 X !west col north bent sp ftg 57 19 46 54 0 0 X !mid col north bent sp ftg 58 20 49 55 0 0 X !east col north bent sp ftg 59 24 11 56 0 0 Y !north abutment spring 60 25 12 57 0 0 Y !south abutment spring PROPS 1 FRAME ! Deck 72ft (south ramp) w/ mbr release end 1 1 1 1 0 0 0 0 ! Deck 77ft (north ramp) 6.358E5 2.54E5 63 3177 3176 237.5 63 63 ! E,G,A,J,Izz,Iyy,Asy,Asz (K,FT) 0.0 0.0 0.0 0.0 2 FRAME ! Deck 72ft (south ramp) w/ mbr release end 2 1 2 2 0 0 0 0 ! Deck 77ft (north ramp) 6.358E5 2.54E5 63 3177 3176 237.5 63 63 ! E,G,A,J,Izz,Iyy,Asy,Asz (K,FT) 0.0 0.0 0.0 0.0 3 FRAME ! Deck 72ft (south ramp) 1 0 0 0 0 0 0 ! Deck 77ft (north ramp) 6.358E5 2.54E5 63 3177 3176 237.5 63 63 ! E,G,A,J,Izz,Iyy,Asy,Asz (K,FT) 0.0 0.0 0.0 0.0 4 FRAME ! Deck 96ft (deck) w/ mbr release end 1 1 1 1 0 0 0 0 6.358E5 2.54E5 70.6 34330 34330 292.334 70.6 70.6 ! E,G,A,J,Izz,Iyy,Asy,Asz (K,FT) 0.0 0.0 0.0 0.0 5 FRAME ! Deck 96ft (deck) w/ mbr release end 2
134

1 2 2 0 0 0 0 ! 6.358E5 2.54E5 70.6 34330 34330 292.334 70.6 70.6 ! E,G,A,J,Izz,Iyy,Asy,Asz (K,FT) 0.0 0.0 0.0 0.0 6 FRAME ! Deck 96ft (deck) 1 0 0 0 0 0 0 ! 6.358E5 2.54E5 70.6 34330 34330 292.334 70.6 70.6 ! E,G,A,J,Izz,Iyy,Asy,Asz (K,FT) 0.0 0.0 0.0 0.0 7 FRAME ! Capbeam 1 0 0 0 0 0 0 ! 6.358E5 2.54E5 1E2 1E4 1E2 1E5 1E2 1E2 ! E,G,A,J,Izz,Iyy,Asy,Asz (K,FT) 0.0 0.0 0.0 0.0 8 FRAME ! Vertical links btw deck+col 1 0 0 0 0 0 0 ! linear elastic 1E7 1E7 1E3 1E5 1E3 1E6 1E3 1E3 ! E,G,A,J,Izz,Iyy,Asy,Asz (K,FT) 0.0 0.0 0.0 0.0 9 FRAME ! vertical links btw col+footing 1 0 0 0 0 0 0 ! linear elastic 1E7 1E7 1E3 1E5 1E3 1E6 1E3 1E3 ! E,G,A,J,Izz,Iyy,Asy,Asz (K,FT) 0.0 0.0 0.0 0.0 10 FRAME !South-west column 2 0 0 0 4 0 0 0 !14a. Section Control 6.358E5 2.543E5 7.069 1.168 0.826 0.826 7.069 7.069 !14b. Section prop E,G,A,J,Izz,Iyy 0.0 0.0 0.0 0.0 !14c. End Properties 0.07 0.07 0.07 0.07 !14d. Member bilinear factor 1.338 1.338 1.338 1.338 !14e. Plastic Hinge Length 0 0 1.0 1.1 0.0 !14l. Interaction param -6556 -1555 1770 1770 483.7 !14m. P-M interaction ! 5 8 0.7 ! Loss Model(appendix A) 0.5 0.1 1 1 ! Modified Takeda 11 FRAME !South-mid column 2 0 0 0 4 0 0 0 !14a. Section Control 6.358E5 2.543E5 7.069 1.168 0.826 0.826 7.069 7.069 !14b. Section prop E,G,A,J,Izz,Iyy 0.0 0.0 0.0 0.0 !14c. End Properties 0.07 0.07 0.07 0.07 !14d. Member bilinear factor 1.367 1.367 1.367 1.367 !14e. Plastic Hinge Length 0 0 1.0 1.1 0.0 !14l. Interaction param -6556 -1555 1770 1770 483.7 !14m. P-M interaction ! 5 8 0.7 ! Loss Model(appendix A) 0.5 0.1 1 1 ! Modified Takeda 12 FRAME ! South-east Column 2 0 0 0 4 0 0 0 !14a. Section Control
135

6.358E5 2.543E5 7.069 1.168 0.826 0.826 7.069 7.069 !14b. Section prop E,G,A,J,Izz,Iyy 0.0 0.0 0.0 0.0 !14c. End Properties 0.07 0.07 0.07 0.07 !14d. Member bilinear factor 1.388 1.388 1.388 1.388 !14e. Plastic Hinge Length 0 0 1.0 1.1 0.0 !14l. Interaction param -6556 -1555 1770 1770 483.7 !14m. P-M interaction ! 5 8 0.7 ! Loss Model(appendix A) 0.5 0.1 1 1 ! Modified Takeda 13 FRAME !North-west Column 2 0 0 0 4 0 0 0 !14a. Section Control 6.358E5 2.543E5 7.069 1.168 0.826 0.826 7.069 7.069 !14b. Section prop E,G,A,J,Izz,Iyy 0.0 0.0 0.0 0.0 !14c. End Properties 0.07 0.07 0.07 0.07 !14d. Member bilinear factor 1.273 1.273 1.273 1.273 !14e. Plastic Hinge Length 0 0 1.0 1.1 0.0 !14l. Interaction param -6556 -1555 1770 1770 483.7 !14m. P-M interaction ! 5 8 0.7 ! Loss Model(appendix A) 0.5 0.1 1 1 ! Modified Takeda 14 FRAME !North-Mid Column 2 0 0 0 4 0 0 0 !14a. Section Control 6.358E5 2.543E5 7.069 1.168 0.826 0.826 7.069 7.069 !14b. Section prop E,G,A,J,Izz,Iyy 0.0 0.0 0.0 0.0 !14c. End Properties 0.07 0.07 0.07 0.07 !14d. Member bilinear factor 1.305 1.305 1.305 1.305 !14e. Plastic Hinge Length 0 0 1.0 1.1 0.0 !14l. Interaction param -6556 -1555 1770 1770 483.7 !14m. P-M interaction ! 5 8 0.7 ! Loss Model(appendix A) 0.5 0.1 1 1 ! Modified Takeda 15 FRAME !North-East Column 2 0 0 0 4 0 0 0 !14a. Section Control 6.358E5 2.543E5 7.069 1.168 0.826 0.826 7.069 7.069 !14b. Section prop E,G,A,J,Izz,Iyy 0.0 0.0 0.0 0.0 !14c. End Properties 0.07 0.07 0.07 0.07 !14d. Member bilinear factor 1.328 1.328 1.328 1.328 !14e. Plastic Hinge Length 0 0 1.0 1.1 0.0 !14l. Interaction param -6556 -1555 1770 1770 483.7 !14m. P-M interaction ! 5 8 0.7 ! Loss Model(appendix A) 0.5 0.1 1 1 ! Modified Takeda 16 SPRING ! Bridge Deck Bearing Pads 1 0 0 0 0 0 ! Control Parameters 1479.6 2E7 3E6 8E6 8E4 8E4 0 .3 .3 ! Section Properties 17 MULTISPRING ! Bridge Gap Elements 1 0 0 0 10 2 31 0 ! Control Parameters 3.265E3 0 0 0 0 0 .3 ! Section Properties 0 -9.265E15 0 0 0 0 0 0 0 0 0 18 SPRING ! SOIL SPRING NW 1 0 0 0 0 0 ! Control Par.
136

1.2091E5 1.2091E5 1.6626E5 7.3084E6 7.3084E6 1.0268E7 0 .33 .33 ! Section Prop. 19 SPRING ! SOIL SPRING NM 1 0 0 0 0 0 ! Control Par. 1.2091E5 1.2091E5 1.6626E5 7.3084E6 7.3084E6 1.0268E7 0 .33 .33 ! Section Prop. 20 SPRING ! SOIL SPRING NE 1 0 0 0 0 0 ! Control Par. 1.2091E5 1.2091E5 1.6626E5 7.3084E6 7.3084E6 1.0268E7 0 .33 .33 ! Section Prop. 21 SPRING ! SOIL SPRING SW 1 0 0 0 0 0 ! Control Par. 1.3339E5 1.3339E5 1.6626E5 7.3106E6 7.3106E6 1.0268E7 0 .33 .33 ! Section Prop. 22 SPRING ! SOIL SPRING SM 1 0 0 0 0 0 ! Control Par. 1.3339E5 1.3339E5 1.6626E5 7.3106E6 7.3106E6 1.0268E7 0 .33 .33 ! Section Prop. 23 SPRING ! SOIL SPRING SE 1 0 0 0 0 0 ! Control Par. 1.3339E5 1.3339E5 1.6626E5 7.3106E6 7.3106E6 1.0268E7 0 .33 .33 ! Section Prop. 24 SPRING ! Secant SOIL SPRING BENT North 1 0 0 0 0 0 ! Control Par. 2.0057E5 2.0718E5 3.3608E5 3.5240E6 6.0453E7 4.7215E7 0 .33 .33 ! Section Prop. 25 SPRING ! Secant SOIL SPRING BENT South 1 0 0 0 0 0 ! Control Par. 1.8966E5 1.9628E5 3.2071E5 3.5198E6 6.0449E7 4.7215E7 0 .33 .33 ! Section Prop. WEIGHTS 1 1 127.126 127.126 127.126 2 127.126 127.126 127.126 3 127.126 127.126 127.126 4 127.126 127.126 127.126 5 63.563 63.563 63.563 6 91 91 91 7 182.014 182.014 182.014 8 182.014 182.014 182.014 9 182.014 182.014 182.014 10 91 91 91 13 85.1 85.1 85.1 14 170.195 170.195 170.195 15 170.195 170.195 170.195 16 170.195 170.195 170.195 17 85.10 85.10 85.10 18 63.563 63.563 63.563 19 127.126 127.126 127.126 20 127.126 127.126 127.126
137
21 127.126 127.126 127.126 22 13.65 13.65 13.65 23 27.3 27.3 27.3 24 27.3 27.3 27.3 25 27.3 27.3 27.3 26 13.65 13.65 13.65 27 13.65 13.65 13.65 28 27.3 27.3 27.3 29 27.3 27.3 27.3 30 27.3 27.3 27.3 31 13.65 13.65 13.65 32 19.064 19.064 19.064 35 19.827 19.827 19.827 38 20.389 20.389 20.389 41 17.336 17.336 17.336 44 18.184 18.184 18.184 47 18.81 18.81 18.81 56 321.294 321.294 321.294 57 309.244 309.244 309.244 LOADS 1 0 0 -127.126 2 0 0 -127.126 3 0 0 -127.126 4 0 0 -127.126 5 0 0 -63.563 6 0 0 -91 7 0 0 -182.014 8 0 0 -182.014 9 0 0 -182.014 10 0 0 -91 13 0 0 -85.1 14 0 0 -170.195 15 0 0 -170.195 16 0 0 -170.195 17 0 0 -85.097 18 0 0 -63.563 19 0 0 -127.126 20 0 0 -127.126 21 0 0 -127.126 22 0 0 -13.65 23 0 0 -27.3 24 0 0 -27.3 25 0 0 -27.3 26 0 0 -13.65 27 0 0 -13.65 28 0 0 -27.3 29 0 0 -27.3 30 0 0 -27.3 31 0 0 -13.65 32 0 0 -19.064 35 0 0 -19.827 38 0 0 -20.389 41 0 0 -17.336 44 0 0 -18.184 47 0 0 -18.81
138

56 0 0 -321.294 57 0 0 -309.244 EQUAKE NSPeru9.txt 5 1 0.01 1 -1 ! File Parameters EQUAKE EWPeru9.txt 5 1 0.01 1 -1 ! File Parameters EQUAKE UPPeru9.txt 5 1 0.01 1 -1 ! File Parameters
139

Once Ruaumoko has been run a ‘filename’.RAS is generated and another software
is used to sort the data: pwave. This software was developed by Visual Numerics, Inc. in
1997. It reads a script (reader_’filename’.pro) which will read the unformatted data of the
.RAS file and store it as a matrix in a .txt file. The .pro file can be modified to fit the
geometry of the analyzed structure (Enter the node, member numbers that define the
structure, enter the number defining the analyses to be run (1=X-disp, 27=Z-shear at top,
etc…)). Two commands need to be entered to run pwave:
At the prompt: WAVE>
Type: .rnew reader_’filename’ (without the .pro extension)
Type: ‘filename’ (without the .RAS extension)
This will execute the .pro file and create a ‘filename’.txt file. After that, this text file can
be used as a matrix of data in any program to plot and sort the data. S-Plus 2000
(MathSoft, Inc.) is a powerful software to plot numerous data variables at once, once an
S-Plus script has been created.
140

APPENDIX A-3
Bridge 512 Es (ksf) K11 (Trans) k/ft
K22 (Long.) k/ft
K33 ( Vert.) k/ft
K44 (Trans.) k-ft/rad
K55 (Long.) k-ft/rad
K66 (Vert.) k-ft/rad
1000 1.40E+05 1.40E+05 1.46E+05 4.08E+06 1.12E+07 8.51E+066000 8.40E+05 8.40E+05 8.78E+05 2.45E+07 6.70E+07 5.11E+0718000 2.52E+06 2.52E+06 2.63E+06 7.35E+07 2.01E+08 1.53E+081000 1.58E+04 1.58E+04 1.63E+04 7.47E+05 4.59E+05 8.19E+056000 9.49E+04 9.49E+04 9.81E+04 4.48E+06 2.75E+06 4.91E+0618000 2.85E+05 2.85E+05 2.94E+05 1.35E+07 8.25E+06 1.47E+071000 1.63E+04 1.63E+04 1.72E+04 8.05E+05 5.83E+05 7.80E+056000 9.81E+04 9.81E+04 1.03E+05 4.83E+06 3.50E+06 4.68E+0618000 2.94E+05 2.94E+05 3.10E+05 1.45E+07 1.05E+07 1.40E+071000 1.52E+04 1.52E+04 1.58E+04 6.96E+05 3.48E+05 7.37E+056000 9.12E+04 9.12E+04 9.48E+04 4.18E+06 2.09E+06 4.42E+0618000 2.74E+05 2.74E+05 2.84E+05 1.25E+07 6.26E+06 1.33E+071000 5.64E+04 5.64E+04 5.89E+04 1.64E+06 4.50E+06 3.43E+066000 3.38E+05 3.38E+05 3.53E+05 9.86E+06 2.70E+07 2.06E+0718000 1.01E+06 1.01E+06 1.06E+06 2.96E+07 8.09E+07 6.17E+07
Bridge 227 Es (ksf)5 7.87E+04 8.48E+04 3.20E+05 1.38E+07 1.38E+07 3.12E+04
1000 1.42E+05 1.48E+05 3.85E+05 1.74E+07 1.86E+07 6.23E+066000 4.63E+05 4.66E+05 7.15E+05 3.55E+07 4.31E+07 3.74E+0718000 1.23E+06 1.23E+06 1.50E+06 7.91E+07 1.02E+08 1.12E+08
5 1.98E+04 1.98E+04 9.33E+04 5.34E+05 5.33E+05 4.40E+031000 3.68E+04 3.68E+04 1.11E+05 1.34E+06 1.07E+06 8.80E+056000 1.22E+05 1.22E+05 2.02E+05 5.38E+06 3.76E+06 5.28E+0618000 3.26E+05 3.26E+05 4.20E+05 1.51E+07 1.02E+07 1.58E+07
5 1.98E+04 1.98E+04 9.33E+04 5.34E+05 5.33E+05 4.40E+031000 3.68E+04 3.68E+04 1.11E+05 1.34E+06 1.07E+06 8.80E+056000 1.22E+05 1.22E+05 2.02E+05 5.38E+06 3.76E+06 5.28E+0618000 3.26E+05 3.26E+05 4.20E+05 1.51E+07 1.02E+07 1.58E+07
5 1.98E+04 1.98E+04 9.33E+04 5.34E+05 5.33E+05 4.40E+031000 3.68E+04 3.68E+04 1.11E+05 1.34E+06 1.07E+06 8.80E+056000 1.22E+05 1.22E+05 2.02E+05 5.38E+06 3.76E+06 5.28E+0618000 3.26E+05 3.26E+05 4.20E+05 1.51E+07 1.02E+07 1.58E+07
5 7.87E+04 8.48E+04 3.20E+05 1.38E+07 1.38E+07 3.12E+041000 1.42E+05 1.48E+05 3.85E+05 1.74E+07 1.86E+07 6.23E+066000 4.63E+05 4.66E+05 7.15E+05 3.55E+07 4.31E+07 3.74E+0718000 1.23E+06 1.23E+06 1.50E+06 7.91E+07 1.02E+08 1.12E+08
Bridge 649 Es (ksf)1000 7.43E+04 8.09E+04 1.82E+05 6.15E+05 1.01E+07 7.87E+066000 1.90E+05 1.96E+05 3.21E+05 3.52E+06 6.04E+07 4.72E+0718000 4.67E+05 4.73E+05 6.55E+05 1.05E+07 1.81E+08 1.42E+081000 3.37E+04 3.37E+04 6.36E+04 1.22E+06 1.22E+06 1.71E+066000 1.33E+05 1.33E+05 1.66E+05 7.31E+06 7.31E+06 1.03E+0718000 3.73E+05 3.73E+05 4.13E+05 2.19E+07 2.19E+07 3.08E+071000 2.12E+04 2.12E+04 6.36E+04 1.22E+06 1.22E+06 1.71E+066000 1.21E+05 1.21E+05 1.66E+05 7.31E+06 7.31E+06 1.03E+0718000 3.60E+05 3.60E+05 4.13E+05 2.19E+07 2.19E+07 3.08E+071000 8.52E+04 9.18E+04 1.97E+05 6.19E+05 1.01E+07 7.87E+066000 2.01E+05 2.07E+05 3.36E+05 3.52E+06 6.05E+07 4.72E+0718000 4.77E+05 4.84E+05 6.70E+05 1.05E+07 1.81E+08 1.42E+08
North Pier
Spring stiffness values for all bridges in US units.
Translational Springs Rotational Springs
North Abut
Rotational Springs
West Pier
West Abut
Center Pier
South Pier
South Abut
East Abut
East Pier
Center Pier
Translational Springs
North Abut
Rotational Springs
South Abut
South Pier
North Pier
Translational Springs
Appendix A-3 Spring values for all bridges in US units

APPENDIX A-4
1. Bridge 5/227
EQ Spring Es values (MPa)
North dir. Shear (kips)
North dir. Shear (kN)
South dir. Shear
South dir. Shear (kN)
47.9 65 289 -69 -309861.9 66 295 -77 -345fixed 65 290 -85 -37747.9 60 269 -64 -287
861.9 56 249 -60 -268fixed 71 314 -59 -26347.9 43 191 -52 -232
861.9 70 312 -72 -320fixed 67 296 -52 -23047.9 59 263 -66 -292
861.9 80 355 -67 -297fixed 41 181 -33 -14547.9 47 207 -52 -230
861.9 49 218 -59 -264fixed 94 417 -62 -27647.9 58 256 -68 -303
861.9 63 278 -58 -258fixed 81 362 -80 -35447.9 66 292 -69 -308
861.9 62 276 -66 -292fixed 71 315 -94 -41847.9 61 271 -65 -288
861.9 58 259 -56 -251fixed 73 325 -60 -26647.9 66 295 -62 -275
861.9 72 321 -68 -303fixed 45 199 -56 -24947.9 79 352 -75 -335
861.9 89 395 -89 -394fixed 90 400 -75 -334
Kobe 475
Mexico 475
Chile 2475
Peru 2475
Olympia 975
Kobe 975
Footings - Transverse Shear Force Demands
Olympia 475
Chile 475
Center bent - Center Column
Bridge 227 - Ф Vn = 1641 kN (369 kips)
Peru 475
Mexico 975
North dir. Shear (kips)
North dir. Shear (kN)
South dir. Shear (kips)
South dir. Shear (kN)
42 187 -36 -16039 175 -40 -17962 277 -60 -26937 167 -44 -19549 220 -50 -22154 239 -42 -18628 124 -37 -16335 156 -47 -21020 89 -57 -25530 133 -36 -16133 146 -38 -17146 203 -50 -22038 169 -48 -21542 189 -47 -20786 383 -44 -19667 298 -75 -33466 293 -66 -29183 371 -56 -24840 178 -30 -13541 181 -66 -29246 205 -89 -39542 185 -47 -20844 197 -46 -20450 223 -54 -24249 217 -51 -22851 225 -52 -23052 230 -54 -24152 231 -53 -23759 263 -62 -278107 476 -62 -276
Longitudinal Shear Force Demands
Bridge 227 - Ф Vn = 2185 kN (492 kips)
Center bent - Center Column
kips kN kips kN kips kN kips kN47.9 51 227 -51 -225 55 243 -48 -215
861.9 58 258 -56 -249 55 246 -39 -17247.9 39 174 -48 -214 52 229 -52 -230
861.9 40 178 -48 -213 48 214 -54 -24247.9 51 226 -51 -228 53 235 -51 -227
861.9 45 198 -54 -239 45 200 -43 -19147.9 72 322 -72 -320 70 313 -59 -262
861.9 61 271 -53 -236 72 320 -64 -28647.9 76 338 -60 -266 72 320 -49 -219
861.9 65 291 -52 -231 65 289 -54 -242Chile 2475
Transverse Shear Force in Girder-webs at the Abutments
Bridge 227 - Ф Vn = 1312 kN (295 kips)
North dir. EQ Spring Es values
Kobe975
Mexico 975
Olympia 975
Peru 2475
South dir. West abut
North dir. South dir. East Abut.
142

2. Bridge 512/19
EQ Spring Es values (ksf)
West dir. Shear (kips)
West dir. Shear (kN)
East dir. Shear (kips)
East dir. Shear (kN)
1000 57 252 -52 -23118000 48 214 -47 -207fixed 34 152 -37 -1636000 51 228 -49 -216
18000 52 230 -47 -210fixed 37 165 -38 -1701000 54 239 -56 -251
18000 45 201 -45 -198fixed 40 177 -32 -1416000 51 226 -53 -237
18000 51 226 -52 -233fixed 49 218 -40 -1806000 52 229 -50 -223
18000 50 224 -48 -215fixed 36 160 -60 -2686000 60 268 -58 -257
18000 54 239 -53 -235fixed 49 218 -46 -2056000 53 237 -61 -270
18000 51 225 -54 -239fixed 51 228 -32 -1426000 49 217 -65 -290
18000 61 273 -51 -225fixed 34 152 -48 -2146000 62 276 -65 -288
18000 65 291 -73 -326fixed 63 280 -63 -2786000 74 330 -79 -350
18000 76 338 -83 -367fixed 79 350 -91 -404
Peru 475
Kobe 975
Mexico 975
Olympia 975
Chile 2475
Peru 2475
Kobe 475
Mexico 475
Olympia 475
Chile 475
Center bent - Middle-East Column
Footings - Transverse Shear Force Demands
Bridge 512 - Ф Vn = 972 kN (219 kips)
West dir. Shear (kips)
West dir. Shear (kN)
East dir. Shear (kips)
East dir. Shear (kN)
1 2 -1 -33 12 -2 -1134 150 -36 -1617 32 -1 -43 14 -4 -1728 124 -37 -1661 4 -1 -61 4 -9 -3828 125 -41 -1811 5 -1 -48 36 -1 -532 142 -41 -1821 3 -1 -51 4 -1 -545 199 -58 -2591 6 -12 -551 6 -2 -740 177 -31 -1398 37 -7 -3312 52 -9 -4034 149 -39 -17611 48 -2 -82 7 -8 -3636 160 -39 -1752 7 -23 -10013 56 -15 -6984 372 -64 -28617 76 -10 -453 15 -13 -5873 324 -82 -365
Longitudinal Shear Force Demands
Bridge 512 - Ф Vn = 972 kN (219 kips)
Center bent - Middle-East Column
kips kN kips kN kips kN kips kN47.9 309 1372 -272 -1208 273 1213 -270 -1203861.9 304 1351 -282 -1254 261 1162 -269 -1198
Peru 2475
East dir. Shear
Bridge 512 - Ф Vn = 2096 kN (471 kips)
North abut South Abut.
EQ Spring Es values
West dir. Shear East dir. West dir.
Transverse Shear Force in Girder-webs at the Abutments
143

3. Bridge 5/649
EQ Spring Es values (ksf)
West dir. Shear (kips)
West dir. Shear (kN)
East dir. Shear (kips)
East dir. Shear (kN)
6000 34 152 -24 -10718000 34 151 -21 -94fixed 42 188 -22 -966000 27 122 -21 -95
18000 24 108 -21 -91fixed 25 111 -37 -1646000 21 92 -29 -129
18000 26 116 -26 -114fixed 31 136 -32 -1416000 37 166 -42 -187
18000 38 170 -33 -146fixed 45 198 -55 -2456000 39 172 -41 -182
18000 47 208 -30 -132fixed 46 206 -46 -2036000 45 199 -33 -145
18000 42 189 -33 -147fixed 51 227 -35 -1566000 36 160 -29 -127
18000 25 111 -37 -165fixed 25 112 -53 -2376000 34 153 -38 -170
18000 48 215 -36 -161fixed 41 184 -48 -2146000 87 386 -91 -405
18000 102 452 -60 -265fixed 89 395 -88 -3916000 83 371 -73 -322
18000 81 360 -89 -396fixed 102 452 -83 -369
South bent - Center Column (54 - 28)
Bridge 649 with skew - Ф Vn = 1876 kN (422 kips)
Olympia 975
Footings - Transverse Shear Force Demands
Chile 2475
Kobe 975
Mexico 975
Peru 2475
Peru 475
Kobe 475
Mexico 475
Olympia 475
Chile 475
West dir. Shear (kips)
West dir. Shear (kN)
East dir. Shear (kips)
East dir. Shear (kN)
16 72 -13 -5816 69 -11 -4934 150 -23 -10321 93 -17 -7719 85 -11 -4930 135 -19 -8522 98 -14 -6225 111 -8 -3629 129 -31 -13712 53 -29 -13023 102 -22 -9642 185 -77 -34132 144 -21 -9230 133 -25 -11054 238 -45 -20128 126 -18 -8028 122 -17 -7537 163 -34 -15237 166 -20 -8922 96 -32 -14150 223 -31 -13627 122 -15 -6425 109 -22 -9836 158 -39 -17344 195 -55 -24331 140 -57 -252106 471 -142 -63257 253 -63 -28156 251 -60 -265122 544 -91 -406
Longitudinal Shear Force Demands
Bridge 649 with skew - Ф Vn = 1876 kN (422 kips)
South bent - Center Column (54 - 28)
kips kN kips kN kips kN kips kN47.9 32 144 -23 -102 41 182 -32 -143861.9 30 132 -22 -100 38 171 -31 -13847.9 20 91 -42 -186 18 80 -27 -118861.9 22 97 -40 -177 18 79 -27 -12047.9 33 146 -29 -131 33 148 -32 -143861.9 30 132 -27 -121 29 128 -29 -13047.9 34 149 -32 -141 37 162 -43 -192861.9 29 131 -27 -120 33 148 -38 -16847.9 35 156 -27 -120 38 167 -32 -143861.9 35 156 -27 -120 38 167 -32 -143
Transverse Shear Force in Girder-webs at the Abutments
Bridge 649 - Ф Vn = 2041 kN (548.76 kips)
Chile 2475
North abut
Kobe975
Mexico 975
Olympia 975
Peru 2475
South Abut.
EQ Spring Es values
West dir. Shear East dir. West dir. East dir. Shear
144