effects of logging on dead wood habitat
TRANSCRIPT
DeaD WooD Response to thinning:some examples fRom moDeling WoRk
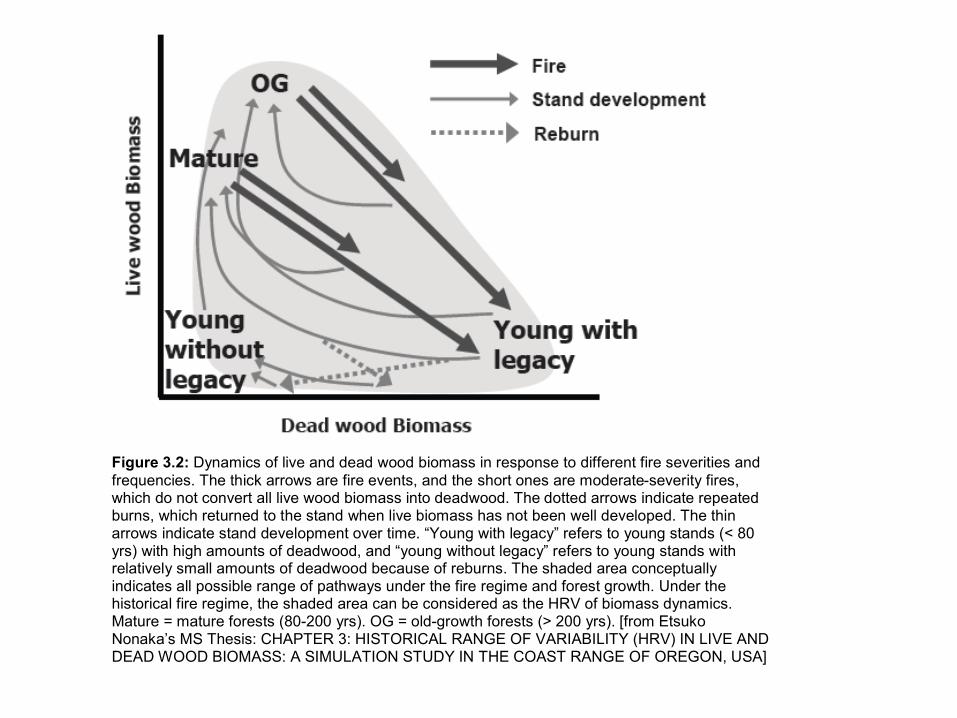
Figure 3.2: Dynamics of live and dead wood biomass in response to different fire severities and frequencies. The thick arrows are fire events, and the short ones are moderate-severity fires, which do not convert all live wood biomass into deadwood. The dotted arrows indicate repeated burns, which returned to the stand when live biomass has not been well developed. The thin arrows indicate stand development over time. “Young with legacy” refers to young stands (< 80 yrs) with high amounts of deadwood, and “young without legacy” refers to young stands with relatively small amounts of deadwood because of reburns. The shaded area conceptually indicates all possible range of pathways under the fire regime and forest growth. Under the historical fire regime, the shaded area can be considered as the HRV of biomass dynamics. Mature = mature forests (80-200 yrs). OG = old-growth forests (> 200 yrs). [from Etsuko Nonaka’s MS Thesis: CHAPTER 3: HISTORICAL RANGE OF VARIABILITY (HRV) IN LIVE AND DEAD WOOD BIOMASS: A SIMULATION STUDY IN THE COAST RANGE OF OREGON, USA]
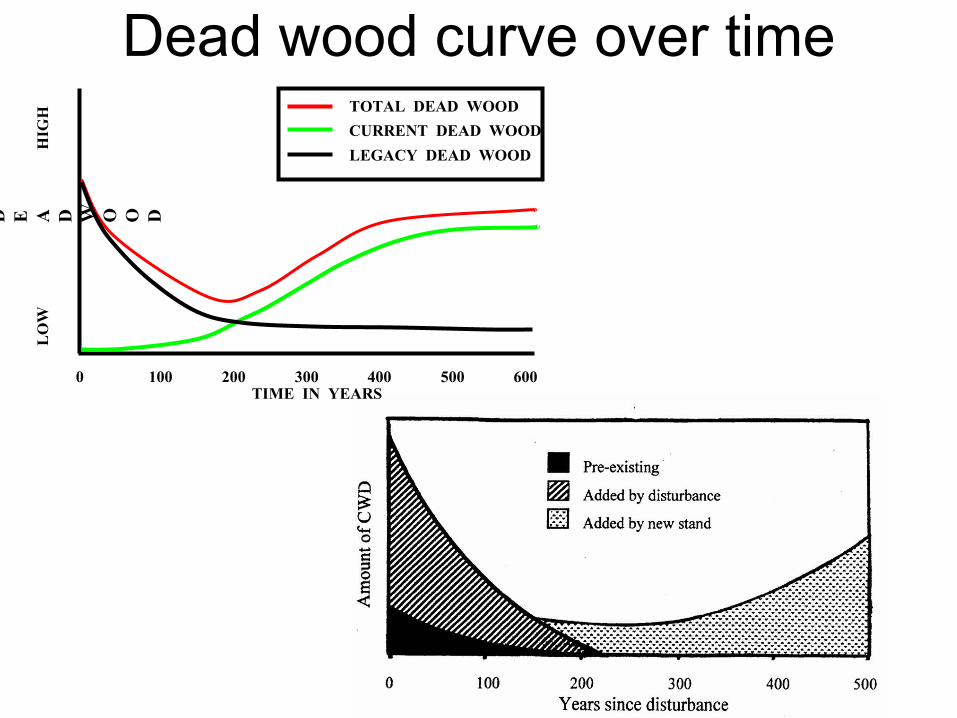
Dead wood curve over time
0 100 200 300 400 500 600 TIME IN YEARS
D E A D
W O O D
L
OW
H
IGH TOTAL DEAD WOOD
CURRENT DEAD WOOD
LEGACY DEAD WOOD

Dead Wood Accumulation
Continuous input of dead trees builds up over time even though the individual trees are decaying. If the rate of decay is constant and the rate of input is reduced the cumulative build-up is also reduced.
Image from Harmon 2008 “five points” powerpoint.
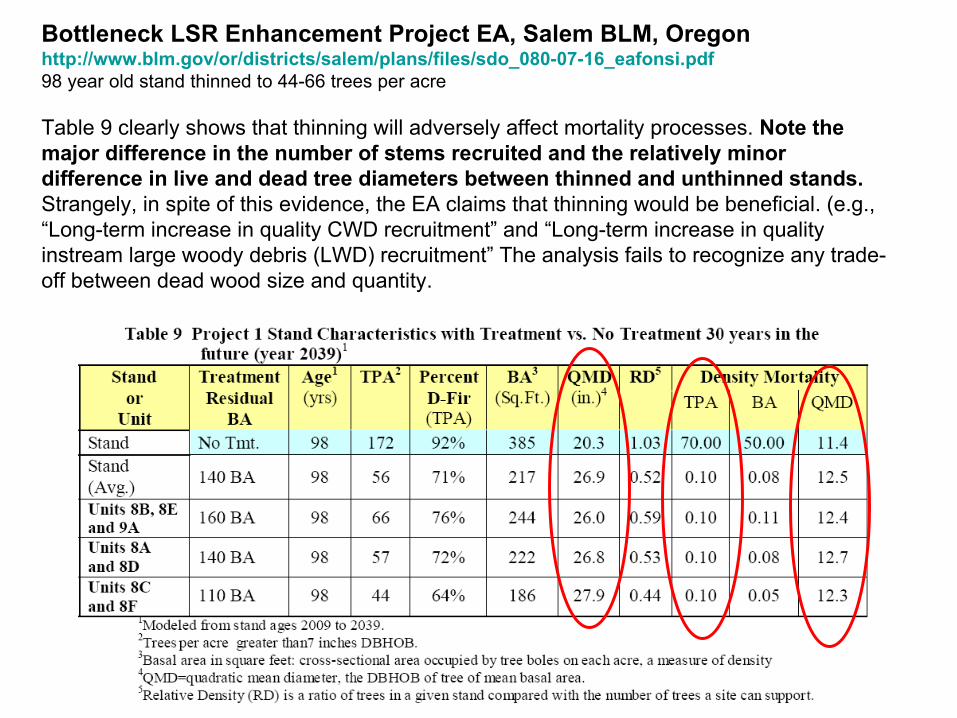
Bottleneck LSR Enhancement Project EA, Salem BLM, Oregon http://www.blm.gov/or/districts/salem/plans/files/sdo_080-07-16_eafonsi.pdf98 year old stand thinned to 44-66 trees per acre Table 9 clearly shows that thinning will adversely affect mortality processes. Note the major difference in the number of stems recruited and the relatively minor difference in live and dead tree diameters between thinned and unthinned stands. Strangely, in spite of this evidence, the EA claims that thinning would be beneficial. (e.g., “Long-term increase in quality CWD recruitment” and “Long-term increase in quality instream large woody debris (LWD) recruitment” The analysis fails to recognize any trade-off between dead wood size and quantity.

Holland Moonsalt EA Cottage Grove RDUmpqua NF, Oregon
• 40-50 year old stands thinned to 40-90 trees per acre • 400+ acres treated in riparian reserves• 50-60 ft buffers on perennial streams • No buffer on “stable” intermittentStreams• Thinning reduces recruit of small snags, large snags, and dead wood.
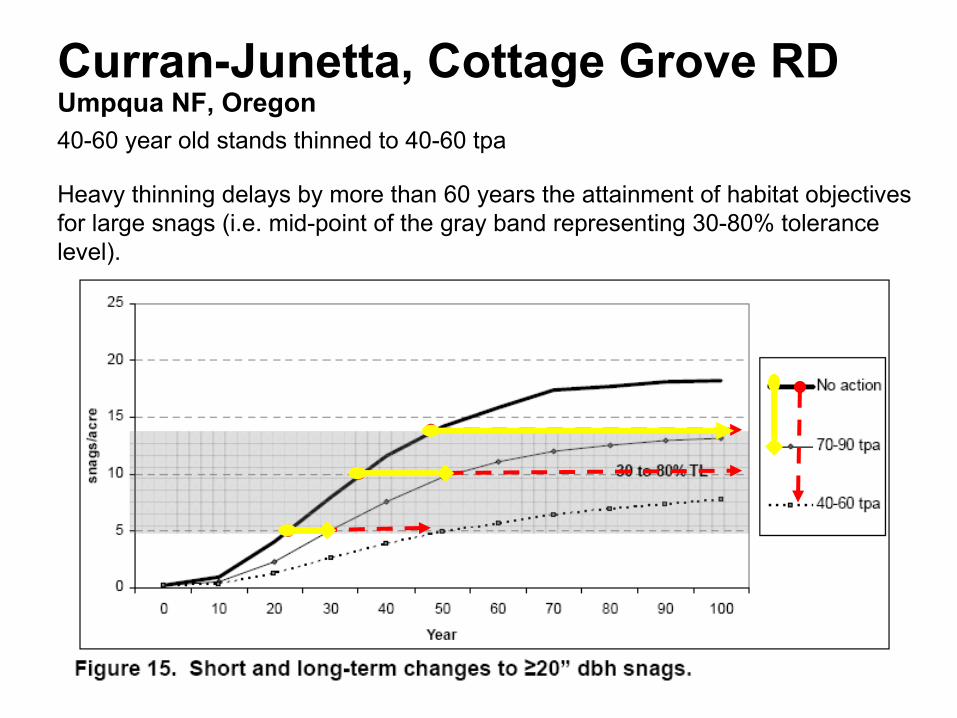
Curran-Junetta, Cottage Grove RDUmpqua NF, Oregon40-60 year old stands thinned to 40-60 tpa
Heavy thinning delays by more than 60 years the attainment of habitat objectives for large snags (i.e. mid-point of the gray band representing 30-80% tolerance level).
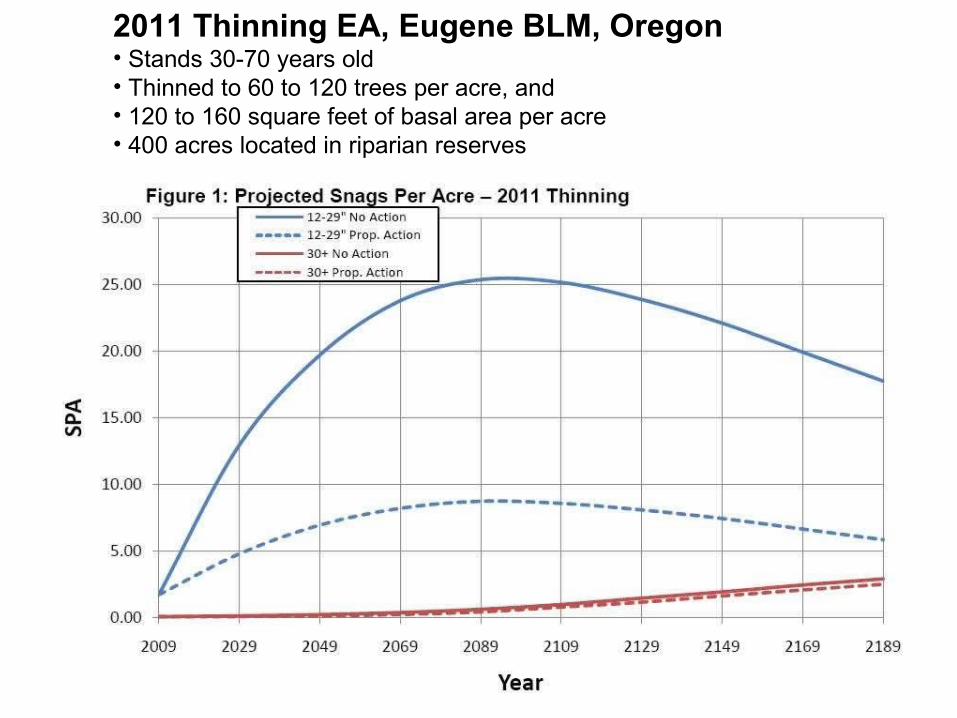
2011 Thinning EA, Eugene BLM, Oregon• Stands 30-70 years old• Thinned to 60 to 120 trees per acre, and• 120 to 160 square feet of basal area per acre• 400 acres located in riparian reserves
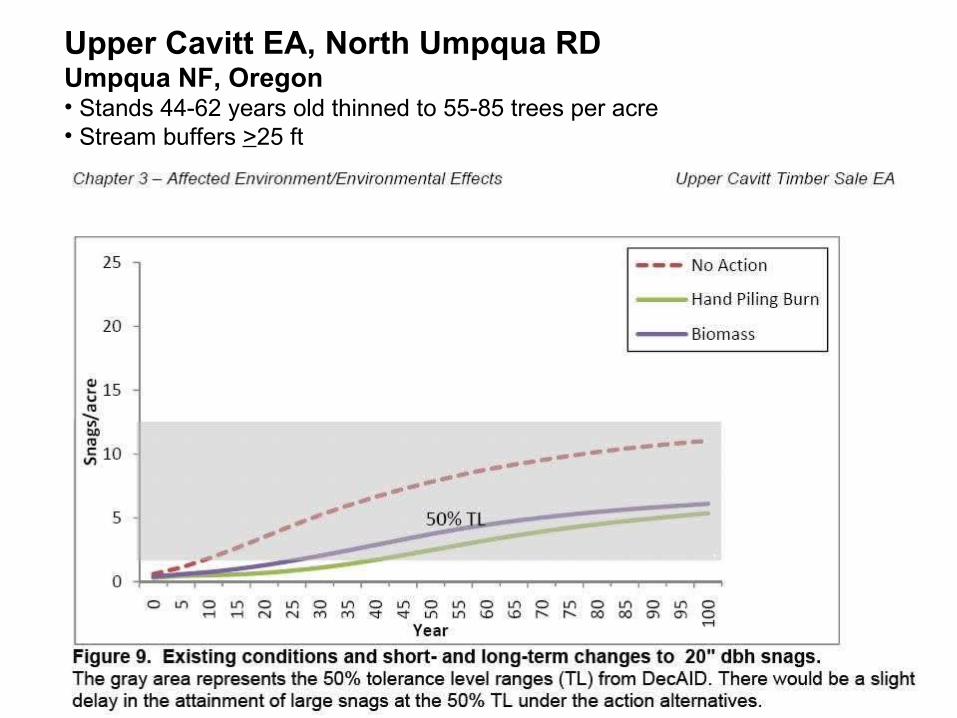
Upper Cavitt EA, North Umpqua RDUmpqua NF, Oregon• Stands 44-62 years old thinned to 55-85 trees per acre• Stream buffers >25 ft
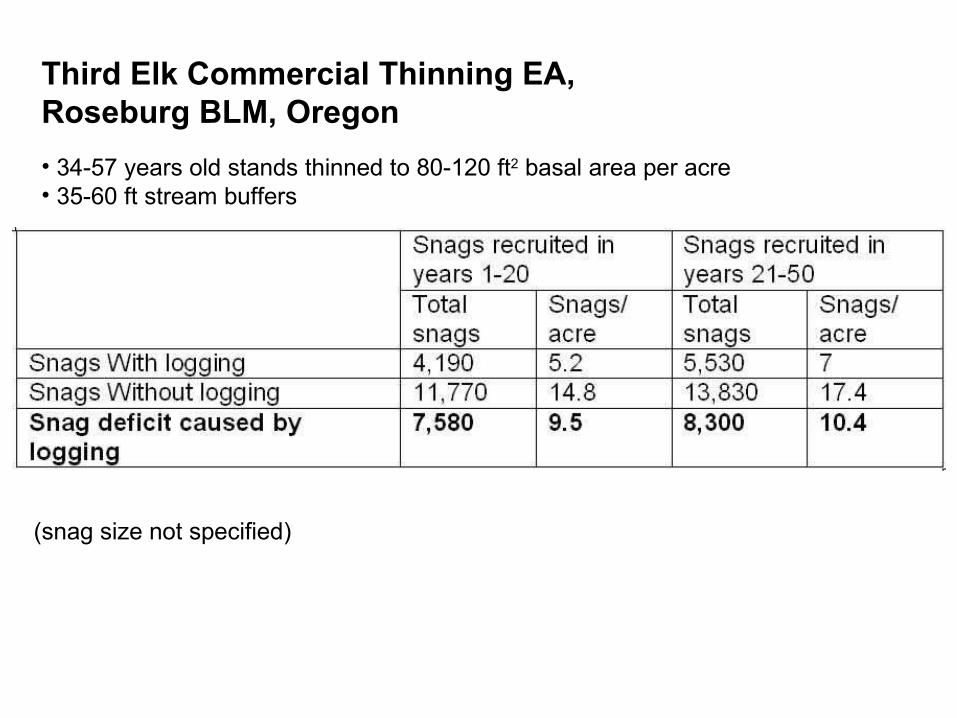
Third Elk Commercial Thinning EA, Roseburg BLM, Oregon
• 34-57 years old stands thinned to 80-120 ft2 basal area per acre • 35-60 ft stream buffers
(snag size not specified)

Garman, Steven L.; Cissel, John H.; Mayo, James H. 2003. Accelerating development of late-successional conditions in young managed Douglas-fir stands: a simulation study. Gen. Tech. Rep. PNW-GTR-557. Portland, OR: U.S. Department of Agriculture, Forest Service, Pacific Northwest Research Station. 57 p. http://www.essa.com/documents/WWETAC/VegetationModelsClimateChangeWorkshop/Gap/Garman%20et%20al%202003.pdf
“Sixty-four thinning treatments were simulated for four rotation intervals (260, 180, 100, and 80 years) starting with a 40-year-old managed Douglas-fir stand. … In general, heavy thinning of existing stands at ages 40 and 60 years promoted rapid development of large boles, vertical diversity, and tree-species diversity, but provided the least amount of extracted volume and required artificial creation of dead wood. … Natural recruitment of snags was related to thinning densities (fig. 3A). In general, the amount of time to satisfy the snag criterion decreased with decreasing thinning densities in the first entry. This was due to faster development of large boles at lower stem densities and thus a greater potential for recruitment of large snags. Also, the amount of time to satisfy this criterion decreased with increasing thinning densities in both the second and third entry. This simply reflected the tendency for more stems to die with increasing stem densities. … Snag density at stand age 260 generally increased with increasing thinning density in the first entry and somewhat with increasing thinning density in the subsequent two thinning entries. This reflected the greater source of potential snags with increasing stem density. … Developmental trends for log mass (fig. 4) were similar to those for snag density. Leaving fewer stems in the first entry but more subcanopy stems in the second and third entries generally resulted in faster accumulation of log mass. … Artificial snag recruitment was important for maintaining snag densities when thinning to 62 TPH in the last entry or 99 TPH in the second entry (fig. 7A). These thinning treatments resulted in lower rates of natural mortality of large boles and required the artificial creation of two to four snags per hectare (figs. 7B through 7D) to satisfy the snag criterion at about the same time as live criteria (fig. 6G). … Treatments providing the most rapid attainment of live, late-successional conditions (i.e., all-≤297-≥186) required artificial creation of up to six snags per hectare to satisfy the snag criterion at about the same time as the live criteria (figs. 13A through 13D). Thinning to 99 TPH at stand age 60 or to 62 TPH at age 80 tended to delay the development of large snags … Log mass tended to be limiting (fig. 17A). Even with the addition of 15 Mg/ha of logs, the log-mass threshold level could not be satisfied by age 100 in the heavy thinning regimes … The stand age when the log-mass criterion was satisfied also differed among initial stand conditions. Starting with fewer but larger canopy stems delayed satisfying the log-mass criterion by up to two decades …Management ImplicationsResults of this study illustrated two important relations between rapid development of late-successional attributes and long-term stand conditions. First, treatments that promote rapid development of an attribute will not necessarily produce the highest levels of the attribute over the course of a rotation. In this study, treatments providing rapid development of live, late-successional attributes generally produced relatively lower densities of shade-tolerant stems, lower amounts of Douglas-fir basal area, and fewer snags and logs over a rotation compared to other treatments.”

Abundance of forest types with various combinations of live and dead wood relative to historic mean values derived from multiple 1,000 year simulations. Based on Table 3.4 in Nonaka, E, Spies, TA, Wimberly, MC, and Ohmann, JL. Historical range of variability (HRV) in live and deadwood biomass: a simulation study in the Coast Range of Oregon, USA.