effects of irrigating with treated oil and gas product ... library/research/oil-gas/nt0005681... ·...
TRANSCRIPT

Effects of Irrigating with Treated Oil and Gas Product Water on Crop Biomass and Soil Permeability
FINAL TECHNICAL REPORT
Prepared By Terry Brown, Jeffrey Morris, Patrick Richards and Joel Mason Western Research Institute October 1, 2008 to September 1, 2010 DOE Award Number: DE-NT0005681 Report Issued December, 2010 Western Research Institute 365 N 9th Street Laramie WY 82072
ii
DOE DISCLAIMER
This report was prepared as an account of work sponsored by an agency of the United States Government. Neither the United States Government, nor any agency thereof, nor any of their employees makes any warranty, express or implied, or assumes any legal liability or responsibility for the accuracy, completeness, or usefulness of any information, apparatus, product, or process disclosed or represents that its use would not infringe privately owned rights. Reference herein to any specific commercial product, process, or service by trade name, trademark, manufacturer, or otherwise does not necessarily constitute or imply its endorsement, recommendation, or favoring by the United States Government or any agency thereof. The views and opinions of authors expressed herein do not necessarily state or reflect those of the United States Government or any agency thereof.

iii
ACKNOWLEDGEMENTS
The authors are grateful to the co-sponsors EMIT Water Discharge Technology an Exterran Water Management Services Company for conducting water treatment using the EMIT’s Electrodialysis Reversal (EDR) and Cation (CIX)/Anion (AIX) fixed bed pilot systems and MWH for support conducting water treatment using Reverse Osmosis (RO).
iv
ABSTRACT
Demonstrating effective treatment technologies and beneficial uses for oil and gas produced water is essential for producers who must meet environmental standards and deal with high costs associated with produced water management. Proven, effective produced-water treatment technologies coupled with comprehensive data regarding blending ratios for productive long-term irrigation will improve the state-of-knowledge surrounding produced-water management. Effective produced-water management scenarios such as cost-effective treatment and irrigation will discourage discharge practices that result in legal battles between stakeholder entities. The goal of this work is to determine the optimal blending ratio required for irrigating crops with CBNG and conventional oil and gas produced water treated by ion exchange (IX), reverse osmosis (RO), or electro-dialysis reversal (EDR) in order to maintain the long term physical integrity of soils and to achieve normal crop production.
The soils treated with CBNG produced water were characterized with significantly lower SAR values compared to those impacted with conventional oil and gas produced water. The CBNG produced water treated with RO at the 100% treatment level was significantly different from the untreated produced water, while the 25%, 50% and 75% water treatment levels were not significantly different from the untreated water. Conventional oil and gas produced water treated with EDR and RO showed comparable SAR results for the water treatment technologies. There was no significant difference between the 100% treated produced water and the control (river water). The EDR water treatment resulted with differences at each level of treatment, which were similar to RO treated conventional oil and gas water. The 100% treated water had SAR values significantly lower than the 75% and 50% treatments, which were similar (not significantly different).
The results of the greenhouse irrigation study found the differences in biomass production between each soil were significant for Western Wheatgrass and Alfafla. The Sheridan sandy loam soil resulted in the highest production for western wheatgrass and alfalfa while the X-ranch sandy loam had the lowest production rate for both plants. Plant production levels resulting from untreated CBNG produced water were significantly higher compared to untreated conventional oil and gas produced water. However, few differences were found between water treatments.
The biomass produced from the greenhouse study was analyzed for elemental composition and for forage value. Elemental composition indentified several interesting findings. Some of the biomass was characterized with seemly high boron and sodium levels. High levels of boron found in some of the biomass was unexpected and may indicate that alfalfa and western wheatgrass plants may have been impacted by either soil or irrigation water containing high boron levels. Plants irrigated with water treated using EDR technology appeared to contain higher levels of boron with increased levels of treatment. Forage evaluations were conducted using near infrared reflectance spectroscopy. The data collected show small differences, generally less than 10%, between produced water treatments including the no treatment and 100% treatment conditions for each plant species

v
studied. The forage value of alfalfa and western wheatgrass did not show significant tendencies dependent on soil, the amount of produced water treatment, or treatment technology.

vi
TABLE OF CONTENTS Contents Page
ABSTRACT ........................................................................................................................... iv
LIST OF TABLES ............................................................................................................... vii
LIST OF FIGURES ............................................................................................................ viii
EXECUTIVE SUMMARY .................................................................................................. ix
INTRODUCTION.................................................................................................................. 1
OBJECTIVES .................................................................................................................... 7
RESULTS .................................................................................................................. 10
SUMMARY .................................................................................................................. 24
CONCLUSIONS .................................................................................................................. 42
REFERENCES .................................................................................................................. 44
APPENDICES .................................................................................................................. 45
Appendix A. Laboratory Data Generated During Hydraulic Conductivity Determination ......................................................................................... 46
Appendix B. Statistical Evaluation of the Hydraulic Conductivity Data .................... 65
Appendix C. Statistical Evaluations of the SAR and EC of Samples Used in the Hydraulic Conductivity Evaluations ................................................ 67 Appendix D. Biomass Production Data by Irrigation Treatment ................................. 73 Appendix E. Statistical Evaluation of Biomass Production Data by Irrigation Treatment ............................................................................... 85 Appendix F. Elemental Analysis of Biomass .............................................................. 88

vii
LIST OF TABLES Table Page 1. Laboratory Results for CBNG Produced Water Treated with IX ........................... 12
2. Laboratory Results for CBNG Produced Water Treated with RO ......................... 13
3. Laboratory Results for EDR Treatment of Conventional Source Produced Water ....... 14
4. Laboratory Results for Conventional Oil and Gas Produced Water Treated with RO ... 15
5. Hydraulic Conductivity of Soil Treated with Treated Water.................................. 17
6. Coalbed Natural Gas (CBNG) Produced Water Treated with RO and IX at Various Levels of Treatment .................................................................................. 22
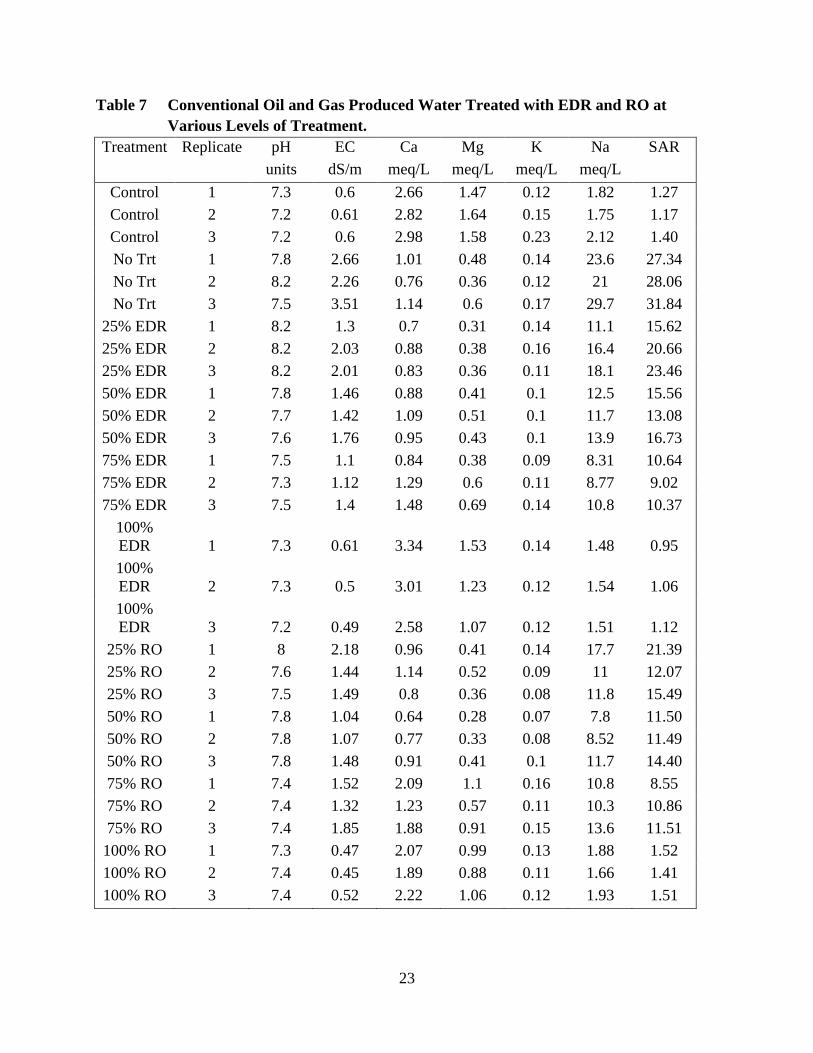
7. Conventional Oil and Gas Produced Water Treated with EDR and RO at Various Levels of Treatment .................................................................................. 23
8. Alfalfa Biomass Production Using Treated Produced Water from CBNG and Oil and Gas Wells for Irrigation....................................................................... 26
9. Western Wheatgrass Biomass Production Using Treated Produced Water from CBNG and Oil and Gas Wells for Irrigation .................................................. 27
10. Forage Quality for Alfalfa and Western Wheatgrass Grown on the Riverton Soil Irrigated with Conventional Oil and Gas Produced Water Treated with EDR and RO; and CBNG Produced Water Treated with IX and RO .................................... 39
11. Forage Quality for Alfalfa and Western Wheatgrass Grown on the Sheridan Soil Irrigated with Conventional Oil and Gas Produced Water Treated with EDR and RO; and CBNG Produced Water Treated with IX and RO ............................................... 40
12. Forage Quality for Alfalfa and Western Wheatgrass Grown on the X-Ranch Soil Irrigated with CBNG Produced Water Treated with IX and RO ............................ 41

viii
LIST OF FIGURES
Figure Page
1. Gas and Produced Water Production and Producing Wells in the Powder River Basin, Wyoming ................................................................................ 1
2. Distribution of Produced Water SAR Values in the PRB. (FEIS Jan. 2003) ........... 3
3. CBNG Produced Water Process Flow Diagram ..................................................... 11
4. Conventional Oil and Gas Produced Water Process Flow Diagram....................... 12
5. Flexible-walled Permeameter Apparatus ................................................................ 16
6. Percent Germination for Alfalfa for the Nineteen (19) Treatments ........................ 25
7. Percent Germination for Western Wheatgrass for the Nineteen (19) Treatments.......... 25
8. Alfalfa Production Using Treated CBM Produced Water for Irrigating Three (3) Soils – Riverton, Sheridan and X-Ranch Sampling Sites ....................... 29
9. Alfalfa Production Using Treated Oil and Gas Produced Water for Irrigating Three (3) Soils – Riverton, Sheridan and X-Ranch Sampling Sites ....................... 30
10. Alfalfa Growing in Sheridan Soil Irrigated with O&G Produced Water Treated with EDR at Various Combinations .......................................................... 32
11. Alfalfa Growing in Sheridan Soil Irrigated with CBM Produced Water Treated with RO at Various Combinations ............................................................. 33
12. Western Wheatgrass Production Using Treated CBM Produced Water for Irrigating Three (3) Soils – Riverton, Sheridan and X-Ranch Soils ....................... 35
13. Western Wheatgrass Production Using Treated Conventional Oil and Gas Produced Water for Irrigating Three (3) Soils – Riverton, Sheridan and X-Ranch Sampling Sites ......................................................................................... 36
14. Western Wheatgrass Growing in Sheridan Soil Irrigated with O&G Produced Water Treated with EDR at Various Combinations ............................... 36
15. Western Wheatgrass Growing in Sheridan Soil Irrigated with CBM Produced Water Treated with RO at Various Combinations .................................................. 37
ix
EXECUTIVE SUMMARY
Demonstrating effective treatment technologies and beneficial uses for oil and gas produced water is essential for producers who must meet environmental standards and high costs associated with produced water management, and thus, maintain safe and efficient oil and gas production in the US. Proven, effective produced-water treatment technologies coupled with comprehensive data regarding blending ratios for productive long-term irrigation will improve the state-of-knowledge surrounding produced-water management in the west and other regions. This newly gained knowledge will help managers find beneficial uses of the produced water that will provide an economic return in the form of crop production that uses a windfall water source that would otherwise be managed as a contaminant stream at an additional cost to the producer. Irrigating with treated produced water will also ensure that the cropland remains viable and productive once extraction projects have ended and irrigation resumes using traditional irrigation sources or a dry-land ecosystem relying on natural precipitation. Irrigating with produced water will also relieve some of the water-volume strains on natural streams and rivers in areas like the PRB where water quantity sometimes causes more problems than poor water quality. Furthermore, effective produced-water management scenarios such as cost-effective treatment and irrigation will discourage discharge practices that result in legal battles between stakeholder entities.
The goal of this work is to determine the optimal blending ratio required for irrigating crops with produced water treated with various pretreatment methods followed by ion exchange (IX) reverse osmosis (RO) or electro-dialysis reversal (EDR) in order to maintain the long term physical integrity of representative soils from the Powder River Basin (PRB) and achieve normal crop production.
This project will use two (2) treatment trains to clean oil and gas produced water: (1) physiochemical pretreatment (DAF + organo-clay) followed by DT RO or (2) physiochemical pretreatment (DAF + organo-clay) followed by EDR to reduce organic and inorganic constituent loads in oil and gas produced water. The treatment of CBNG produced water will be evaluated using DT RO and IX (EMIT Technology) without a pretreatment to remove oil and other hydrocarbons. The potential benefit of these treatments will be the ability to process high volumes of poor quality water with limited membrane fouling, thus, reducing O&M costs of treating produced water using processes already established for other water treatment applications. Potential inadequacies of using IX, RO and EDR technologies for treating produced water are the lack of robust data describing the performance of such treatments under demanding on site water quality and climactic conditions.
x
Hydraulic conductivity (HC) values for the X-Ranch soil irrigated with various combinations of treated CBNG produced water and conventional oil and gas produced water treated with various technologies were determined using flexible-walled permeameters.
Limited differences exist in the HC of soils impacted with treated and untreated CBNG produced water. Produced water treated using the IX and RO technologies at the 100% level was found to be similar to the control (river water), while the treatment levels of 25%, 50% and 75% resulted in significantly lower HC values that compared well to the values associated with untreated produced water.
The HC data collected for conventional oil and gas produced water showed no improvement in HC over untreated produced water for all levels of treatment. Water treatment did not appear to improve HC for oil and gas produced water.
Soils used in the hydraulic conductivity study were evaluated at the conclusion of the study to determine how the irrigation water impacted the chemistry of the material. The primary parameters of concern were EC and SAR. In general, the soils impacted by the CBNG produced water and the conventional oil and gas produced waters did not have a significant impact on the EC values of the soils. The resulting EC values from all treatments would not be expected to significantly impact plant growth. The only concern would be whether or not the EC values were high enough to prevent dispersion of clays due to the corresponding high SAR values. However, the SAR values associated with the treated produced waters were relatively low in all cases and would not be expected to cause dispersion.
The soils treated with CBNG produced water were characterized with significantly lower SAR values compared to the conventional oil and gas water. The CBNG produced water treated with RO at the 100% treatment level was significantly different from the untreated produced water while the 25%, 50% and 75% water treatment levels were not significantly different from the untreated water. Conventional oil and gas produced water treated with EDR and RO showed comparable SAR results for the water treatment technologies. There was no significant difference between the 100% treated produced water and the control (river water) with the use of EDR and RO. The EDR water treatment resulted with differences at each level of treatment as the SAR of the 25% treatment was significantly higher than the 50% treatment, the 50% treatment was significantly higher compared to the 75% treatment and the 75% treatment was higher compared to the 100% treatment. Similar results characterized the RO treated conventional oil and gas water. The 100% treated water had SAR values significantly lower than the 75% and 50% treatments, which were similar (not significantly different). The 25% treatment resulted in SAR values significantly higher than the 50% and 75% water treatments.
Germination results show that produced water from both CBNG and conventional oil and gas production did not significantly impact germination rate. In fact germination rate appeared to be somewhat less in the control (river water) compared to that determined for raw produced
xi
waters. Differences are apparent between several of the treatments for alfalfa and western wheatgrass germination. However, variation between replicates was found to be rather high resulting in no significant differences in germination of alfalfa and western wheatgrass seeds when watered with the 19 water treatments.
The results of the greenhouse irrigation study found the differences in biomass production between each soil were significant for Western Wheatgrass and Alfafla. The Sheridan sandy loam soil resulted in the highest production for western wheatgrass and alfalfa while the X-ranch sandy loam had the lowest production rate for both plants. Plant production levels resulting from untreated CBNG produced water were significantly higher compared to untreated conventional oil and gas produced water. However, few differences were found between water treatments. For example, CBNG produced water treated with ion exchange resulted in no significant difference in western wheatgrass production for the 25%, 50%, 75% and 100% treatment blends. The use of RO treated CBNG produced water for irrigation resulted in a significantly lower level for the 100% treated produced water compared to the 25% blend. The lower production level associated with the 100% treated water is likely associated with either a plant toxicity or nutritional imbalance caused by the treatment. The produced water treated using EDR technology generated high western wheatgrass production compared to that resulting from the RO technology. However, the plant production levels associated with EDR did not differ significantly based on the level of treatment.
The biomass produced during the greenhouse study was analyzed for elemental composition and for forage value. Samples from each replication were composited to acquire enough sample for analysis, as a result, treatment replications were not established and a statistical evaluation was not completed. Elemental composition indentified several interesting findings. Some of the biomass was characterized with seemly high boron and sodium levels. High levels of boron found in some of the biomass was unexpected and may indicate that alfalfa and western wheatgrass plants may have been impacted by either soil or irrigation water containing high boron levels. It appeared that water treatment technology had an impact on the amount of boron that plants accumulated in their biomass. Plants irrigated with water treated using EDR technology appeared to contain higher levels of boron with increased levels of treatment. This finding was the opposite effect found for sodium levels.
Forage evaluations were conducted using near infrared reflectance spectroscopy. The data collected show small differences, generally less than 10%, between produced water treatments including the no treatment and 100% treatment conditions for each plant species studied. The forage value of alfalfa and western wheatgrass did not show significant tendencies dependent on either soil, the amount of produced water treatment, or treatment technology.

xii
Some differences in crude protein content of biomass may exist for the Sheridan soil dependent on the percentage of water treatment.
1
INTRODUCTION
With the current price of natural gas and its strong demand, the continued development of the coalbed methane (CBM) industry in the PRB is a certainty. Coalbed methane reserves in the PRB represent a major recent play for the industry and are of great importance to the region and the nation. CBM reserves are estimated at over 25 trillion cubic feet in the PRB of Wyoming and Montana alone. This is equivalent to the gas reserves of the Gulf Coast. However, according to the Final Environmental Impact Statement (January, 2003), an anticipated 51,000 wells are expected to be in service within ten years.
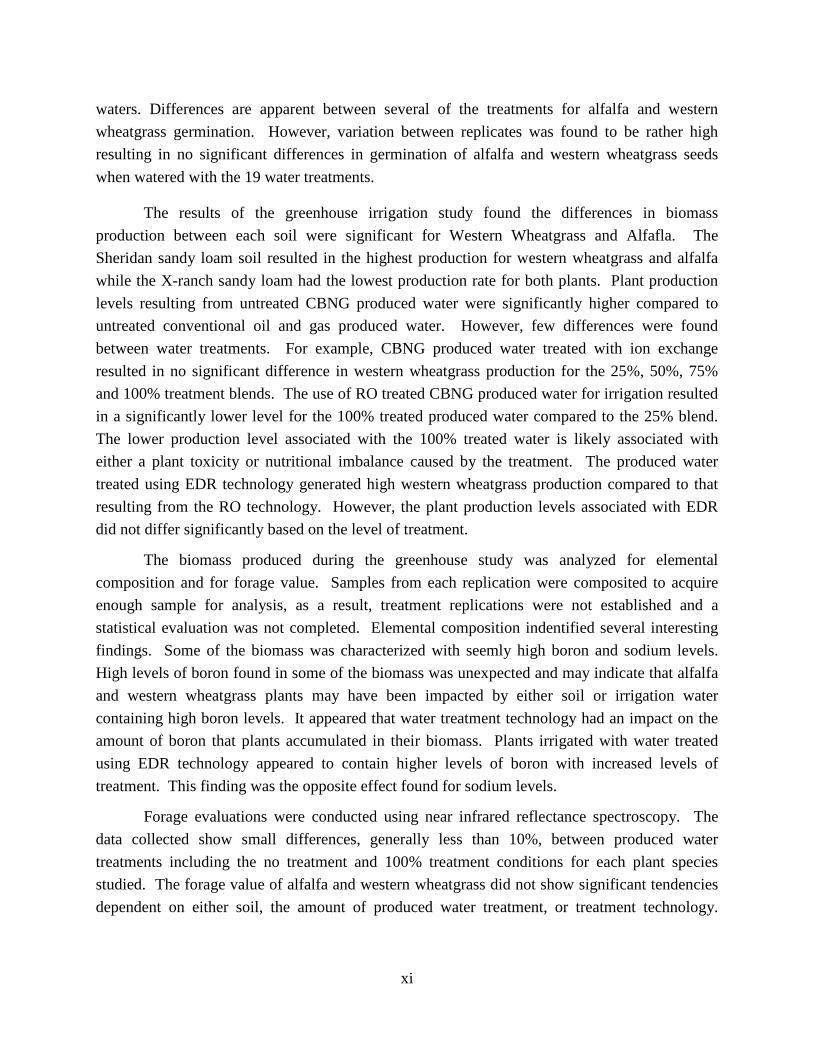
There are a number of issues that face the CBM industry, foremost of which is associated with the vast water quantities associated with CBM production. Large quantities of CBM produced water are being discharged as part of the process of releasing gas from coal seams. The excess produced water is causing concerns from several points of view. The drawdown of water in the coal aquifers is causing concerns from landowners and others, who are worried about the availability of water for future generations. In addition, there is concern as to how to use the water in worthwhile, environmentally sound applications. Significant quantities of produced water are anticipated with estimates of over three million acre feet being produced over the next ten years and an estimated 4-8 trillion gallons over the potential 30-35 years of the PRB CBM play (FEIS, 2003). The number of producing wells and the volume of produced water has increased in recent years in the PRB while total gas production has remained relatively constant (Figure 1).
Figure 1 Gas and Produced Water Production and Producing Wells in the Powder
River Basin, Wyoming. Figure Made using Data from the Wyoming Oil and Gas Commission Statistics (http://wogcc.state.wy.us).
The practice of discharging large volumes of water into drainage channels or using it to irrigate rangeland areas has the potential to cause problems with regard to salinity and sodicity of
2
soils. The primary problems associated with salinity are related to the ability of plants to take up water to facilitate the biochemical processes of photosynthesis and plant growth. As the solution electrolyte concentrations of soil increase, plants will become less able to absorb sufficient volumes of water. As a result, the plants are not able to function at high levels and will grow at slow rates or die. The major impact of sodicity on soils is associated with soil structure. Soil structure is important to maintain the flow of gases (oxygen) and solution (water plus nutrients) to the plant roots. Poor soil structure can cause severe erosion of once-productive soils. High levels of sodium can cause the structure of a soil to completely disperse.
An important aspect of the sodicity and salinity chemistry of soils is that the two are closely related. For example, a highly sodic (high sodium adsorption ratio (SAR)) soil can maintain its soil structure if the salinity level (electrical conductivity (EC)) of the soil is high. However, if the salinity level is low, a highly sodic soil will slake and disperse and the structure will be lost. If a soil is characterized by a low SAR, the application of clean water or water characterized by low EC can cause degradation of soil structure. If the electrolyte concentration of the water applied to the soil is high, the soils will maintain their structure.
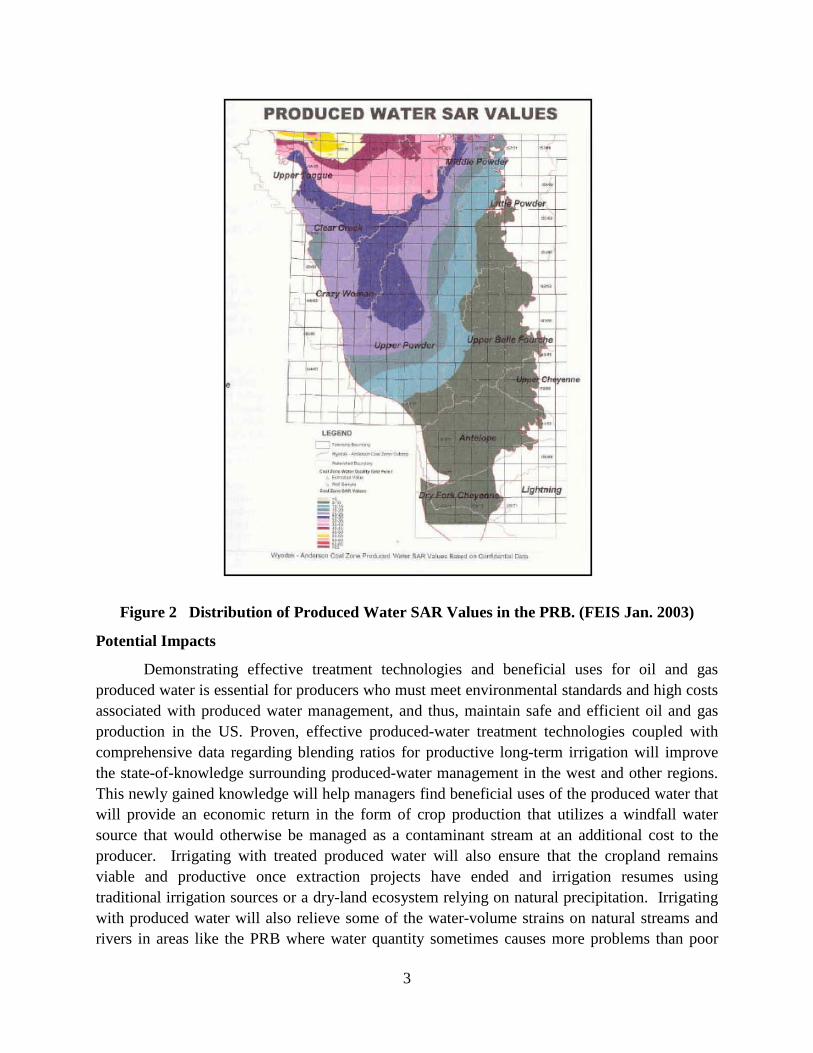
Some waters currently being disposed of in the PRB are of such quality that land application should not cause any significant problems. However, there is evidence that some of the CBM-produced waters will cause problems with salinity and sodicity in soils. The geographical distribution of SAR values for the CBM waters within the PRB are shown in Figure 2. The SAR values increase to the north and west. In fact, the Big George coal seam, the next big play, is expected to produce higher water discharge/quantity of gas and very poor quality (very high SAR) water.
One dilemma with produced water management is to make sure that water applied to soils meets the favorable combination of salinity and sodicity that will allow plants to grow at good production levels and maintain the structure of soils. Each soil will react differently to the chemistry of the water applied and the method of application. Therefore, research is necessary to (1) understand these interactions in order to develop improved irrigation practices and (2) assess long-term consequences of irrigation on salt movement, loading and plant productivity in order to assess CBM producer liabilities.
3
Figure 2 Distribution of Produced Water SAR Values in the PRB. (FEIS Jan. 2003)
Potential Impacts
Demonstrating effective treatment technologies and beneficial uses for oil and gas produced water is essential for producers who must meet environmental standards and high costs associated with produced water management, and thus, maintain safe and efficient oil and gas production in the US. Proven, effective produced-water treatment technologies coupled with comprehensive data regarding blending ratios for productive long-term irrigation will improve the state-of-knowledge surrounding produced-water management in the west and other regions. This newly gained knowledge will help managers find beneficial uses of the produced water that will provide an economic return in the form of crop production that utilizes a windfall water source that would otherwise be managed as a contaminant stream at an additional cost to the producer. Irrigating with treated produced water will also ensure that the cropland remains viable and productive once extraction projects have ended and irrigation resumes using traditional irrigation sources or a dry-land ecosystem relying on natural precipitation. Irrigating with produced water will also relieve some of the water-volume strains on natural streams and rivers in areas like the PRB where water quantity sometimes causes more problems than poor

4
water quality. Furthermore, effective produced-water management scenarios such as cost-effective treatment and irrigation will discourage discharge practices that result in legal battles between stakeholder entities.
Summary of Existing Treatment Technologies
Produced water is a byproduct from oil or gas producing wells. Every year, about 14 to 18 billion barrels of produced water is generated from on-shore oil and gas production in the U.S. alone (Veil et al. 2004). The volume of produced water from oil and gas wells changes over time and the water:oil/gas ratio usually increases over the lifetime of a well.
Produced water generally contains free phase oil (droplets), suspended solids, and dissolved organics and inorganics (e.g., total petroleum hydrocarbons, BTEX, fatty acids, salts, sodium chloride, and metals). Some of these constituents are toxic, and improper disposal of produced water can result in soil, water, and air contamination.
Common disposal practices for produced water management include surface impoundment, use for dust suppression on roads, reuse for production processes, surface/subsurface irrigation, surface discharge, and subsurface injection. For example, in the gas industry, typically 60 to 90% of produced water is injected into the subsurface during well drilling, fracturing, or disposal (Hayes and Arthur 2004), while the rest is evaporated or land applied on-site, or transported and disposed of off-site.
Comprehensive treatments are usually needed to remove suspended solids, free oil, and volatile organics compounds (VOCs) before the produced water is discharged, injected, or consumed. For example, for underground injection, scaling from calcium carbonate and barium sulfate, excessive solids, corrosion and biomass need to be controlled to prevent plugging of subsurface formations. Conventional treatment technologies for oil removal include oil water separators, corrugated plate separators, centrifugation, hydrocyclone separation, and gas floatation with or without chemical addition. Corrugated plate separators, centrifugation, hydrocyclone separation and gas floatation are also widely used for solids separation with chemical enhanced treatment (Interstate Oil and Gas Compact Commission and ALL Consulting 2006). These technologies have been applied by the oil and gas industry with relatively low capital investment. Effluents from these treatments usually meet water quality requirements for surface impoundment and subsurface injection.
Other technologies that have been utilized to treat produced water include filtration, constructed wetlands, freeze and thaw separation, and ion exchange. These methods are usually limited to relatively low flow rates and can be influenced by the local climate. For example, filtration methods such as packed bed adsorption, which use activated carbon, organo clay and other sorbents, are usually limited by flow rate and pressure drop (<10 gpm and 10 psi pressure drop) through the bed.
Solvent extraction, sorbent adsorption and membrane separation are recently developed technologies for produced water treatment (Interstate Oil and Gas Compact Commission and ALL Consulting 2006). Due to high operation and maintenance (O&M) costs, the use of solvent
5
extraction and sorbent adsorption are limited. Micro or ultra-filtration (MF or UF) membrane technologies can effectively remove dispersed and emulsified oil, as well as suspended solids from produced water, however, the conventional membranes used are susceptible to fouling by suspended solids and organics in the produced water. Cleaning of such fouling is difficult and costly.
Enhanced biological treatment technologies such as fluidized bed bioreactors and membrane bioreactors have been successfully used in refinery industries to eliminate organic compounds in process wastewater to meet effluent discharge limits (Hayes and Arthur 2004). However, biological treatment processes are susceptible to large flow fluctuations and variations in organic contents. Factors such as temperature and metals in the produced water may also limit the performance of biological treatment technologies.
Ceramic ultrafiltration is a newly emerging technique that can remove large organic molecules such as oil and grease, dissolved hydrocarbons, proteins, large colloidal particles, and some microorganisms. It can tolerate high variations in concentrations of suspended solids and oil and grease in the produced water. Ceramic UF can also be cleaned with chemicals that do not compromise membrane performance, which is critical for waste streams with variable quality or a high propensity for membrane fouling (Ashaghi et al. 2007).
Electrodialysis (ED) relies on cationic (positive) and anionic (negative) movements of ions that are induced by an electrical field generated by cathode and anode electrodes. In ED, ion selective membranes are placed between a pair of electrodes. A spacer sheet that permits feed water to flow along the face of the membrane is placed between each pair of membranes. Positively charged ions migrate toward the cathode and negatively charged ions migrate toward the anode. During migration the charged ions are rejected by similarly charged ion exchange membranes. As a result, water within the alternate compartment becomes concentrated, leaving desalinated water within the effluent compartment of the ED unit. The concentrate and desalinated water are continuously removed from the unit in a flow-through system. Pilot studies of electrodialysis of produced water (Miller et al. 1997) demonstrated that electrodialysis may be cost effective for reducing TDS when it is less than 10,000 mg/L, achieving an effluent TDS of < 2,500 mg/L. The process of electrodialysis reversal (EDR) operates on the same principle as ED except that the polarity of the electrodes is periodically reversed to push anions and cations back through the ion exchange membranes into the main channel to back flush and extend the life of the membranes.
Reverse osmosis (RO) technology has been successfully used for sea water desalination for more than 30 years. Bench and pilot studies using the RO process for produced water treatment have produced mixed results due to the high organic content of the produced water, scaling constituents, and fine particles present in the produced water that tend to foul RO membranes within a short time. Therefore, a well designed pretreatment process is critical for RO treatment of produced water. Cakmakci et al. (2008) concluded that a combination of sedimentation, oil-water separation, dissolved air floatation (DAF), and ceramic MF are among common pretreatment options. Bench and pilot scale packages including pretreatment and RO
6
have been tested for treating oil produced water (Burnett and Siddiqui 2006). These packages include centrifugation, organo-clay adsorption, MF, and UF membrane separation followed by RO. The system showed >50% water recovery and the effluent was used for agricultural irrigation. The RO membrane used in those studies was of conventional spiral wound configuration, which contains spaces that tend to host biological growth and trigger membrane fouling, adversely affecting the system flow and performance (Siler 1993). Consequently, spiral wound membranes need extensive cleaning and regeneration maintenance restore and maintain high performance.
Recently, a new disk tube (DT) module membrane for RO separation was developed in Switzerland and Germany. Siler (1993) compared the DT module with a conventional spiral wound module in a controlled study and results indicate that the DT module achieved a 30% higher in flux than the spiral wound module. Furthermore, the DT module can be cleaned and restored with a single flush of 1% sodium hydroxide, while the spiral wound module needs two flushes of special chemicals, resulting in higher O&M costs.
This DT RO technology has been used to treat landfill leachate containing elevated TDS, organics and trace metals. The U.S. Environmental Protection Agency evaluated this technology in landfill leachate treatment applications and reported that “…the DT module technology was very effective in removing contaminants from the landfill leachate” (EPA 1998). The removal rate for total organic carbon (TOC), TDS, total metals, and VOCs were 97, 99, 99, and 90%, respectively. The water recovery rate from DT RO was 73% and membrane cleaning was easily achieved.
A DT RO system for landfill treatment was installed in Japan in 1999 and it maintained the expected performance during a 2.5-year test treating high salinity water containing highly-scaling ions (Ushikoshi et al. 2002). Additionally, a full scale DT RO was installed in China for treating landfill leachate and was determined to perform well (Liu et al. 2008).
Technologies to be Tested
This project will utilize two treatment trains to clean oil and gas produced water: (1) physiochemical pretreatment (DAF + organo-clay) followed by DT RO or (2) physiochemical pretreatment (DAF + organo-clay) followed by EDR to reduce organic and inorganic constituent loads in oil and gas produced water. The potential benefit of either treatment train will be the ability to process high volumes of poor quality water with limited membrane fouling, thus, reducing O&M costs of treating produced water using processes already established for other water treatment applications. Potential inadequacies of using RO and EDR technologies for treating produced water are the propensity for membrane fouling and the lack of robust data describing the performance of such treatment trains under demanding on site water quality and climactic conditions.
Development Strategies
Large volumes of produced water, lack of injection sites, and complicated regulatory permitting processes warrant the use of alternative produced water treatment technologies that
7
can treat produced water and meet requirements for surface discharge or beneficial uses such as irrigation and livestock consumption. Although produced water from the oil and gas industry is similar to landfill leachate in terms of TDS and a high scaling potential, technologies such as DT RO and EDR have yet to be thoroughly evaluated for produced water treatment. Therefore, a determination of how these technologies perform in conjunction with pretreatment technologies for treatment of oil and gas produced water is necessary. The potential for high volume through put using these treatment systems make them attractive for produced water management if membrane fouling can be mitigated. This research project will address pretreatment options for limiting membrane fouling as well as optimal blends of treated and untreated water for irrigation.
Successful applications of new technologies such as DT RO and EDR in produced water treatment will help the oil and gas industry reduce environmental impacts during production, realizing beneficial use of produced water in areas where the water supply is limited, such as in the western US. It will also sustain expanded exploration and production of oil and gas from existing operations. This project will provide insight on the logistics and economics of treating produced water with the aforementioned treatment trains as well as optimal blending ratios of treated water with untreated water for irrigation. Additionally, we expect the data obtained regarding optimal water blends to maintain high crop quality/yields as well as good soil permeability will be readily extrapolated to other water treatment methods currently in use such as ion exchange.
OBJECTIVES
The goal of this work is to determine the optimal blending ratio required for irrigating crops with produced water treated with various pretreatment methods followed by reverse osmosis (RO) or electro-dialysis reversal (EDR) in order to maintain the long term physical integrity of representative soils from the Powder River Basin (PRB) and achieve normal crop production.
Experimental Methods
Soil Collection
Three soil types were collected at various sites in Wyoming for use in the research project. Two (2) soil types were sampled at sites in the Powder River Basin that have not previously been irrigated with produced water, the X-ranch site and the Sheridan site. One soil type was collected from the Wind River Basin that has not previously been irrigated with produced water. The soil material collected from the X-ranch site located north of Sheridan Wyoming was used for the hydraulic conductivity portion of the study, while soils collected from all three (3) sites were used in the plant productivity portion of the study. Soil samples were collected from the upper soil horizons (i.e., A and B horizons) associated with forage crop root zones, transported to laboratory, homogenized, and used to make 4 inch diameter soil columns for the hydraulic conductivity study and to fill 6 inch diameter pots for the greenhouse study.
8
Collection of Produced Water
Produced water was collected from a conventional oil and gas site in the Wind River Basin, WY and from a CBM site in the Powder River Basin, WY. Conventional oil and gas produced water required pretreatment to remove oil and grease that could potentially foul membranes while CBM produced did not require pretreatment. The pretreatment train included DAF, organoclay filtration, and ultra-filtration.
Pilot Testing
Pilot tests will be conducted using a wide range of treated and raw water blends to determine pertinent water blending ratios and soil types to be tested during full-scale experimentation. These pilot tests will include Petri-dish germination experiments and single replicate soil permeability tests.
Soil Column Study
Soil columns (3 inches diameter; 4 inches long) were constructed and placed in flexible-walled permeameters (Trautwein Apparatus). The soil column was placed in a flexible sleeve that is under pressure to prevent any leakage of permeant along the edges of the column. The respective water blends were applied to the soil columns at a constant head pressure (Figure 1). Leachate was collected for chemical analysis (when sufficient volume was present) and the soil columns were analyzed for hydraulic conductivity and chemical composition at the end of each experiment as detailed in Analytical Methods. The soil column test matrix included: 1 soil types × 2 produced water sources × 2 water treatment technologies (for each water source) × 5 water blending ratios (including controls - 100% treated and raw water) × 3 replicates. The nominal blending mixtures for the greenhouse and soil column experiments will include 0, 25, 50, 75, and 100% treated water. Statistical evaluations were conducted using ANOVA with the Minitab Software Package.
Germination Study
Petri-dish seed germination experiments were completed as part of the preliminary testing conducted in support of the greenhouse portion of this project. The germination study was done using using a thin layer of soil in each Petri-dish. Treatments were evaluated in triplicate using ten (10) seeds in each Petri-dish. Nineteen (19) treatments were evaluated consisting of 1) river water; 2) CBM produced water (raw); 3) Oil and Gas (O&G) produced water (raw); 4) 25% CBM Reverse Osmosis (RO); 5) 50% CBM RO; 6) 75% CBM RO; 7) 100% CBM RO; 8) 25% CBM Ion Exchange (IX); 9) 50% CBM IX; 10) 75% CBM IX; 11) 100% CBM IX; 12) 25% O&G RO; 13) 50% O&G RO; 14) 75% O&G RO; 15) 100% O&G RO; 16) 25% O&G EDR (electrodialysis reversal); 17) 50% O&G EDR; 18) 75% O&G EDR; and 19) 100% O&G EDR. Initially each Petri-dish was evaluated daily for germination followed
9
by weekly evaluations. Statistical evaluations were conducted using ANOVA with the Minitab Software Package.
Greenhouse Study
The irrigation experiment was initiated using two (2) plant species, alfalfa and western wheatgrass, and nineteen (19) treatments. The experiment was setup using two (2) blocks (one for each plant species) with four (4) replicates for each treatment. The pots were completely randomized within each block. Six-inch diameter plastic pots were filled with each soil type and planted with either western wheat grass (Pascopyrum smithii) or alfalfa (Medicago sativa; 10 seeds each). The green house test matrix included: 3 soil types × 2 produced water sources × 2 water treatment technologies (for each water source) × 2 forage crop species × 5 water blending ratios × 4 replicates ≈ 456 pots (considering controls and various water blends including 100% treated or raw water). Each pot was watered liberally with its respective water blend to maintain optimal conditions for germination during the first 1 to 2 weeks of the experiment. Once the 10 seeds in each pot germinated (or not) and had emerged, plants were randomly removed from each pot so a maximum of 4 separate plants existed in each pot. Sufficient water was used to maintain moist soil conditions throughout the study. Two (2) cuttings from the pots were completed during the growing period. Biomass was collected from the above-ground portion of each plant, dried and analyzed as detailed in Analytical Methods. Plant materials collected during the greenhouse study were dried in forced air ovens set at temperatures of 105° C for 24 hours. Dry weights were determined and the plant materials were stored until the study was terminated. Samples were composited by treatment and sent to the laboratory for analysis. Data collected were evaluated using ANOVA with the Minitab Software Package.
Analytical Methods
Water and Soil Analysis
Water and soil samples were collected, preserved and analyzed for all constituents using standard methods (Table 1). Soil hydraulic conductivity (coefficient of permeability) was determined for the soil treated with each water treatment combination using flexible wall permeameters (described in ASTM method D5084). The treated soil from each column was homogenized and sampled for chemical analyses using the saturated paste method. Standard methods were used to analyze the samples.
Plant Tissue Analysis
Plant materials analysis was conducted by Energy Laboratories Helena Montana. Total dry biomass was determined by drying plant materials to constant weight at 55oC. Plant materials were digested using the standard ASTM wet-ashing procedure (acid digestion of ash in 70% trace-metal grade nitric acid at 75oC for 24h). Samples were analyzed for metals by

10
ICP/ICPMS. Other analysis including boron, molybdenum, chloride, sulfur and nitrate were conducted using standard methods.
• Forage Quality Analysis
• Forage quality was determined using near infrared spectroscopy (NIRS; e.g, Stuth et al. 2003). Protein, fiber content, and digestibility were the primary parameters of interest in this study.
RESULTS
Produced Water Treatment for the Irrigation Study
Conventional produced water received further treatment by RO or EDR and CBM produced water was treated by RO or IX. All treated and raw water was collected at one time and used throughout the experiment. These large volumes of treated water (~600 gallons for each treatment/water source) and raw water (~1000 gallons from each source) were transported to WRI and stored under constant, cool conditions until blended for use in irrigation studies. The chemical composition of the stored treated and raw waters was analyzed on a regular basis (at least weekly) to determine if any changes in water quality occur over time. No significant changes in water quality were found.
EMIT Water Discharge Technology an Exterran Water Management Services Company provided WRI with CBM produced water treated using ion exchange (EMIT Higgins LoopTM system), and conventional source produced water treated with an electro-dialysis based treatment system. One of EMIT’s existing clients located in the Powder River Basin (PRB) agreed to provide WRI with raw and treated CBM produced water from one of its existing treatment locations operated by EMIT. The treated water was ion exchange product water (before addition of blend water or soil amendments) from an EMIT Higgins LoopTM system.
In addition, EMIT desalinated approximately 1000 gallons conventional source produced water using EMIT’s Electrodialysis Reversal (EDR) and Cation (CIX)/Anion (AIX) fixed bed pilot systems. The source of the conventional well produced water was a gas producing well located in the Wind River Basin near Riverton, WY.
MWH treated the CBNG produced water and conventional oil and gas produced water treated using reverse osmosis RO technology. This water was transported to WRI for use in the laboratory and greenhouse studies.

11
Description of Water Treatment Systems
EMIT Higgins LoopTM Process- Ion Exchange (EMIT Water Discharge Technology an Exterran Company)
EMIT’s Higgins LoopTM Process utilizes Severn Trent Services HigginsTM Loop
Continuous Countercurrent Ion Exchange (CCIX) technology to remove sodium and other cations from CBM produced waters. A general Process Flow Diagram of the EMIT Higgins LoopTM Process used to treat CBM Produced Water is shown below. Untreated CBM produced water is pumped from the feed tank to the Higgins LoopTM adsorption section where sodium and other cations are removed via ion exchange. Loop product water is then routed through an air stripper and blend tank as needed to adjust pH and sodium adsorption ratio (SAR). The drawing shows the location of connection points used by WRI for the un-treated and product water sources. Note that the source for product water delivered to WRI is pre blend and soil amendment addition.
CIX Supply Pond
CIX Feed Tank
Higgins Loop
Air Stripper
Gypsum
Blend Tank
Brine toDisposal
Treated WaterTo Discharge
CIX Feed
CIX Brine
CIX Product
Blend
PRB CBM Produced Water
CBM Produced Water Process Flow Diagram
Loop Product
IX Product to WRI
Untreated Water to WRI
Figure 3 CBNG Produced Water Process Flow Diagram
EDR/CIX/AIX Pilot System
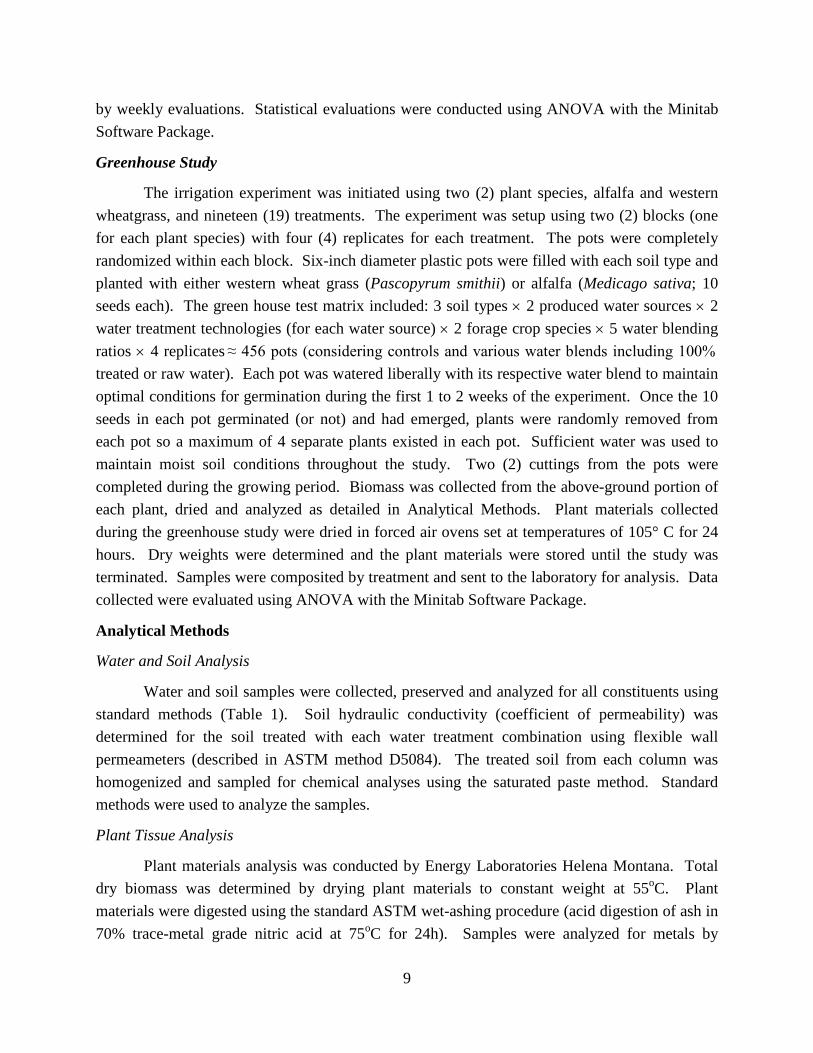
The pilot system selected to treat conventional source produced water was two-stage EDR for primary desalination, followed by a cation/anion ion exchange polish. Pre-treated and filtered (1um) conventional source produced water was desalinated in the primary step using two EDR modules connected in series. EDR product water was then routed to and polished using a cation/anion fixed bed ion exchange pilot system. The Conventional Produced Water Process Flow Diagram shown below shows major components and general flow direction of the treatment system used for this pilot test. System flow capacity for this pilot system was approximately 1.5 L/m.
WRI fluid source locations are identified in the drawing. Note that the IX product water delivered to WRI was not pH adjusted, or amended with SAR enhancing minerals.
12
EDR Feed Tank
Prefilter (1 um)
(2) Stage EDR Pilot System
EDR Feed
Pre-treatedProduced WaterFrom WRI
Conventional Produced Water Process Flow Diagram
Ion Exchange Column Pilot System
EDR Product IX Product
EDRBrine
Mixed Brine
CIX AIX
Brine to WRI Disposal
IX Product to WRI
Figure 4 Conventional Oil and Gas Produced Water Process Flow Diagram
Treatment Results
CBM Source Produced Water
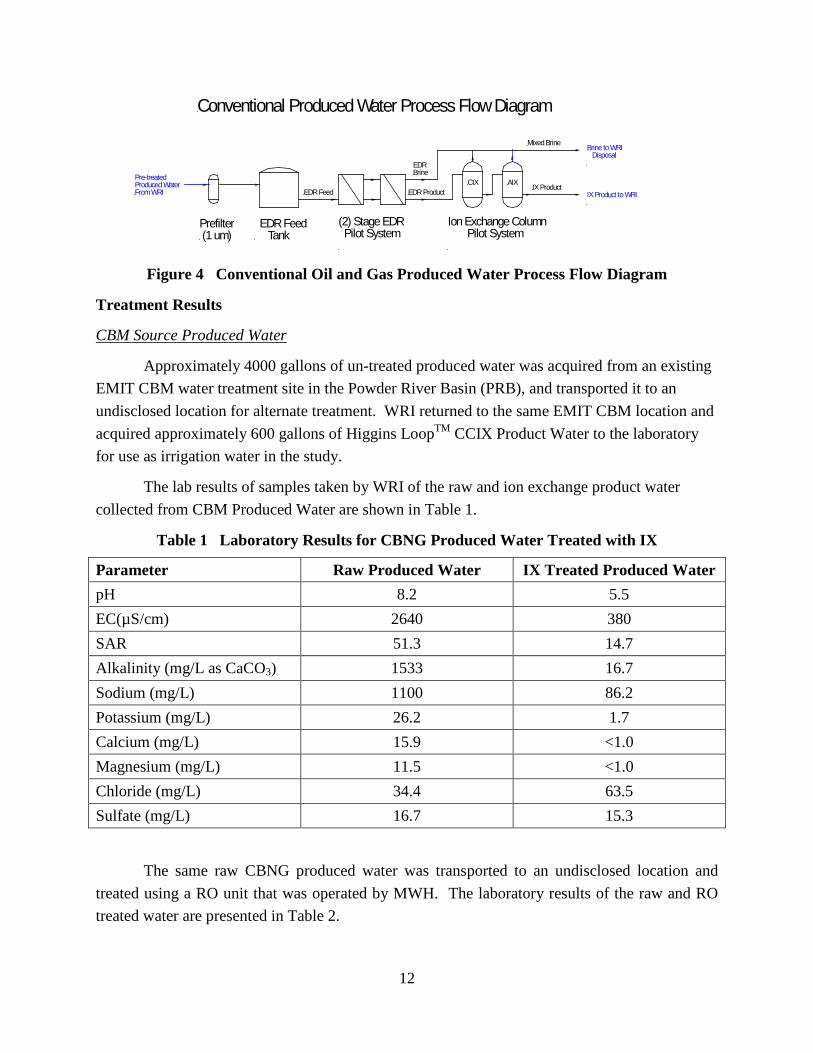
Approximately 4000 gallons of un-treated produced water was acquired from an existing EMIT CBM water treatment site in the Powder River Basin (PRB), and transported it to an undisclosed location for alternate treatment. WRI returned to the same EMIT CBM location and acquired approximately 600 gallons of Higgins LoopTM CCIX Product Water to the laboratory for use as irrigation water in the study.
The lab results of samples taken by WRI of the raw and ion exchange product water collected from CBM Produced Water are shown in Table 1.
Table 1 Laboratory Results for CBNG Produced Water Treated with IX
Parameter Raw Produced Water IX Treated Produced Water pH 8.2 5.5 EC(µS/cm) 2640 380 SAR 51.3 14.7 Alkalinity (mg/L as CaCO3) 1533 16.7 Sodium (mg/L) 1100 86.2 Potassium (mg/L) 26.2 1.7 Calcium (mg/L) 15.9 <1.0 Magnesium (mg/L) 11.5 <1.0 Chloride (mg/L) 34.4 63.5 Sulfate (mg/L) 16.7 15.3
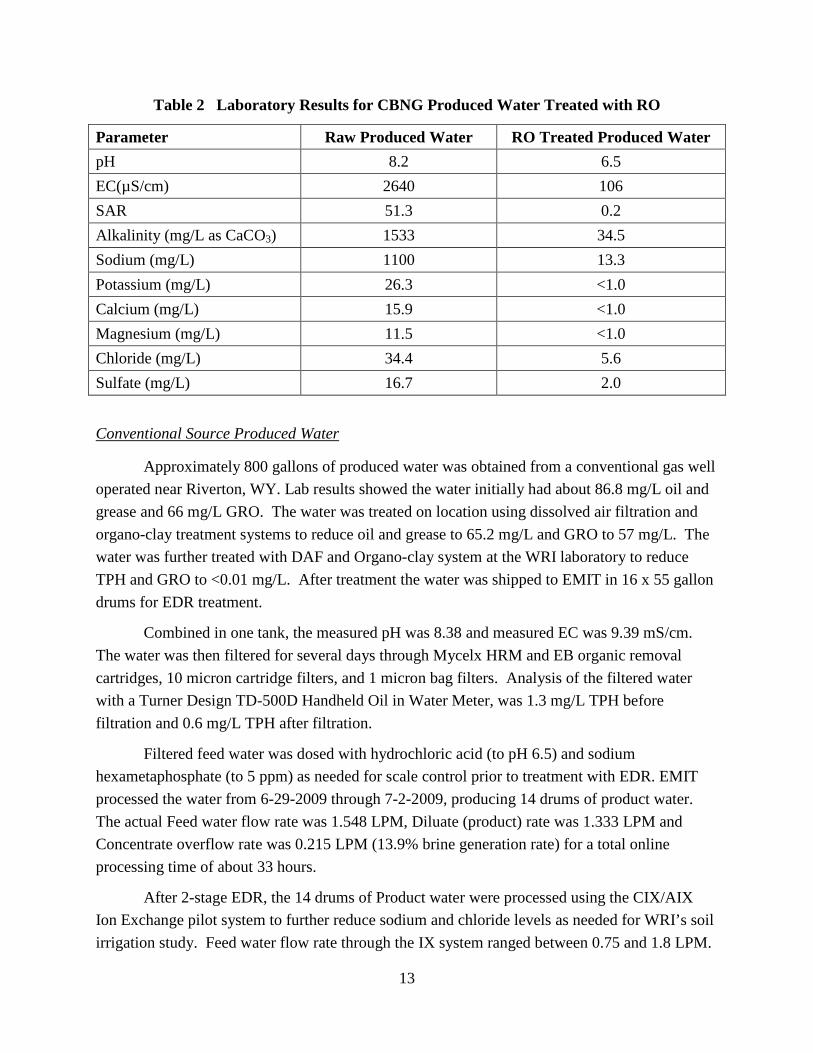
The same raw CBNG produced water was transported to an undisclosed location and treated using a RO unit that was operated by MWH. The laboratory results of the raw and RO treated water are presented in Table 2.
13
Table 2 Laboratory Results for CBNG Produced Water Treated with RO
Parameter Raw Produced Water RO Treated Produced Water pH 8.2 6.5 EC(µS/cm) 2640 106 SAR 51.3 0.2 Alkalinity (mg/L as CaCO3) 1533 34.5 Sodium (mg/L) 1100 13.3 Potassium (mg/L) 26.3 <1.0 Calcium (mg/L) 15.9 <1.0 Magnesium (mg/L) 11.5 <1.0 Chloride (mg/L) 34.4 5.6 Sulfate (mg/L) 16.7 2.0
Conventional Source Produced Water
Approximately 800 gallons of produced water was obtained from a conventional gas well operated near Riverton, WY. Lab results showed the water initially had about 86.8 mg/L oil and grease and 66 mg/L GRO. The water was treated on location using dissolved air filtration and organo-clay treatment systems to reduce oil and grease to 65.2 mg/L and GRO to 57 mg/L. The water was further treated with DAF and Organo-clay system at the WRI laboratory to reduce TPH and GRO to <0.01 mg/L. After treatment the water was shipped to EMIT in 16 x 55 gallon drums for EDR treatment.
Combined in one tank, the measured pH was 8.38 and measured EC was 9.39 mS/cm. The water was then filtered for several days through Mycelx HRM and EB organic removal cartridges, 10 micron cartridge filters, and 1 micron bag filters. Analysis of the filtered water with a Turner Design TD-500D Handheld Oil in Water Meter, was 1.3 mg/L TPH before filtration and 0.6 mg/L TPH after filtration.
Filtered feed water was dosed with hydrochloric acid (to pH 6.5) and sodium hexametaphosphate (to 5 ppm) as needed for scale control prior to treatment with EDR. EMIT processed the water from 6-29-2009 through 7-2-2009, producing 14 drums of product water. The actual Feed water flow rate was 1.548 LPM, Diluate (product) rate was 1.333 LPM and Concentrate overflow rate was 0.215 LPM (13.9% brine generation rate) for a total online processing time of about 33 hours.
After 2-stage EDR, the 14 drums of Product water were processed using the CIX/AIX Ion Exchange pilot system to further reduce sodium and chloride levels as needed for WRI’s soil irrigation study. Feed water flow rate through the IX system ranged between 0.75 and 1.8 LPM.

14
Brine generation was measured to be 2.7% of feed flow. Combined system (EDR + IX) fluid balance for processing 800 gallons of produced water was 650 gallons product water, 120 gallons of concentrate/brine, and 30 gallons wasted as tank and vessel residual.
A summary of the lab analytical results for treatment of Conventional Source Produced Waters using the EDR/IX system is shown below in Table 3.
Table 3 Laboratory Results for EDR Treatment of Conventional Source Produced Water
Parameter Raw Conventional Oil and Gas Produced Water EDR Treated Water
pH 8.3 4.4 EC(µS/cm) 9720 193 SAR 341.8 2.5 Alkalinity(total) (mg/L as CaCO3) 2584 0 Sodium (mg/L) 4135 26.9 Potassium (mg/L) 21.9 <1.0 Calcium (mg/L) 7.7 7.3 Magnesium (mg/L) 1.3 <1.0 Chloride (mg/L) 1800 8 Sulfate (mg/L) 5.9 2.2
For CBM produced water, the CCIX system removed 93.7% of the TDS. The EDR/IX system used for treatment of Conventional Source produced water had TDS and chloride reductions of 97.7% and >99%, respectively. As noted previously, the product water from both systems delivered to WRI was not pH adjusted, or amended with SAR enhancing minerals. SAR and pH are easily adjusted to the desired levels by addition of hydrated lime and/or gypsum.
The same raw conventional oil and gas produced water was transported to an undisclosed location and treated using an RO unit that was operated by MWH. The laboratory results of the raw and RO treated water are presented in Table 4.

15
Table 4 Laboratory Results for Conventional Oil and Gas Produced Water Treated with RO
Parameter Raw Conventional Oil and Gas Produced Water RO Treated Water
pH 8.3 9.2 EC(µS/cm) 9720 157 SAR 341.8 3.8 Alkalinity(total) (mg/L as CaCO3) 2584 50.2 Sodium (mg/L) 4135 22.5 Potassium (mg/L) 21.9 <1.0 Calcium (mg/L) 7.7 <1.0 Magnesium (mg/L) 1.3 <1.0 Chloride (mg/L) 1800 9.7 Sulfate (mg/L) 5.9 1.6
One of the problems associated with treated produced water was trying to maintain the stability of the water chemistry. Some small changes were observed from the time the samples were collected and treated to the time that the hydraulic conductivity measurements were made. Every attempt was made to prevent changes by keeping water in cold storage and reducing the time the water was exposed to air prior to use in the laboratory. Any impact is expected to be minimal. The tables provided above show the water quality at the time that hydraulic conductivity measurements were initiated.
Hydraulic Conductivity Measurements using Flexible-walled Permeameters
Hydraulic conductivity (HC) values for the X-Ranch soil irrigated with various combinations of treated CBNG produced water and conventional oil and gas produced water treated with various technologies were determined using flexible-walled permeameters (Figure 5).
Data collected from the hydraulic conductivity study are presented in Table 3 (laboratory test run data and statistical evaluations are presented in Appendix A and B, respectively). For the CBNG produced water portion of the study, results tended to follow expectations with the hydraulic conductivity of soil impacted with the 100% reverse osmosis treated water comparing well with the HC of soil treated with river water (no significant difference). The river water contained relative high EC (0.8 dS/m) and low SAR (0.8), while the 100% treated CBNG produced water was characterized by very low EC (0.1 dS/m) and a SAR of 2.0. Apparently, the very low salt content of the water treated by reverse osmosis was not an apparent factor impacting soil structure. It should be noted that irrigation water characterized with very low salt content has

16
been shown to decrease the hydraulic conductivity of irrigated soils (reference) but was a limited factor in this study. An important finding of this research effort is that soils treated with blended waters appeared to cause similar impacts to soil structure. The HC values of soil materials irrigated with 25%, 50% and 75% treated water (the other percentage of the blend is untreated CBNG produced water) significantly lower compared to the control (river water) and 100% treated water. The HC values associated with these treatments were found similar to the untreated produced water.
Figure 5 Flexible-walled Permeameter Apparatus.
Data collected show that the relatively high SAR values of the 75% treatment (SAR = 14), the 50% blend (SAR = 24.3), the 25% blend (SAR = 31.7) and the no treatment water (SAR = 38.2) significantly impacted the HC values to lower levels compared to the control and 100% treatment. The relatively low EC values associated with these treatments apparently did not compensate for the tendency for dispersion.
The CBNG produced water treated by ion exchange (EMIT Process) resulted in similar out comes as noted for the reverse osmosis treated water. The soil treated with 100% (no blending) ion exchange treated water was characterized with a high hydraulic conductivity compared to the blended waters and very similar to that determined for the 100% treated reverse osmosis treated water (no significant differences). This was true even though the 100% ion exchange treated water was characterized with a higher SAR value (SAR = 5.8) and a very low

17
EC value (0.3 dS/m) compared to the 100% reverse osmosis and river water. The hydraulic conductivities of soils treated with the 75%, 50% and 25% blends were very similar (no significant differences) and were found to be very similar (no significant difference) to the results from untreated water treatment.
Table 5 Hydraulic Conductivity of Soil Treated with Treated Water.
Water Type Treatment Hydraulic
Conductivity (HC) (cm/s)
Statistical Difference
HC
EC (dS/m)
SAR
Coalbed Natural Gas Produced Water River Water No Treatment Rep1: 2.7 X 10⁻³
Rep2: 1.7 X 10⁻³ Rep3: 2.8 X 10⁻³ Avg: 2.4 X 10⁻³ SD: 6.1 X 10⁻⁴
a 0.8 0.8
CBNG Produced Water
100% - Reverse Osmosis
Rep1: 2.4 X 10⁻³ Rep2: 1.9 X 10⁻³ Rep3: 2.6 X 10⁻³ Avg: 2.3 X 10⁻³ SD: 3.6 X 10⁻⁴
a 0.1 2.0
CBNG Produced Water
Blend: 75% - Reverse Osmosis;
25% Untreated
Rep1: 5.2 X 10⁻⁴ Rep2: 1.1 X 10⁻³ Rep3: 4.9 X 10⁻⁴ Avg: 7.0 X 10⁻⁴ SD: 3.4 X 10⁻⁴
b 0.8 14.0
CBNG Produced Water
Blend: 50% - Reverse Osmosis;
50% Untreated
Rep1: 5.0 X 10⁻⁵ Rep2: 2.2 X 10⁻⁴ Rep3: 3.4 X 10⁻⁴ Avg: 2.0 X 10⁻⁴ SD: 1.5 X 10⁻⁴
b 1.4 24.3
CBNG Produced Water
Blend: 25% - Reverse Osmosis; 75% Untreated
Rep1: 1.4 X 10⁻⁴ Rep2: 3.8 X 10⁻⁵ Rep3: 6.7 X 10⁻⁵ Avg: 8.2 X 10⁻⁵ SD: 5.3 X 10⁻⁵
b 2.1 31.7
CBNG Produced Water
No Treatment Rep1: 1.7 X 10⁻⁵ Rep2: 1.5 X 10⁻⁴ Rep3: 1.5 X 10⁻⁴ Avg: 1.1 X 10⁻⁴
SD: 7.7 X 10⁻⁵
b 3.0 38.2
CBNG 100% - Ion Rep1: 2.2 X 10⁻³ a 0.3 5.8

18
Produced Water
Exchange Rep2: 1.7 X 10⁻³ Rep3: 1.9 X 10⁻³ Avg: 1.9 X 10⁻³ SD: 2.5 X 10⁻⁴
CBNG Produced Water
Blend: 75% - Ion Exchange;
25% Untreated
Rep1: 1.6 X 10⁻⁴ Rep2: 1.6 X 10⁻⁴ Rep3: 5.0 X 10⁻⁴ Avg: 2.7 X 10⁻⁴ SD: 2.0 X 10⁻⁴
b 1.0 17.8
CBNG Produced Water
Blend: 50% - Ion Exchange;
50% - Untreated.
Rep1: 2.1 X 10⁻⁵ Rep2: 4.0 X 10⁻⁴ Rep3: 4.5 X 10⁻⁴ Avg: 2.9 X 10⁻⁴ SD: 2.4 X 10⁻⁴
b 1.6 24.7
CBNG Produced Water
Blend: 25% - Ion Exchange;
75% - Untreated.
Rep1: 9.4 X 10⁻⁵ Rep2: 3.1 X 10⁻⁴ Rep3: 8.2 X 10⁻⁵ Avg: 1.6 X 10⁻⁴ SD: 1.3 X 10⁻⁴
b 2.1 32.2
Oil and Gas Produced Water River Water No Treatment Rep1: 2.7 X 10⁻³
Rep2: 1.7 X 10⁻³ Rep3: 2.8 X 10⁻³ Avg: 2.4 X 10⁻³ SD: 6.1 X 10⁻⁴
c 0.8 0.8
Oil & Gas Produced Water
100% - Reverse Osmosis
Rep1: 1.1 X 10⁻⁴ Rep2: 3.2 X 10⁻⁴ Rep3: 9.6 X 10⁻⁵ Avg: 1.7 X 10⁻⁴ SD: 1.2 X 10⁻⁴
d 0.1 5.7
Oil & Gas Produced Water
Blend: 75% - Reverse Osmosis;
25% Untreated
Rep1: 8.1 X 10⁻⁷ Rep2: 3.9 X 10⁻⁶ Rep3: 3.5 X 10⁻⁶ Avg: 2.7 X 10⁻⁶ SD: 1.7 X 10⁻⁶
d 2.8 116
Oil & Gas Produced Water
Blend: 50% - Reverse Osmosis;
50% Untreated
Rep1: 4.7 X 10⁻⁶ Rep2: 6.4 X 10⁻⁶ Rep3: 5.7 X 10⁻⁶ Avg: 5.6 X 10⁻⁶ SD: 8.9 X 10⁻⁷
d 4.9 167
Oil & Gas Blend: 25% - Rep1: 3.4 X 10⁻⁶ d 7.6 228
19
Produced Water
Reverse Osmosis; 75% Untreated
Rep2: 3.1 X 10⁻⁶ Rep 3: 4.3 X 10-
6 Avg: 3.6 X 10⁻⁶ SD: 6.2 X 10⁻⁷
Oil & Gas Produced Water
No Treatment Rep1: 4.8 X 10⁻⁶ Rep2: 3.9 X 10⁻⁶ Rep3: 2.5 X 10⁻⁶ Avg: 3.7 X 10⁻⁶ SD: 1.2 X 10⁻⁶
d 8.8 272
Oil & Gas Produced Water
100% - EDR Rep1: 1.5 X 10⁻⁴ Rep2: 2.9 X 10⁻⁴ Rep3: 1.5 X 10⁻³ Avg: 6.3 X 10⁻⁴ SD: 7.2 X 10⁻⁴
d 1.5 34.6
Oil & Gas Produced Water
Blend: 75% - EDR; 25% Untreated
Rep1: 3.9 X 10⁻⁶ Rep2: 3.9 X 10⁻⁶ Rep3: 3.9 X 10⁻⁶ Avg: 3.9 X 10⁻⁶
SD: 0
d 103
Oil & Gas Produced Water
Blend: 50% - EDR; 50% - Untreated.
Rep1: 4.9 X 10⁻⁶ Rep2: 6.3 X 10⁻⁶ Rep3: 8.1 X 10⁻⁶ Avg: 6.4 X 10⁻⁶ SD: 1.6 X 10⁻⁶
d 225
Oil & Gas Produced Water
Blend: 25% - EDR; 75% - Untreated.
Rep1: 5.5 X 10⁻⁶ Rep2: 7.8 X 10⁻⁶ Rep3: 5.0 X 10⁻⁶ Avg: 6.1 X 10⁻⁶ SD: 1.5 X 10⁻⁶
d 241
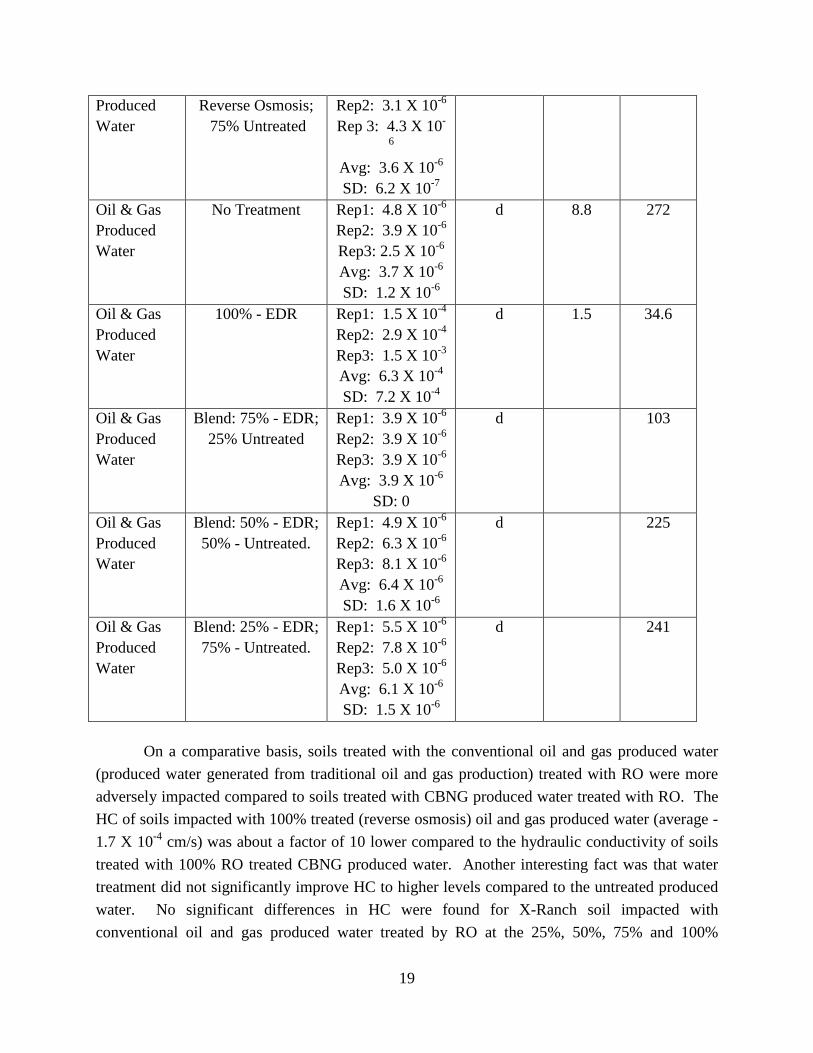
On a comparative basis, soils treated with the conventional oil and gas produced water (produced water generated from traditional oil and gas production) treated with RO were more adversely impacted compared to soils treated with CBNG produced water treated with RO. The HC of soils impacted with 100% treated (reverse osmosis) oil and gas produced water (average - 1.7 X 10⁻⁴ cm/s) was about a factor of 10 lower compared to the hydraulic conductivity of soils treated with 100% RO treated CBNG produced water. Another interesting fact was that water treatment did not significantly improve HC to higher levels compared to the untreated produced water. No significant differences in HC were found for X-Ranch soil impacted with conventional oil and gas produced water treated by RO at the 25%, 50%, 75% and 100%

20
treatment levels. Similar results were found for the EDR treated produced water. As shown in Table 5, soil HC values associated with the 100% EDR treated water are not significantly different from the 25%, 50%, 75%, 100% treated water, and the untreated water. The HC values associated with the control (river water) were significantly higher.
The soil HC values associated with the conventional oil and gas produced water appear to be directly related to the high SAR makeup of each water used to impact the soil columns. The conventional oil and gas water is characterized with high salt content (high EC values) and very high SAR values. The SAR of the untreated produced water is 272 with the blends resulting from RO treatment ranging from 116 for the 75% blend to 228 for the 25% blend. The 100% treated water was characterized with a low SAR of 5.7 but a corresponding low EC of 0.1 dS/m. Similar findings resulted for the EDR treated produced water as the 75%, 50% and 25% blends were characterized with very high SAR values that tended to result in relatively low HC. It should also be noted that the 100% treated produced water was characterized with a high SAR value of 34.6 and an EC of 1.5 dS/m. The relatively low HC associated with the 100% treated is likely due to the high SAR and low EC, which does not compensate for the high dispersion tendency resulting from the SAR .
Summary
Limited differences exist in the HC of soils impacted with treated and untreated CBNG produced water. Produced water treated using the IX and RO technologies at the 100% level was found to be similar to the control (river water), while the treatment levels of 25%, 50% and 75% resulted in significantly lower HC values that compared well to the values associated with untreated produced water.
The HC data collected for conventional oil and gas produced water showed no improvement in HC over the untreated produced water for all levels of treatment. Water treatment did not appear to improve HC for oil and gas produced water.
Characterization of Soils Used in the Hydraulic Conductivity Study
Soils used in the hydraulic conductivity study were evaluated at the conclusion of the study to determine how the irrigation water impacted the chemistry of the material. The primary parameters of concern were EC and SAR, which will be discussed in the following paragraphs. The data are presented in Tables 4 and 5 and the statistical evaluations are provided in Appendix C.
SAR
The soils treated with CBNG produced water were characterized with significantly lower SAR values compared to the conventional oil and gas water. The CBNG produced water treated with RO at the 100% treatment level was significantly different from the untreated produced
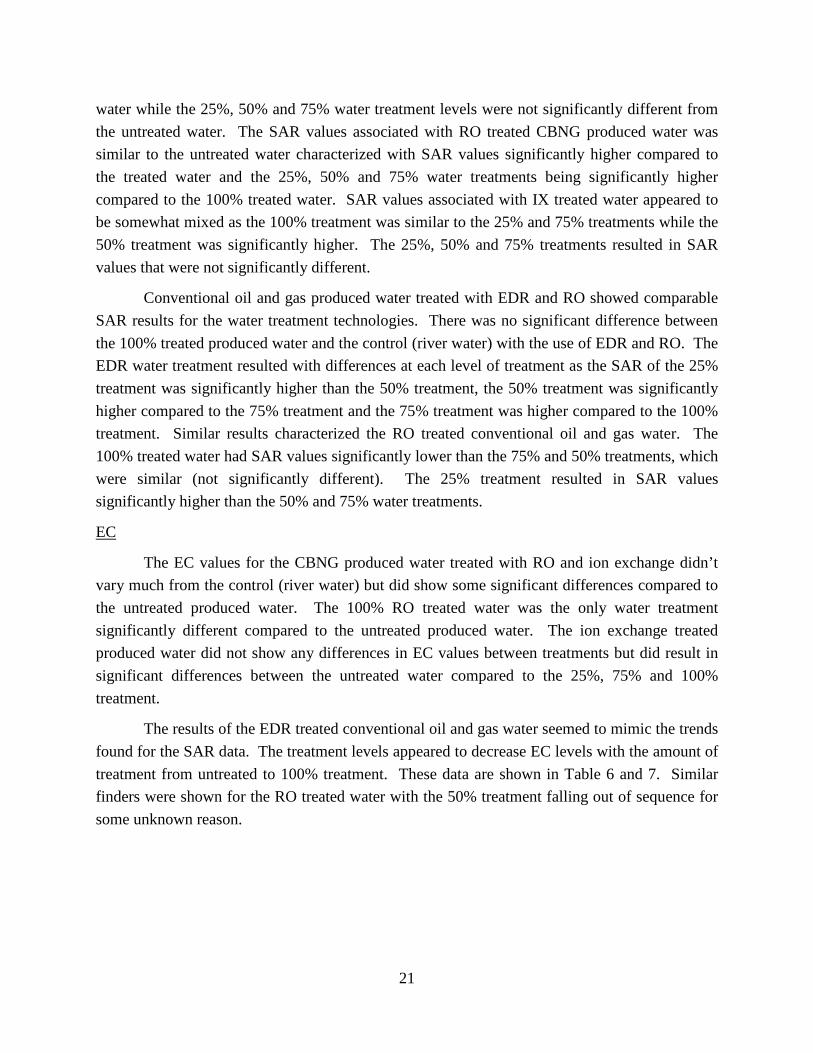
21
water while the 25%, 50% and 75% water treatment levels were not significantly different from the untreated water. The SAR values associated with RO treated CBNG produced water was similar to the untreated water characterized with SAR values significantly higher compared to the treated water and the 25%, 50% and 75% water treatments being significantly higher compared to the 100% treated water. SAR values associated with IX treated water appeared to be somewhat mixed as the 100% treatment was similar to the 25% and 75% treatments while the 50% treatment was significantly higher. The 25%, 50% and 75% treatments resulted in SAR values that were not significantly different.
Conventional oil and gas produced water treated with EDR and RO showed comparable SAR results for the water treatment technologies. There was no significant difference between the 100% treated produced water and the control (river water) with the use of EDR and RO. The EDR water treatment resulted with differences at each level of treatment as the SAR of the 25% treatment was significantly higher than the 50% treatment, the 50% treatment was significantly higher compared to the 75% treatment and the 75% treatment was higher compared to the 100% treatment. Similar results characterized the RO treated conventional oil and gas water. The 100% treated water had SAR values significantly lower than the 75% and 50% treatments, which were similar (not significantly different). The 25% treatment resulted in SAR values significantly higher than the 50% and 75% water treatments.
EC
The EC values for the CBNG produced water treated with RO and ion exchange didn’t vary much from the control (river water) but did show some significant differences compared to the untreated produced water. The 100% RO treated water was the only water treatment significantly different compared to the untreated produced water. The ion exchange treated produced water did not show any differences in EC values between treatments but did result in significant differences between the untreated water compared to the 25%, 75% and 100% treatment.
The results of the EDR treated conventional oil and gas water seemed to mimic the trends found for the SAR data. The treatment levels appeared to decrease EC levels with the amount of treatment from untreated to 100% treatment. These data are shown in Table 6 and 7. Similar finders were shown for the RO treated water with the 50% treatment falling out of sequence for some unknown reason.

22
Table 6 Coalbed Natural Gas (CBNG) Produced Water Treated with RO and IX at Various Levels of Treatment.
Treatment Replicate pH EC Ca Mg K Na SAR units dS/m meq/L meq/L meq/L meq/L
Control 1 7.3 0.6 2.66 1.47 0.12 1.82 1.27 Control 2 7.2 0.61 2.82 1.64 0.15 1.75 1.17 Control 3 7.2 0.6 2.98 1.58 0.23 2.12 1.40 No Trt 1 7.6 1.26 1.02 0.55 0.19 11.9 13.43 No Trt 2 7.5 1.13 1.06 0.54 0.19 11 12.30 No Trt 3 7.7 1.16 0.99 0.5 0.18 11.6 13.44
25% RO 1 8 0.66 0.86 0.42 0.17 5.85 7.31 25% RO 2 7.8 0.76 1.35 0.59 0.15 6.79 6.89 25% RO 3 7.7 0.69 0.89 0.45 0.1 6.2 7.57 50% RO 1 7.1 0.9 1.27 0.63 0.12 7.45 7.64 50% RO 2 7.5 0.52 0.64 0.32 0.07 4.03 5.82 50% RO 3 7.9 0.67 0.66 0.32 0.1 5.85 8.36 75% RO 1 7.4 0.67 1.12 0.54 0.12 5.56 6.10 75% RO 2 7.4 0.7 1 0.49 0.12 5.62 6.51 75% RO 3 7.4 0.6 1.15 0.54 0.12 5.05 5.49 100% RO 1 7.1 0.47 2.26 1.08 0.13 1.5 1.16 100% RO 2 7.1 0.51 2.34 1.15 0.14 1.61 1.22 100% RO 3 7.1 0.53 2.71 1.27 0.15 1.51 1.07 25% IX 1 8 0.6 0.92 0.4 0.08 5.23 6.44 25% IX 2 8 0.52 0.77 0.35 0.1 4.91 6.56 25% IX 3 8 0.52 0.86 0.4 0.11 4.71 5.93 50% IX 1 7.4 0.71 0.96 0.44 0.12 6.08 7.27 50% IX 2 7.8 0.69 0.82 0.38 0.11 5.88 7.59 50% IX 3 7.6 0.81 0.94 0.43 0.11 6.57 7.94 75% IX 1 7.6 0.59 0.74 0.35 0.09 5.04 6.83 75% IX 2 7.5 0.62 0.97 0.44 0.1 5.13 6.11 75% IX 3 7.6 0.56 0.97 0.43 0.09 4.86 5.81 100% IX 1 7.1 0.61 2.2 0.99 0.14 3.39 2.68 100% IX 2 7.2 0.66 2.18 0.97 0.13 3.69 2.94 100% IX 3 7.1 0.66 2.34 1.08 0.14 3.43 2.62
23
Table 7 Conventional Oil and Gas Produced Water Treated with EDR and RO at Various Levels of Treatment.
Treatment Replicate pH EC Ca Mg K Na SAR units dS/m meq/L meq/L meq/L meq/L
Control 1 7.3 0.6 2.66 1.47 0.12 1.82 1.27 Control 2 7.2 0.61 2.82 1.64 0.15 1.75 1.17 Control 3 7.2 0.6 2.98 1.58 0.23 2.12 1.40 No Trt 1 7.8 2.66 1.01 0.48 0.14 23.6 27.34 No Trt 2 8.2 2.26 0.76 0.36 0.12 21 28.06 No Trt 3 7.5 3.51 1.14 0.6 0.17 29.7 31.84
25% EDR 1 8.2 1.3 0.7 0.31 0.14 11.1 15.62 25% EDR 2 8.2 2.03 0.88 0.38 0.16 16.4 20.66 25% EDR 3 8.2 2.01 0.83 0.36 0.11 18.1 23.46 50% EDR 1 7.8 1.46 0.88 0.41 0.1 12.5 15.56 50% EDR 2 7.7 1.42 1.09 0.51 0.1 11.7 13.08 50% EDR 3 7.6 1.76 0.95 0.43 0.1 13.9 16.73 75% EDR 1 7.5 1.1 0.84 0.38 0.09 8.31 10.64 75% EDR 2 7.3 1.12 1.29 0.6 0.11 8.77 9.02 75% EDR 3 7.5 1.4 1.48 0.69 0.14 10.8 10.37
100% EDR 1 7.3 0.61 3.34 1.53 0.14 1.48 0.95 100% EDR 2 7.3 0.5 3.01 1.23 0.12 1.54 1.06 100% EDR 3 7.2 0.49 2.58 1.07 0.12 1.51 1.12
25% RO 1 8 2.18 0.96 0.41 0.14 17.7 21.39 25% RO 2 7.6 1.44 1.14 0.52 0.09 11 12.07 25% RO 3 7.5 1.49 0.8 0.36 0.08 11.8 15.49 50% RO 1 7.8 1.04 0.64 0.28 0.07 7.8 11.50 50% RO 2 7.8 1.07 0.77 0.33 0.08 8.52 11.49 50% RO 3 7.8 1.48 0.91 0.41 0.1 11.7 14.40 75% RO 1 7.4 1.52 2.09 1.1 0.16 10.8 8.55 75% RO 2 7.4 1.32 1.23 0.57 0.11 10.3 10.86 75% RO 3 7.4 1.85 1.88 0.91 0.15 13.6 11.51 100% RO 1 7.3 0.47 2.07 0.99 0.13 1.88 1.52 100% RO 2 7.4 0.45 1.89 0.88 0.11 1.66 1.41 100% RO 3 7.4 0.52 2.22 1.06 0.12 1.93 1.51
24
SUMMARY
In general, the soils impacted by the CBNG produced water and the conventional oil and gas produced waters did not have a significant impact on the EC values of the soils. The resulting EC values resulting from all treatments would not be expected to significantly impact plant growth. The only concern would be whether or not the EC values were high enough to prevent dispersion of clays due to the corresponding SAR values.
The soils treated with CBNG produced water were characterized with significantly lower SAR values compared to the conventional oil and gas water. The CBNG produced water treated with RO at the 100% treatment level was significantly different from the untreated produced water while the 25%, 50% and 75% water treatment levels were not significantly different from the untreated water. The SAR values associated with RO treated CBNG produced water was similar to the untreated water. Conventional oil and gas produced water treated with EDR and RO showed comparable SAR results for the water treatment technologies. There was no significant difference between the 100% treated produced water and the control (river water) with the use of EDR and RO.
One issue that needs to be evaluated in a future study is associated with the chemical nature of the produced water treatments and the resulting chemistry of the impacted soils. Some questions as to the validity of the data are apparent. For example, the conventional oil and gas produced water treated with EDC at the 25% level was characterized with an EC of 7.6 dS/m and a SAR of 228. After treatment, the impacted soil was characterized with a mean SAR of 19.9 and a mean EC of 1.8 dS/m. The level of impact found appears to be much less than expected.
Germination Studies
Germination results are shown in Figures 1 and 2. It appears that produced water from both CBNG and conventional oil and gas production did not significantly impact germination rate. In fact germination rate appeared to be somewhat less in Treatment 1, which is river water compared to that determined for raw produced waters. Differences are apparent between several of the treatments for alfalfa and western wheatgrass germination. However, variation between replicates was found to be rather high resulting in no significant differences in germination of alfalfa and western wheatgrass seeds when watered with the 19 water treatments.
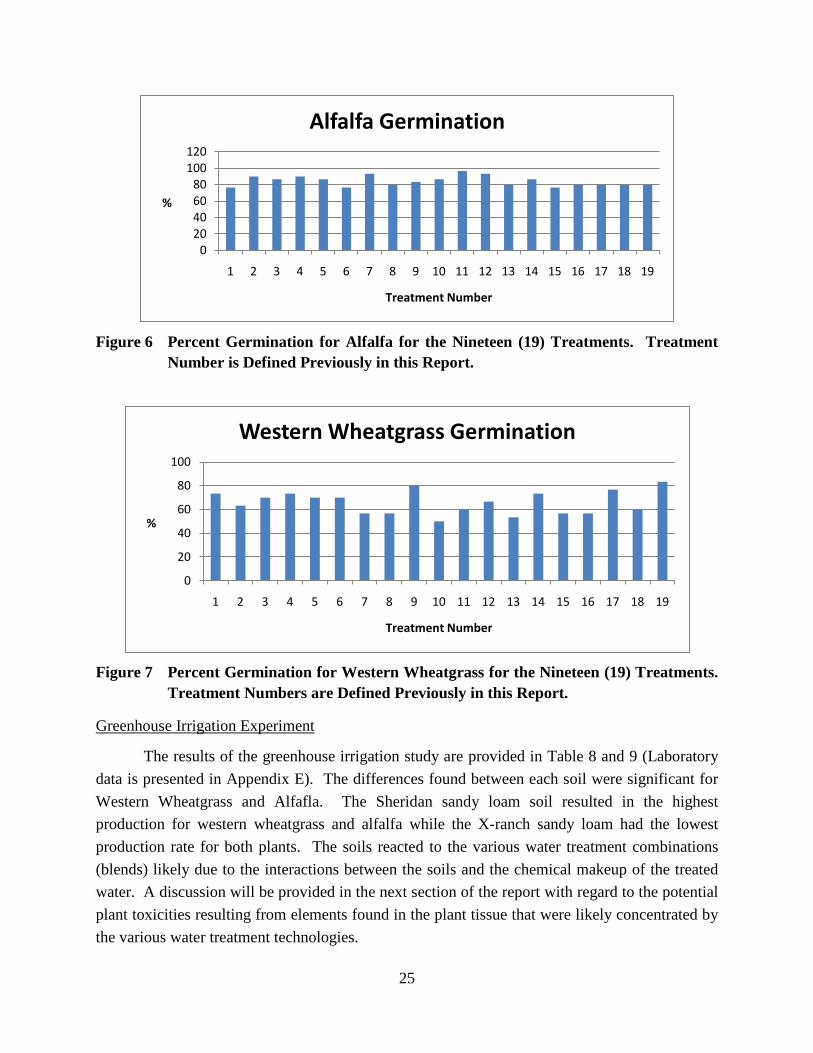
25
Figure 6 Percent Germination for Alfalfa for the Nineteen (19) Treatments. Treatment
Number is Defined Previously in this Report.
Figure 7 Percent Germination for Western Wheatgrass for the Nineteen (19) Treatments.
Treatment Numbers are Defined Previously in this Report.
Greenhouse Irrigation Experiment
The results of the greenhouse irrigation study are provided in Table 8 and 9 (Laboratory data is presented in Appendix E). The differences found between each soil were significant for Western Wheatgrass and Alfafla. The Sheridan sandy loam soil resulted in the highest production for western wheatgrass and alfalfa while the X-ranch sandy loam had the lowest production rate for both plants. The soils reacted to the various water treatment combinations (blends) likely due to the interactions between the soils and the chemical makeup of the treated water. A discussion will be provided in the next section of the report with regard to the potential plant toxicities resulting from elements found in the plant tissue that were likely concentrated by the various water treatment technologies.
020406080
100120
1 2 3 4 5 6 7 8 9 10 11 12 13 14 15 16 17 18 19
%
Treatment Number
Alfalfa Germination
0
20
40
60
80
100
1 2 3 4 5 6 7 8 9 10 11 12 13 14 15 16 17 18 19
%
Treatment Number
Western Wheatgrass Germination

26
Table 8 Alfalfa Biomass Production Using Treated Produced Water from CBNG and Oil and Gas Wells for Irrigation. Average Biomass Weights of Four (4) Replicates from Two (2) Cuttings.
Riverton Clay Loam Soil
Sheridan Sandy Loam Soil
X-Ranch Sandy Loam Soil
% Treated Water
Avg Biomass Weight
(g)
% Treated Water
Avg Biomass Weight
(g) % Treated
Water
Avg Biomass Weight
(g)
CBNG Produced
Water
Raw 0 0.51 0 1.66 0 0.36
RO
25 1.90 25 1.38 25 1.54
50 1.68 50 1.75 50 1.40
75 1.62 75 1.75 75 1.23
100 1.58 100 2.30 100 1.81
IE
25 1.56 25 1.50 25 0.55
50 1.33 50 1.86 50 1.70
75 1.36 75 1.91 75 1.21
100 1.65 100 2.70 100 1.29
Control River Water 1.92
River Water 2.42
River Water 0.84
Oil and Gas
Produced Water
Raw 0 0.32 0 0.00 0 0.32
EDR
25 0.46 25 0.60 25 0.00
50 0.00 50 0.96 50 0.00
75 0.91 75 1.70 75 0.55
100 1.37 100 1.85 100 0.66
RO
25 0.16 25 0.15 25 0.27
50 0.39 50 1.62 50 0.13
75 1.44 75 1.52 75 1.57
100 1.56 100 2.41 100 0.95
Control River Water 1.92
River Water 1.65
River Water 0.84
Riverton Clay Loam
Sheridan Sandy
X-Ranch Sandy

27
Table 9 Western Wheatgrass Biomass Production Using Treated Produced Water from CBNG and Oil and Gas Wells for Irrigation. Average Biomass Weights of Four(4) Replicates from Two (2) Cuttings.
Biomass Production of the Soils Evaluated
% Treated Water
Avg Biomass Weight
(g)
% Treated Water
Avg Biomass Weight
(g) % Treated
Water
Avg Biomass Weight
(g)
CBNG Produced
Water
Raw 0 1.39 0 2.64 0 0.89
RO
25 1.57 25 2.81 25 1.21
50 1.95 50 2.03 50 0.97
75 1.50 75 1.50 75 0.93
100 1.28 100 1.02 100 0.78
IE
25 1.19 25 2.45 25 0.81
50 1.18 50 2.06 50 0.81
75 1.28 75 1.51 75 0.98
100 1.19 100 1.18 100 0.66
Control River Water 0.95
River Water 1.13
River Water 0.76
Oil and Gas
Produced Water
Raw 0 0.41 0 1.07 0 0.27
EDR
25 0.70 25 1.28 25 0.32
50 0.99 50 1.37 50 0.53
75 0.76 75 1.83 75 0.39
100 1.07 100 1.35 100 0.44
RO
25 0.37 25 1.46 25 0.33
50 0.59 50 1.58 50 0.79
75 0.68 75 1.72 75 0.51
100 0.98 100 1.19 100 0.62
Control River Water 0.95
River Water 1.13
River Water 0.76

28
The potential productivity of each soil was significantly different based on plant production from western wheatgrass with the highest plant production rate associated with the Sheridan sandy loam soil and the lowest production rate associated with the X-Ranch sandy loam soil (ANOVA statistics are provided in the Appendix F). Plant production levels resulting from untreated CBNG produced water were significantly higher compared to untreated conventional oil and gas produced water. However, few differences were found between water treatments. For example, CBNG produced water treated with ion exchange resulted in no significant difference in western wheatgrass production for the 25%, 50%, 75% and 100% treatment blends. The use of RO treated CBNG produced water for irrigation resulted in a significantly lower level for the 100% treated produced water compared to the 25% blend while the results for the 50% and 75% blends were not significantly different from the 100% treated and the 25% blend. The lower production level associated with the 100% treated water is likely associated with either a plant toxicity or nutritional imbalance caused by the treatment. The treatments used for the conventional oil and gas produced water seemed to vary. The produced water treated using EDR technology generated high western wheatgrass production compared to that resulting from the RO technology. However, the plant production levels associated with EDR did not differ significantly based on the amount of treatment. For example, 100% treated water resulted in production values not significantly different from the 25%, 50% and 75% blends. The same results were found for the RO treated water.
As noted for western wheatgrass, the potential productivity of each soil was significantly different based on plant production from alfalfa with the highest biomass production associated with the Sheridan sandy loam soil and the lowest production rate associated with the X-Ranch sandy loam soil (ANOVA statistics are provided in the Appendix B). Plant production levels of alfalfa resulting from untreated CBNG produced water appeared to be higher compared to untreated conventional oil and gas produced water. However, the variability of the data set showed overlap in the 95% confidence interval, which indicates no significant difference. Few differences were also found between water treatments. For example, CBNG produced water treated with ion exchange resulted in no significant difference in alfalfa biomass production for the 25%, 50%, 75% and 100% treatment blends . The use of RO treated CBNG produced water for irrigation resulted in a no significantly difference between the 25% treatment, 50% treatment and the 75% treatment.
The treatments used for the conventional oil and gas produced water resulted in some significant differences in biomass generation. The produced water treated using EDR technology generated high alfalfa production compared to that resulting from the RO technology. The biomass production associated with conventional oil and gas produced water treated with EDR seemed to match the level of treatment with the 100% treated water resulting in the highest biomass production and the 25% blend resulting in the lowest. There were no significant

29
differences in the production levels characterizing the 100% treatment and the 75% treatment, which were both significantly higher compared to the 25% and 50% treatments. The results for the 25% and 50% treatments were not significantly different.
Alfalfa
Alfalfa biomass production levels resulting from irrigating with CBNG and conventional oil and gas produced waters treated using various technologies and blending rates are presented in Figures 8 and 9. The results are discussed in the following sections of the report.
Riverton Clay Loam Soil
Biomass resulting from the Riverton clay loam soil irrigated with conventional oil and gas produced water treated with IX (EMIT technology) was significantly different from the untreated water for the 50% blend, the 75% blend and the 100% treatment. However, the blends and 100% treated water were found to generate biomass at levels not significantly different than the control (river water). In addition, the 25% blend was not significantly different from the untreated (raw) water. Similar results were found for the CBNG produced water treated with RO. Significant differences were found between the raw water (untreated) and the 25% blend, 50% blend, the 75% blend, and the 100% treated water, while no significant differences were found between these treatment levels and the control (river water).
Figure 8 Alfalfa Production Using Treated CBM Produced Water for Irrigating Three (3)
Soils – Riverton, Sheridan and X-Ranch Sampling Sites
0.0
0.5
1.0
1.5
2.0
2.5
3.0
25 50 75 100 25 50 75 100
Raw CBM RO CBM IX Control
Mea
n Bi
omas
s (g
)
Alfalfa CBM Irrigation
Riveton Sheridan X-Ranch
30
Figure 9 Alfalfa Production Using Treated Oil and Gas Produced Water for Irrigating
Three (3) Soils – Riverton, Sheridan and X-Ranch Sampling Sites
The Riverton clay loam soil irrigated with produced water generated from conventional oil and gas wells resulted in plant biomass levels lower compared to the CBNG produced water irrigated plants. The EDR 75% blend and the 100% treatments were characterized with significantly higher production compared to the raw water irrigated soil, while the 50% and 75% blends resulted in alfalfa biomass production not significantly different from the raw water. There was no significant difference between the Control (river water) and the 100% treated water and borderline significance between the control and the 75% blended treatment.
Sheridan Sandy Loam Soil
As noted previously, the Sheridan sandy loam soil was the most productive soil used in the greenhouse study. The alfalfa biomass production levels resulting from irrigating with IX treated CBNG produced water appeared to be highest for the control (river water) and the 100% treated water, which were not significant different. The 25%, 50% and 75% blends were associated with significantly lower biomass production and were characterized with biomass production similar to the untreated water (raw). The biomass resulting from irrigation with RO treated CBNG produced water provided similar trends but with slightly different results. The 100% treated water compared well to the control but was also not significantly different from the production levels resulting from untreated water and the 50% and 75% treatments.
0.0
0.5
1.0
1.5
2.0
2.5
3.0
25 50 75 100 25 50 75 100
Raw O&G EDR O&G RO Control
Mea
n Bi
omas
s (g
)Alfalfa O&G Irrigation
Riveton Sheridan X-Ranch
31
Biomass production levels associated with EDR water treatment of conventional oil and gas produced water varied significantly using the various blends of treated water for irrigation. The produced water treated at the 100% level using EDR was not significantly different compared to the 75% blend and the control (river water), while the biomass generated from irrigating with the 25% and 50% blends was significantly lower. The production associated with the 25% blend was found to be comparable to that produced by the raw water and was found not to be significantly different than the biomass production from the 50% blend. RO treated water provided similar results to the EDR treated water with the 100% treated water resulting in the highest biomass production rate comparing well to the control (river water). The production associated with the 100% treated water was significantly higher compared to the 25%, 50% and 75% blends while the 50% and 75% blends was not significantly higher than the control. The 25% blend resulted in much lower biomass production and was found to have very similar results compared to the untreated produced water.
Differences in biomass production were noticeably higher for untreated CBNG produced water compared to conventional oil and gas produced water. In general terms, the conventional oil and gas produced water treated at the 50%, 75% and 100% levels resulted in biomass levels not significantly different from corresponding treatment levels for CBNG produced water.
X-Ranch Sandy Loam Soil
The X-Ranch sandy loam soil was found to generate lower production of alfalfa compared to the Sheridan sandy loam soil but similar biomass production levels compared to the Riverton clay loam soil. Biomass production rates for all treatment levels using produced water treated with the IX (EMIT’s technology) for irrigation showed significantly higher levels compared to the untreated water. The treated water at the various blending levels was not significantly different than production rates associated with the river water (control). The use of RO to treat the CBNG produced water resulted in similar results.
The conventional oil and gas produced water treated with EDR and RO resulted in very similar plant production levels. Biomass production from the 100% treatment was not significantly different from the control, while the biomass production associated with the 75% blend was significantly lower compared to the control but not significantly different than the 100% treated produced water. The 25%, 50% and 75% blends were not significantly different compared to the untreated conventional oil and gas produced water. As noted previously, the RO treated water resulted in very similar relationships between the level of biomass production and the level of treatment. It appears that biomass production resulting from irrigating with conventional oil and gas produced water treated with EDR and RO can be considered equivalent.
Photographs taken about 70% through the time period prior to the first cutting are provided to demonstrate differences in biomass production between treatments. Plants shown in

32
Figure 10 show differences in alfalfa growth in the Sheridan soil irrigated with conventional oil and gas produced water treated with EDR. In this study, the alfalfa plants responded well to the EDR treatment of conventional oil and gas produced water. As the amount of water treated increases, plant production appears to increase.
Figure 10 Alfalfa Growing in Sheridan Soil Irrigated with O&G Produced Water
Treated with EDR at Various Combinations. Left to right are O&G raw, 25% O&G EDR, 50% O&G EDR, 75% O&G EDR, 100% O&G EDR, and River Water (Control).
The alfalfa biomass production associated with using CBNG produced water treated using RO with various blend rates in shown in Figure 11. This photo was taken about 70% through the time period prior to the first cutting. The photograph shows limited differences in the growth of alfalfa in the range of water quality conditions from river water (control) to the raw CBNG produced water.

33
Figure 11 Alfalfa Growing in Sheridan Soil Irrigated With CBM Produced Water
Treated with RO at Various Combinations. Left to right are CBM raw, 25% CBM RO, 50% CBM RO, 75% CBM RO, 100% CBM RO, and River Water (Control).
Western Wheatgrass
The biomass production results using the three (3) soils to grow western wheatgrass irrigated with a variety of water treatments are presented in Figure 1 and 12.
Riverton Clay Loam Soil
The Riverton clay loam soil irrigated with coalbed natural gas produced water treated with IX (EMIT technology) was not significantly different from the untreated water this included plant production resulting from the 25%, 50%, and 75% blends. Similar results were found for the CBNG produced water treated with RO. No significant differences were found between the raw water (untreated) and the 100% treated water and the blends. However, differences were found between the 25% blend and the river water (control), between the 50% blend and the 100% treated water, and the 50% blend and the control. The cause of the significant differences will be discussed in the section of the report contemplating potential plant toxicities.
The Riverton clay loam soil irrigated with produced water generated from conventional oil and gas wells resulted in similar plant production rates as described for the CBNG produced water. The EDR 100% treatment was characterized with significantly higher biomass production compared to the raw water irrigated soil. However, the 25%, 50% and 75% blends resulted in western wheatgrass weights in the middle range between the raw water and the 100% treated water with no significantly difference from the raw water and the 100% treated water. Results for the RO treated conventional oil and gas water demonstrated a significant difference in plant
34
production between the 100% treated water and the 25% blend while no differences were found between the other treatment combinations.
Sheridan Sandy Loam Soil
As noted previously, the Sheridan sandy loam soil was the most productive soil used in the greenhouse study. However, the treatment of CBNG produced water using IX (EMIT technology) and RO provided some interesting results. The plant production levels resulting from irrigating with IX treated water appeared to be highest for the untreated CBNG produced water (raw) followed in order by the 25%, 50%, 75% and 100 treated blends. An important note is that the control (river water) was not significantly different from the 100% treated water. Plant productivity levels using the 100% treated water were significantly lower compared to the raw water (untreated), the 50% blend and the 25% blend. No significant difference in biomass production was observed between the 100% treated water and the 75% blend. The point is that the lower percentage treated water improved plant productivity. Similar results were shown using CBNG produced water treated with RO technology for irrigation. The use of untreated water for irrigation resulted in high plant production rates compared to the control (river water). The blended water RO treatments resulted in the same conclusions shown for the IX treatment with the 25% blend resulting in the highest plant production and decreased biomass production with additional treatment from 25% to 100%.
Biomass production levels associated with EDR and RO water treatment of conventional oil and gas produced water did not vary significantly using the various blends of treated water with one exception. The produced water treated with EDR at the 75% treatment level resulted in biomass production that was significantly higher compared to irrigating with raw water, the river water and the various treated water blends.
The reasons for the differences found for the Sheridan sandy loam soil are not readily apparent. However, the plant materials analysis may provide some suggestions for the results. This will be reviewed in the following section.
X-Ranch Sandy Loam Soil
The X-Ranch sandy loam soil was found to generate the lowest biomass production of western wheatgrass of the three (3) soils studied. Biomass production results using produced water treated with the IX (EMIT’s technology) for irrigation showed no significant difference between untreated water, treated water at the various blending levels, and river water (control). The use of RO to treat the CBNG produced water resulted in only one difference, which was the difference between the 25% blend compared to 100% treated water and the river water (control).
The conventional oil and gas produced water treated with EDR and RO resulted in very similar biomass production levels. The production levels associated with EDR treated water for all
35
blends from 100% treated to raw water (no treatment) were not significant different. However, the river water (control) was associated with significantly higher levels of productivity compared to EDR treated water for the 25% blend. For the conventional oil and gas produced water, only the 50% blend resulted in higher biomass production levels compared to the untreated produced water. The biomass production associated with the river water (control) was similar to the 50% and 100% treated water and significantly higher compared to biomass generated with the 25% and 75% blends. The reason for the apparent discrepancy in the data is not known at this time.
The growth status for western wheatgrass prior to the first cutting is shown in Figure 14 for the conventional oil and gas produced water treated with EDR and in Figure 15 for CBNG produced water treated with RO. The photos show very limited differences between treatments for both produced waters.
Figure 12 Western Wheatgrass Production Using Treated CBM Produced Water for Irrigating Three (3) Soils – Riverton, Sheridan and X-Ranch Soils
0.0
0.5
1.0
1.5
2.0
2.5
3.0
25 50 75 100 25 50 75 100
Raw CBM RO CBM IX Control
Mea
n Bi
omas
s (g
)
Westen Wheatgrass CBM Irrigation
Riverton Sheridan X-Ranch
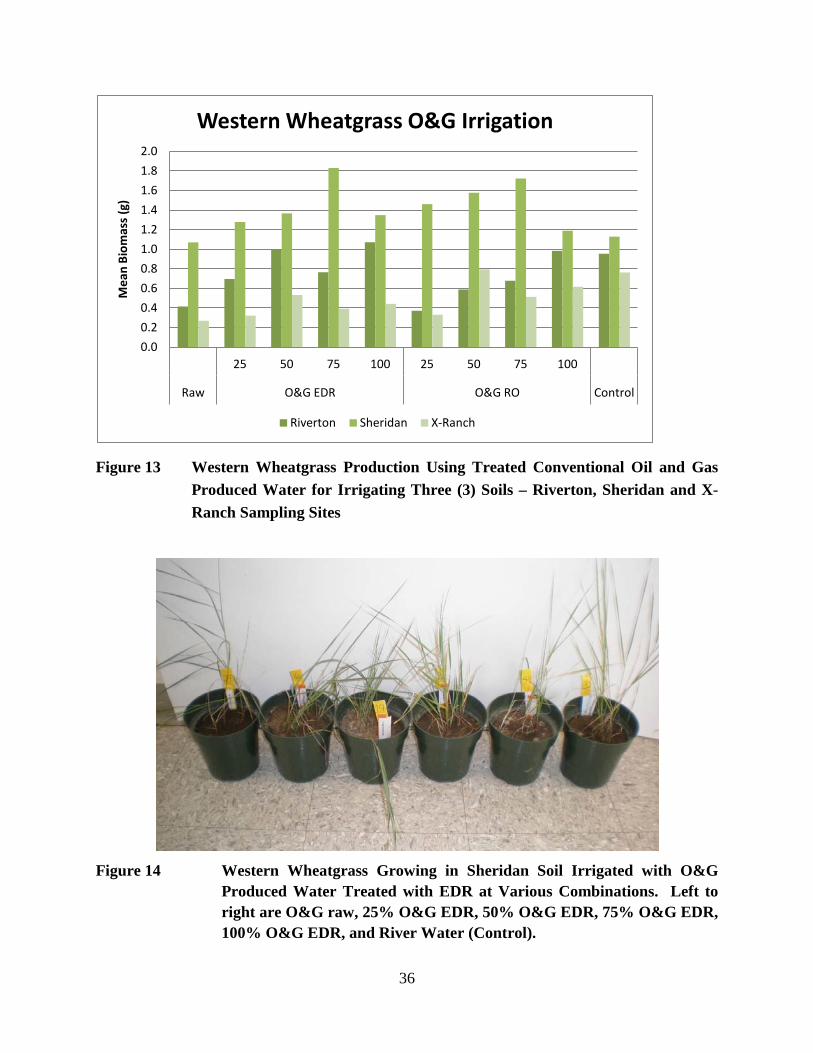
36
Figure 13 Western Wheatgrass Production Using Treated Conventional Oil and Gas Produced Water for Irrigating Three (3) Soils – Riverton, Sheridan and X-Ranch Sampling Sites
Figure 14 Western Wheatgrass Growing in Sheridan Soil Irrigated with O&G
Produced Water Treated with EDR at Various Combinations. Left to right are O&G raw, 25% O&G EDR, 50% O&G EDR, 75% O&G EDR, 100% O&G EDR, and River Water (Control).
0.0
0.2
0.4
0.6
0.8
1.0
1.2
1.4
1.6
1.8
2.0
25 50 75 100 25 50 75 100
Raw O&G EDR O&G RO Control
Mea
n Bi
omas
s (g
)Western Wheatgrass O&G Irrigation
Riverton Sheridan X-Ranch
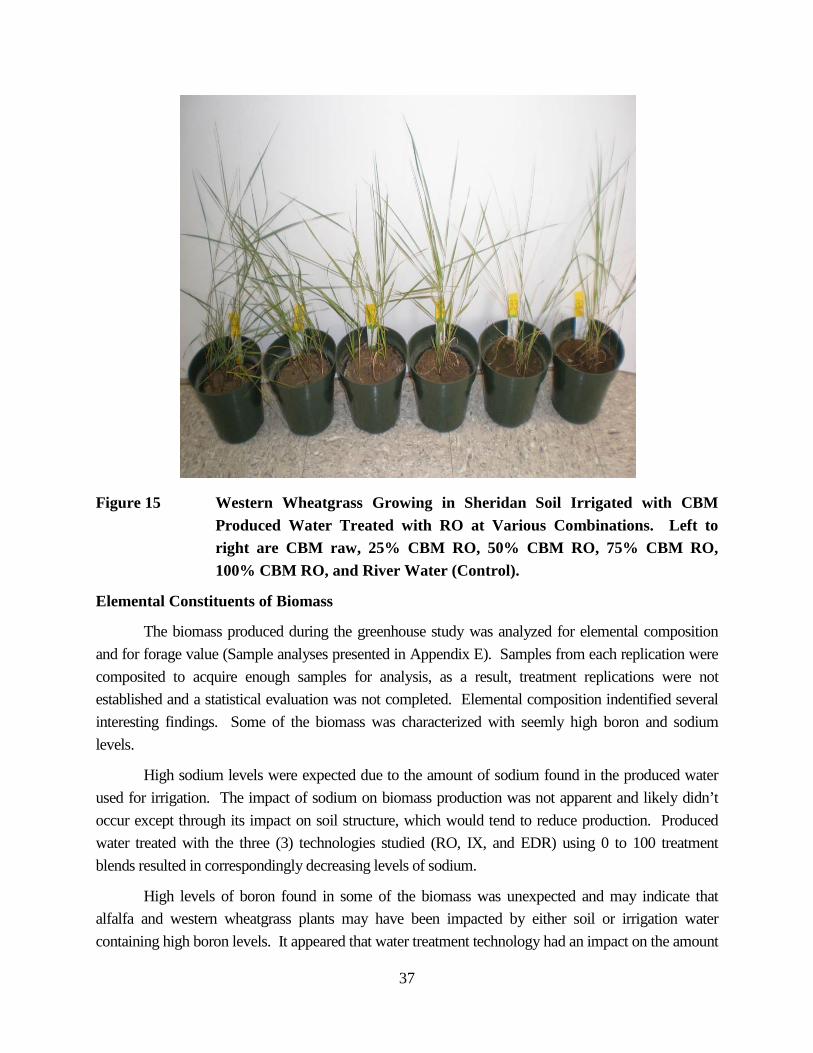
37
Figure 15 Western Wheatgrass Growing in Sheridan Soil Irrigated with CBM Produced Water Treated with RO at Various Combinations. Left to right are CBM raw, 25% CBM RO, 50% CBM RO, 75% CBM RO, 100% CBM RO, and River Water (Control).
Elemental Constituents of Biomass
The biomass produced during the greenhouse study was analyzed for elemental composition and for forage value (Sample analyses presented in Appendix E). Samples from each replication were composited to acquire enough samples for analysis, as a result, treatment replications were not established and a statistical evaluation was not completed. Elemental composition indentified several interesting findings. Some of the biomass was characterized with seemly high boron and sodium levels.
High sodium levels were expected due to the amount of sodium found in the produced water used for irrigation. The impact of sodium on biomass production was not apparent and likely didn’t occur except through its impact on soil structure, which would tend to reduce production. Produced water treated with the three (3) technologies studied (RO, IX, and EDR) using 0 to 100 treatment blends resulted in correspondingly decreasing levels of sodium.
High levels of boron found in some of the biomass was unexpected and may indicate that alfalfa and western wheatgrass plants may have been impacted by either soil or irrigation water containing high boron levels. It appeared that water treatment technology had an impact on the amount
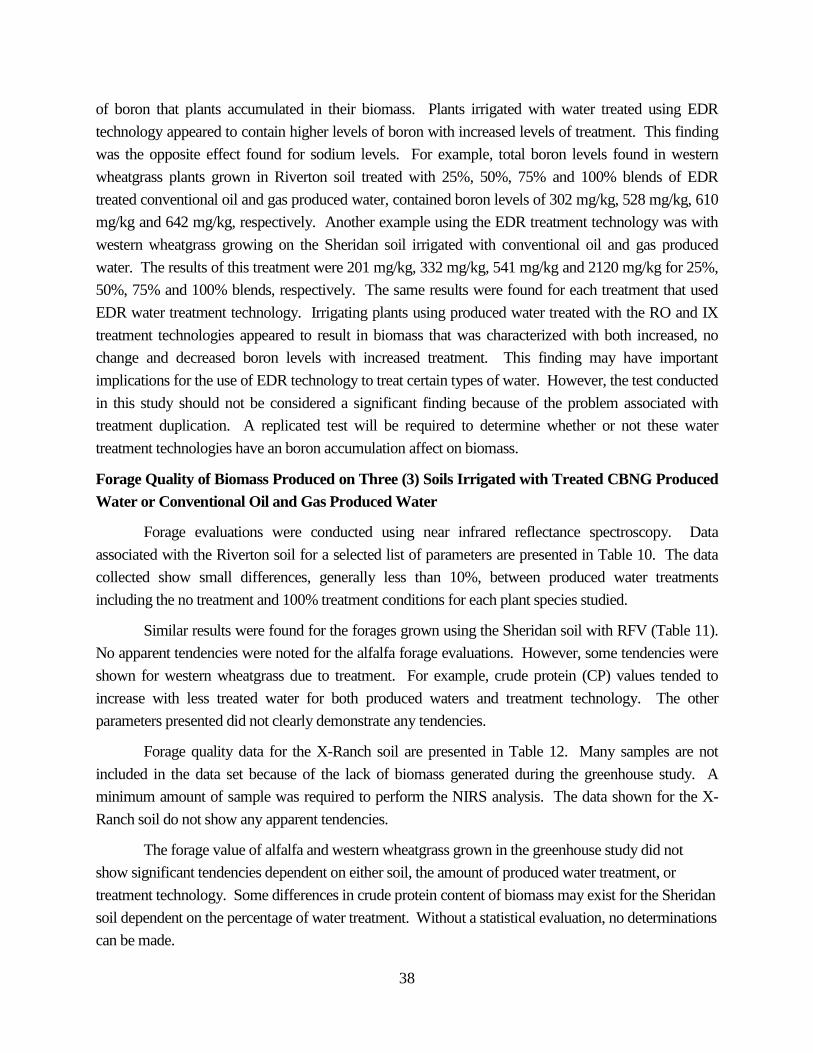
38
of boron that plants accumulated in their biomass. Plants irrigated with water treated using EDR technology appeared to contain higher levels of boron with increased levels of treatment. This finding was the opposite effect found for sodium levels. For example, total boron levels found in western wheatgrass plants grown in Riverton soil treated with 25%, 50%, 75% and 100% blends of EDR treated conventional oil and gas produced water, contained boron levels of 302 mg/kg, 528 mg/kg, 610 mg/kg and 642 mg/kg, respectively. Another example using the EDR treatment technology was with western wheatgrass growing on the Sheridan soil irrigated with conventional oil and gas produced water. The results of this treatment were 201 mg/kg, 332 mg/kg, 541 mg/kg and 2120 mg/kg for 25%, 50%, 75% and 100% blends, respectively. The same results were found for each treatment that used EDR water treatment technology. Irrigating plants using produced water treated with the RO and IX treatment technologies appeared to result in biomass that was characterized with both increased, no change and decreased boron levels with increased treatment. This finding may have important implications for the use of EDR technology to treat certain types of water. However, the test conducted in this study should not be considered a significant finding because of the problem associated with treatment duplication. A replicated test will be required to determine whether or not these water treatment technologies have an boron accumulation affect on biomass.
Forage Quality of Biomass Produced on Three (3) Soils Irrigated with Treated CBNG Produced Water or Conventional Oil and Gas Produced Water
Forage evaluations were conducted using near infrared reflectance spectroscopy. Data associated with the Riverton soil for a selected list of parameters are presented in Table 10. The data collected show small differences, generally less than 10%, between produced water treatments including the no treatment and 100% treatment conditions for each plant species studied.
Similar results were found for the forages grown using the Sheridan soil with RFV (Table 11). No apparent tendencies were noted for the alfalfa forage evaluations. However, some tendencies were shown for western wheatgrass due to treatment. For example, crude protein (CP) values tended to increase with less treated water for both produced waters and treatment technology. The other parameters presented did not clearly demonstrate any tendencies.
Forage quality data for the X-Ranch soil are presented in Table 12. Many samples are not included in the data set because of the lack of biomass generated during the greenhouse study. A minimum amount of sample was required to perform the NIRS analysis. The data shown for the X-Ranch soil do not show any apparent tendencies.
The forage value of alfalfa and western wheatgrass grown in the greenhouse study did not show significant tendencies dependent on either soil, the amount of produced water treatment, or treatment technology. Some differences in crude protein content of biomass may exist for the Sheridan soil dependent on the percentage of water treatment. Without a statistical evaluation, no determinations can be made.

39
Table 10 Forage Quality for Alfalfa and Western Wheatgrass Grown on the Riverton Soil Irrigated with Conventional Oil and Gas Produced Water Treated with EDR and RO; and CBNG Produced Water treated with IX and RO. (COG – conventional oil and gas; RO – reverse osmosis; IX – ion exchange (EMIT Technology); EDR – electrodialysis reversal; CP – crude protein; SP – soluble protein; ADF – acid detergent fiber; NDF – neutral detergent fiber; P – phosphorous; TDN – total digestible nutrients; RFV – relative feed value)
Sample Type Trt
Tech CP
(%DM) SP
(%DM) ADF
(%DM) NDF
(%DM) P
(%DM) TDN
(%DM) RFV Alfalfa
100% Treated COG RO 26.3 10.6 21.3 25.4 0.3 67.2 265 75% Treated COG RO 28.1 10.5 18.6 22.8 0.4 67.9 304 100% Treated COG EDR 27.1 9.8 20.5 25.5 0.3 66.5 266 Control River No Trt 27.7 10.6 20.7 24.6 0.4 67.8 275 100% Treated CBNG IX 27.4 11.0 20.5 25.2 0.3 66.6 270 75% Treated CBNG IX 27.4 10.8 21.3 25.3 0.4 67.1 265 50% Treated CBNG IX 26.7 10.0 22.5 26.5 0.4 65.0 250 25% Treated CBNG IX 28.4 10.9 19.1 23.8 0.3 68.0 290 100% Treated CBNG RO 28.5 10.8 18.0 23.2 0.4 69.3 301 75% Treated CBNG RO 25.6 10.4 21.7 26.8 0.3 67.3 250 50% Treated CBNG RO 27.5 10.4 19.5 24.5 0.3 68.9 280 25% Treated CBNG RO 27.3 10.0 20.2 25.0 0.3 67.3 273
Western Wheatgrass
100% Treated COG RO 11.1 4.2 39.5 58.6 0.3 56.2 92 100% Treated COG EDR 8.6 4.0 39.9 56.3 0.3 56.2 96 50% Treated COG EDR 10.1 4.2 39.9 54.8 0.3 54.3 98 100% Treated CBNG IX 9.3 3.8 39.7 57.5 0.3 55.9 94 75% Treated CBNG IX 10.2 3.9 40.5 57.3 0.3 55.0 93 50% treated CBNG IX 11.8 4.3 39.0 56.1 0.3 56.3 97 25% Treated CBNG IX 13.9 5.0 37.3 55.5 0.3 57.4 100 100% Treated CBNG RO 10.1 3.8 39.9 58.0 0.3 57.4 93 75% Treated CBNG RO 10.1 3.8 39.8 56.7 0.3 57.1 95 50% Treated CBNG RO 10.9 4.0 37.2 58.4 0.3 59.5 96 25% Treated CBNG RO 11.0 4.3 37.2 56.2 0.3 58.6 99 Untreated No Trt. No Trt 14.3 5.1 36.4 56.1 0.3 57.9 101
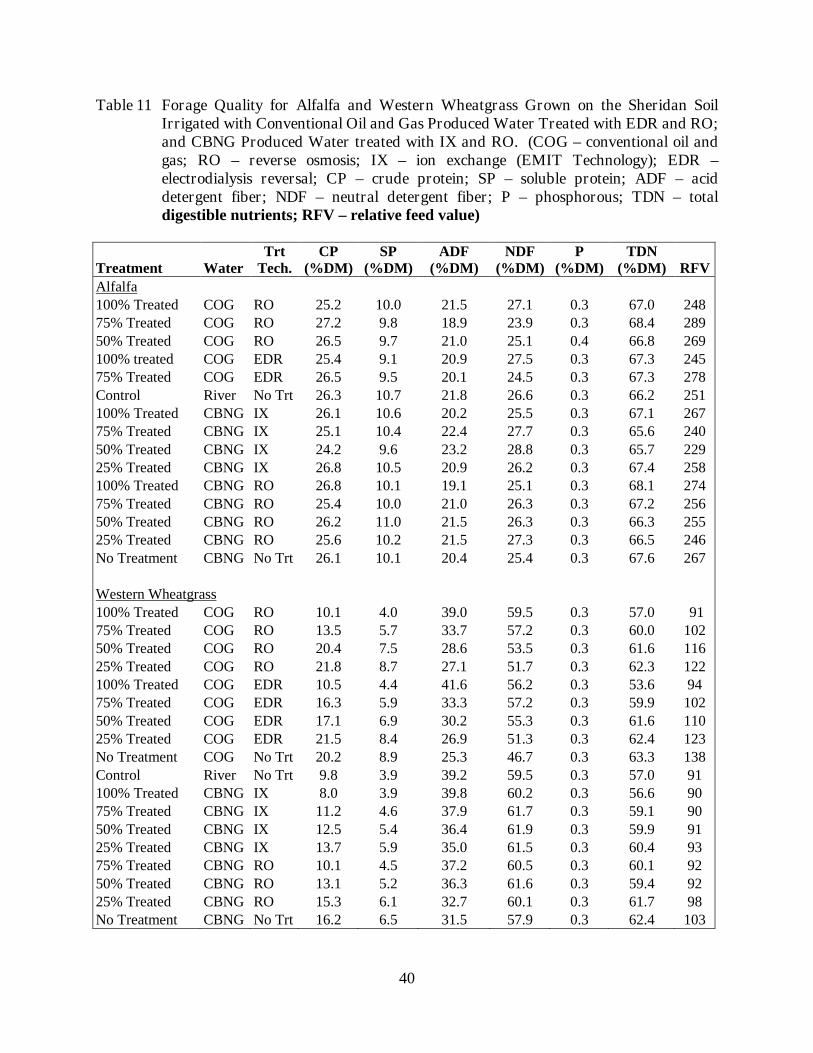
40
Table 11 Forage Quality for Alfalfa and Western Wheatgrass Grown on the Sheridan Soil Irrigated with Conventional Oil and Gas Produced Water Treated with EDR and RO; and CBNG Produced Water treated with IX and RO. (COG – conventional oil and gas; RO – reverse osmosis; IX – ion exchange (EMIT Technology); EDR – electrodialysis reversal; CP – crude protein; SP – soluble protein; ADF – acid detergent fiber; NDF – neutral detergent fiber; P – phosphorous; TDN – total digestible nutrients; RFV – relative feed value)
Treatment Water Trt
Tech. CP
(%DM) SP
(%DM) ADF
(%DM) NDF
(%DM) P
(%DM) TDN
(%DM) RFV Alfalfa
100% Treated COG RO 25.2 10.0 21.5 27.1 0.3 67.0 248 75% Treated COG RO 27.2 9.8 18.9 23.9 0.3 68.4 289 50% Treated COG RO 26.5 9.7 21.0 25.1 0.4 66.8 269 100% treated COG EDR 25.4 9.1 20.9 27.5 0.3 67.3 245 75% Treated COG EDR 26.5 9.5 20.1 24.5 0.3 67.3 278 Control River No Trt 26.3 10.7 21.8 26.6 0.3 66.2 251 100% Treated CBNG IX 26.1 10.6 20.2 25.5 0.3 67.1 267 75% Treated CBNG IX 25.1 10.4 22.4 27.7 0.3 65.6 240 50% Treated CBNG IX 24.2 9.6 23.2 28.8 0.3 65.7 229 25% Treated CBNG IX 26.8 10.5 20.9 26.2 0.3 67.4 258 100% Treated CBNG RO 26.8 10.1 19.1 25.1 0.3 68.1 274 75% Treated CBNG RO 25.4 10.0 21.0 26.3 0.3 67.2 256 50% Treated CBNG RO 26.2 11.0 21.5 26.3 0.3 66.3 255 25% Treated CBNG RO 25.6 10.2 21.5 27.3 0.3 66.5 246 No Treatment CBNG No Trt 26.1 10.1 20.4 25.4 0.3 67.6 267
Western Wheatgrass
100% Treated COG RO 10.1 4.0 39.0 59.5 0.3 57.0 91 75% Treated COG RO 13.5 5.7 33.7 57.2 0.3 60.0 102 50% Treated COG RO 20.4 7.5 28.6 53.5 0.3 61.6 116 25% Treated COG RO 21.8 8.7 27.1 51.7 0.3 62.3 122 100% Treated COG EDR 10.5 4.4 41.6 56.2 0.3 53.6 94 75% Treated COG EDR 16.3 5.9 33.3 57.2 0.3 59.9 102 50% Treated COG EDR 17.1 6.9 30.2 55.3 0.3 61.6 110 25% Treated COG EDR 21.5 8.4 26.9 51.3 0.3 62.4 123 No Treatment COG No Trt 20.2 8.9 25.3 46.7 0.3 63.3 138 Control River No Trt 9.8 3.9 39.2 59.5 0.3 57.0 91 100% Treated CBNG IX 8.0 3.9 39.8 60.2 0.3 56.6 90 75% Treated CBNG IX 11.2 4.6 37.9 61.7 0.3 59.1 90 50% Treated CBNG IX 12.5 5.4 36.4 61.9 0.3 59.9 91 25% Treated CBNG IX 13.7 5.9 35.0 61.5 0.3 60.4 93 75% Treated CBNG RO 10.1 4.5 37.2 60.5 0.3 60.1 92 50% Treated CBNG RO 13.1 5.2 36.3 61.6 0.3 59.4 92 25% Treated CBNG RO 15.3 6.1 32.7 60.1 0.3 61.7 98 No Treatment CBNG No Trt 16.2 6.5 31.5 57.9 0.3 62.4 103

41
Table 12 Forage Quality for Alfalfa and Western Wheatgrass Grown on the X-Ranch Soil Irrigated with CBNG Produced Water Treated with IX and RO. (COG – conventional oil and gas; RO – reverse osmosis; IX – ion exchange (EMIT Technology); EDR – electrodialysis reversal; CP – crude protein; SP – soluble protein; ADF – acid detergent fiber; NDF – neutral detergent fiber; P – phosphorous; TDN – total digestible nutrients; RFV – relative feed value)
Treatment Water Trt.
Tech CP
(%DM) SP
(%DM) ADF
(%DM) NDF
(%DM) P
(%DM) TDN
(%DM) RFV
Alfalfa
75% Trt CBNG IX 26.7 10.4 19.2 24.1 0.3 68.1 286
50% Trt CBNG IX 25.7 10.3 21.7 25.8 0.3 65.9 259
100% Trt CBNG RO 23.4 9.6 24.4 28.8 0.3 64.1 225
75% Trt CBNG RO 24.9 9.9 21.4 25.9 0.3 66.5 259
50% Trt CBNG RO 26.2 10.3 21.5 26.1 0.4 65.5 257
25% Trt CBNG RO 24.9 9.7 23.0 27.6 0.3 64.8 239
Western Wheatgrass
25% Trt CBNG RO 17.8 6.5 32.3 55.7 0.4 61.1 107
42
CONCLUSIONS
1. Limited differences were found in HC values for soils impacted with treated and untreated CBNG produced water. Produced water treated using the IX and RO technologies at the 100% level was found to be similar to the control (river water) while the HC of soil associated with treatment levels of 25%, 50% and 75% were significantly lower than the control. The HC values associated with the 25%, 50%, and 75% treatments compared well to the HC of soils irrigated with untreated produced water.
2. The HC data collected for conventional oil and gas produced water showed no improvement in HC over untreated produced water for all levels of treatment. Water treatment at any level did not appear to improve HC for conventional oil and gas produced water.
3. Soils impacted by the CBNG produced water and the conventional oil and gas produced water did not have a significant impact on the EC values of the soils. The EC values resulting from all treatments would not be expected to significantly impact biomass production. The only concern would be whether or not the EC values were high enough to prevent dispersion of clays resulting from corresponding high SAR values. However, the SAR values associated with the treated CBNG produced waters were relatively low in all cases and would not be expected to cause dispersion.
4. Some questions as to the validity of the data set with regards to the impact of produced water on soils are apparent. For example, the conventional oil and gas produced water treated with EDC at the 25% treatment level was characterized with an EC of 7.6 dS/m and a SAR of 228. After treatment, the impacted soil was characterized with a mean SAR of 19.9 and a mean EC of 1.8 dS/m. Irrigating a soil with such characteristics would be expected to have a greater impact on the chemistry of the receiving soil.
5. In the germination study, variation between replicates was found to be high resulting in no significant differences in germination for the alfalfa and for the western wheatgrass seeds when watered with the 19 water treatments.
6. The differences in biomass production found between each soil in the Greenhouse irrigation study were significant for Western Wheatgrass and Alfalfa. The Sheridan sandy loam soil resulted in the highest biomass production for western wheatgrass and alfalfa, while the X-ranch sandy loam had the lowest production rate for both plants. The soils reacted to the various water treatment combinations (blends) likely due to the interactions between the soils and the chemical makeup of the treated water.
7. Elemental composition identified several interesting findings. Some of the biomass was characterized with seemly high boron and sodium levels.
8. High levels of boron found in some of the biomass was unexpected and may indicate that such plants were impacted by either soil or irrigation water containing high boron levels. It appeared that water treatment technology had an impact on the amount of boron that plants accumulated in their biomass. Plants irrigated with water treated using EDR technology

43
appeared to contain higher levels of boron with increased levels of treatment. The opposite effect was found for biomass sodium levels.
9. The forage value of alfalfa and western wheatgrass grown in the greenhouse study did not show tendencies dependent on either soil, the amount of produced water treatment, or treatment technology. Some differences in crude protein content of biomass may exist for the Sheridan soil dependent on the percentage of water treatment. However, no meaningful determinations can be made without a statistical evaluation.
44
REFERENCES
1. Bureau of Land Management (BLM PRB FEIS). Final Environmental Impact Statement and Proposed Plan Amendment for the Powder River Basin Oil and Gas Project, 3-229, 3-230. 2003. Bureau of Land Management (BLM PRB FEIS). Final Environmental Impact Statement and Proposed Plan Amendment for the Powder River Basin Oil and Gas Project, 3-229, 3-230. 2003.
2. Veil, J., M. Puder, D. Elcock and R. Redweik. 2004. A White Paper Describing Produced Water from Production of Crude Oil, Natural Gas and Coal Bed Methane. Prepared for DoE NETL Contract No. W-31-109-ENG-38.
3. Hayes, T. and D. Arthur. 2004. Overview of Emerging Produced Water Treatment Technologies. Proceedings of the 11th Annual International Petroleum Environmental Conference, Albuquerque, NM October 12.
4. Interstate Oil and Gas Compact Commission and ALL Consulting. 2006. A Guide to Practical Management of Produced Water from Onshore Oil and Gas Operations in the United States. Report Prepared for U.S. DOE National Petroleum Technology Office.
5. Ashaghi, K.S., M. Ebrahimi, and P. Czermak. 2007. Ceramic Ultra- and Nano-filtration Membranes for Oilfield Produced Water Treatment: A Mini Review. The Open Environmental Journal 1:1-8.
6. Siler, J. 1993. Novel Disk Modules for Membrane Separation Processes. DOE Contract number: AC09-89SR18035.
7. Çakmakci, M., N. Kayaalp, I. Koyuncu. 2008. Desalination of produced water from oil production fields by membrane processes. Desalination 222:176-186.
8. Burnett, D. and M. Siddiqui. 2006. Recovery of Fresh Water Resources from desalination of Brine Produced During Oil and Gas Production Operations, Final Report. DOE Contract number: FC26-03NT15427.
9. Siler, J. 1993. Novel Disk Modules for Membrane Separation Processes. DOE Contract number: AC09-89SR18035.
10. EPA. 1998. Rochem Separation System, Inc. Disc Tube™ Module Technology- Innovative Technology Evaluation Report. EPA-504-R-96-507.
11. Ushikoshi, K., T. Kobayashi, K. Uematsu, A. Toji, D. Kojima and K. Matsumoto. 2002. Leachate Treatment by the Reverse Osmosis System. Journal of Desalination 150:121- 129.
12. Liu, Y., X. Li, B. Wang and S. Liu. 2008. Performance of Landfill Leachate Treatment System with Disc-tube Reverse Osmosis Units. Journal of Frontiers of Environmental Science & Engineering in China 2:24-31.
13. Stuth, J., A. Jama, D. Tolleson. 2003. Direct and indirect means of predicting forage quality through near infrared reflectance spectroscopy. Field Crops Research 84:45-56.

45
APPENDICES
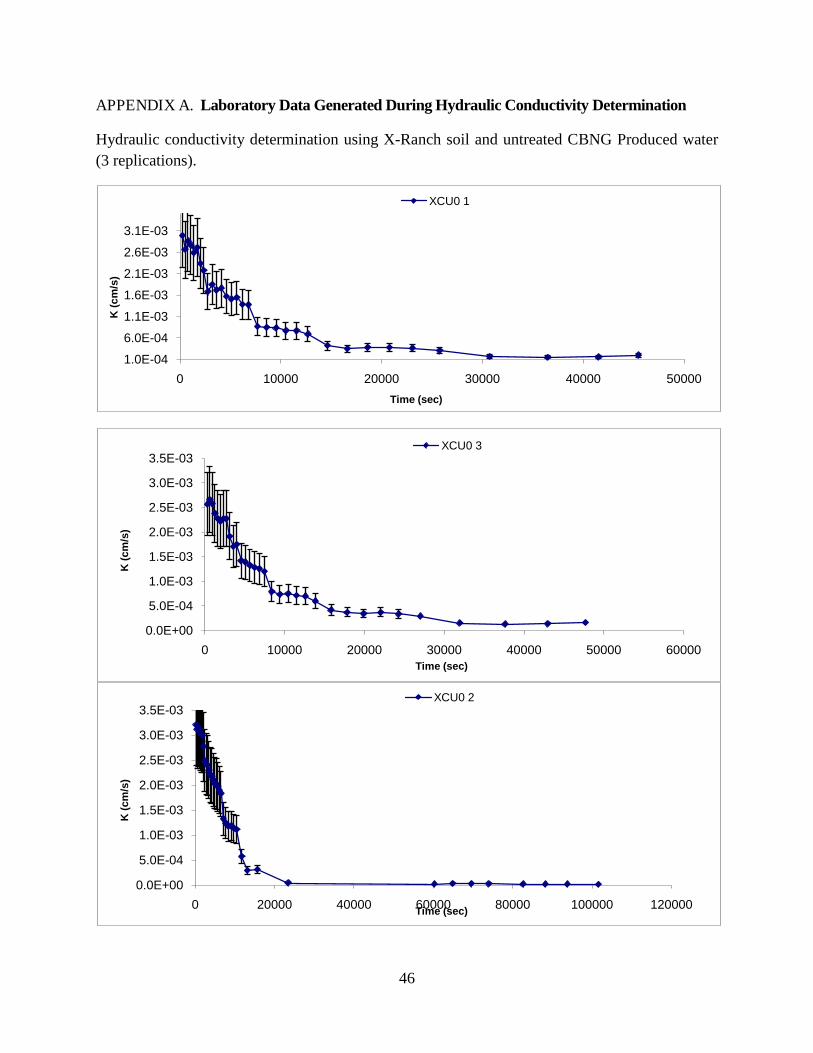
46
APPENDIX A. Laboratory Data Generated During Hydraulic Conductivity Determination
Hydraulic conductivity determination using X-Ranch soil and untreated CBNG Produced water (3 replications).
1.0E-04
6.0E-04
1.1E-03
1.6E-03
2.1E-03
2.6E-03
3.1E-03
0 10000 20000 30000 40000 50000
K (c
m/s
)
Time (sec)
XCU0 1
0.0E+00
5.0E-04
1.0E-03
1.5E-03
2.0E-03
2.5E-03
3.0E-03
3.5E-03
0 10000 20000 30000 40000 50000 60000
K (c
m/s
)
Time (sec)
XCU0 3 XCU0 3
0.0E+00
5.0E-04
1.0E-03
1.5E-03
2.0E-03
2.5E-03
3.0E-03
3.5E-03
0 20000 40000 60000 80000 100000 120000
K (c
m/s
)
Time (sec)
XCU0 2 XCU0 2
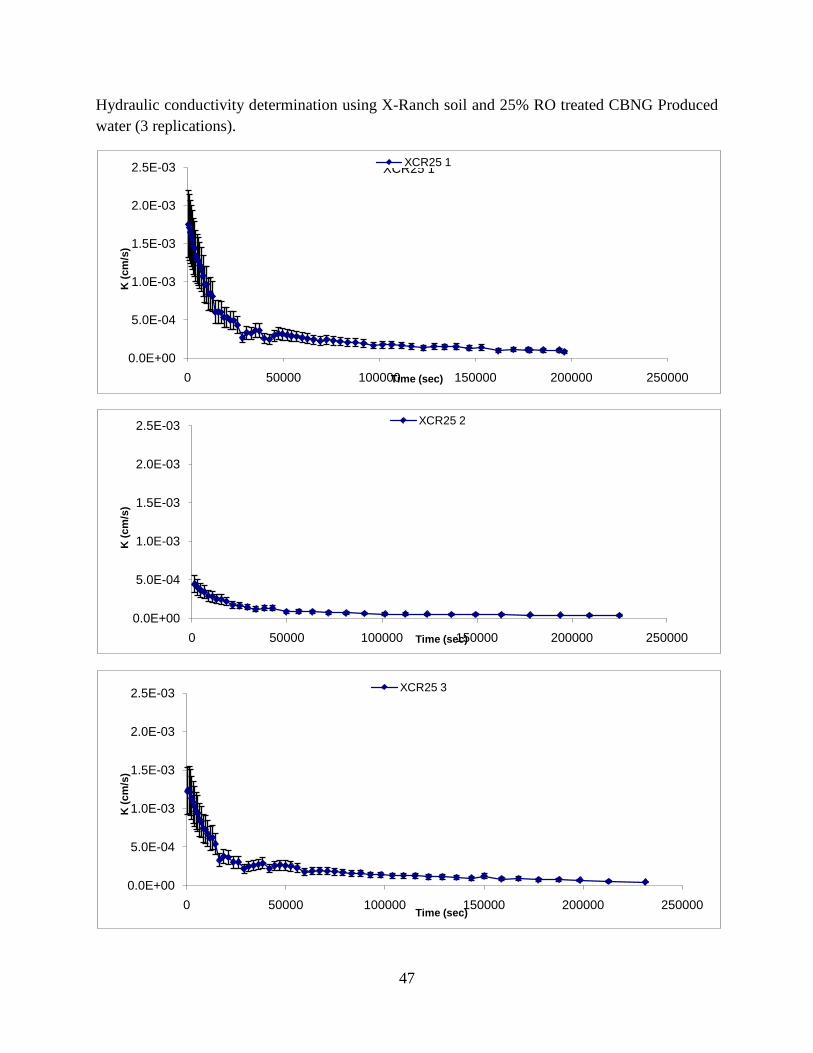
47
Hydraulic conductivity determination using X-Ranch soil and 25% RO treated CBNG Produced water (3 replications).
0.0E+00
5.0E-04
1.0E-03
1.5E-03
2.0E-03
2.5E-03
0 50000 100000 150000 200000 250000
K (c
m/s
)
Time (sec)
XCR25 1XCR25 1
0.0E+00
5.0E-04
1.0E-03
1.5E-03
2.0E-03
2.5E-03
0 50000 100000 150000 200000 250000
K (c
m/s
)
Time (sec)
XCR25 2
0.0E+00
5.0E-04
1.0E-03
1.5E-03
2.0E-03
2.5E-03
0 50000 100000 150000 200000 250000
K (c
m/s
)
Time (sec)
XCR25 3XCR25 3

48
Hydraulic conductivity determination using X-Ranch soil and 50% RO treated CBNG Produced water (3 replications).
-5.0E-04
6.1E-17
5.0E-04
1.0E-03
1.5E-03
2.0E-03
2.5E-03
3.0E-03
3.5E-03
0 50000 100000 150000 200000 250000
K (c
m/s
)
Time (sec)
XCR50 1XCR50 1
0.0E+00
5.0E-04
1.0E-03
1.5E-03
2.0E-03
2.5E-03
3.0E-03
3.5E-03
4.0E-03
0 20000 40000 60000 80000 100000 120000 140000 160000
K (c
m/s
)
Time (sec)
XCR50 -2XCR50 -2
0.0E+00
5.0E-04
1.0E-03
1.5E-03
2.0E-03
2.5E-03
3.0E-03
3.5E-03
0 20000 40000 60000 80000 100000 120000 140000 160000
K (c
m/s
)
Time (sec)
XCR50 3XCR50 3
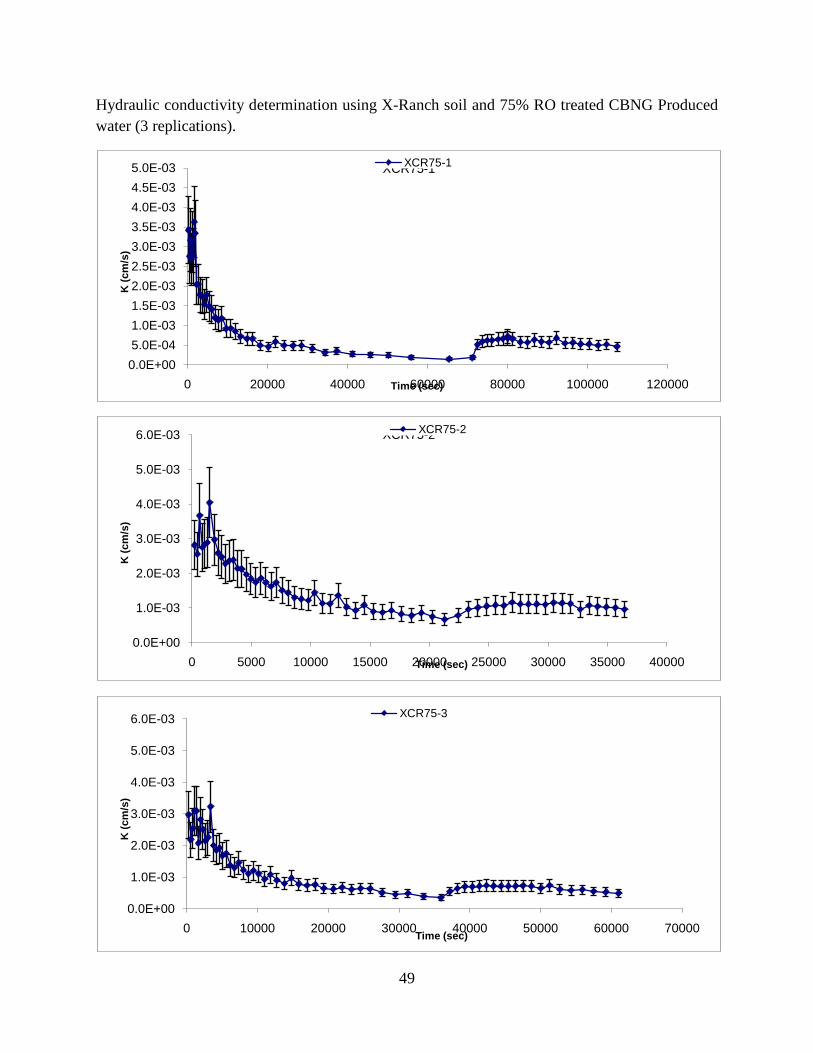
49
Hydraulic conductivity determination using X-Ranch soil and 75% RO treated CBNG Produced water (3 replications).
0.0E+005.0E-041.0E-031.5E-032.0E-032.5E-033.0E-033.5E-034.0E-034.5E-035.0E-03
0 20000 40000 60000 80000 100000 120000
K (c
m/s
)
Time (sec)
XCR75-1XCR75-1
0.0E+00
1.0E-03
2.0E-03
3.0E-03
4.0E-03
5.0E-03
6.0E-03
0 5000 10000 15000 20000 25000 30000 35000 40000
K (c
m/s
)
Time (sec)
XCR75-2XCR75-2
0.0E+00
1.0E-03
2.0E-03
3.0E-03
4.0E-03
5.0E-03
6.0E-03
0 10000 20000 30000 40000 50000 60000 70000
K (c
m/s
)
Time (sec)
XCR75-3XCR75-3
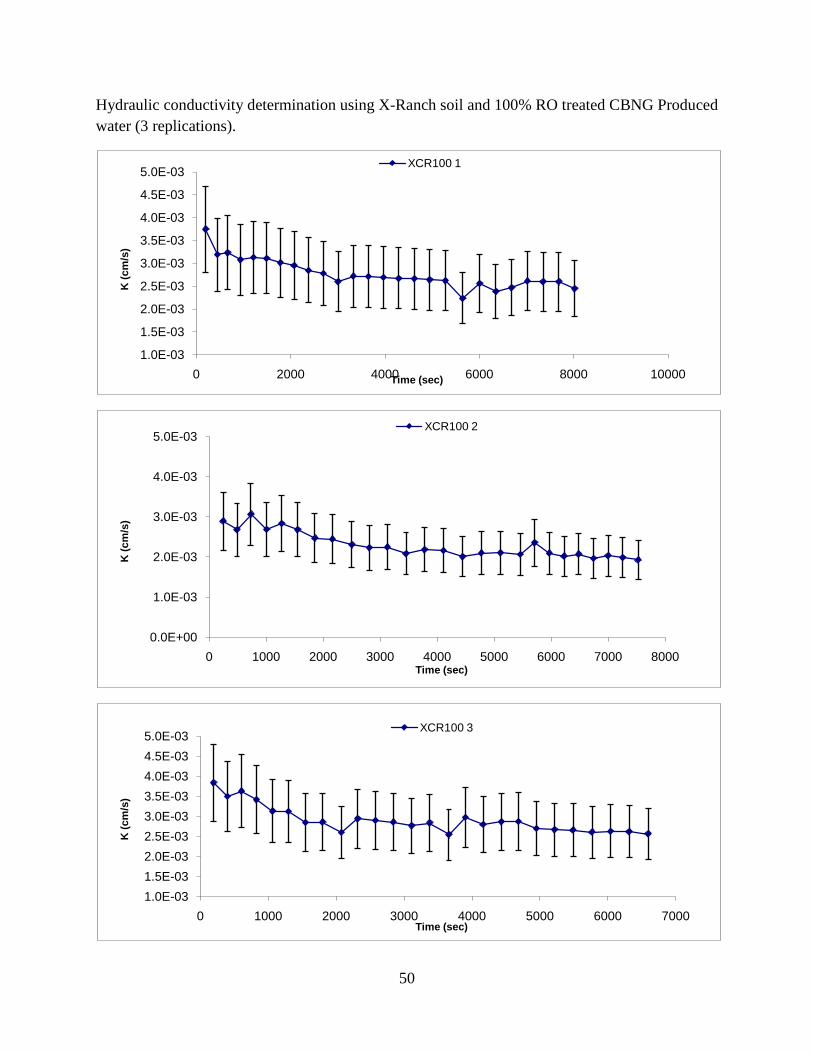
50
Hydraulic conductivity determination using X-Ranch soil and 100% RO treated CBNG Produced water (3 replications).
1.0E-03
1.5E-03
2.0E-03
2.5E-03
3.0E-03
3.5E-03
4.0E-03
4.5E-03
5.0E-03
0 2000 4000 6000 8000 10000
K (c
m/s
)
Time (sec)
XCR100 1
0.0E+00
1.0E-03
2.0E-03
3.0E-03
4.0E-03
5.0E-03
0 1000 2000 3000 4000 5000 6000 7000 8000
K (c
m/s
)
Time (sec)
XCR100 2
1.0E-031.5E-032.0E-032.5E-033.0E-033.5E-034.0E-034.5E-035.0E-03
0 1000 2000 3000 4000 5000 6000 7000
K (c
m/s
)
Time (sec)
XCR100 3
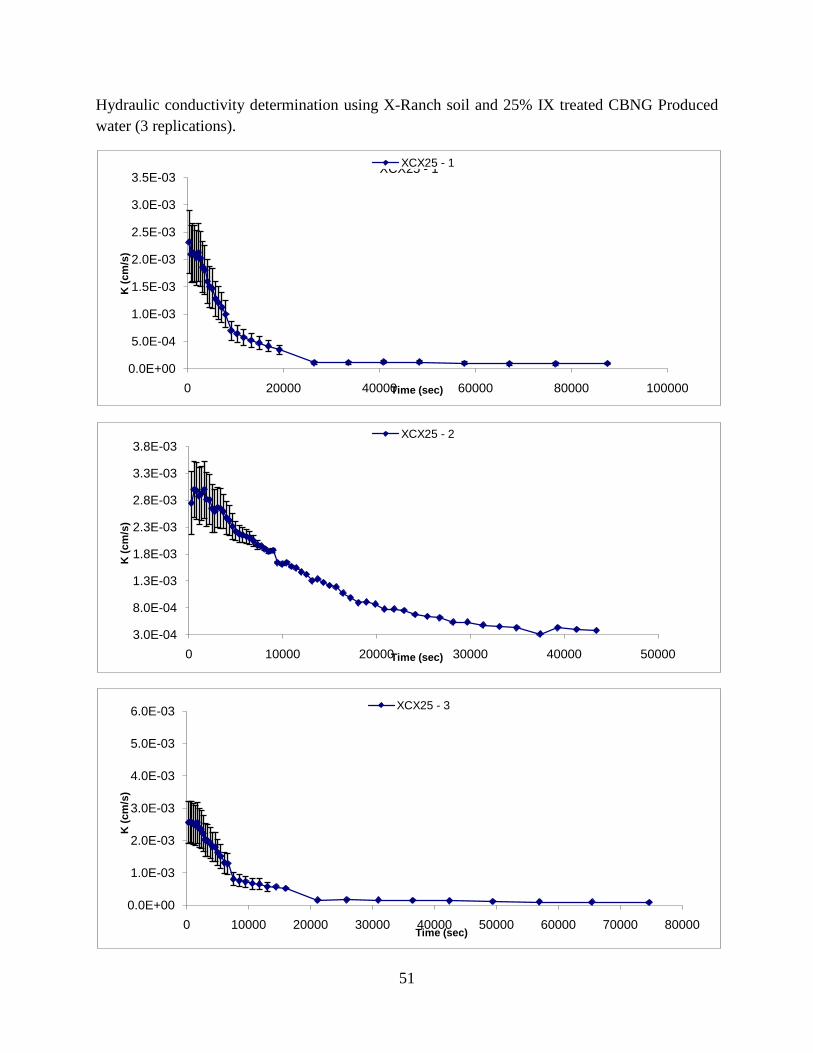
51
Hydraulic conductivity determination using X-Ranch soil and 25% IX treated CBNG Produced water (3 replications).
0.0E+00
5.0E-04
1.0E-03
1.5E-03
2.0E-03
2.5E-03
3.0E-03
3.5E-03
0 20000 40000 60000 80000 100000
K (c
m/s
)
Time (sec)
XCX25 - 1XCX25 - 1
3.0E-04
8.0E-04
1.3E-03
1.8E-03
2.3E-03
2.8E-03
3.3E-03
3.8E-03
0 10000 20000 30000 40000 50000
K (c
m/s
)
Time (sec)
XCX25 - 2
0.0E+00
1.0E-03
2.0E-03
3.0E-03
4.0E-03
5.0E-03
6.0E-03
0 10000 20000 30000 40000 50000 60000 70000 80000
K (c
m/s
)
Time (sec)
XCX25 - 3XCX25 - 3

52
Hydraulic conductivity determination using X-Ranch soil and 50% IX treated CBNG Produced water (3 replications).
0.0E+005.0E-041.0E-031.5E-032.0E-032.5E-033.0E-033.5E-034.0E-034.5E-035.0E-03
0 50000 100000 150000 200000 250000 300000 350000
K (c
m/s
)
Time (sec)
XCX50 1XCX50 1
0.0E+00
1.0E-03
2.0E-03
3.0E-03
4.0E-03
5.0E-03
6.0E-03
0 20000 40000 60000 80000 100000 120000
K (c
m/s
)
Time (sec)
XCX50 2XCX50 2
2.5E-04
1.3E-03
2.3E-03
3.3E-03
4.3E-03
5.3E-03
0 20000 40000 60000 80000 100000
K (c
m/s
)
Time (sec)
XCX50 3
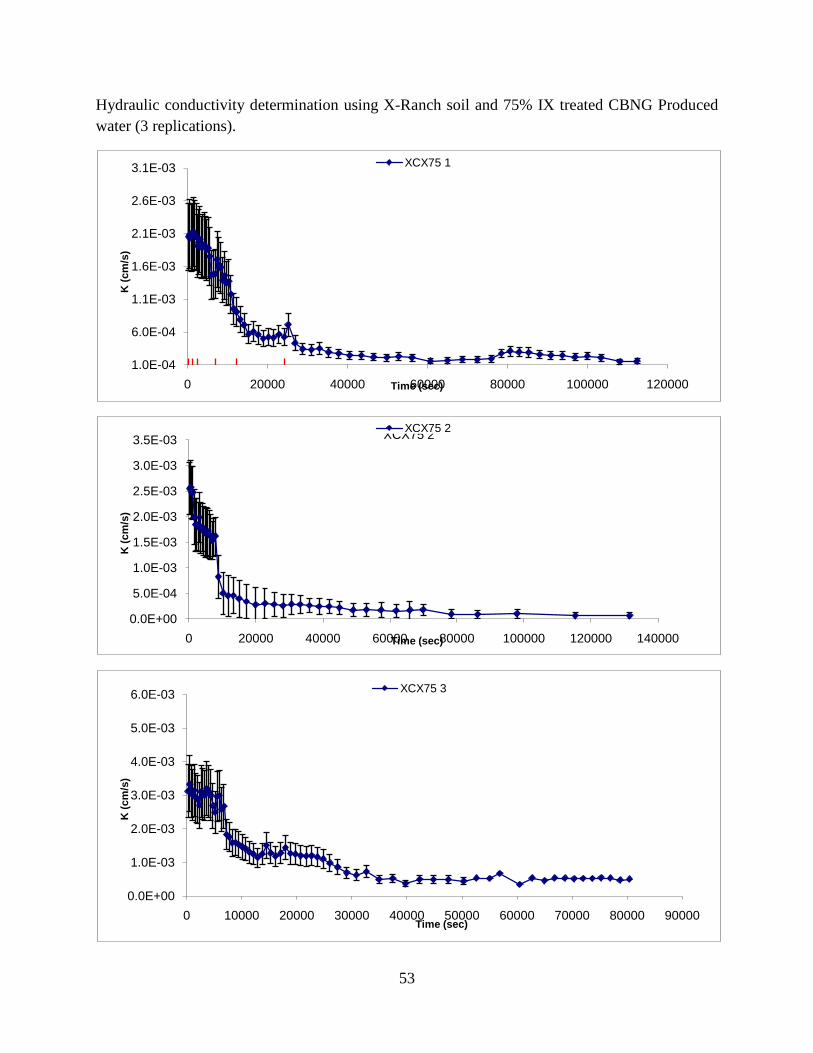
53
Hydraulic conductivity determination using X-Ranch soil and 75% IX treated CBNG Produced water (3 replications).
1.0E-04
6.0E-04
1.1E-03
1.6E-03
2.1E-03
2.6E-03
3.1E-03
0 20000 40000 60000 80000 100000 120000
K (c
m/s
)
Time (sec)
XCX75 1
0.0E+00
5.0E-04
1.0E-03
1.5E-03
2.0E-03
2.5E-03
3.0E-03
3.5E-03
0 20000 40000 60000 80000 100000 120000 140000
K (c
m/s
)
Time (sec)
XCX75 2XCX75 2
0.0E+00
1.0E-03
2.0E-03
3.0E-03
4.0E-03
5.0E-03
6.0E-03
0 10000 20000 30000 40000 50000 60000 70000 80000 90000
K (c
m/s
)
Time (sec)
XCX75 3XCX75 3
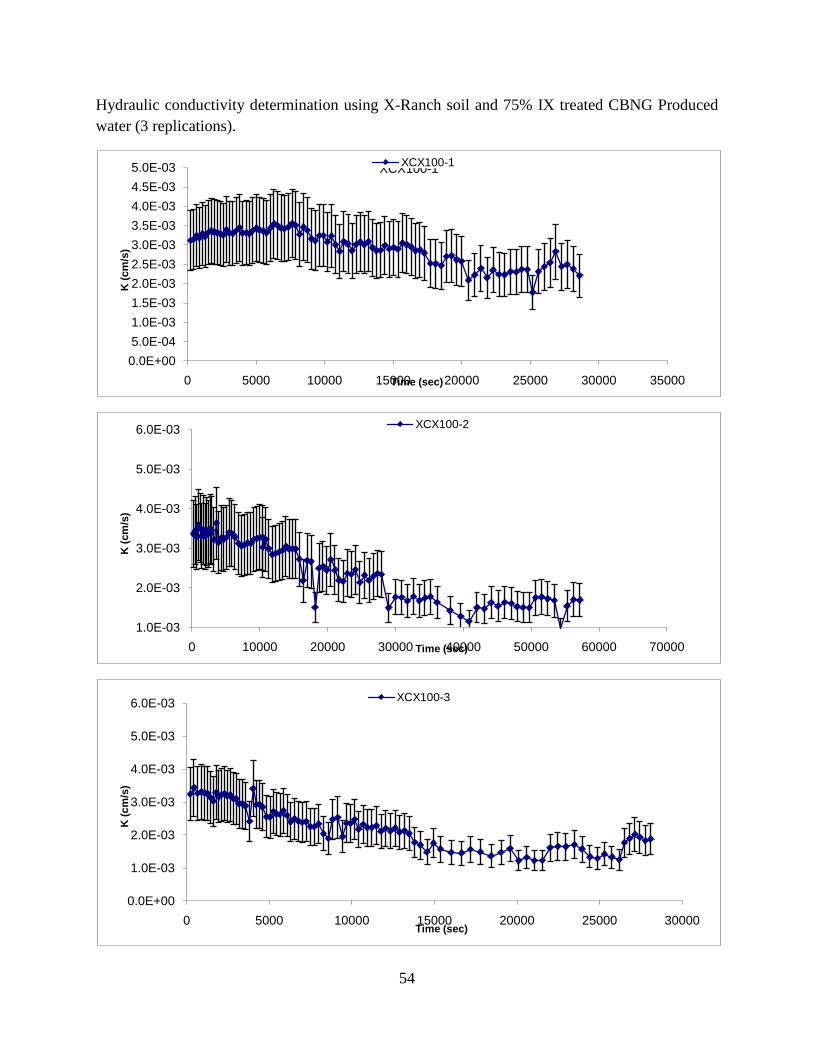
54
Hydraulic conductivity determination using X-Ranch soil and 75% IX treated CBNG Produced water (3 replications).
0.0E+005.0E-041.0E-031.5E-032.0E-032.5E-033.0E-033.5E-034.0E-034.5E-035.0E-03
0 5000 10000 15000 20000 25000 30000 35000
K (c
m/s
)
Time (sec)
XCX100-1XCX100-1
1.0E-03
2.0E-03
3.0E-03
4.0E-03
5.0E-03
6.0E-03
0 10000 20000 30000 40000 50000 60000 70000
K (c
m/s
)
Time (sec)
XCX100-2
0.0E+00
1.0E-03
2.0E-03
3.0E-03
4.0E-03
5.0E-03
6.0E-03
0 5000 10000 15000 20000 25000 30000
K (c
m/s
)
Time (sec)
XCX100-3XCX100-3
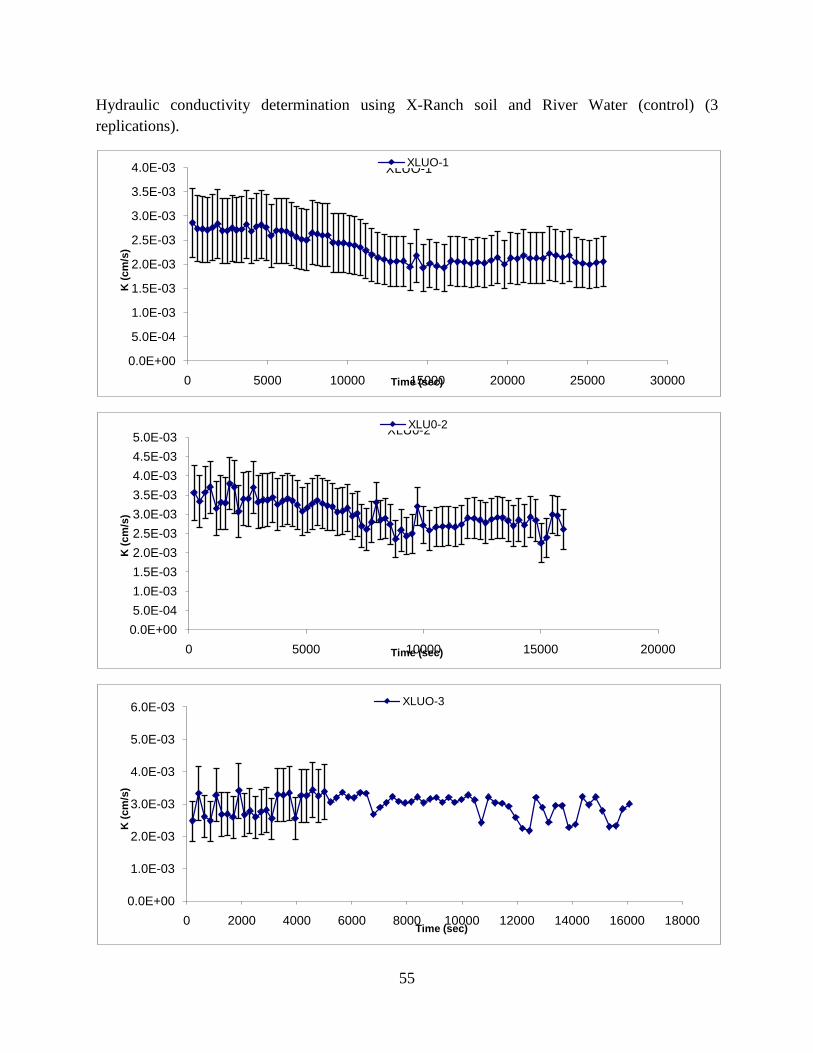
55
Hydraulic conductivity determination using X-Ranch soil and River Water (control) (3 replications).
0.0E+00
5.0E-04
1.0E-03
1.5E-03
2.0E-03
2.5E-03
3.0E-03
3.5E-03
4.0E-03
0 5000 10000 15000 20000 25000 30000
K (c
m/s
)
Time (sec)
XLUO-1XLUO-1
0.0E+005.0E-041.0E-031.5E-032.0E-032.5E-033.0E-033.5E-034.0E-034.5E-035.0E-03
0 5000 10000 15000 20000
K (c
m/s
)
Time (sec)
XLU0-2XLU0-2
0.0E+00
1.0E-03
2.0E-03
3.0E-03
4.0E-03
5.0E-03
6.0E-03
0 2000 4000 6000 8000 10000 12000 14000 16000 18000
K (c
m/s
)
Time (sec)
XLUO-3XLUO-3
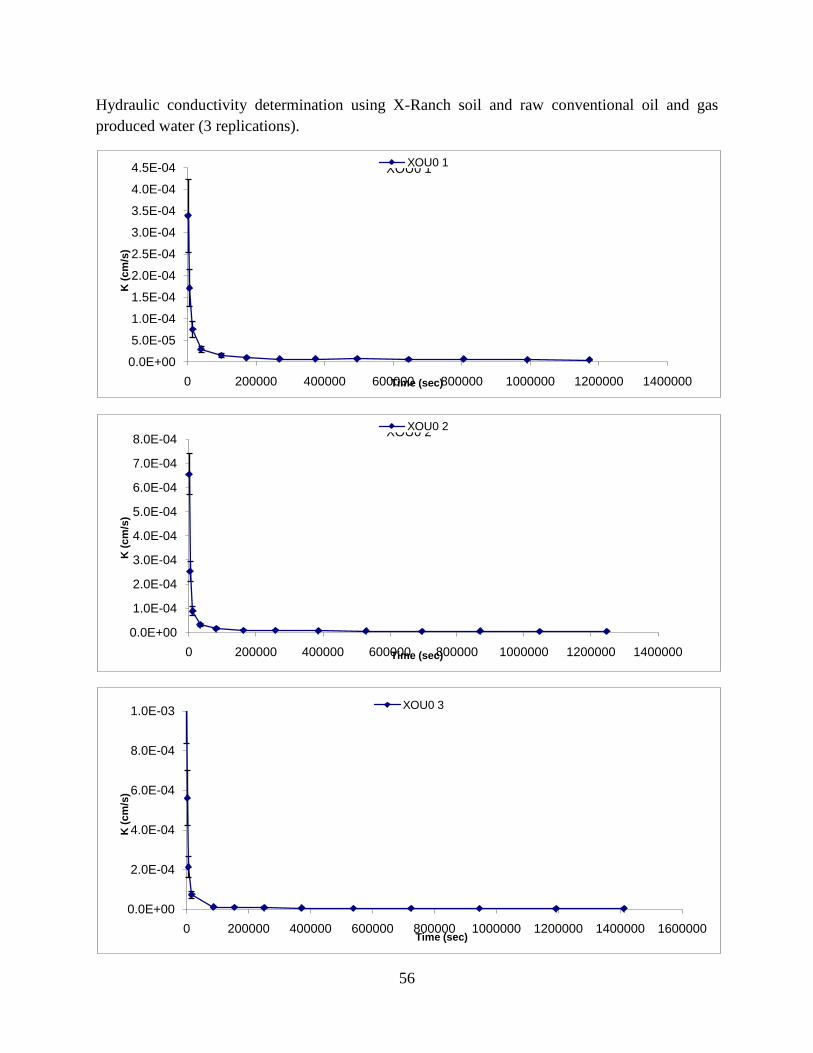
56
Hydraulic conductivity determination using X-Ranch soil and raw conventional oil and gas produced water (3 replications).
0.0E+00
5.0E-05
1.0E-04
1.5E-04
2.0E-04
2.5E-04
3.0E-04
3.5E-04
4.0E-04
4.5E-04
0 200000 400000 600000 800000 1000000 1200000 1400000
K (c
m/s
)
Time (sec)
XOU0 1XOU0 1
0.0E+00
1.0E-04
2.0E-04
3.0E-04
4.0E-04
5.0E-04
6.0E-04
7.0E-04
8.0E-04
0 200000 400000 600000 800000 1000000 1200000 1400000
K (c
m/s
)
Time (sec)
XOU0 2XOU0 2
0.0E+00
2.0E-04
4.0E-04
6.0E-04
8.0E-04
1.0E-03
0 200000 400000 600000 800000 1000000 1200000 1400000 1600000
K (c
m/s
)
Time (sec)
XOU0 3XOU0 3
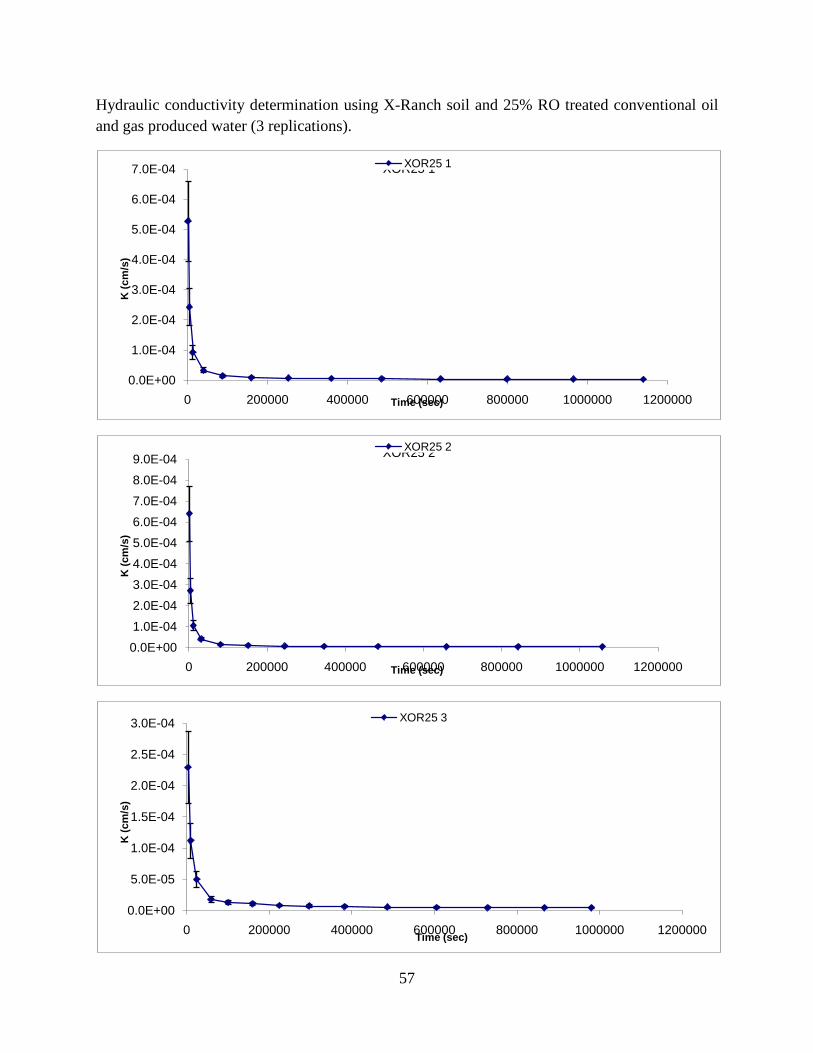
57
Hydraulic conductivity determination using X-Ranch soil and 25% RO treated conventional oil and gas produced water (3 replications).
0.0E+00
1.0E-04
2.0E-04
3.0E-04
4.0E-04
5.0E-04
6.0E-04
7.0E-04
0 200000 400000 600000 800000 1000000 1200000
K (c
m/s
)
Time (sec)
XOR25 1XOR25 1
0.0E+001.0E-042.0E-043.0E-044.0E-045.0E-046.0E-047.0E-048.0E-049.0E-04
0 200000 400000 600000 800000 1000000 1200000
K (c
m/s
)
Time (sec)
XOR25 2XOR25 2
0.0E+00
5.0E-05
1.0E-04
1.5E-04
2.0E-04
2.5E-04
3.0E-04
0 200000 400000 600000 800000 1000000 1200000
K (c
m/s
)
Time (sec)
XOR25 3XOR25 3
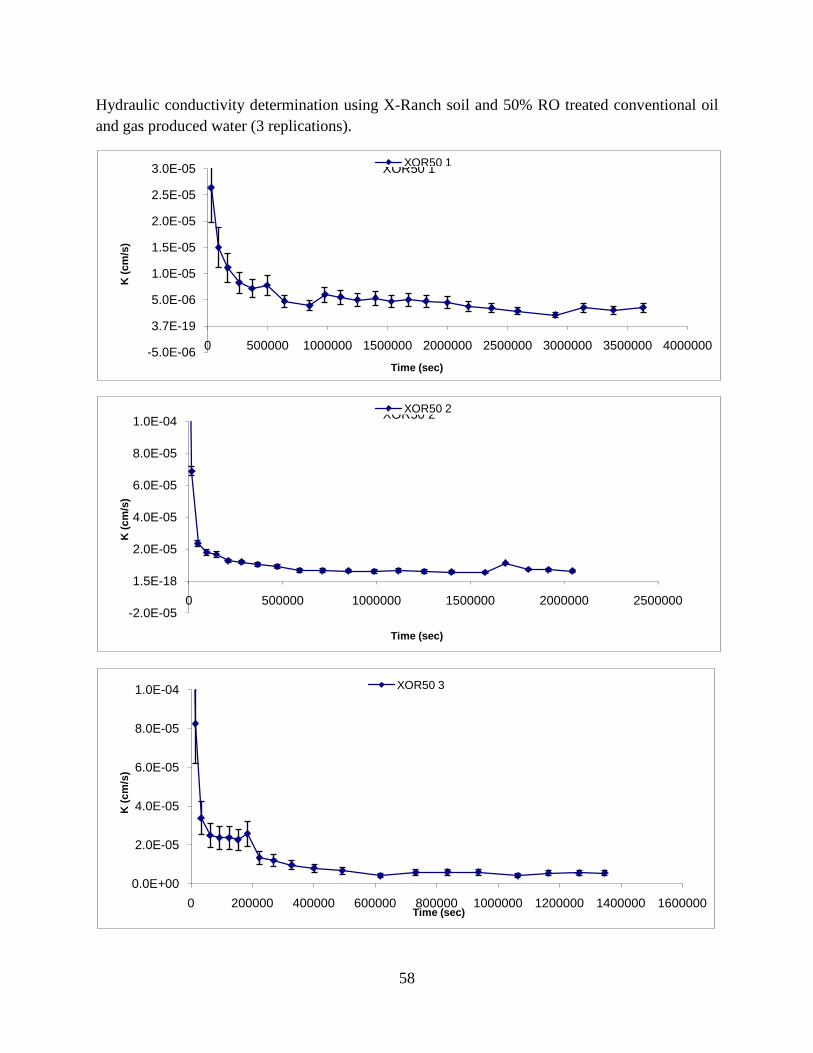
58
Hydraulic conductivity determination using X-Ranch soil and 50% RO treated conventional oil and gas produced water (3 replications).
-5.0E-06
3.7E-19
5.0E-06
1.0E-05
1.5E-05
2.0E-05
2.5E-05
3.0E-05
0 500000 1000000 1500000 2000000 2500000 3000000 3500000 4000000
K (c
m/s
)
Time (sec)
XOR50 1XOR50 1
-2.0E-05
1.5E-18
2.0E-05
4.0E-05
6.0E-05
8.0E-05
1.0E-04
0 500000 1000000 1500000 2000000 2500000
K (c
m/s
)
Time (sec)
XOR50 2XOR50 2
0.0E+00
2.0E-05
4.0E-05
6.0E-05
8.0E-05
1.0E-04
0 200000 400000 600000 800000 1000000 1200000 1400000 1600000
K (c
m/s
)
Time (sec)
XOR50 3XOR50 3
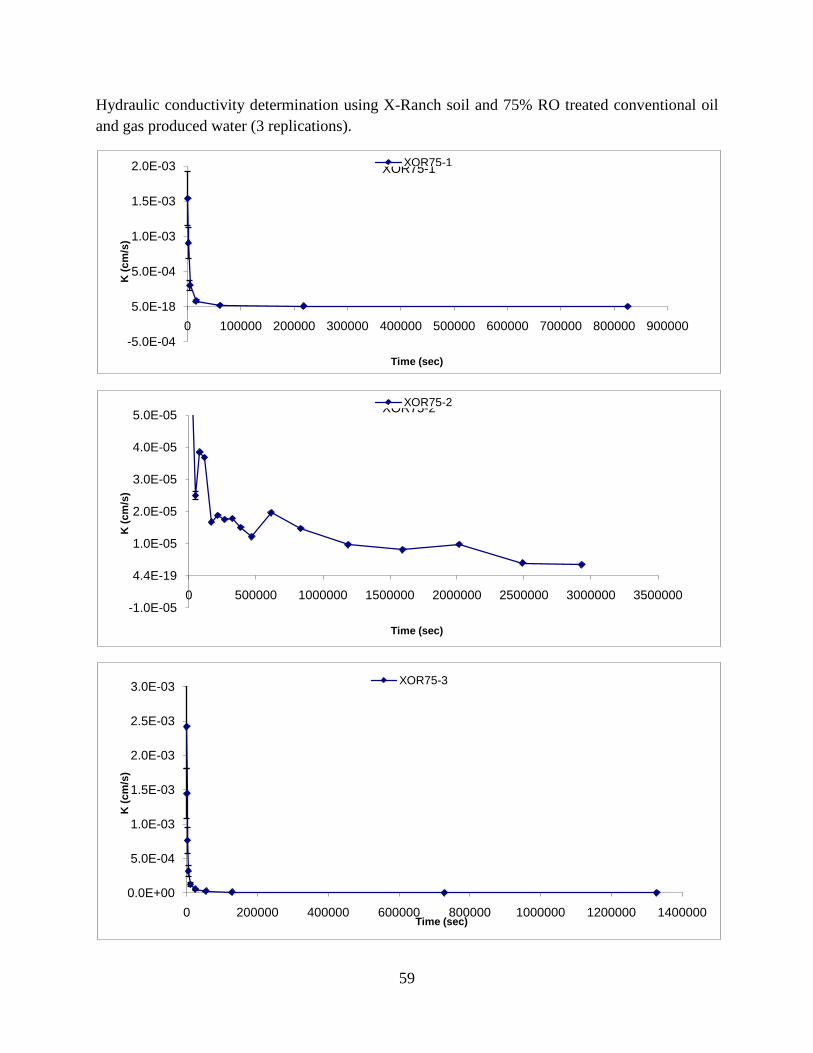
59
Hydraulic conductivity determination using X-Ranch soil and 75% RO treated conventional oil and gas produced water (3 replications).
-5.0E-04
5.0E-18
5.0E-04
1.0E-03
1.5E-03
2.0E-03
0 100000 200000 300000 400000 500000 600000 700000 800000 900000
K (c
m/s
)
Time (sec)
XOR75-1XOR75-1
-1.0E-05
4.4E-19
1.0E-05
2.0E-05
3.0E-05
4.0E-05
5.0E-05
0 500000 1000000 1500000 2000000 2500000 3000000 3500000
K (c
m/s
)
Time (sec)
XOR75-2XOR75-2
0.0E+00
5.0E-04
1.0E-03
1.5E-03
2.0E-03
2.5E-03
3.0E-03
0 200000 400000 600000 800000 1000000 1200000 1400000
K (c
m/s
)
Time (sec)
XOR75-3XOR75-3
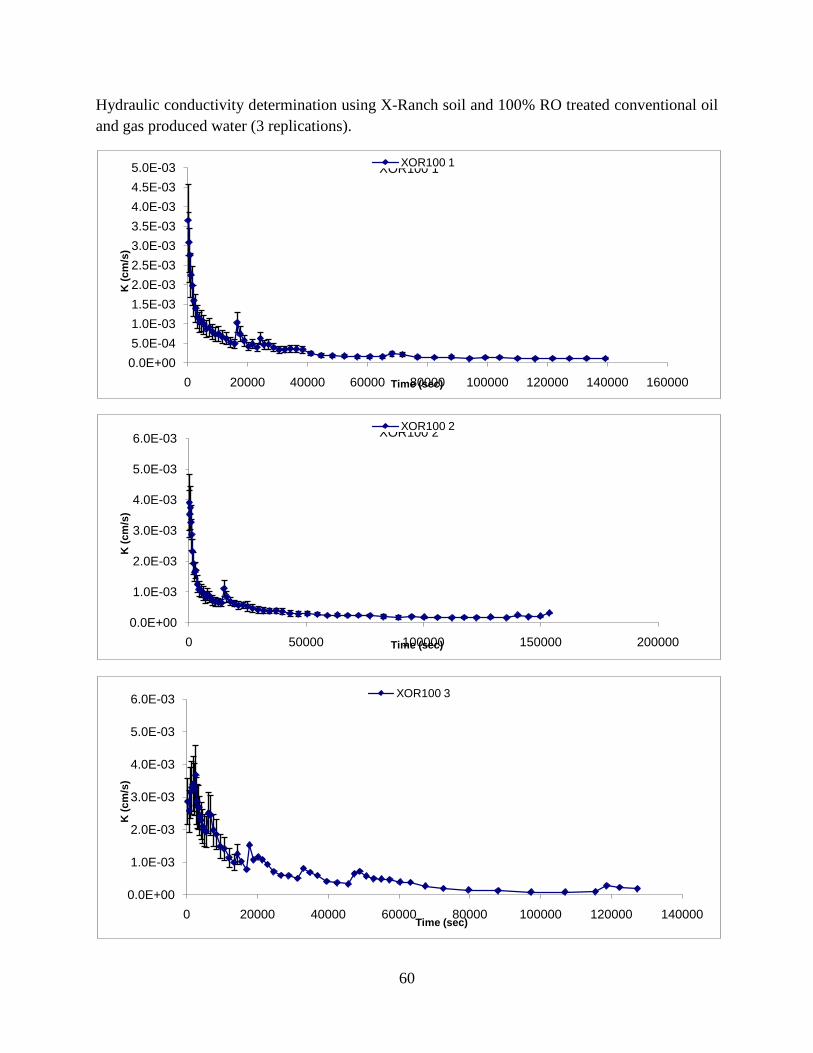
60
Hydraulic conductivity determination using X-Ranch soil and 100% RO treated conventional oil and gas produced water (3 replications).
0.0E+005.0E-041.0E-031.5E-032.0E-032.5E-033.0E-033.5E-034.0E-034.5E-035.0E-03
0 20000 40000 60000 80000 100000 120000 140000 160000
K (c
m/s
)
Time (sec)
XOR100 1XOR100 1
0.0E+00
1.0E-03
2.0E-03
3.0E-03
4.0E-03
5.0E-03
6.0E-03
0 50000 100000 150000 200000
K (c
m/s
)
Time (sec)
XOR100 2XOR100 2
0.0E+00
1.0E-03
2.0E-03
3.0E-03
4.0E-03
5.0E-03
6.0E-03
0 20000 40000 60000 80000 100000 120000 140000
K (c
m/s
)
Time (sec)
XOR100 3XOR100 3

61
Hydraulic conductivity determination using X-Ranch soil and 25% EDR treated conventional oil and gas produced water (3 replications).
-5.0E-05
3.0E-18
5.0E-05
1.0E-04
1.5E-04
2.0E-04
2.5E-04
3.0E-04
0 200000 400000 600000 800000 1000000
K (c
m/s
)
Time (sec)
XOE25 1XOE25 1
-5.0E-05
3.0E-18
5.0E-05
1.0E-04
1.5E-04
2.0E-04
2.5E-04
3.0E-04
0 200000 400000 600000 800000 1000000
K (c
m/s
)
Time (sec)
XOE25 2XOE25 2
0.0E+00
2.0E-05
4.0E-05
6.0E-05
8.0E-05
1.0E-04
0 200000 400000 600000 800000 1000000
K (c
m/s
)
Time (sec)
XOE25 3XOE25 3
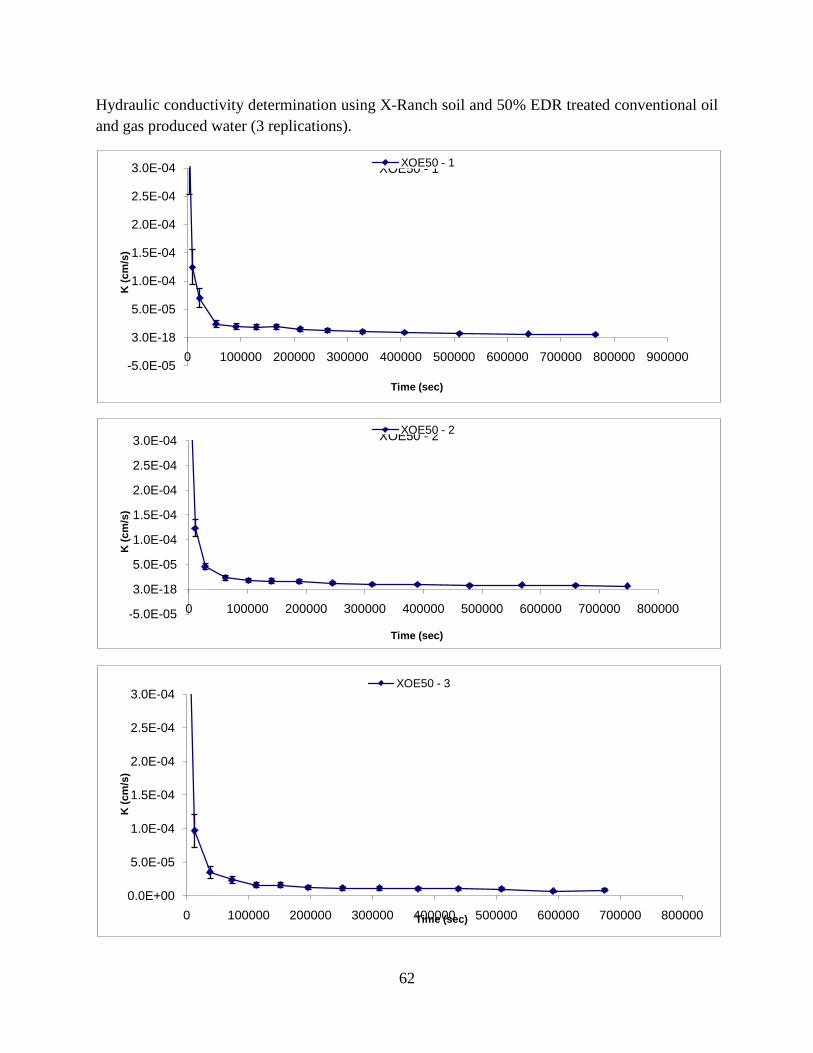
62
Hydraulic conductivity determination using X-Ranch soil and 50% EDR treated conventional oil and gas produced water (3 replications).
-5.0E-05
3.0E-18
5.0E-05
1.0E-04
1.5E-04
2.0E-04
2.5E-04
3.0E-04
0 100000 200000 300000 400000 500000 600000 700000 800000 900000
K (c
m/s
)
Time (sec)
XOE50 - 1XOE50 - 1
-5.0E-05
3.0E-18
5.0E-05
1.0E-04
1.5E-04
2.0E-04
2.5E-04
3.0E-04
0 100000 200000 300000 400000 500000 600000 700000 800000
K (c
m/s
)
Time (sec)
XOE50 - 2XOE50 - 2
0.0E+00
5.0E-05
1.0E-04
1.5E-04
2.0E-04
2.5E-04
3.0E-04
0 100000 200000 300000 400000 500000 600000 700000 800000
K (c
m/s
)
Time (sec)
XOE50 - 3XOE50 - 3

63
Hydraulic conductivity determination using X-Ranch soil and 75% EDR treated conventional oil and gas produced water (3 replications).
-1.0E-05
5.4E-19
1.0E-05
2.0E-05
3.0E-05
4.0E-05
5.0E-05
0 500000 1000000 1500000 2000000
K (c
m/s
)
Time (sec)
XOE75 1XOE75 1
-1.0E-05
4.4E-19
1.0E-05
2.0E-05
3.0E-05
4.0E-05
5.0E-05
0 500000 1000000 1500000 2000000 2500000 3000000
K (c
m/s
)
Time (sec)
XOE75 2XOE75 2
0.0E+00
1.0E-05
2.0E-05
3.0E-05
4.0E-05
5.0E-05
0 500000 1000000 1500000 2000000
K (c
m/s
)
Time (sec)
XOE75 3XOE75 3
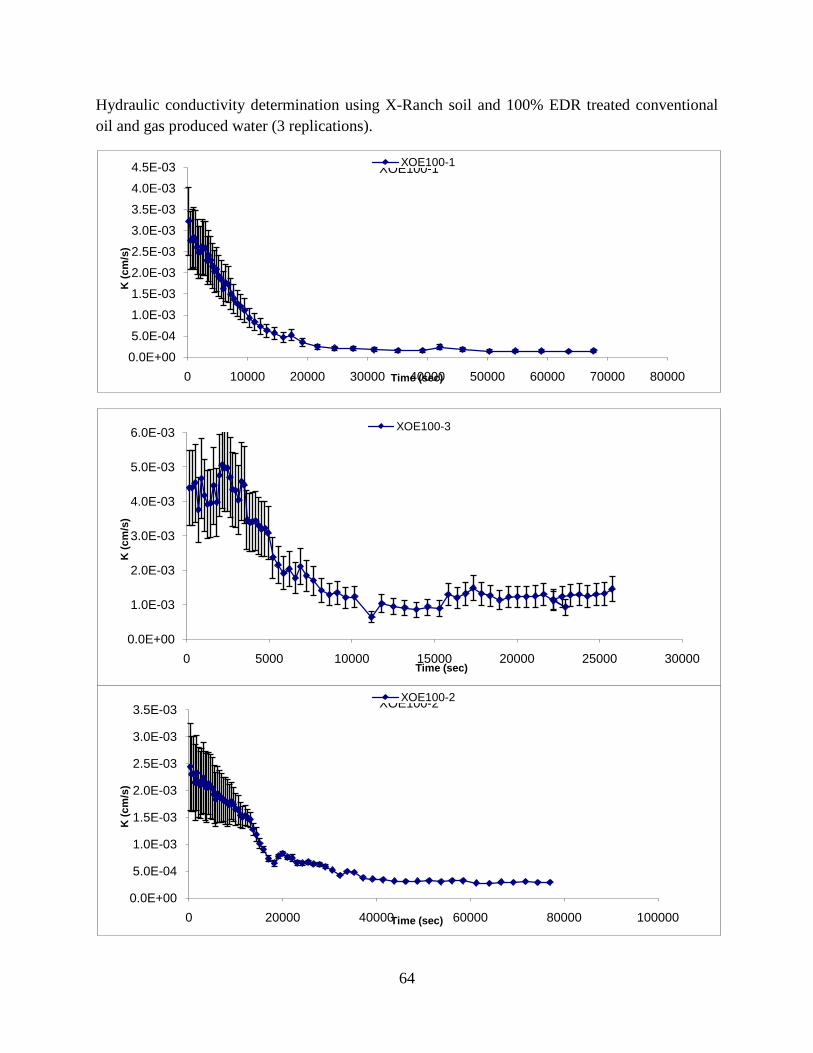
64
Hydraulic conductivity determination using X-Ranch soil and 100% EDR treated conventional oil and gas produced water (3 replications).
0.0E+00
5.0E-04
1.0E-03
1.5E-03
2.0E-03
2.5E-03
3.0E-03
3.5E-03
4.0E-03
4.5E-03
0 10000 20000 30000 40000 50000 60000 70000 80000
K (c
m/s
)
Time (sec)
XOE100-1XOE100-1
0.0E+00
1.0E-03
2.0E-03
3.0E-03
4.0E-03
5.0E-03
6.0E-03
0 5000 10000 15000 20000 25000 30000
K (c
m/s
)
Time (sec)
XOE100-3XOE100-3
0.0E+00
5.0E-04
1.0E-03
1.5E-03
2.0E-03
2.5E-03
3.0E-03
3.5E-03
0 20000 40000 60000 80000 100000
K (c
m/s
)
Time (sec)
XOE100-2XOE100-2
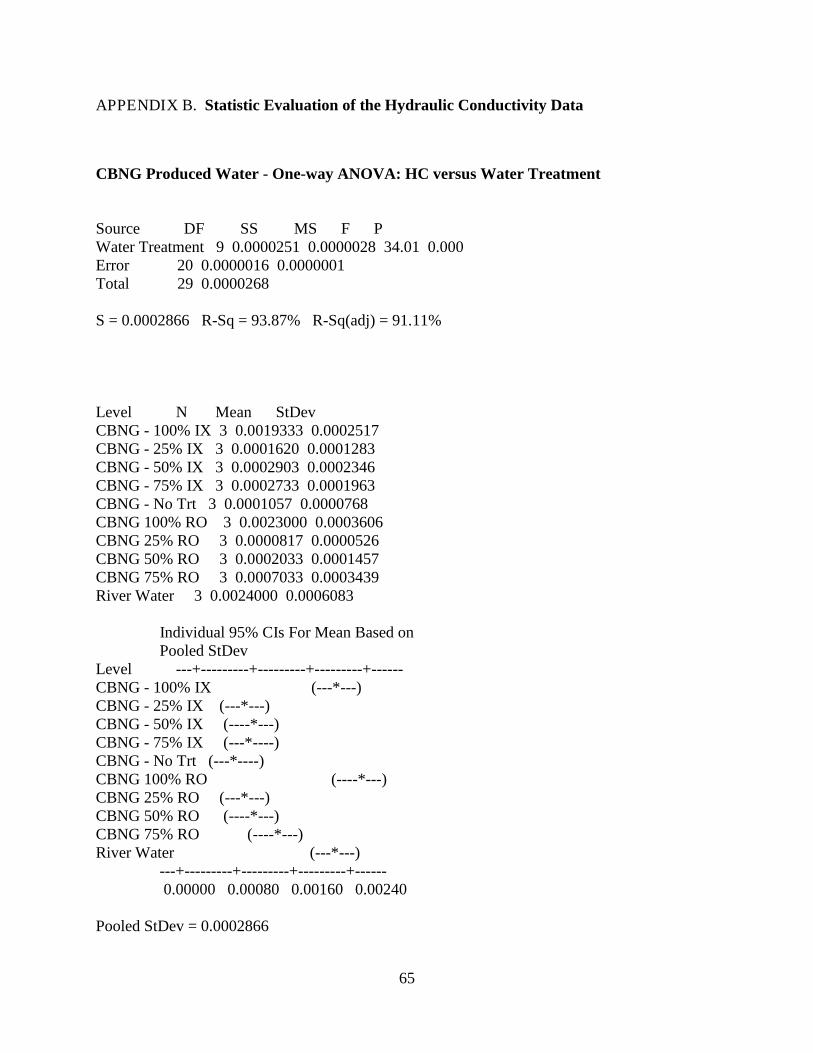
65
APPENDIX B. Statistic Evaluation of the Hydraulic Conductivity Data
CBNG Produced Water - One-way ANOVA: HC versus Water Treatment Source DF SS MS F P Water Treatment 9 0.0000251 0.0000028 34.01 0.000 Error 20 0.0000016 0.0000001 Total 29 0.0000268 S = 0.0002866 R-Sq = 93.87% R-Sq(adj) = 91.11% Level N Mean StDev CBNG - 100% IX 3 0.0019333 0.0002517 CBNG - 25% IX 3 0.0001620 0.0001283 CBNG - 50% IX 3 0.0002903 0.0002346 CBNG - 75% IX 3 0.0002733 0.0001963 CBNG - No Trt 3 0.0001057 0.0000768 CBNG 100% RO 3 0.0023000 0.0003606 CBNG 25% RO 3 0.0000817 0.0000526 CBNG 50% RO 3 0.0002033 0.0001457 CBNG 75% RO 3 0.0007033 0.0003439 River Water 3 0.0024000 0.0006083 Individual 95% CIs For Mean Based on Pooled StDev Level ---+---------+---------+---------+------ CBNG - 100% IX (---*---) CBNG - 25% IX (---*---) CBNG - 50% IX (----*---) CBNG - 75% IX (---*----) CBNG - No Trt (---*----) CBNG 100% RO (----*---) CBNG 25% RO (---*---) CBNG 50% RO (----*---) CBNG 75% RO (----*---) River Water (---*---) ---+---------+---------+---------+------ 0.00000 0.00080 0.00160 0.00240 Pooled StDev = 0.0002866
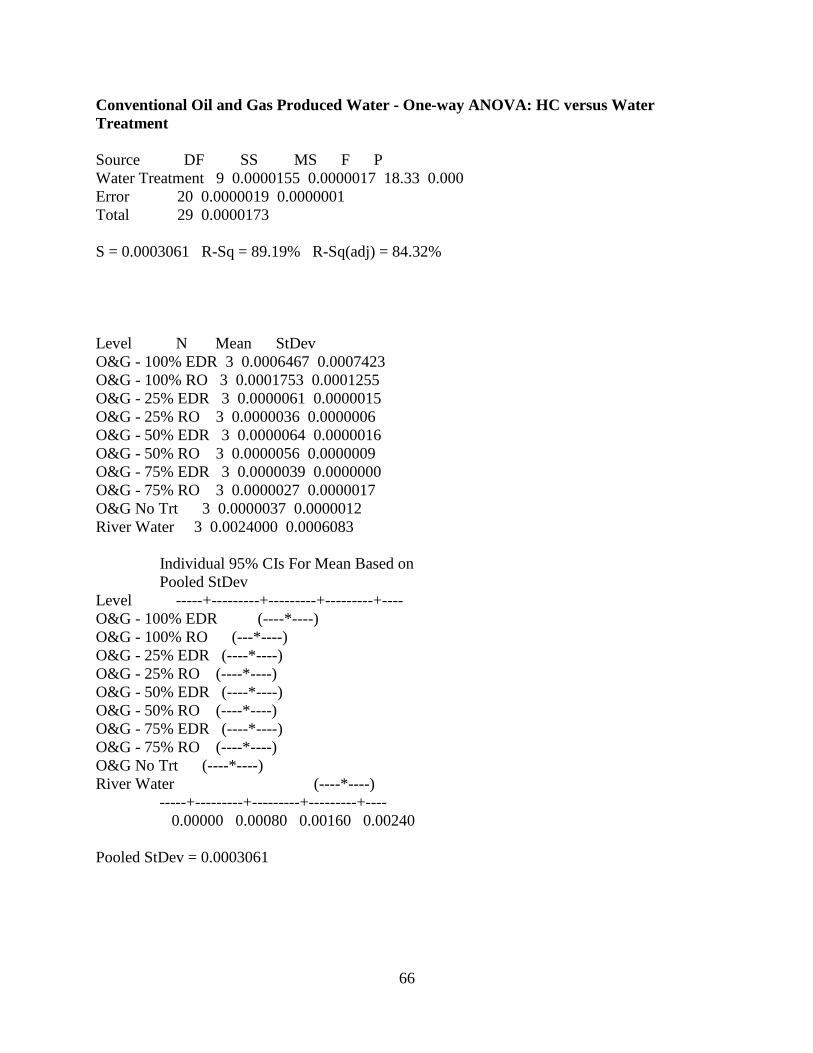
66
Conventional Oil and Gas Produced Water - One-way ANOVA: HC versus Water Treatment Source DF SS MS F P Water Treatment 9 0.0000155 0.0000017 18.33 0.000 Error 20 0.0000019 0.0000001 Total 29 0.0000173 S = 0.0003061 R-Sq = 89.19% R-Sq(adj) = 84.32% Level N Mean StDev O&G - 100% EDR 3 0.0006467 0.0007423 O&G - 100% RO 3 0.0001753 0.0001255 O&G - 25% EDR 3 0.0000061 0.0000015 O&G - 25% RO 3 0.0000036 0.0000006 O&G - 50% EDR 3 0.0000064 0.0000016 O&G - 50% RO 3 0.0000056 0.0000009 O&G - 75% EDR 3 0.0000039 0.0000000 O&G - 75% RO 3 0.0000027 0.0000017 O&G No Trt 3 0.0000037 0.0000012 River Water 3 0.0024000 0.0006083 Individual 95% CIs For Mean Based on Pooled StDev Level -----+---------+---------+---------+---- O&G - 100% EDR (----*----) O&G - 100% RO (---*----) O&G - 25% EDR (----*----) O&G - 25% RO (----*----) O&G - 50% EDR (----*----) O&G - 50% RO (----*----) O&G - 75% EDR (----*----) O&G - 75% RO (----*----) O&G No Trt (----*----) River Water (----*----) -----+---------+---------+---------+---- 0.00000 0.00080 0.00160 0.00240 Pooled StDev = 0.0003061
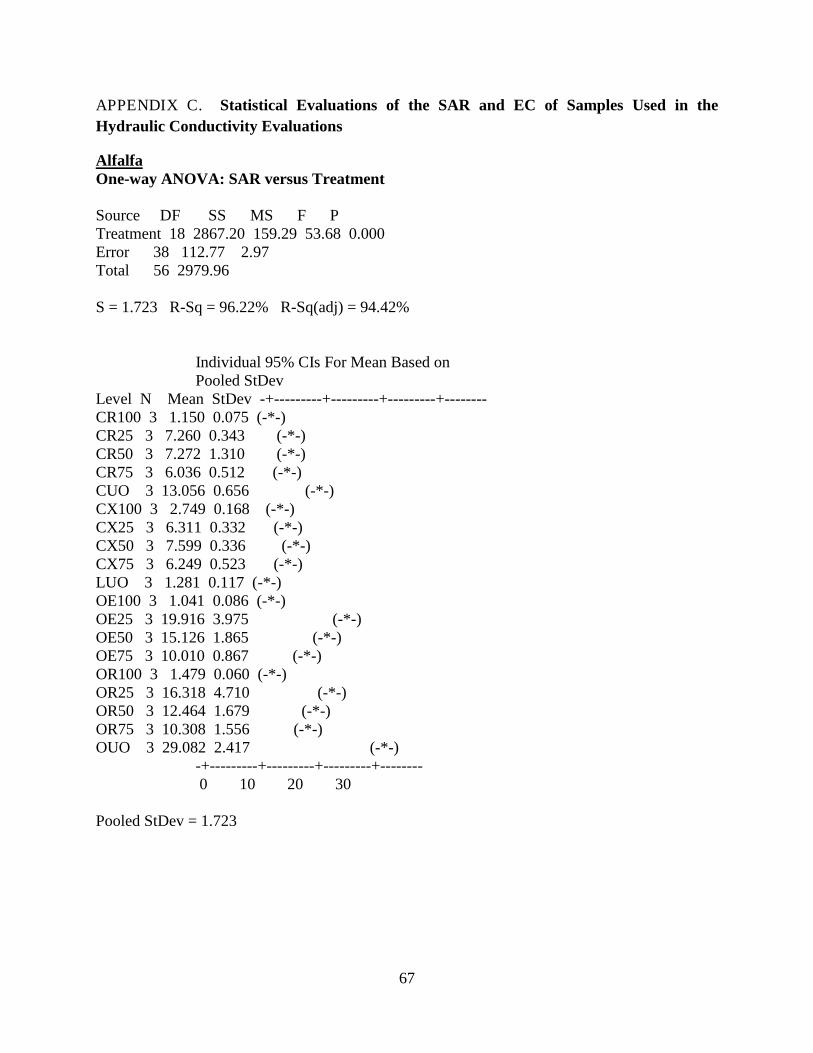
67
APPENDIX C. Statistical Evaluations of the SAR and EC of Samples Used in the Hydraulic Conductivity Evaluations
Alfalfa One-way ANOVA: SAR versus Treatment Source DF SS MS F P Treatment 18 2867.20 159.29 53.68 0.000 Error 38 112.77 2.97 Total 56 2979.96 S = 1.723 R-Sq = 96.22% R-Sq(adj) = 94.42% Individual 95% CIs For Mean Based on Pooled StDev Level N Mean StDev -+---------+---------+---------+-------- CR100 3 1.150 0.075 (-*-) CR25 3 7.260 0.343 (-*-) CR50 3 7.272 1.310 (-*-) CR75 3 6.036 0.512 (-*-) CUO 3 13.056 0.656 (-*-) CX100 3 2.749 0.168 (-*-) CX25 3 6.311 0.332 (-*-) CX50 3 7.599 0.336 (-*-) CX75 3 6.249 0.523 (-*-) LUO 3 1.281 0.117 (-*-) OE100 3 1.041 0.086 (-*-) OE25 3 19.916 3.975 (-*-) OE50 3 15.126 1.865 (-*-) OE75 3 10.010 0.867 (-*-) OR100 3 1.479 0.060 (-*-) OR25 3 16.318 4.710 (-*-) OR50 3 12.464 1.679 (-*-) OR75 3 10.308 1.556 (-*-) OUO 3 29.082 2.417 (-*-) -+---------+---------+---------+-------- 0 10 20 30 Pooled StDev = 1.723

68
One-way ANOVA: EC versus Treatment Source DF SS MS F P Treatment 18 20.5382 1.1410 21.52 0.000 Error 38 2.0148 0.0530 Total 56 22.5530 S = 0.2303 R-Sq = 91.07% R-Sq(adj) = 86.83% Individual 95% CIs For Mean Based on Pooled StDev Level N Mean StDev -------+---------+---------+---------+-- CR100 3 0.5033 0.0306 (--*---) CR25 3 0.7033 0.0513 (---*--) CR50 3 0.6967 0.1914 (---*--) CR75 3 0.6567 0.0513 (--*---) CUO 3 1.1833 0.0681 (---*--) CX100 3 0.6433 0.0289 (--*--) CX25 3 0.5467 0.0462 (---*--) CX50 3 0.7367 0.0643 (--*---) CX75 3 0.5900 0.0300 (--*---) LUO 3 0.6033 0.0058 (---*--) OE100 3 0.5333 0.0666 (---*--) OE25 3 1.7800 0.4158 (--*---) OE50 3 1.5467 0.1858 (--*---) OE75 3 1.2067 0.1677 (--*--) OR100 3 0.4800 0.0361 (--*--) OR25 3 1.7033 0.4136 (--*---) OR50 3 1.1967 0.2458 (--*--) OR75 3 1.5633 0.2676 (---*--) OUO 3 2.8100 0.6384 (--*--) -------+---------+---------+---------+-- 0.80 1.60 2.40 3.20 Pooled StDev = 0.2303
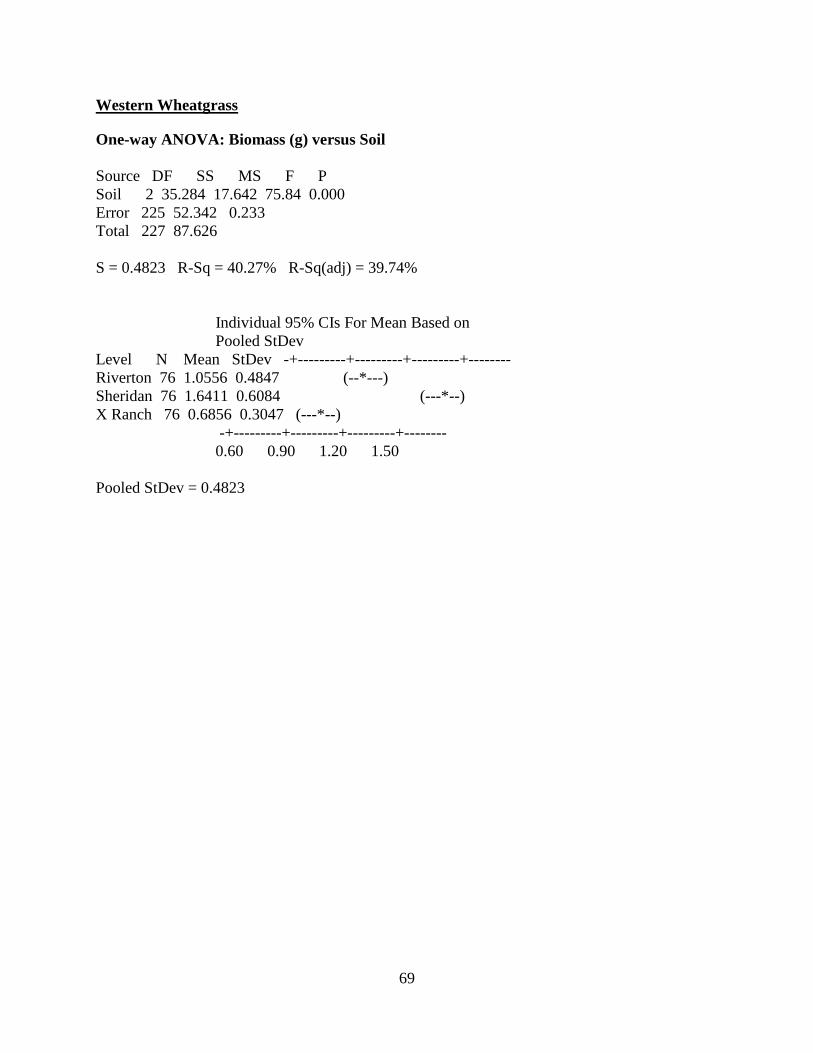
69
Western Wheatgrass
One-way ANOVA: Biomass (g) versus Soil Source DF SS MS F P Soil 2 35.284 17.642 75.84 0.000 Error 225 52.342 0.233 Total 227 87.626 S = 0.4823 R-Sq = 40.27% R-Sq(adj) = 39.74% Individual 95% CIs For Mean Based on Pooled StDev Level N Mean StDev -+---------+---------+---------+-------- Riverton 76 1.0556 0.4847 (--*---) Sheridan 76 1.6411 0.6084 (---*--) X Ranch 76 0.6856 0.3047 (---*--) -+---------+---------+---------+-------- 0.60 0.90 1.20 1.50 Pooled StDev = 0.4823

70
Riverton Soil - One-way ANOVA: Biomass (g)_1 versus Water Type_1 Source DF SS MS F P Water Type_1 18 12.0015 0.6667 6.76 0.000 Error 57 5.6185 0.0986 Total 75 17.6199 S = 0.3140 R-Sq = 68.11% R-Sq(adj) = 58.04% Individual 95% CIs For Mean Based on Pooled StDev Level N Mean StDev ---------+---------+---------+---------+ CBM IX 100 4 1.1895 0.1603 (----*----) CBM IX 25 4 1.1920 0.1350 (----*----) CBM IX 50 4 1.1845 0.2663 (----*----) CBM IX 75 4 1.2795 0.2388 (----*-----) CBM RAW 4 1.3895 0.2058 (----*----) CBM RO 100 4 1.2770 0.4032 (----*-----) CBM RO 25 4 1.5695 0.7019 (----*----) CBM RO 50 4 1.9545 0.1903 (-----*----) CBM RO 75 4 1.4970 0.2421 (----*----) Control 4 0.9545 0.3058 (----*----) O&G EDR 100 4 1.0720 0.6146 (----*----) O&G EDR 25 4 0.6970 0.2143 (-----*----) O&G EDR 50 4 0.9945 0.1964 (-----*----) O&G EDR 75 4 0.7645 0.1759 (----*----) O&G Raw 4 0.4145 0.2014 (----*----) O&G RO 100 4 0.9845 0.4313 (----*-----) O&G RO 25 4 0.3720 0.1190 (----*----) O&G RO 50 4 0.5895 0.1539 (----*----) O&G RO 75 4 0.6795 0.2396 (----*-----) ---------+---------+---------+---------+ 0.60 1.20 1.80 2.40 Pooled StDev = 0.3140
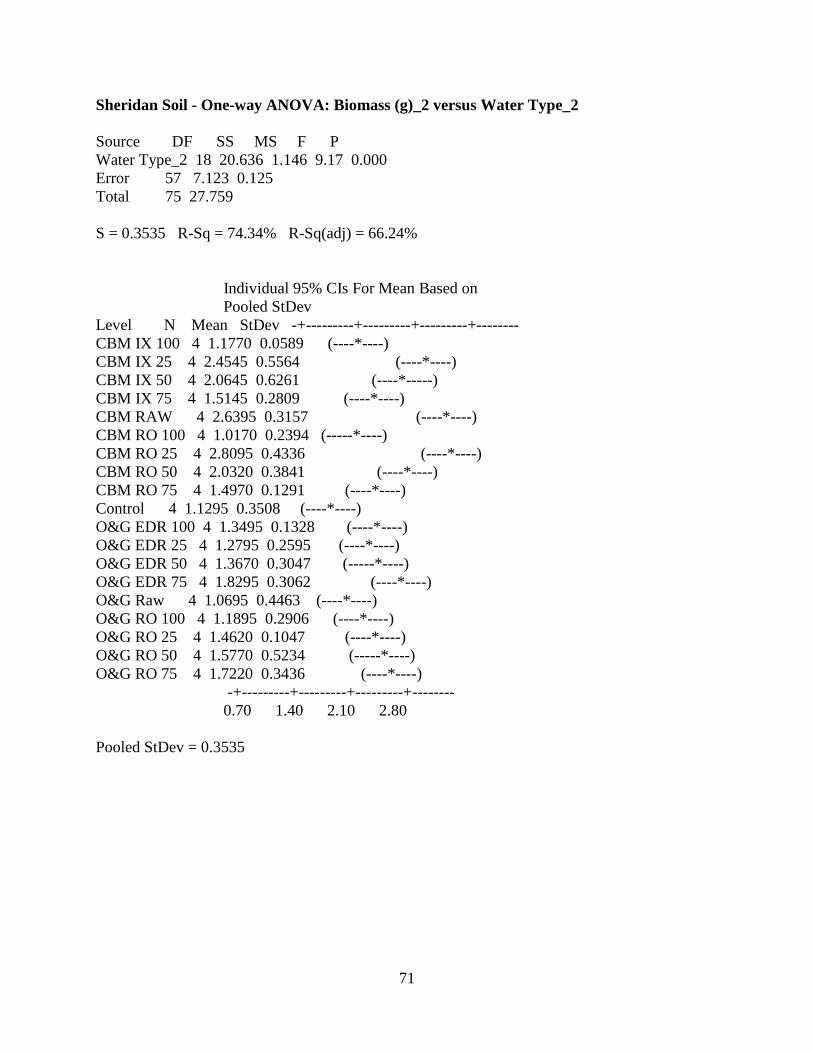
71
Sheridan Soil - One-way ANOVA: Biomass (g)_2 versus Water Type_2 Source DF SS MS F P Water Type_2 18 20.636 1.146 9.17 0.000 Error 57 7.123 0.125 Total 75 27.759 S = 0.3535 R-Sq = 74.34% R-Sq(adj) = 66.24% Individual 95% CIs For Mean Based on Pooled StDev Level N Mean StDev -+---------+---------+---------+-------- CBM IX 100 4 1.1770 0.0589 (----*----) CBM IX 25 4 2.4545 0.5564 (----*----) CBM IX 50 4 2.0645 0.6261 (----*-----) CBM IX 75 4 1.5145 0.2809 (----*----) CBM RAW 4 2.6395 0.3157 (----*----) CBM RO 100 4 1.0170 0.2394 (-----*----) CBM RO 25 4 2.8095 0.4336 (----*----) CBM RO 50 4 2.0320 0.3841 (----*----) CBM RO 75 4 1.4970 0.1291 (----*----) Control 4 1.1295 0.3508 (----*----) O&G EDR 100 4 1.3495 0.1328 (----*----) O&G EDR 25 4 1.2795 0.2595 (----*----) O&G EDR 50 4 1.3670 0.3047 (-----*----) O&G EDR 75 4 1.8295 0.3062 (----*----) O&G Raw 4 1.0695 0.4463 (----*----) O&G RO 100 4 1.1895 0.2906 (----*----) O&G RO 25 4 1.4620 0.1047 (----*----) O&G RO 50 4 1.5770 0.5234 (-----*----) O&G RO 75 4 1.7220 0.3436 (----*----) -+---------+---------+---------+-------- 0.70 1.40 2.10 2.80 Pooled StDev = 0.3535

72
X-Ranch Soil - One-way ANOVA: Biomass (g)_3 versus Water Type_3 Source DF SS MS F P Water Type_3 18 4.9566 0.2754 7.82 0.000 Error 57 2.0069 0.0352 Total 75 6.9635 S = 0.1876 R-Sq = 71.18% R-Sq(adj) = 62.08% Individual 95% CIs For Mean Based on Pooled StDev Level N Mean StDev --------+---------+---------+---------+- CBM IX 100 4 0.6645 0.0574 (----*----) CBM IX 25 4 0.8095 0.1370 (----*----) CBM IX 50 4 0.8095 0.2655 (----*----) CBM IX 75 4 0.9795 0.0830 (----*----) CBM RAW 4 0.8895 0.3100 (----*-----) CBM RO 100 4 0.7795 0.0954 (----*-----) CBM RO 25 4 1.2120 0.3331 (-----*----) CBM RO 50 4 0.9745 0.1486 (-----*----) CBM RO 75 4 0.9295 0.1830 (-----*----) Control 4 0.7620 0.0733 (-----*----) O&G EDR 100 4 0.4420 0.0370 (-----*----) O&G EDR 25 4 0.3220 0.0208 (----*-----) O&G EDR 50 4 0.5320 0.1957 (----*-----) O&G EDR 75 4 0.3920 0.1012 (----*-----) O&G Raw 4 0.2695 0.0340 (-----*----) O&G RO 100 4 0.6170 0.0983 (-----*----) O&G RO 25 4 0.3320 0.0975 (----*-----) O&G RO 50 4 0.7945 0.4646 (-----*----) O&G RO 75 4 0.5145 0.0768 (-----*----) --------+---------+---------+---------+- 0.35 0.70 1.05 1.40 Pooled StDev = 0.1876
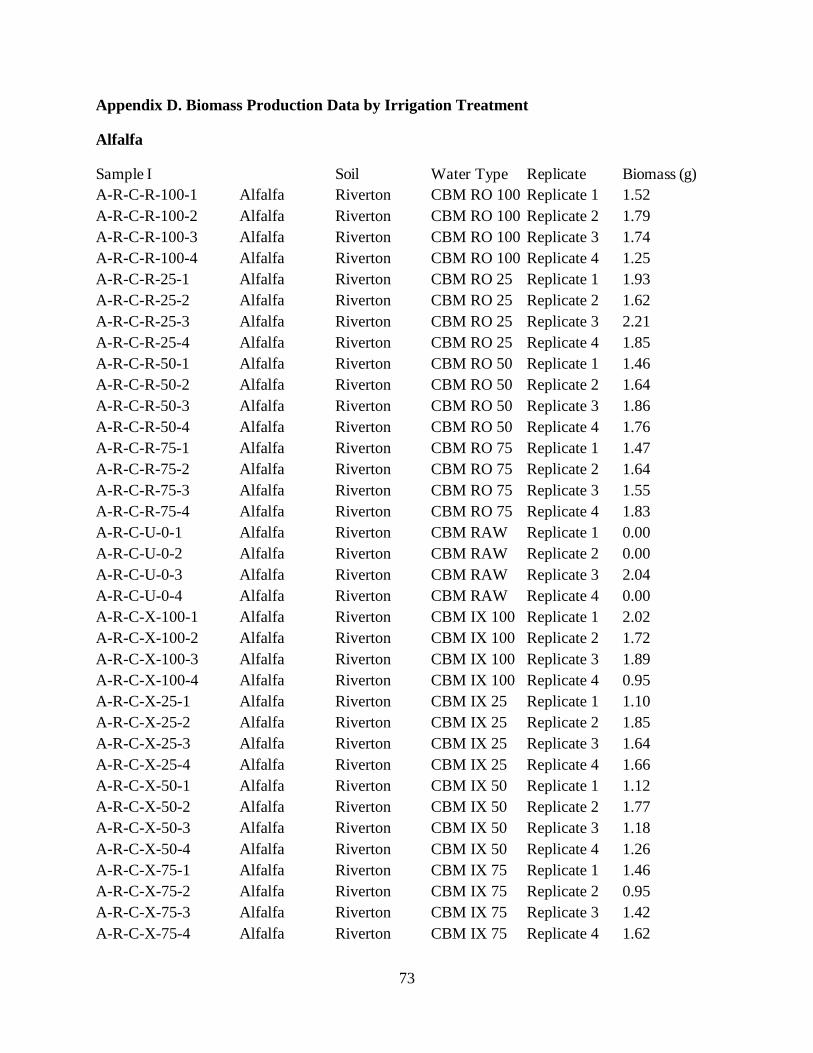
73
Appendix D. Biomass Production Data by Irrigation Treatment
Alfalfa
Sample I Soil Water Type Replicate Biomass (g) A-R-C-R-100-1 Alfalfa Riverton CBM RO 100 Replicate 1 1.52 A-R-C-R-100-2 Alfalfa Riverton CBM RO 100 Replicate 2 1.79 A-R-C-R-100-3 Alfalfa Riverton CBM RO 100 Replicate 3 1.74 A-R-C-R-100-4 Alfalfa Riverton CBM RO 100 Replicate 4 1.25 A-R-C-R-25-1 Alfalfa Riverton CBM RO 25 Replicate 1 1.93 A-R-C-R-25-2 Alfalfa Riverton CBM RO 25 Replicate 2 1.62 A-R-C-R-25-3 Alfalfa Riverton CBM RO 25 Replicate 3 2.21 A-R-C-R-25-4 Alfalfa Riverton CBM RO 25 Replicate 4 1.85 A-R-C-R-50-1 Alfalfa Riverton CBM RO 50 Replicate 1 1.46 A-R-C-R-50-2 Alfalfa Riverton CBM RO 50 Replicate 2 1.64 A-R-C-R-50-3 Alfalfa Riverton CBM RO 50 Replicate 3 1.86 A-R-C-R-50-4 Alfalfa Riverton CBM RO 50 Replicate 4 1.76 A-R-C-R-75-1 Alfalfa Riverton CBM RO 75 Replicate 1 1.47 A-R-C-R-75-2 Alfalfa Riverton CBM RO 75 Replicate 2 1.64 A-R-C-R-75-3 Alfalfa Riverton CBM RO 75 Replicate 3 1.55 A-R-C-R-75-4 Alfalfa Riverton CBM RO 75 Replicate 4 1.83 A-R-C-U-0-1 Alfalfa Riverton CBM RAW Replicate 1 0.00 A-R-C-U-0-2 Alfalfa Riverton CBM RAW Replicate 2 0.00 A-R-C-U-0-3 Alfalfa Riverton CBM RAW Replicate 3 2.04 A-R-C-U-0-4 Alfalfa Riverton CBM RAW Replicate 4 0.00 A-R-C-X-100-1 Alfalfa Riverton CBM IX 100 Replicate 1 2.02 A-R-C-X-100-2 Alfalfa Riverton CBM IX 100 Replicate 2 1.72 A-R-C-X-100-3 Alfalfa Riverton CBM IX 100 Replicate 3 1.89 A-R-C-X-100-4 Alfalfa Riverton CBM IX 100 Replicate 4 0.95 A-R-C-X-25-1 Alfalfa Riverton CBM IX 25 Replicate 1 1.10 A-R-C-X-25-2 Alfalfa Riverton CBM IX 25 Replicate 2 1.85 A-R-C-X-25-3 Alfalfa Riverton CBM IX 25 Replicate 3 1.64 A-R-C-X-25-4 Alfalfa Riverton CBM IX 25 Replicate 4 1.66 A-R-C-X-50-1 Alfalfa Riverton CBM IX 50 Replicate 1 1.12 A-R-C-X-50-2 Alfalfa Riverton CBM IX 50 Replicate 2 1.77 A-R-C-X-50-3 Alfalfa Riverton CBM IX 50 Replicate 3 1.18 A-R-C-X-50-4 Alfalfa Riverton CBM IX 50 Replicate 4 1.26 A-R-C-X-75-1 Alfalfa Riverton CBM IX 75 Replicate 1 1.46 A-R-C-X-75-2 Alfalfa Riverton CBM IX 75 Replicate 2 0.95 A-R-C-X-75-3 Alfalfa Riverton CBM IX 75 Replicate 3 1.42 A-R-C-X-75-4 Alfalfa Riverton CBM IX 75 Replicate 4 1.62
74
A-R-L-U-0-1 Alfalfa Riverton Control Replicate 1 1.53 A-R-L-U-0-2 Alfalfa Riverton Control Replicate 2 2.72 A-R-L-U-0-3 Alfalfa Riverton Control Replicate 3 1.96 A-R-L-U-0-4 Alfalfa Riverton Control Replicate 4 1.46 A-R-O-E-100-1 Alfalfa Riverton O&G EDR 100 Replicate 1 1.44 A-R-O-E-100-2 Alfalfa Riverton O&G EDR 100 Replicate 2 1.07 A-R-O-E-100-3 Alfalfa Riverton O&G EDR 100 Replicate 3 1.18 A-R-O-E-100-4 Alfalfa Riverton O&G EDR 100 Replicate 4 1.78 A-R-O-E-25-1 Alfalfa Riverton O&G EDR 25 Replicate 1 1.21 A-R-O-E-25-2 Alfalfa Riverton O&G EDR 25 Replicate 2 0.00 A-R-O-E-25-3 Alfalfa Riverton O&G EDR 25 Replicate 3 0.64 A-R-O-E-25-4 Alfalfa Riverton O&G EDR 25 Replicate 4 0.00 A-R-O-E-50-1 Alfalfa Riverton O&G EDR 50 Replicate 1 0.00 A-R-O-E-50-2 Alfalfa Riverton O&G EDR 50 Replicate 2 0.00 A-R-O-E-50-3 Alfalfa Riverton O&G EDR 50 Replicate 3 0.00 A-R-O-E-50-4 Alfalfa Riverton O&G EDR 50 Replicate 4 0.00 A-R-O-E-75-1 Alfalfa Riverton O&G EDR 75 Replicate 1 1.23 A-R-O-E-75-2 Alfalfa Riverton O&G EDR 75 Replicate 2 1.12 A-R-O-E-75-3 Alfalfa Riverton O&G EDR 75 Replicate 3 0.53 A-R-O-E-75-4 Alfalfa Riverton O&G EDR 75 Replicate 4 0.74 A-R-O-R-100-1 Alfalfa Riverton O&G RO 100 Replicate 1 1.41 A-R-O-R-100-2 Alfalfa Riverton O&G RO 100 Replicate 2 1.82 A-R-O-R-100-3 Alfalfa Riverton O&G RO 100 Replicate 3 1.09 A-R-O-R-100-4 Alfalfa Riverton O&G RO 100 Replicate 4 1.91 A-R-O-R-25-1 Alfalfa Riverton O&G RO 25 Replicate 1 0.00 A-R-O-R-25-2 Alfalfa Riverton O&G RO 25 Replicate 2 0.00 A-R-O-R-25-3 Alfalfa Riverton O&G RO 25 Replicate 3 0.62 A-R-O-R-25-4 Alfalfa Riverton O&G RO 25 Replicate 4 0.00 A-R-O-R-50-1 Alfalfa Riverton O&G RO 50 Replicate 1 0.00 A-R-O-R-50-2 Alfalfa Riverton O&G RO 50 Replicate 2 0.62 A-R-O-R-50-3 Alfalfa Riverton O&G RO 50 Replicate 3 0.00 A-R-O-R-50-4 Alfalfa Riverton O&G RO 50 Replicate 4 0.92 A-R-O-R-75-1 Alfalfa Riverton O&G RO 75 Replicate 1 1.24 A-R-O-R-75-2 Alfalfa Riverton O&G RO 75 Replicate 2 0.79 A-R-O-R-75-3 Alfalfa Riverton O&G RO 75 Replicate 3 1.70 A-R-O-R-75-4 Alfalfa Riverton O&G RO 75 Replicate 4 2.02 A-R-O-U-0-1 Alfalfa Riverton O&G Raw Replicate 1 0.64 A-R-O-U-0-2 Alfalfa Riverton O&G Raw Replicate 2 0.00 A-R-O-U-0-3 Alfalfa Riverton O&G Raw Replicate 3 0.00 A-R-O-U-0-4 Alfalfa Riverton O&G Raw Replicate 4 0.64
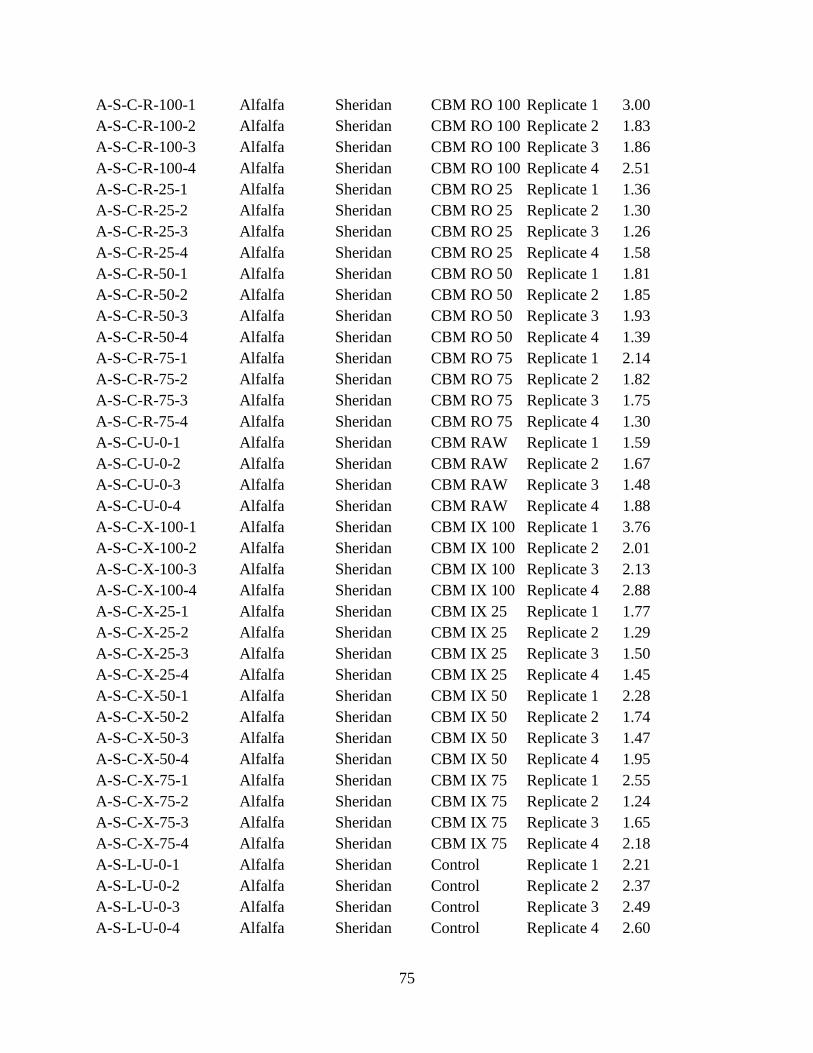
75
A-S-C-R-100-1 Alfalfa Sheridan CBM RO 100 Replicate 1 3.00 A-S-C-R-100-2 Alfalfa Sheridan CBM RO 100 Replicate 2 1.83 A-S-C-R-100-3 Alfalfa Sheridan CBM RO 100 Replicate 3 1.86 A-S-C-R-100-4 Alfalfa Sheridan CBM RO 100 Replicate 4 2.51 A-S-C-R-25-1 Alfalfa Sheridan CBM RO 25 Replicate 1 1.36 A-S-C-R-25-2 Alfalfa Sheridan CBM RO 25 Replicate 2 1.30 A-S-C-R-25-3 Alfalfa Sheridan CBM RO 25 Replicate 3 1.26 A-S-C-R-25-4 Alfalfa Sheridan CBM RO 25 Replicate 4 1.58 A-S-C-R-50-1 Alfalfa Sheridan CBM RO 50 Replicate 1 1.81 A-S-C-R-50-2 Alfalfa Sheridan CBM RO 50 Replicate 2 1.85 A-S-C-R-50-3 Alfalfa Sheridan CBM RO 50 Replicate 3 1.93 A-S-C-R-50-4 Alfalfa Sheridan CBM RO 50 Replicate 4 1.39 A-S-C-R-75-1 Alfalfa Sheridan CBM RO 75 Replicate 1 2.14 A-S-C-R-75-2 Alfalfa Sheridan CBM RO 75 Replicate 2 1.82 A-S-C-R-75-3 Alfalfa Sheridan CBM RO 75 Replicate 3 1.75 A-S-C-R-75-4 Alfalfa Sheridan CBM RO 75 Replicate 4 1.30 A-S-C-U-0-1 Alfalfa Sheridan CBM RAW Replicate 1 1.59 A-S-C-U-0-2 Alfalfa Sheridan CBM RAW Replicate 2 1.67 A-S-C-U-0-3 Alfalfa Sheridan CBM RAW Replicate 3 1.48 A-S-C-U-0-4 Alfalfa Sheridan CBM RAW Replicate 4 1.88 A-S-C-X-100-1 Alfalfa Sheridan CBM IX 100 Replicate 1 3.76 A-S-C-X-100-2 Alfalfa Sheridan CBM IX 100 Replicate 2 2.01 A-S-C-X-100-3 Alfalfa Sheridan CBM IX 100 Replicate 3 2.13 A-S-C-X-100-4 Alfalfa Sheridan CBM IX 100 Replicate 4 2.88 A-S-C-X-25-1 Alfalfa Sheridan CBM IX 25 Replicate 1 1.77 A-S-C-X-25-2 Alfalfa Sheridan CBM IX 25 Replicate 2 1.29 A-S-C-X-25-3 Alfalfa Sheridan CBM IX 25 Replicate 3 1.50 A-S-C-X-25-4 Alfalfa Sheridan CBM IX 25 Replicate 4 1.45 A-S-C-X-50-1 Alfalfa Sheridan CBM IX 50 Replicate 1 2.28 A-S-C-X-50-2 Alfalfa Sheridan CBM IX 50 Replicate 2 1.74 A-S-C-X-50-3 Alfalfa Sheridan CBM IX 50 Replicate 3 1.47 A-S-C-X-50-4 Alfalfa Sheridan CBM IX 50 Replicate 4 1.95 A-S-C-X-75-1 Alfalfa Sheridan CBM IX 75 Replicate 1 2.55 A-S-C-X-75-2 Alfalfa Sheridan CBM IX 75 Replicate 2 1.24 A-S-C-X-75-3 Alfalfa Sheridan CBM IX 75 Replicate 3 1.65 A-S-C-X-75-4 Alfalfa Sheridan CBM IX 75 Replicate 4 2.18 A-S-L-U-0-1 Alfalfa Sheridan Control Replicate 1 2.21 A-S-L-U-0-2 Alfalfa Sheridan Control Replicate 2 2.37 A-S-L-U-0-3 Alfalfa Sheridan Control Replicate 3 2.49 A-S-L-U-0-4 Alfalfa Sheridan Control Replicate 4 2.60

76
A-S-O-E-100-1 Alfalfa Sheridan O&G EDR 100 Replicate 1 1.79 A-S-O-E-100-2 Alfalfa Sheridan O&G EDR 100 Replicate 2 2.13 A-S-O-E-100-3 Alfalfa Sheridan O&G EDR 100 Replicate 3 1.78 A-S-O-E-100-4 Alfalfa Sheridan O&G EDR 100 Replicate 4 1.70 A-S-O-E-25-1 Alfalfa Sheridan O&G EDR 25 Replicate 1 0.77 A-S-O-E-25-2 Alfalfa Sheridan O&G EDR 25 Replicate 2 0.87 A-S-O-E-25-3 Alfalfa Sheridan O&G EDR 25 Replicate 3 0.00 A-S-O-E-25-4 Alfalfa Sheridan O&G EDR 25 Replicate 4 0.74 A-S-O-E-50-1 Alfalfa Sheridan O&G EDR 50 Replicate 1 1.14 A-S-O-E-50-2 Alfalfa Sheridan O&G EDR 50 Replicate 2 1.16 A-S-O-E-50-3 Alfalfa Sheridan O&G EDR 50 Replicate 3 0.00 A-S-O-E-50-4 Alfalfa Sheridan O&G EDR 50 Replicate 4 1.52 A-S-O-E-75-1 Alfalfa Sheridan O&G EDR 75 Replicate 1 1.72 A-S-O-E-75-2 Alfalfa Sheridan O&G EDR 75 Replicate 2 2.43 A-S-O-E-75-3 Alfalfa Sheridan O&G EDR 75 Replicate 3 1.35 A-S-O-E-75-4 Alfalfa Sheridan O&G EDR 75 Replicate 4 1.29 A-S-O-R-100-1 Alfalfa Sheridan O&G RO 100 Replicate 1 2.30 A-S-O-R-100-2 Alfalfa Sheridan O&G RO 100 Replicate 2 2.35 A-S-O-R-100-3 Alfalfa Sheridan O&G RO 100 Replicate 3 2.78 A-S-O-R-100-4 Alfalfa Sheridan O&G RO 100 Replicate 4 2.22 A-S-O-R-25-1 Alfalfa Sheridan O&G RO 25 Replicate 1 0.00 A-S-O-R-25-2 Alfalfa Sheridan O&G RO 25 Replicate 2 0.58 A-S-O-R-25-3 Alfalfa Sheridan O&G RO 25 Replicate 3 0.00 A-S-O-R-25-4 Alfalfa Sheridan O&G RO 25 Replicate 4 0.00 A-S-O-R-50-1 Alfalfa Sheridan O&G RO 50 Replicate 1 1.32 A-S-O-R-50-2 Alfalfa Sheridan O&G RO 50 Replicate 2 1.70 A-S-O-R-50-3 Alfalfa Sheridan O&G RO 50 Replicate 3 2.12 A-S-O-R-50-4 Alfalfa Sheridan O&G RO 50 Replicate 4 1.34 A-S-O-R-75-1 Alfalfa Sheridan O&G RO 75 Replicate 1 1.65 A-S-O-R-75-2 Alfalfa Sheridan O&G RO 75 Replicate 2 1.58 A-S-O-R-75-3 Alfalfa Sheridan O&G RO 75 Replicate 3 1.27 A-S-O-R-75-4 Alfalfa Sheridan O&G RO 75 Replicate 4 1.60 A-S-O-U-0-1 Alfalfa Sheridan O&G Raw Replicate 1 0.00 A-S-O-U-0-2 Alfalfa Sheridan O&G Raw Replicate 2 0.00 A-S-O-U-0-3 Alfalfa Sheridan O&G Raw Replicate 3 0.00 A-S-O-U-0-4 Alfalfa Sheridan O&G Raw Replicate 4 0.00 A-X-C-R-100-1 Alfalfa X Ranch CBM RO 100 Replicate 1 1.99 A-X-C-R-100-2 Alfalfa X Ranch CBM RO 100 Replicate 2 1.58 A-X-C-R-100-3 Alfalfa X Ranch CBM RO 100 Replicate 3 2.08 A-X-C-R-100-4 Alfalfa X Ranch CBM RO 100 Replicate 4 1.59
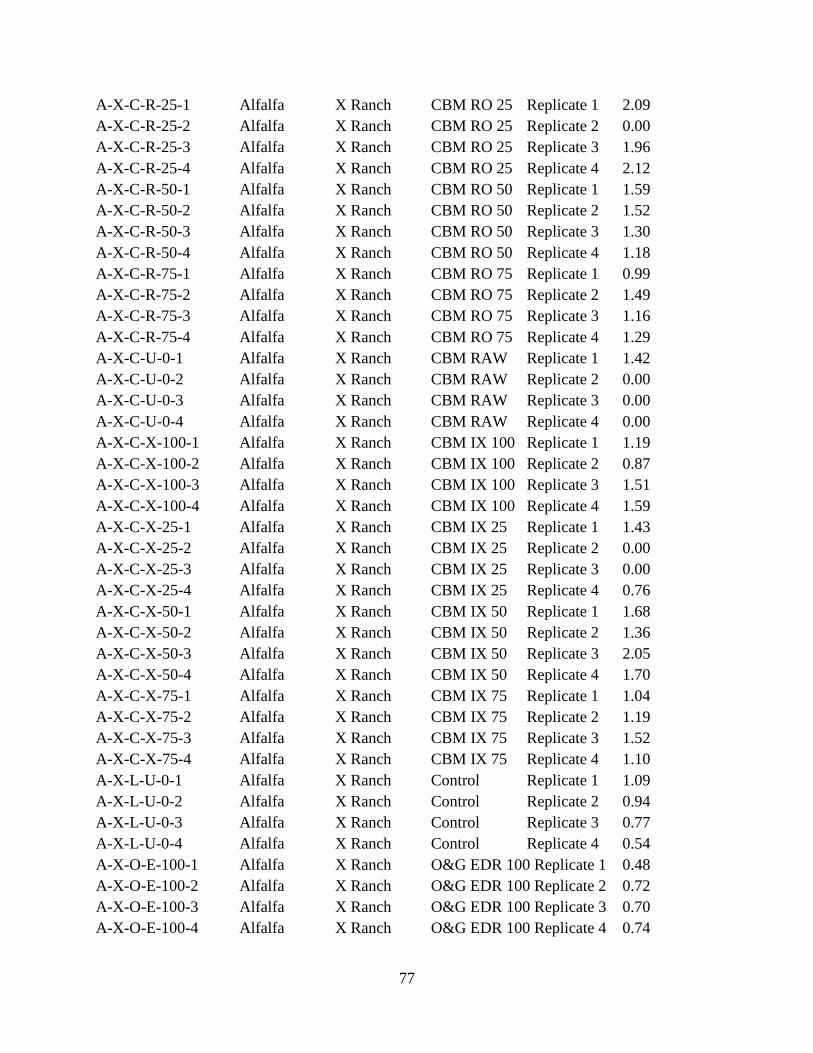
77
A-X-C-R-25-1 Alfalfa X Ranch CBM RO 25 Replicate 1 2.09 A-X-C-R-25-2 Alfalfa X Ranch CBM RO 25 Replicate 2 0.00 A-X-C-R-25-3 Alfalfa X Ranch CBM RO 25 Replicate 3 1.96 A-X-C-R-25-4 Alfalfa X Ranch CBM RO 25 Replicate 4 2.12 A-X-C-R-50-1 Alfalfa X Ranch CBM RO 50 Replicate 1 1.59 A-X-C-R-50-2 Alfalfa X Ranch CBM RO 50 Replicate 2 1.52 A-X-C-R-50-3 Alfalfa X Ranch CBM RO 50 Replicate 3 1.30 A-X-C-R-50-4 Alfalfa X Ranch CBM RO 50 Replicate 4 1.18 A-X-C-R-75-1 Alfalfa X Ranch CBM RO 75 Replicate 1 0.99 A-X-C-R-75-2 Alfalfa X Ranch CBM RO 75 Replicate 2 1.49 A-X-C-R-75-3 Alfalfa X Ranch CBM RO 75 Replicate 3 1.16 A-X-C-R-75-4 Alfalfa X Ranch CBM RO 75 Replicate 4 1.29 A-X-C-U-0-1 Alfalfa X Ranch CBM RAW Replicate 1 1.42 A-X-C-U-0-2 Alfalfa X Ranch CBM RAW Replicate 2 0.00 A-X-C-U-0-3 Alfalfa X Ranch CBM RAW Replicate 3 0.00 A-X-C-U-0-4 Alfalfa X Ranch CBM RAW Replicate 4 0.00 A-X-C-X-100-1 Alfalfa X Ranch CBM IX 100 Replicate 1 1.19 A-X-C-X-100-2 Alfalfa X Ranch CBM IX 100 Replicate 2 0.87 A-X-C-X-100-3 Alfalfa X Ranch CBM IX 100 Replicate 3 1.51 A-X-C-X-100-4 Alfalfa X Ranch CBM IX 100 Replicate 4 1.59 A-X-C-X-25-1 Alfalfa X Ranch CBM IX 25 Replicate 1 1.43 A-X-C-X-25-2 Alfalfa X Ranch CBM IX 25 Replicate 2 0.00 A-X-C-X-25-3 Alfalfa X Ranch CBM IX 25 Replicate 3 0.00 A-X-C-X-25-4 Alfalfa X Ranch CBM IX 25 Replicate 4 0.76 A-X-C-X-50-1 Alfalfa X Ranch CBM IX 50 Replicate 1 1.68 A-X-C-X-50-2 Alfalfa X Ranch CBM IX 50 Replicate 2 1.36 A-X-C-X-50-3 Alfalfa X Ranch CBM IX 50 Replicate 3 2.05 A-X-C-X-50-4 Alfalfa X Ranch CBM IX 50 Replicate 4 1.70 A-X-C-X-75-1 Alfalfa X Ranch CBM IX 75 Replicate 1 1.04 A-X-C-X-75-2 Alfalfa X Ranch CBM IX 75 Replicate 2 1.19 A-X-C-X-75-3 Alfalfa X Ranch CBM IX 75 Replicate 3 1.52 A-X-C-X-75-4 Alfalfa X Ranch CBM IX 75 Replicate 4 1.10 A-X-L-U-0-1 Alfalfa X Ranch Control Replicate 1 1.09 A-X-L-U-0-2 Alfalfa X Ranch Control Replicate 2 0.94 A-X-L-U-0-3 Alfalfa X Ranch Control Replicate 3 0.77 A-X-L-U-0-4 Alfalfa X Ranch Control Replicate 4 0.54 A-X-O-E-100-1 Alfalfa X Ranch O&G EDR 100 Replicate 1 0.48 A-X-O-E-100-2 Alfalfa X Ranch O&G EDR 100 Replicate 2 0.72 A-X-O-E-100-3 Alfalfa X Ranch O&G EDR 100 Replicate 3 0.70 A-X-O-E-100-4 Alfalfa X Ranch O&G EDR 100 Replicate 4 0.74
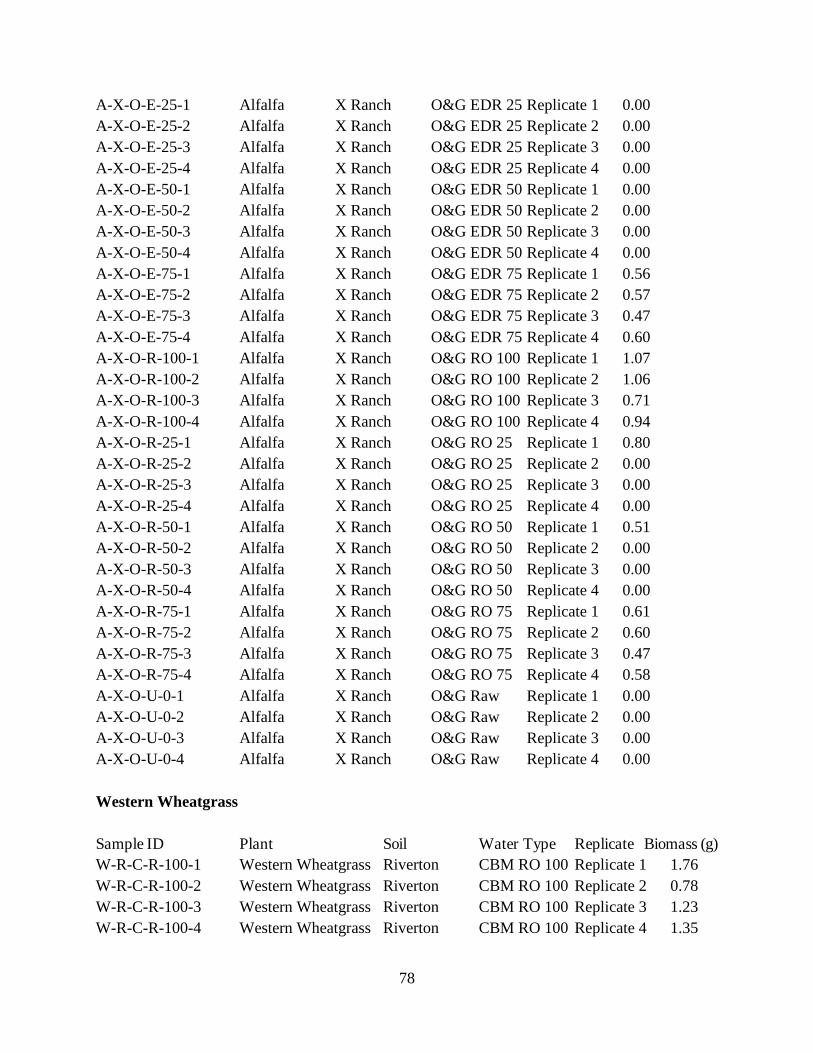
78
A-X-O-E-25-1 Alfalfa X Ranch O&G EDR 25 Replicate 1 0.00 A-X-O-E-25-2 Alfalfa X Ranch O&G EDR 25 Replicate 2 0.00 A-X-O-E-25-3 Alfalfa X Ranch O&G EDR 25 Replicate 3 0.00 A-X-O-E-25-4 Alfalfa X Ranch O&G EDR 25 Replicate 4 0.00 A-X-O-E-50-1 Alfalfa X Ranch O&G EDR 50 Replicate 1 0.00 A-X-O-E-50-2 Alfalfa X Ranch O&G EDR 50 Replicate 2 0.00 A-X-O-E-50-3 Alfalfa X Ranch O&G EDR 50 Replicate 3 0.00 A-X-O-E-50-4 Alfalfa X Ranch O&G EDR 50 Replicate 4 0.00 A-X-O-E-75-1 Alfalfa X Ranch O&G EDR 75 Replicate 1 0.56 A-X-O-E-75-2 Alfalfa X Ranch O&G EDR 75 Replicate 2 0.57 A-X-O-E-75-3 Alfalfa X Ranch O&G EDR 75 Replicate 3 0.47 A-X-O-E-75-4 Alfalfa X Ranch O&G EDR 75 Replicate 4 0.60 A-X-O-R-100-1 Alfalfa X Ranch O&G RO 100 Replicate 1 1.07 A-X-O-R-100-2 Alfalfa X Ranch O&G RO 100 Replicate 2 1.06 A-X-O-R-100-3 Alfalfa X Ranch O&G RO 100 Replicate 3 0.71 A-X-O-R-100-4 Alfalfa X Ranch O&G RO 100 Replicate 4 0.94 A-X-O-R-25-1 Alfalfa X Ranch O&G RO 25 Replicate 1 0.80 A-X-O-R-25-2 Alfalfa X Ranch O&G RO 25 Replicate 2 0.00 A-X-O-R-25-3 Alfalfa X Ranch O&G RO 25 Replicate 3 0.00 A-X-O-R-25-4 Alfalfa X Ranch O&G RO 25 Replicate 4 0.00 A-X-O-R-50-1 Alfalfa X Ranch O&G RO 50 Replicate 1 0.51 A-X-O-R-50-2 Alfalfa X Ranch O&G RO 50 Replicate 2 0.00 A-X-O-R-50-3 Alfalfa X Ranch O&G RO 50 Replicate 3 0.00 A-X-O-R-50-4 Alfalfa X Ranch O&G RO 50 Replicate 4 0.00 A-X-O-R-75-1 Alfalfa X Ranch O&G RO 75 Replicate 1 0.61 A-X-O-R-75-2 Alfalfa X Ranch O&G RO 75 Replicate 2 0.60 A-X-O-R-75-3 Alfalfa X Ranch O&G RO 75 Replicate 3 0.47 A-X-O-R-75-4 Alfalfa X Ranch O&G RO 75 Replicate 4 0.58 A-X-O-U-0-1 Alfalfa X Ranch O&G Raw Replicate 1 0.00 A-X-O-U-0-2 Alfalfa X Ranch O&G Raw Replicate 2 0.00 A-X-O-U-0-3 Alfalfa X Ranch O&G Raw Replicate 3 0.00 A-X-O-U-0-4 Alfalfa X Ranch O&G Raw Replicate 4 0.00 Western Wheatgrass Sample ID Plant Soil Water Type Replicate Biomass (g) W-R-C-R-100-1 Western Wheatgrass Riverton CBM RO 100 Replicate 1 1.76 W-R-C-R-100-2 Western Wheatgrass Riverton CBM RO 100 Replicate 2 0.78 W-R-C-R-100-3 Western Wheatgrass Riverton CBM RO 100 Replicate 3 1.23 W-R-C-R-100-4 Western Wheatgrass Riverton CBM RO 100 Replicate 4 1.35
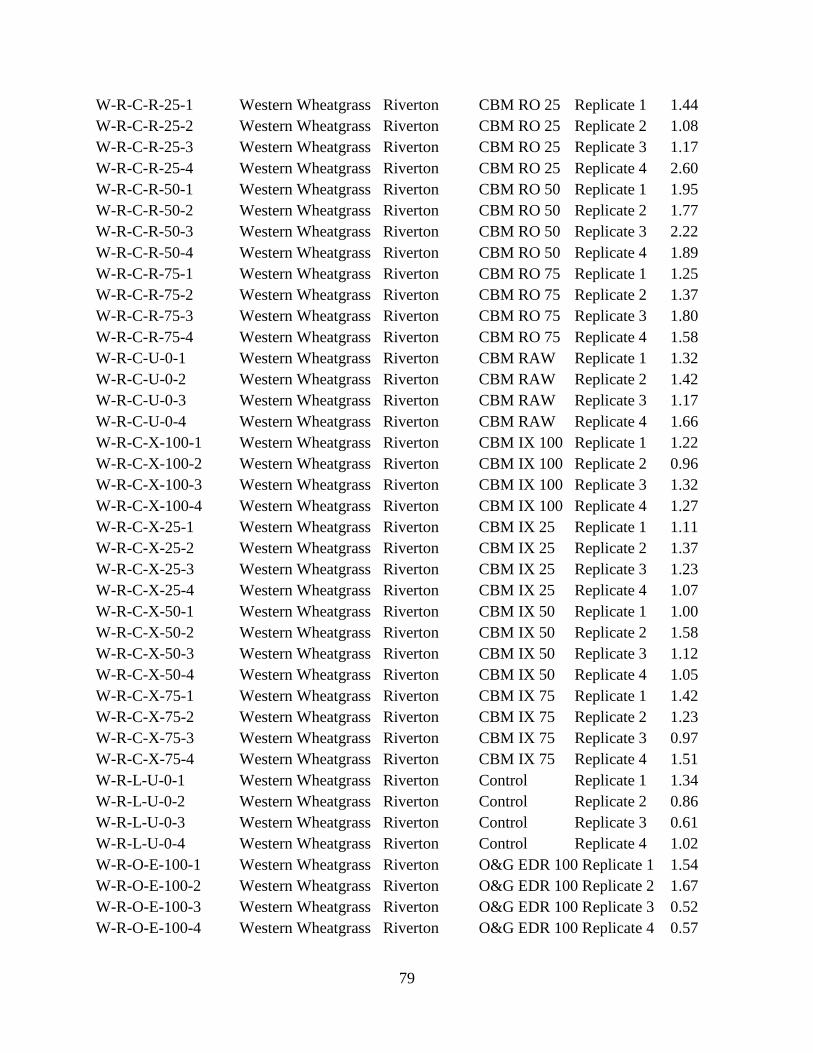
79
W-R-C-R-25-1 Western Wheatgrass Riverton CBM RO 25 Replicate 1 1.44 W-R-C-R-25-2 Western Wheatgrass Riverton CBM RO 25 Replicate 2 1.08 W-R-C-R-25-3 Western Wheatgrass Riverton CBM RO 25 Replicate 3 1.17 W-R-C-R-25-4 Western Wheatgrass Riverton CBM RO 25 Replicate 4 2.60 W-R-C-R-50-1 Western Wheatgrass Riverton CBM RO 50 Replicate 1 1.95 W-R-C-R-50-2 Western Wheatgrass Riverton CBM RO 50 Replicate 2 1.77 W-R-C-R-50-3 Western Wheatgrass Riverton CBM RO 50 Replicate 3 2.22 W-R-C-R-50-4 Western Wheatgrass Riverton CBM RO 50 Replicate 4 1.89 W-R-C-R-75-1 Western Wheatgrass Riverton CBM RO 75 Replicate 1 1.25 W-R-C-R-75-2 Western Wheatgrass Riverton CBM RO 75 Replicate 2 1.37 W-R-C-R-75-3 Western Wheatgrass Riverton CBM RO 75 Replicate 3 1.80 W-R-C-R-75-4 Western Wheatgrass Riverton CBM RO 75 Replicate 4 1.58 W-R-C-U-0-1 Western Wheatgrass Riverton CBM RAW Replicate 1 1.32 W-R-C-U-0-2 Western Wheatgrass Riverton CBM RAW Replicate 2 1.42 W-R-C-U-0-3 Western Wheatgrass Riverton CBM RAW Replicate 3 1.17 W-R-C-U-0-4 Western Wheatgrass Riverton CBM RAW Replicate 4 1.66 W-R-C-X-100-1 Western Wheatgrass Riverton CBM IX 100 Replicate 1 1.22 W-R-C-X-100-2 Western Wheatgrass Riverton CBM IX 100 Replicate 2 0.96 W-R-C-X-100-3 Western Wheatgrass Riverton CBM IX 100 Replicate 3 1.32 W-R-C-X-100-4 Western Wheatgrass Riverton CBM IX 100 Replicate 4 1.27 W-R-C-X-25-1 Western Wheatgrass Riverton CBM IX 25 Replicate 1 1.11 W-R-C-X-25-2 Western Wheatgrass Riverton CBM IX 25 Replicate 2 1.37 W-R-C-X-25-3 Western Wheatgrass Riverton CBM IX 25 Replicate 3 1.23 W-R-C-X-25-4 Western Wheatgrass Riverton CBM IX 25 Replicate 4 1.07 W-R-C-X-50-1 Western Wheatgrass Riverton CBM IX 50 Replicate 1 1.00 W-R-C-X-50-2 Western Wheatgrass Riverton CBM IX 50 Replicate 2 1.58 W-R-C-X-50-3 Western Wheatgrass Riverton CBM IX 50 Replicate 3 1.12 W-R-C-X-50-4 Western Wheatgrass Riverton CBM IX 50 Replicate 4 1.05 W-R-C-X-75-1 Western Wheatgrass Riverton CBM IX 75 Replicate 1 1.42 W-R-C-X-75-2 Western Wheatgrass Riverton CBM IX 75 Replicate 2 1.23 W-R-C-X-75-3 Western Wheatgrass Riverton CBM IX 75 Replicate 3 0.97 W-R-C-X-75-4 Western Wheatgrass Riverton CBM IX 75 Replicate 4 1.51 W-R-L-U-0-1 Western Wheatgrass Riverton Control Replicate 1 1.34 W-R-L-U-0-2 Western Wheatgrass Riverton Control Replicate 2 0.86 W-R-L-U-0-3 Western Wheatgrass Riverton Control Replicate 3 0.61 W-R-L-U-0-4 Western Wheatgrass Riverton Control Replicate 4 1.02 W-R-O-E-100-1 Western Wheatgrass Riverton O&G EDR 100 Replicate 1 1.54 W-R-O-E-100-2 Western Wheatgrass Riverton O&G EDR 100 Replicate 2 1.67 W-R-O-E-100-3 Western Wheatgrass Riverton O&G EDR 100 Replicate 3 0.52 W-R-O-E-100-4 Western Wheatgrass Riverton O&G EDR 100 Replicate 4 0.57

80
W-R-O-E-25-1 Western Wheatgrass Riverton O&G EDR 25 Replicate 1 0.81 W-R-O-E-25-2 Western Wheatgrass Riverton O&G EDR 25 Replicate 2 0.83 W-R-O-E-25-3 Western Wheatgrass Riverton O&G EDR 25 Replicate 3 0.38 W-R-O-E-25-4 Western Wheatgrass Riverton O&G EDR 25 Replicate 4 0.78 W-R-O-E-50-1 Western Wheatgrass Riverton O&G EDR 50 Replicate 1 0.85 W-R-O-E-50-2 Western Wheatgrass Riverton O&G EDR 50 Replicate 2 1.28 W-R-O-E-50-3 Western Wheatgrass Riverton O&G EDR 50 Replicate 3 0.88 W-R-O-E-50-4 Western Wheatgrass Riverton O&G EDR 50 Replicate 4 0.98 W-R-O-E-75-1 Western Wheatgrass Riverton O&G EDR 75 Replicate 1 0.51 W-R-O-E-75-2 Western Wheatgrass Riverton O&G EDR 75 Replicate 2 0.87 W-R-O-E-75-3 Western Wheatgrass Riverton O&G EDR 75 Replicate 3 0.89 W-R-O-E-75-4 Western Wheatgrass Riverton O&G EDR 75 Replicate 4 0.80 W-R-O-R-100-1 Western Wheatgrass Riverton O&G RO 100 Replicate 1 1.27 W-R-O-R-100-2 Western Wheatgrass Riverton O&G RO 100 Replicate 2 0.91 W-R-O-R-100-3 Western Wheatgrass Riverton O&G RO 100 Replicate 3 0.41 W-R-O-R-100-4 Western Wheatgrass Riverton O&G RO 100 Replicate 4 1.36 W-R-O-R-25-1 Western Wheatgrass Riverton O&G RO 25 Replicate 1 0.41 W-R-O-R-25-2 Western Wheatgrass Riverton O&G RO 25 Replicate 2 0.33 W-R-O-R-25-3 Western Wheatgrass Riverton O&G RO 25 Replicate 3 0.52 W-R-O-R-25-4 Western Wheatgrass Riverton O&G RO 25 Replicate 4 0.24 W-R-O-R-50-1 Western Wheatgrass Riverton O&G RO 50 Replicate 1 0.48 W-R-O-R-50-2 Western Wheatgrass Riverton O&G RO 50 Replicate 2 0.44 W-R-O-R-50-3 Western Wheatgrass Riverton O&G RO 50 Replicate 3 0.73 W-R-O-R-50-4 Western Wheatgrass Riverton O&G RO 50 Replicate 4 0.72 W-R-O-R-75-1 Western Wheatgrass Riverton O&G RO 75 Replicate 1 0.56 W-R-O-R-75-2 Western Wheatgrass Riverton O&G RO 75 Replicate 2 0.93 W-R-O-R-75-3 Western Wheatgrass Riverton O&G RO 75 Replicate 3 0.41 W-R-O-R-75-4 Western Wheatgrass Riverton O&G RO 75 Replicate 4 0.83 W-R-O-U-0-1 Western Wheatgrass Riverton O&G Raw Replicate 1 0.42 W-R-O-U-0-2 Western Wheatgrass Riverton O&G Raw Replicate 2 0.30 W-R-O-U-0-3 Western Wheatgrass Riverton O&G Raw Replicate 3 0.25 W-R-O-U-0-4 Western Wheatgrass Riverton O&G Raw Replicate 4 0.70 W-S-C-R-100-1 Western Wheatgrass Sheridan CBM RO 100 Replicate 1 1.24 W-S-C-R-100-2 Western Wheatgrass Sheridan CBM RO 100 Replicate 2 0.98 W-S-C-R-100-3 Western Wheatgrass Sheridan CBM RO 100 Replicate 3 1.16 W-S-C-R-100-4 Western Wheatgrass Sheridan CBM RO 100 Replicate 4 0.70 W-S-C-R-25-1 Western Wheatgrass Sheridan CBM RO 25 Replicate 1 2.61 W-S-C-R-25-2 Western Wheatgrass Sheridan CBM RO 25 Replicate 2 2.70 W-S-C-R-25-3 Western Wheatgrass Sheridan CBM RO 25 Replicate 3 2.49 W-S-C-R-25-4 Western Wheatgrass Sheridan CBM RO 25 Replicate 4 3.45
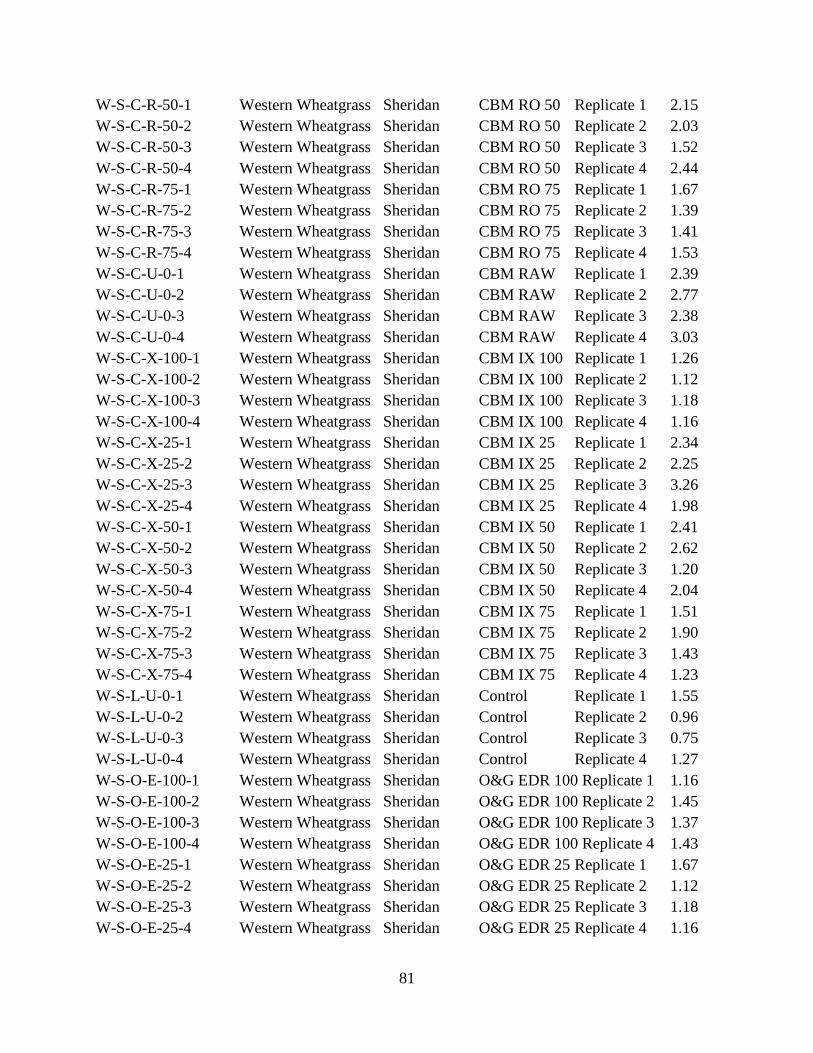
81
W-S-C-R-50-1 Western Wheatgrass Sheridan CBM RO 50 Replicate 1 2.15 W-S-C-R-50-2 Western Wheatgrass Sheridan CBM RO 50 Replicate 2 2.03 W-S-C-R-50-3 Western Wheatgrass Sheridan CBM RO 50 Replicate 3 1.52 W-S-C-R-50-4 Western Wheatgrass Sheridan CBM RO 50 Replicate 4 2.44 W-S-C-R-75-1 Western Wheatgrass Sheridan CBM RO 75 Replicate 1 1.67 W-S-C-R-75-2 Western Wheatgrass Sheridan CBM RO 75 Replicate 2 1.39 W-S-C-R-75-3 Western Wheatgrass Sheridan CBM RO 75 Replicate 3 1.41 W-S-C-R-75-4 Western Wheatgrass Sheridan CBM RO 75 Replicate 4 1.53 W-S-C-U-0-1 Western Wheatgrass Sheridan CBM RAW Replicate 1 2.39 W-S-C-U-0-2 Western Wheatgrass Sheridan CBM RAW Replicate 2 2.77 W-S-C-U-0-3 Western Wheatgrass Sheridan CBM RAW Replicate 3 2.38 W-S-C-U-0-4 Western Wheatgrass Sheridan CBM RAW Replicate 4 3.03 W-S-C-X-100-1 Western Wheatgrass Sheridan CBM IX 100 Replicate 1 1.26 W-S-C-X-100-2 Western Wheatgrass Sheridan CBM IX 100 Replicate 2 1.12 W-S-C-X-100-3 Western Wheatgrass Sheridan CBM IX 100 Replicate 3 1.18 W-S-C-X-100-4 Western Wheatgrass Sheridan CBM IX 100 Replicate 4 1.16 W-S-C-X-25-1 Western Wheatgrass Sheridan CBM IX 25 Replicate 1 2.34 W-S-C-X-25-2 Western Wheatgrass Sheridan CBM IX 25 Replicate 2 2.25 W-S-C-X-25-3 Western Wheatgrass Sheridan CBM IX 25 Replicate 3 3.26 W-S-C-X-25-4 Western Wheatgrass Sheridan CBM IX 25 Replicate 4 1.98 W-S-C-X-50-1 Western Wheatgrass Sheridan CBM IX 50 Replicate 1 2.41 W-S-C-X-50-2 Western Wheatgrass Sheridan CBM IX 50 Replicate 2 2.62 W-S-C-X-50-3 Western Wheatgrass Sheridan CBM IX 50 Replicate 3 1.20 W-S-C-X-50-4 Western Wheatgrass Sheridan CBM IX 50 Replicate 4 2.04 W-S-C-X-75-1 Western Wheatgrass Sheridan CBM IX 75 Replicate 1 1.51 W-S-C-X-75-2 Western Wheatgrass Sheridan CBM IX 75 Replicate 2 1.90 W-S-C-X-75-3 Western Wheatgrass Sheridan CBM IX 75 Replicate 3 1.43 W-S-C-X-75-4 Western Wheatgrass Sheridan CBM IX 75 Replicate 4 1.23 W-S-L-U-0-1 Western Wheatgrass Sheridan Control Replicate 1 1.55 W-S-L-U-0-2 Western Wheatgrass Sheridan Control Replicate 2 0.96 W-S-L-U-0-3 Western Wheatgrass Sheridan Control Replicate 3 0.75 W-S-L-U-0-4 Western Wheatgrass Sheridan Control Replicate 4 1.27 W-S-O-E-100-1 Western Wheatgrass Sheridan O&G EDR 100 Replicate 1 1.16 W-S-O-E-100-2 Western Wheatgrass Sheridan O&G EDR 100 Replicate 2 1.45 W-S-O-E-100-3 Western Wheatgrass Sheridan O&G EDR 100 Replicate 3 1.37 W-S-O-E-100-4 Western Wheatgrass Sheridan O&G EDR 100 Replicate 4 1.43 W-S-O-E-25-1 Western Wheatgrass Sheridan O&G EDR 25 Replicate 1 1.67 W-S-O-E-25-2 Western Wheatgrass Sheridan O&G EDR 25 Replicate 2 1.12 W-S-O-E-25-3 Western Wheatgrass Sheridan O&G EDR 25 Replicate 3 1.18 W-S-O-E-25-4 Western Wheatgrass Sheridan O&G EDR 25 Replicate 4 1.16
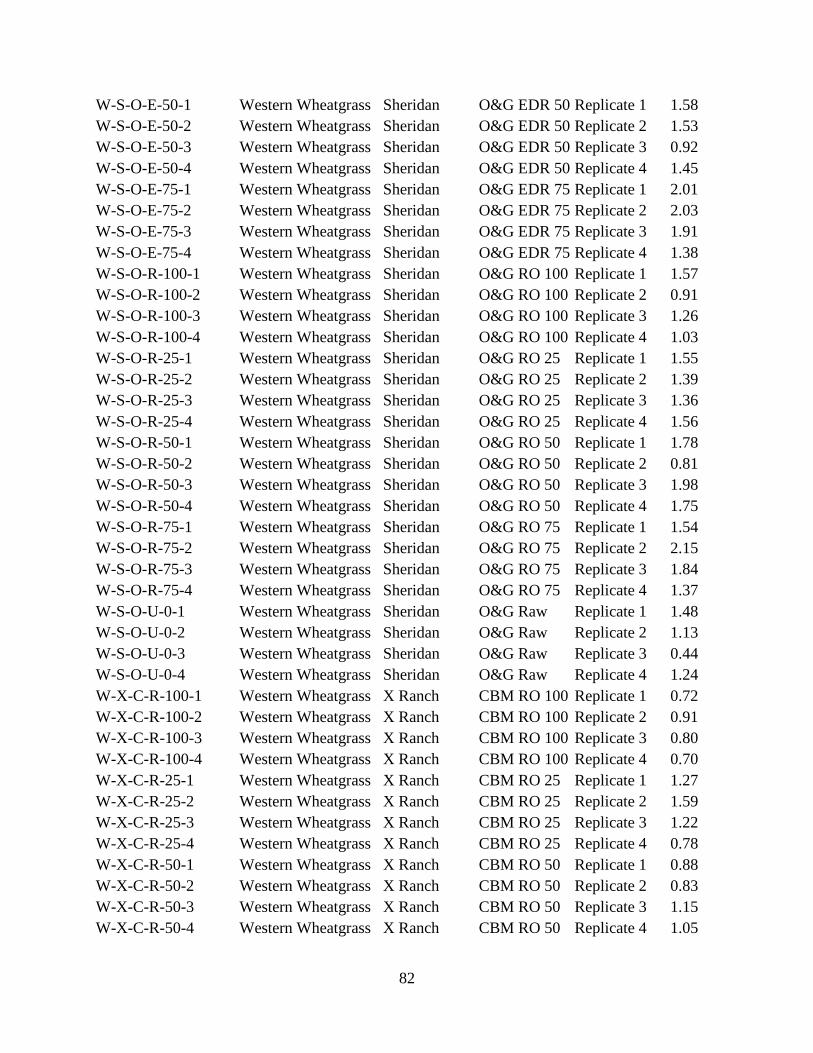
82
W-S-O-E-50-1 Western Wheatgrass Sheridan O&G EDR 50 Replicate 1 1.58 W-S-O-E-50-2 Western Wheatgrass Sheridan O&G EDR 50 Replicate 2 1.53 W-S-O-E-50-3 Western Wheatgrass Sheridan O&G EDR 50 Replicate 3 0.92 W-S-O-E-50-4 Western Wheatgrass Sheridan O&G EDR 50 Replicate 4 1.45 W-S-O-E-75-1 Western Wheatgrass Sheridan O&G EDR 75 Replicate 1 2.01 W-S-O-E-75-2 Western Wheatgrass Sheridan O&G EDR 75 Replicate 2 2.03 W-S-O-E-75-3 Western Wheatgrass Sheridan O&G EDR 75 Replicate 3 1.91 W-S-O-E-75-4 Western Wheatgrass Sheridan O&G EDR 75 Replicate 4 1.38 W-S-O-R-100-1 Western Wheatgrass Sheridan O&G RO 100 Replicate 1 1.57 W-S-O-R-100-2 Western Wheatgrass Sheridan O&G RO 100 Replicate 2 0.91 W-S-O-R-100-3 Western Wheatgrass Sheridan O&G RO 100 Replicate 3 1.26 W-S-O-R-100-4 Western Wheatgrass Sheridan O&G RO 100 Replicate 4 1.03 W-S-O-R-25-1 Western Wheatgrass Sheridan O&G RO 25 Replicate 1 1.55 W-S-O-R-25-2 Western Wheatgrass Sheridan O&G RO 25 Replicate 2 1.39 W-S-O-R-25-3 Western Wheatgrass Sheridan O&G RO 25 Replicate 3 1.36 W-S-O-R-25-4 Western Wheatgrass Sheridan O&G RO 25 Replicate 4 1.56 W-S-O-R-50-1 Western Wheatgrass Sheridan O&G RO 50 Replicate 1 1.78 W-S-O-R-50-2 Western Wheatgrass Sheridan O&G RO 50 Replicate 2 0.81 W-S-O-R-50-3 Western Wheatgrass Sheridan O&G RO 50 Replicate 3 1.98 W-S-O-R-50-4 Western Wheatgrass Sheridan O&G RO 50 Replicate 4 1.75 W-S-O-R-75-1 Western Wheatgrass Sheridan O&G RO 75 Replicate 1 1.54 W-S-O-R-75-2 Western Wheatgrass Sheridan O&G RO 75 Replicate 2 2.15 W-S-O-R-75-3 Western Wheatgrass Sheridan O&G RO 75 Replicate 3 1.84 W-S-O-R-75-4 Western Wheatgrass Sheridan O&G RO 75 Replicate 4 1.37 W-S-O-U-0-1 Western Wheatgrass Sheridan O&G Raw Replicate 1 1.48 W-S-O-U-0-2 Western Wheatgrass Sheridan O&G Raw Replicate 2 1.13 W-S-O-U-0-3 Western Wheatgrass Sheridan O&G Raw Replicate 3 0.44 W-S-O-U-0-4 Western Wheatgrass Sheridan O&G Raw Replicate 4 1.24 W-X-C-R-100-1 Western Wheatgrass X Ranch CBM RO 100 Replicate 1 0.72 W-X-C-R-100-2 Western Wheatgrass X Ranch CBM RO 100 Replicate 2 0.91 W-X-C-R-100-3 Western Wheatgrass X Ranch CBM RO 100 Replicate 3 0.80 W-X-C-R-100-4 Western Wheatgrass X Ranch CBM RO 100 Replicate 4 0.70 W-X-C-R-25-1 Western Wheatgrass X Ranch CBM RO 25 Replicate 1 1.27 W-X-C-R-25-2 Western Wheatgrass X Ranch CBM RO 25 Replicate 2 1.59 W-X-C-R-25-3 Western Wheatgrass X Ranch CBM RO 25 Replicate 3 1.22 W-X-C-R-25-4 Western Wheatgrass X Ranch CBM RO 25 Replicate 4 0.78 W-X-C-R-50-1 Western Wheatgrass X Ranch CBM RO 50 Replicate 1 0.88 W-X-C-R-50-2 Western Wheatgrass X Ranch CBM RO 50 Replicate 2 0.83 W-X-C-R-50-3 Western Wheatgrass X Ranch CBM RO 50 Replicate 3 1.15 W-X-C-R-50-4 Western Wheatgrass X Ranch CBM RO 50 Replicate 4 1.05
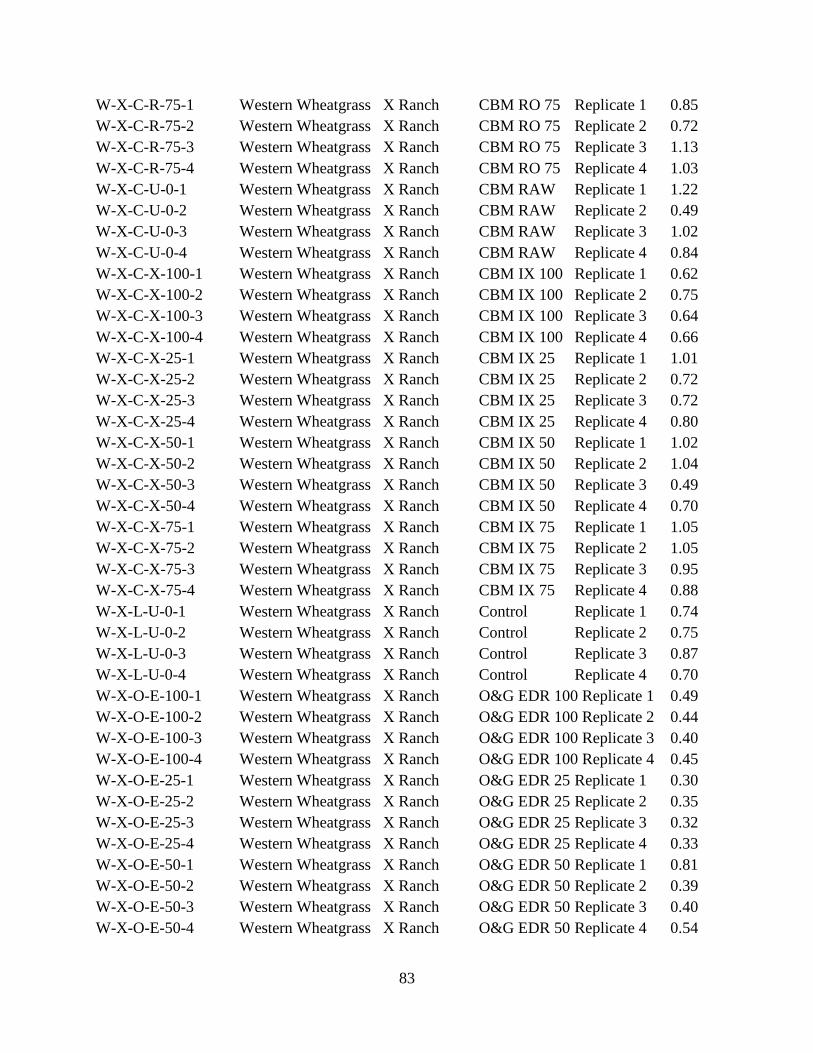
83
W-X-C-R-75-1 Western Wheatgrass X Ranch CBM RO 75 Replicate 1 0.85 W-X-C-R-75-2 Western Wheatgrass X Ranch CBM RO 75 Replicate 2 0.72 W-X-C-R-75-3 Western Wheatgrass X Ranch CBM RO 75 Replicate 3 1.13 W-X-C-R-75-4 Western Wheatgrass X Ranch CBM RO 75 Replicate 4 1.03 W-X-C-U-0-1 Western Wheatgrass X Ranch CBM RAW Replicate 1 1.22 W-X-C-U-0-2 Western Wheatgrass X Ranch CBM RAW Replicate 2 0.49 W-X-C-U-0-3 Western Wheatgrass X Ranch CBM RAW Replicate 3 1.02 W-X-C-U-0-4 Western Wheatgrass X Ranch CBM RAW Replicate 4 0.84 W-X-C-X-100-1 Western Wheatgrass X Ranch CBM IX 100 Replicate 1 0.62 W-X-C-X-100-2 Western Wheatgrass X Ranch CBM IX 100 Replicate 2 0.75 W-X-C-X-100-3 Western Wheatgrass X Ranch CBM IX 100 Replicate 3 0.64 W-X-C-X-100-4 Western Wheatgrass X Ranch CBM IX 100 Replicate 4 0.66 W-X-C-X-25-1 Western Wheatgrass X Ranch CBM IX 25 Replicate 1 1.01 W-X-C-X-25-2 Western Wheatgrass X Ranch CBM IX 25 Replicate 2 0.72 W-X-C-X-25-3 Western Wheatgrass X Ranch CBM IX 25 Replicate 3 0.72 W-X-C-X-25-4 Western Wheatgrass X Ranch CBM IX 25 Replicate 4 0.80 W-X-C-X-50-1 Western Wheatgrass X Ranch CBM IX 50 Replicate 1 1.02 W-X-C-X-50-2 Western Wheatgrass X Ranch CBM IX 50 Replicate 2 1.04 W-X-C-X-50-3 Western Wheatgrass X Ranch CBM IX 50 Replicate 3 0.49 W-X-C-X-50-4 Western Wheatgrass X Ranch CBM IX 50 Replicate 4 0.70 W-X-C-X-75-1 Western Wheatgrass X Ranch CBM IX 75 Replicate 1 1.05 W-X-C-X-75-2 Western Wheatgrass X Ranch CBM IX 75 Replicate 2 1.05 W-X-C-X-75-3 Western Wheatgrass X Ranch CBM IX 75 Replicate 3 0.95 W-X-C-X-75-4 Western Wheatgrass X Ranch CBM IX 75 Replicate 4 0.88 W-X-L-U-0-1 Western Wheatgrass X Ranch Control Replicate 1 0.74 W-X-L-U-0-2 Western Wheatgrass X Ranch Control Replicate 2 0.75 W-X-L-U-0-3 Western Wheatgrass X Ranch Control Replicate 3 0.87 W-X-L-U-0-4 Western Wheatgrass X Ranch Control Replicate 4 0.70 W-X-O-E-100-1 Western Wheatgrass X Ranch O&G EDR 100 Replicate 1 0.49 W-X-O-E-100-2 Western Wheatgrass X Ranch O&G EDR 100 Replicate 2 0.44 W-X-O-E-100-3 Western Wheatgrass X Ranch O&G EDR 100 Replicate 3 0.40 W-X-O-E-100-4 Western Wheatgrass X Ranch O&G EDR 100 Replicate 4 0.45 W-X-O-E-25-1 Western Wheatgrass X Ranch O&G EDR 25 Replicate 1 0.30 W-X-O-E-25-2 Western Wheatgrass X Ranch O&G EDR 25 Replicate 2 0.35 W-X-O-E-25-3 Western Wheatgrass X Ranch O&G EDR 25 Replicate 3 0.32 W-X-O-E-25-4 Western Wheatgrass X Ranch O&G EDR 25 Replicate 4 0.33 W-X-O-E-50-1 Western Wheatgrass X Ranch O&G EDR 50 Replicate 1 0.81 W-X-O-E-50-2 Western Wheatgrass X Ranch O&G EDR 50 Replicate 2 0.39 W-X-O-E-50-3 Western Wheatgrass X Ranch O&G EDR 50 Replicate 3 0.40 W-X-O-E-50-4 Western Wheatgrass X Ranch O&G EDR 50 Replicate 4 0.54

84
W-X-O-E-75-1 Western Wheatgrass X Ranch O&G EDR 75 Replicate 1 0.51 W-X-O-E-75-2 Western Wheatgrass X Ranch O&G EDR 75 Replicate 2 0.37 W-X-O-E-75-3 Western Wheatgrass X Ranch O&G EDR 75 Replicate 3 0.43 W-X-O-E-75-4 Western Wheatgrass X Ranch O&G EDR 75 Replicate 4 0.27 W-X-O-R-100-1 Western Wheatgrass X Ranch O&G RO 100 Replicate 1 0.59 W-X-O-R-100-2 Western Wheatgrass X Ranch O&G RO 100 Replicate 2 0.50 W-X-O-R-100-3 Western Wheatgrass X Ranch O&G RO 100 Replicate 3 0.66 W-X-O-R-100-4 Western Wheatgrass X Ranch O&G RO 100 Replicate 4 0.73 W-X-O-R-25-1 Western Wheatgrass X Ranch O&G RO 25 Replicate 1 0.48 W-X-O-R-25-2 Western Wheatgrass X Ranch O&G RO 25 Replicate 2 0.29 W-X-O-R-25-3 Western Wheatgrass X Ranch O&G RO 25 Replicate 3 0.30 W-X-O-R-25-4 Western Wheatgrass X Ranch O&G RO 25 Replicate 4 0.27 W-X-O-R-50-1 Western Wheatgrass X Ranch O&G RO 50 Replicate 1 0.64 W-X-O-R-50-2 Western Wheatgrass X Ranch O&G RO 50 Replicate 2 0.52 W-X-O-R-50-3 Western Wheatgrass X Ranch O&G RO 50 Replicate 3 1.49 W-X-O-R-50-4 Western Wheatgrass X Ranch O&G RO 50 Replicate 4 0.54 W-X-O-R-75-1 Western Wheatgrass X Ranch O&G RO 75 Replicate 1 0.60 W-X-O-R-75-2 Western Wheatgrass X Ranch O&G RO 75 Replicate 2 0.50 W-X-O-R-75-3 Western Wheatgrass X Ranch O&G RO 75 Replicate 3 0.55 W-X-O-R-75-4 Western Wheatgrass X Ranch O&G RO 75 Replicate 4 0.42 W-X-O-U-0-1 Western Wheatgrass X Ranch O&G Raw Replicate 1 0.30 W-X-O-U-0-2 Western Wheatgrass X Ranch O&G Raw Replicate 2 0.30 W-X-O-U-0-3 Western Wheatgrass X Ranch O&G Raw Replicate 3 0.26 W-X-O-U-0-4 Western Wheatgrass X Ranch O&G Raw Replicate 4 0.23 A – alfalfa; W – western wheatgrass; R – Riverton soil; S – Sheridan soil; X – X-Ranch Soil; C – CBNG produced water; O – conventional oil and gas produced water; U – untreated produced water; L – River Water (control); R – reverse osmosis water treatment; X – ion exchange (EMIT technology) water treatment; E – EDR water treatment; 25 – 25% treatment of produced water; 50 – 50% treatment of produced water; 75 – 75% treatment of produced water; 100 – 100% treatment of produced water.
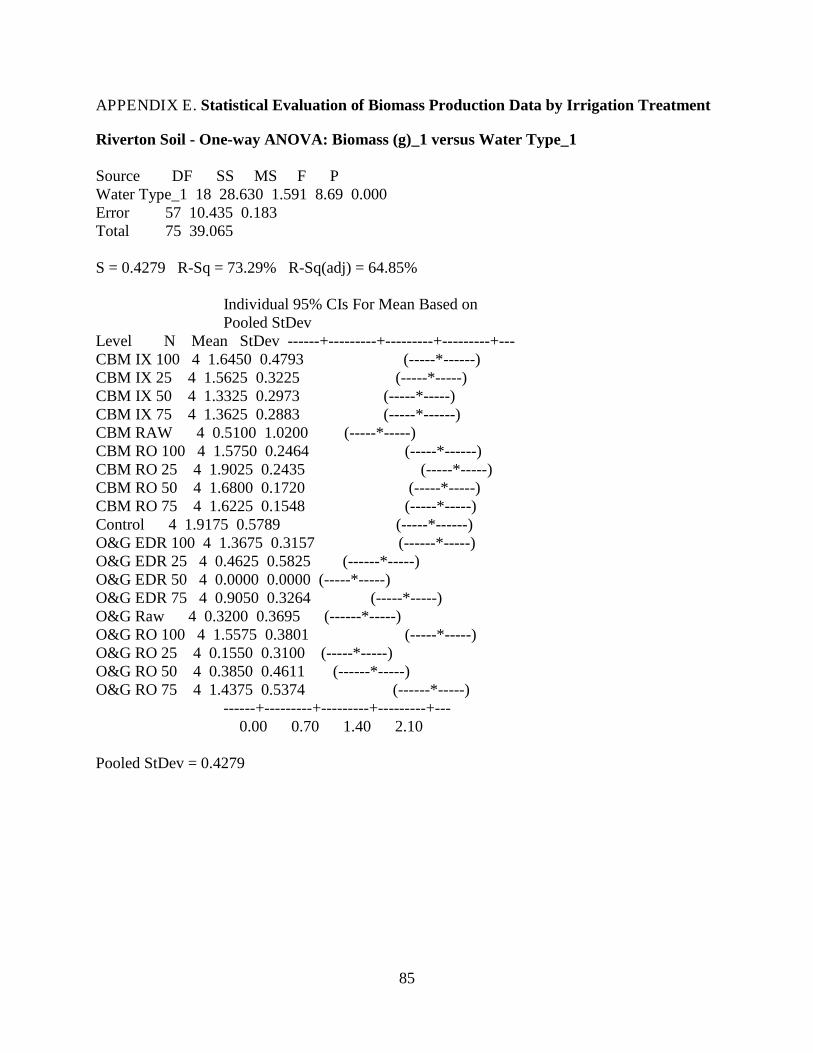
85
APPENDIX E. Statistical Evaluation of Biomass Production Data by Irrigation Treatment
Riverton Soil - One-way ANOVA: Biomass (g)_1 versus Water Type_1 Source DF SS MS F P Water Type_1 18 28.630 1.591 8.69 0.000 Error 57 10.435 0.183 Total 75 39.065 S = 0.4279 R-Sq = 73.29% R-Sq(adj) = 64.85% Individual 95% CIs For Mean Based on Pooled StDev Level N Mean StDev ------+---------+---------+---------+--- CBM IX 100 4 1.6450 0.4793 (-----*------) CBM IX 25 4 1.5625 0.3225 (-----*-----) CBM IX 50 4 1.3325 0.2973 (-----*-----) CBM IX 75 4 1.3625 0.2883 (-----*------) CBM RAW 4 0.5100 1.0200 (-----*-----) CBM RO 100 4 1.5750 0.2464 (-----*------) CBM RO 25 4 1.9025 0.2435 (-----*-----) CBM RO 50 4 1.6800 0.1720 (-----*-----) CBM RO 75 4 1.6225 0.1548 (-----*-----) Control 4 1.9175 0.5789 (-----*------) O&G EDR 100 4 1.3675 0.3157 (------*-----) O&G EDR 25 4 0.4625 0.5825 (------*-----) O&G EDR 50 4 0.0000 0.0000 (-----*-----) O&G EDR 75 4 0.9050 0.3264 (-----*-----) O&G Raw 4 0.3200 0.3695 (------*-----) O&G RO 100 4 1.5575 0.3801 (-----*-----) O&G RO 25 4 0.1550 0.3100 (-----*-----) O&G RO 50 4 0.3850 0.4611 (------*-----) O&G RO 75 4 1.4375 0.5374 (------*-----) ------+---------+---------+---------+--- 0.00 0.70 1.40 2.10 Pooled StDev = 0.4279

86
Sheridan Soil - One-way ANOVA: Biomass (g)_2 versus Water Type_2 Source DF SS MS F P Water Type_2 18 37.834 2.102 13.59 0.000 Error 57 8.818 0.155 Total 75 46.652 S = 0.3933 R-Sq = 81.10% R-Sq(adj) = 75.13% Individual 95% CIs For Mean Based on Pooled StDev Level N Mean StDev ----+---------+---------+---------+----- CBM IX 100 4 2.6950 0.8077 (---*---) CBM IX 25 4 1.5025 0.1996 (---*---) CBM IX 50 4 1.8600 0.3421 (---*---) CBM IX 75 4 1.9050 0.5770 (---*---) CBM RAW 4 1.6550 0.1690 (---*--) CBM RO 100 4 2.3000 0.5623 (---*---) CBM RO 25 4 1.3750 0.1427 (---*---) CBM RO 50 4 1.7450 0.2419 (--*---) CBM RO 75 4 1.7525 0.3462 (---*--) Control 4 2.4175 0.1672 (---*---) O&G EDR 100 4 1.8500 0.1910 (---*--) O&G EDR 25 4 0.5950 0.4005 (---*---) O&G EDR 50 4 0.9550 0.6602 (---*--) O&G EDR 75 4 1.6975 0.5240 (---*---) O&G Raw 4 0.0000 0.0000 (---*---) O&G RO 100 4 2.4125 0.2508 (---*---) O&G RO 25 4 0.1450 0.2900 (--*---) O&G RO 50 4 1.6200 0.3763 (---*---) O&G RO 75 4 1.5250 0.1725 (---*---) ----+---------+---------+---------+----- 0.0 1.0 2.0 3.0 Pooled StDev = 0.3933

87
X-Ranch Soil - One-way ANOVA: Biomass (g)_1 versus Water Type_1 Source DF SS MS F P Water Type_1 18 28.630 1.591 8.69 0.000 Error 57 10.435 0.183 Total 75 39.065 S = 0.4279 R-Sq = 73.29% R-Sq(adj) = 64.85% Individual 95% CIs For Mean Based on Pooled StDev Level N Mean StDev ------+---------+---------+---------+--- CBM IX 100 4 1.6450 0.4793 (-----*------) CBM IX 25 4 1.5625 0.3225 (-----*-----) CBM IX 50 4 1.3325 0.2973 (-----*-----) CBM IX 75 4 1.3625 0.2883 (-----*------) CBM RAW 4 0.5100 1.0200 (-----*-----) CBM RO 100 4 1.5750 0.2464 (-----*------) CBM RO 25 4 1.9025 0.2435 (-----*-----) CBM RO 50 4 1.6800 0.1720 (-----*-----) CBM RO 75 4 1.6225 0.1548 (-----*-----) Control 4 1.9175 0.5789 (-----*------) O&G EDR 100 4 1.3675 0.3157 (------*-----) O&G EDR 25 4 0.4625 0.5825 (------*-----) O&G EDR 50 4 0.0000 0.0000 (-----*-----) O&G EDR 75 4 0.9050 0.3264 (-----*-----) O&G Raw 4 0.3200 0.3695 (------*-----) O&G RO 100 4 1.5575 0.3801 (-----*-----) O&G RO 25 4 0.1550 0.3100 (-----*-----) O&G RO 50 4 0.3850 0.4611 (------*-----) O&G RO 75 4 1.4375 0.5374 (------*-----) ------+---------+---------+---------+--- 0.00 0.70 1.40 2.10 Pooled StDev = 0.4279

88
APPENDIX F. Elemental Analysis of Biomass
Sample ID NO3 Cl B-T Ca-T Cu-T Fe-T Mg-T S-T K-T Mo-T Na-T P-T Zn-T
mg/kg mg/L mg/kg mg/kg mg/kg mg/kg mg/kg mg/kg mg/kg mg/kg mg/kg mg/kg mg/kg
W-R-C-U-0 57 50 33 3970 128 223 1900 2260 29500 <5 4550 1630 51 W-R-C-R-25 54 37 42 3890 208 227 1600 2000 26600 <5 3600 1760 48 W-R-C-R-50 50 50 40 4250 248 290 1690 1520 26400 <5 2980 1890 56 W-R-C-R-75 34 25 55 4260 319 400 1660 1550 22700 <5 2340 1980 44 W-R-C-R-100 45 37 77 3960 265 247 1550 1590 22200 <5 2360 2240 48 W-R-C-X-25 66 25 33 4500 200 247 1910 2690 29600 <5 5170 1790 67 W-R-C-X-50 52 37 35 3960 237 180 1790 2420 26700 <5 4500 1960 56 W-R-C-X-75 35 69 33 4360 28 149 1810 1590 24500 <5 3510 2050 46 W-R-C-X-100 34 56 30 3680 13 129 1460 1540 20800 <5 3210 2060 43 W-R-L-U-0 39 56 27 5200 23 202 1990 3020 24300 <5 4210 2270 55 W-R-O-U-0
125 552 4660 16 224 1610 4980 16500 <5 50900 1680 36
W-R-O-E-25 46 97 302 4310 71 181 1250 1770 16500 <5 23600 1660 65 W-R-O-E-50 44 69 528 4510 49 128 1390 1660 17400 <5 13200 1610 51 W-R-O-E-75 37 87 610 4430 101 180 1450 1460 18200 <5 7820 2230 63 W-R-O-E-100 89 50 642 4710 33 105 1330 1350 20100 <5 2440 1480 41 W-R-O-R-25 79 237 526 4260 11 123 1640 2740 18700 <5 33200 2490 53 W-R-O-R-50 32 112 464 6910 117 426 2090 3620 17400 <5 38600 1890 64 W-R-O-R-75 42 112 191 5040 43 291 1690 1440 23000 <5 11900 2000 51 W-R-O-R-100 77 62 186 3850 59 170 1530 1800 22400 <5 2190 1450 51 W-S-C-U-0 230 75 16 3570 25 265 1940 1800 31200 <5 5300 1440 45 W-S-C-R-25 220 75 21 3300 23 213 1770 1650 31200 <5 5320 1620 40 W-S-C-R-50 150 87 36 3340 19 198 1820 1600 26000 <5 2410 2220 38 W-S-C-R-75 82 50 41 3160 21 160 1610 1320 21200 <5 2330 2090 41 W-S-C-R-100 180 75 119 4480 134 238 1810 1430 22500 <5 1430 1810 66 W-S-C-X-25 160 87 14 3940 21 310 1830 1600 28700 <5 4480 1550 44 W-S-C-X-50 150 75 17 3500 33 208 1770 1550 26900 <5 4120 1770 39 W-S-C-X-75 55 87 26 3540 49 173 1690 1500 27600 <5 2780 2190 37 W-S-C-X-100 63 100 39 4390 43 166 1790 1350 23300 <5 2530 1650 42 W-S-L-U-0 46 75 18 4740 19 209 2450 2270 24300 <5 1750 1910 47 W-S-O-U-0 140 150 154 2670 24 386 1310 1910 17600 <5 25700 1780 37
89
W-S-O-E-25 110 125 201 3260 19 204 1780 2090 27800 <5 22100 1970 42 W-S-O-E-50 96 112 332 3600 20 189 1620 1650 24900 <5 11300 1660 39 W-S-O-E-75 130 150 541 4240 17 155 1640 1650 31700 <5 6420 2500 44 W-S-O-E-100 42 62 2120 4550 31 163 1550 1200 24400 <5 1330 2250 42 W-S-O-R-25 130 137 152 2860 15 137 1510 1950 21300 <5 19300 2090 30 W-S-O-R-50 140 100 132 3360 10 172 1690 1990 25000 <5 13500 2130 36 W-S-O-R-75 72 87 135 4000 12 167 1670 1470 26400 <5 7900 1980 36 W-S-O-R-100 57 62 144 4330 18 168 1860 1290 23600 <5 1210 2070 37 W-X-C-U-0 960 87 24 2780 78 202 2220 3040 28700 <5 22900 1760 33 W-X-C-R-25
100 26 2710 28 174 2170 2570 28200 <5 14200 1710 26
W-X-C-R-50 96 87 41 3600 88 198 2570 2730 33600 <5 7340 1990 40 W-X-C-R-75 380 100 49 3520 31 118 2280 2330 29400 <5 2830 2180 29 W-X-C-R-100 70 125 47 4450 8 142 2280 2170 27900 <5 772 1930 29 W-X-C-X-25 960 125 27 3200 10 191 2630 3790 30300 <5 35000 2070 24 W-X-C-X-50 350 100 19 4110 73 204 2580 2990 31200 <5 8540 2290 47 W-X-C-X-75 46 87 24 3690 38 132 2250 2370 29000 <5 4220 2500 30 W-X-C-X-100 68 112 19 4500 8 172 2240 2050 23800 <5 1920 1860 28 W-X-L-U-0 39 125 13 5540 8 142 2930 3460 26400 <5 1470 1990 30 W-X-O-U-0 130 337 261 4120 7 110 2160 1940 16700 <5 44900 1260 24 W-X-O-E-25 260 387 250 3370 8 105 1800 2240 16800 <5 36400 1890 23 W-X-O-E-50 280 475 337 3960 9 130 2140 2330 21400 <5 29600 1770 29 W-X-O-E-75 120 425 714 4890 9 153 2130 2210 20700 <5 15600 2120 31 W-X-O-E-100 87 237 1090 4970 8 127 2100 2150 27600 <5 1730 1390 27 W-X-O-R-25
350 343 4160 8 189 2080 1810 12600 <5 64600 956 32
W-X-O-R-75 120 387 142 4310 10 166 2090 2410 24000 <5 18100 1780 35 W-X-O-R-100 76 325 66 4930 10 141 2440 3010 32100 <5 1090 1850 38 A-R-C-U-0 96 75 107 21300 30 219 2660 5060 30100 <5 6820 1530 46 A-R-C-R-25 81 87 97 19500 19 286 2410 3640 27200 <5 6440 1840 39 A-R-C-R-50 51 75 105 19300 17 139 2340 4150 26600 <5 5650 1790 39 A-R-C-R-75 37 62 103 18800 18 124 2170 4070 27300 <5 6550 1620 35 A-R-C-R-100 170 87 115 22000 25 199 2800 3400 32300 <5 3640 2210 51 A-R-C-X-25 61 100 103 19800 18 225 2350 4250 28300 <5 6580 1720 40 A-R-C-X-50 63 75 101 17800 15 257 2600 4880 25800 <5 9040 1930 39
90
A-R-C-X-75 49 100 110 19900 16 144 2250 4420 27800 <5 6010 1850 38 A-R-C-X-100 52 100 106 20900 19 189 2290 4180 27600 <5 4910 2340 44 A-R-L-U-0 38 112 113 23100 18 219 2840 6340 27800 <5 3970 1920 44 A-R-O-U-0
287 239 14300 17 454 3030 3580 11600 12 56100 2490 40
A-R-O-E-25 32 337 322 17900 14 125 2320 3880 25800 <5 21400 2210 50 A-R-O-E-50
175 306 21200 19 287 2410 5180 8370 <5 49000 2170 70
A-R-O-E-75 27 162 491 20500 24 151 2180 3660 23900 <5 10900 1660 37 A-R-O-E-100 37 112 600 19500 20 239 2290 3210 32700 <5 2560 1700 39 A-R-O-R-25
212 198 10500 15 238 2060 2910 12500 <5 48300 2550 50
A-R-O-R-50 140 337 237 19400 16 180 3820 4100 15200 <5 24300 1790 46 A-R-O-R-75 29 100 190 21300 20 346 2240 4140 26700 <5 8630 1970 51 A-R-O-R-100 38 87 132 21300 18 256 2250 4420 30000 <5 6040 1700 50 A-S-C-U-0 250 100 106 17900 17 299 3810 3280 27800 6 7460 2090 43 A-S-C-R-25 290 150 107 14700 21 480 2870 3760 28400 6 5840 1980 46 A-S-C-R-50 380 112 121 16500 18 454 2910 4270 30400 <5 5240 2110 44 A-S-C-R-75 200 125 133 19800 23 339 3380 4180 32600 <5 3830 2240 60 A-S-C-R-100 74 125 206 17900 17 277 2980 3330 27700 <5 1390 1880 48 A-S-C-X-25 270 112 106 14700 23 355 3180 3640 25200 <5 6380 2140 50 A-S-C-X-50 140 112 112 16600 23 454 3120 3460 31800 <5 4370 1980 47 A-S-C-X-75 140 150 125 20000 21 379 3390 3650 30500 <5 4190 2270 58 A-S-C-X-100 78 162 128 21700 20 331 3490 3820 30300 <5 1940 2100 56 A-S-L-U-0 76 87 134 21700 23 692 4150 5730 29100 <5 1550 2280 66 A-S-O-E-25 52 462 256 11600 9 107 2090 2830 13800 <5 46700 1790 32 A-S-O-E-50 46 250 302 18000 25 188 3040 3930 17100 6 24100 2020 41 A-S-O-E-75 67 150 452 19100 17 240 3130 3470 24300 <5 9270 2150 46 A-S-O-E-100 76 87 1080 18000 20 192 3380 2890 31100 <5 1640 2070 54 A-S-O-R-25
137 194 11800 13 332 2140 3110 12100 11 51100 1940 36
A-S-O-R-50 38 287 183 13100 12 232 2450 3260 17300 6 23700 2120 39 A-S-O-R-75 65 137 166 17000 15 189 2780 3460 27000 <5 5500 2520 42 A-S-O-R-100 61 112 175 17800 20 276 3110 3450 28700 <5 1330 2080 50 A-X-C-U-0 75 100 93 13600 9 108 3450 3640 21700 <5 9410 1410 22 A-X-C-R-25 70 112 112 19300 13 656 4130 4380 27200 <5 4640 1810 28 A-X-C-R-50 57 137 116 21600 12 739 4240 6010 29600 <5 5710 1670 31
91
A-X-C-R-75 29 87 119 24800 11 335 3890 4200 26100 <5 3780 1380 28 A-X-C-R-100 28 50 125 22600 13 1050 3440 4100 26100 <5 1330 1380 34 A-X-C-X-25 35 100 110 19000 10 630 4010 4920 22500 <5 8410 1520 22 A-X-C-X-50 32 137 128 24100 15 432 4100 5320 25800 <5 4600 1530 32 A-X-C-X-75 58 175 140 23500 12 269 4130 4610 26500 <5 5480 1590 30 A-X-C-X-100 27 125 120 25800 9 1620 4800 4090 22700 <5 1710 1250 33 A-X-L-U-0 27 150 116 25400 9 489 4080 5650 28500 <5 1420 1180 25 A-X-O-E-75
325 607 16200 19 179 3000 3220 13300 <5 23500 1920 33
A-X-O-E-100 90 125 984 22000 11 1610 3620 3460 25100 <5 1880 1300 26 A-X-O-R-25
150 234 21000 16 125 5570 5230 23700 7 4390 1920 35
A-X-O-R-50
125 274 14800 13 202 2670 3890 7350 <5 30500 1310 39 A-X-O-R-75 160 300 217 16500 11 209 3060 3040 10900 <5 19600 1710 33 A-X-O-R-100 270 150 130 26300 12 3180 4820 3000 23200 <5 1060 1190 41
A – alfalfa; W – western wheatgrass; R – Riverton soil; S – Sheridan soil; X – X-Ranch Soil; C – CBNG produced water; O – conventional oil and gas produced water; U – untreated produced water; L – River Water (control); R – reverse osmosis water treatment; X – ion exchange (EMIT technology) water treatment; E – EDR water treatment; 25 – 25% treatment of produced water; 50 – 50% treatment of produced water; 75 – 75% treatment of produced water;