effects of interposing sugar beet on the nitrogen response of the following wheat crop
TRANSCRIPT
J Sci Food Agric 1997, 74, 323È330
Effects of Interposing Sugar Beet on the NitrogenResponse of the Following Wheat CropRoger Sylvester-Bradley1 and Mark A Shepherd2*1 ADAS Arable Research Centre, Anstey Hall, Maris Lane, Trumpington, Cambridge, CB2 2LF, UK2 ADAS Land Research Centre, Gleadthorpe, Meden Vale, MansÐeld, Nottinghamshire, NG20 9PF, UK
(Received 7 May 1996 ; revised version received 5 September 1996 ; accepted 27 January 1997)
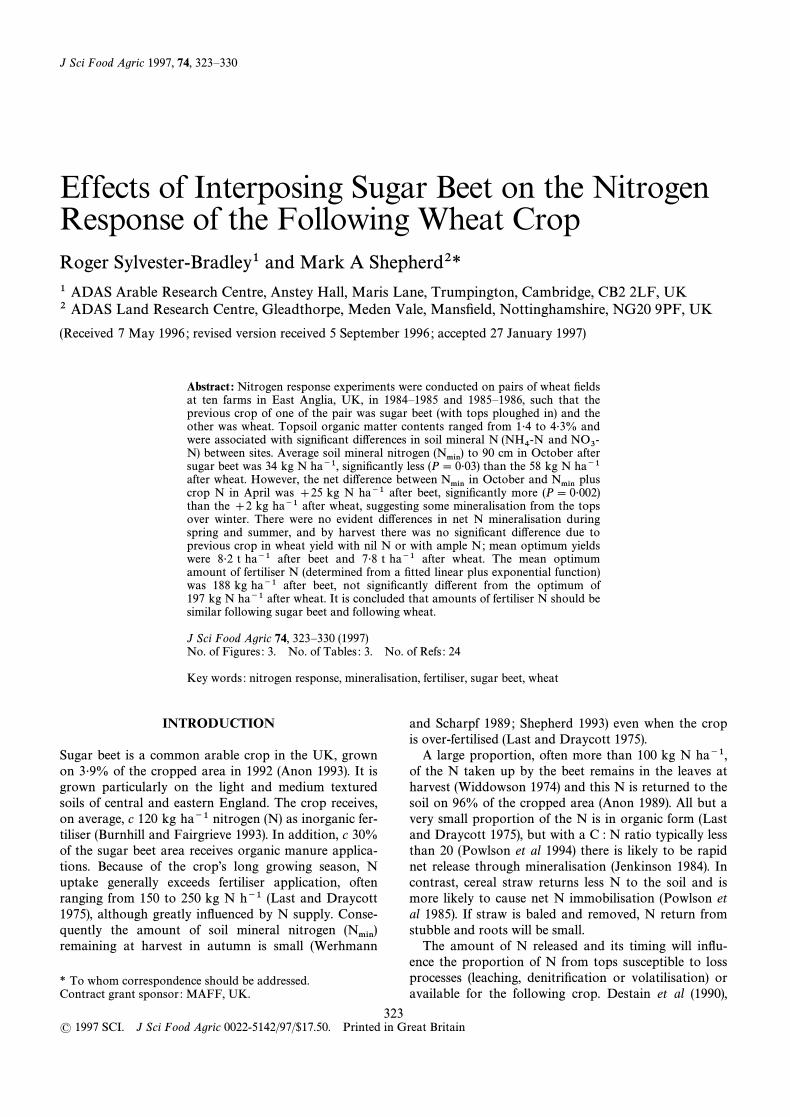
Abstract : Nitrogen response experiments were conducted on pairs of wheat Ðeldsat ten farms in East Anglia, UK, in 1984È1985 and 1985È1986, such that theprevious crop of one of the pair was sugar beet (with tops ploughed in) and theother was wheat. Topsoil organic matter contents ranged from 1É4 to 4É3% andwere associated with signiÐcant di†erences in soil mineral N and(NH4-N NO3-between sites. Average soil mineral nitrogen to 90 cm in October afterN) (Nmin)sugar beet was 34 kg N ha~1, signiÐcantly less (P\ 0É03) than the 58 kg N ha~1after wheat. However, the net di†erence between in October and plusNmin Nmincrop N in April was ]25 kg N ha~1 after beet, signiÐcantly more (P\ 0É002)than the ]2 kg ha~1 after wheat, suggesting some mineralisation from the topsover winter. There were no evident di†erences in net N mineralisation duringspring and summer, and by harvest there was no signiÐcant di†erence due toprevious crop in wheat yield with nil N or with ample N; mean optimum yieldswere 8É2 t ha~1 after beet and 7É8 t ha~1 after wheat. The mean optimumamount of fertiliser N (determined from a Ðtted linear plus exponential function)was 188 kg ha~1 after beet, not signiÐcantly di†erent from the optimum of197 kg N ha~1 after wheat. It is concluded that amounts of fertiliser N should besimilar following sugar beet and following wheat.
J Sci Food Agric 74, 323È330 (1997)No. of Figures : 3. No. of Tables : 3. No. of Refs : 24
Key words : nitrogen response, mineralisation, fertiliser, sugar beet, wheat
INTRODUCTION
Sugar beet is a common arable crop in the UK, grownon 3É9% of the cropped area in 1992 (Anon 1993). It isgrown particularly on the light and medium texturedsoils of central and eastern England. The crop receives,on average, c 120 kg ha~1 nitrogen (N) as inorganic fer-tiliser (Burnhill and Fairgrieve 1993). In addition, c 30%of the sugar beet area receives organic manure applica-tions. Because of the cropÏs long growing season, Nuptake generally exceeds fertiliser application, oftenranging from 150 to 250 kg N h~1 (Last and Draycott1975), although greatly inÑuenced by N supply. Conse-quently the amount of soil mineral nitrogen (Nmin)remaining at harvest in autumn is small (Werhmann
* To whom correspondence should be addressed.Contract grant sponsor : MAFF, UK.
and Scharpf 1989 ; Shepherd 1993) even when the cropis over-fertilised (Last and Draycott 1975).
A large proportion, often more than 100 kg N ha~1,of the N taken up by the beet remains in the leaves atharvest (Widdowson 1974) and this N is returned to thesoil on 96% of the cropped area (Anon 1989). All but avery small proportion of the N is in organic form (Lastand Draycott 1975), but with a C : N ratio typically lessthan 20 (Powlson et al 1994) there is likely to be rapidnet release through mineralisation (Jenkinson 1984). Incontrast, cereal straw returns less N to the soil and ismore likely to cause net N immobilisation (Powlson etal 1985). If straw is baled and removed, N return fromstubble and roots will be small.
The amount of N released and its timing will inÑu-ence the proportion of N from tops susceptible to lossprocesses (leaching, denitriÐcation or volatilisation) oravailable for the following crop. Destain et al (1990),
3231997 SCI. J Sci Food Agric 0022-5142/97/$17.50. Printed in Great Britain(

324 R Sylvester-Bradley, M A Shepherd
using 15N-labelled sugar beet tops measured losses of67%, attributed to leaching and denitriÐcation and only5% recovery by a following wheat crop. Abshahi et al(1984) reported losses of 34%, and 27% recovery of the119 kg N ha~1 returned in tops. Wheat grown on plotswhere beet tops were returned required less N than onplots where tops were removed. Widdowson (1974)measured recoveries by spring barley of \6% of N inthe tops. Thomsen and Christensen (1996) found 9% ofbeet N in a following crop of barley.
There is therefore some uncertainty about the inÑu-ence of sugar beet, particularly sugar beet tops, on theN available to the succeeding crops. It is important toquantify this N supply and, particularly, its inÑuence onrequirements of subsequent crops for fertiliser N. Wereport here a series of experiments, established underUK Ðeld conditions most likely to minimise N leachinglosses (retentive soils and low over-winter rainfall), tocompare the e†ects of sugar beet with those of wheat onthe nitrogen responses of a succeeding wheat crop.
MATERIALS AND METHODS
In order to standardise the soil type and husbandryregime, paired experiments were established on com-mercial farms in East Anglia. On each farm, winter
wheat crops were selected after sugar beet at one siteand after wheat at the other. There were four such pairsin 1984È1985 and six pairs in 1985È1986 (Table 1). Withthe exception of site 8 (20 t ha~1 FYM applied to thebeet crop), no site had received organic manures in theprevious 3 years, at least.
The experimental areas were marked out afterploughing and drilling the wheat and consisted of threerandomised blocks of seven N topdressing rates (0, 60,120, 180, 240, 300 and 360 kg N ha~1). Nitrogen wasapplied by hand, as ammonium nitrate, with40 kg N ha~1 during tillering in February or Marchand the remainder in April at the start of stem exten-sion. Other crop management throughout the growingseason was undertaken by the co-operating farmersaccording to their own standards.
Measurements
Soil was measured to 90 cm in 30 cm incrementsNminusing stepwise Eijkelkamp augers, bulking 10 cores foreach depth. Samples were taken in October (one overallsite sample), from each block in late November, andfrom nil N plots in February/March and mid-April.Selected sites were also sampled after wheat harvest.Soil samples were taken to the laboratory on the same
TABLE 1Site details for both years of the experiment, 1984È1985 and 1985È1986
Site no L ocation, Previous W heat Drilling T opsoil/subsoil T opsoil Fate of strawCounty crop Cultivar date T exturea
OM% N%
Year 1È1984È19851 Wendy, W wheat Virtue 28.09.84 ZCL/CL 4É3 0É31 Burnt2 Herts Sugar beet Avalon 15.10.84 SL/SCL 3É1 0É20 È3 Whaddon, W wheat Rapier 17.10.84 ZCL/SCL 3É4 0É19 Burnt4 Cambs Sugar beet Armada 03.12.84 CL/SCL 2É6 0É20 È5 Gestingthorpe, W wheat Norman 13.10.84 SCL/SL 1É8 0É18 Ploughed in6 Essex Sugar beet Avalon 18.10.84 SCL/SL 1É8 0É15 È7 Morley, W wheat Longbow 01.10.84 SL/SCL 2É2 0É14 Baled8 Norfolk Sugar beet Galahad 12.11.84 SCL/SCL 1É8 0É10 È
Year 2È1985È19869 Wendy, W wheat Brock 05.10.85 ZCL/C 4É0 0É28 Burnt
10 Herts Sugar beet Fenman 25.11.85 CL/C 2É8 0É19 È11 Fornham, W wheat Galahad 22.10.85 SL/SL 1É6 NDb Baled12 Suffolk Sugar beet Brimstone 01.12.85 SL/CL 1É4 ND È13 Morley, W wheat Galahad 03.10.85 SL/SL 1É6 0É13 Baled14 Norfolk Sugar beet Galahad 11.12.85 SL/SL 1É9 0É13 È15 Gestingthorpe, W wheat Longbow 10.10.85 CL/C 1É8 0É13 Ploughed in16 Essex Sugar beet Longbow 12.10.85 CL/C 1É8 0É13 È17 Felsham, W wheat Galahad 25.09.85 SCL/SCL 2É4 0É16 Burnt18 Suffolk Sugar beet Longbow 07.10.85 SCL/C 2É2 0É15 È19 Barningham, W wheat Norman 08.10.85 SCL/C 1É7 0É13 Baled20 Suffolk Sugar beet Norman 11.11.85 SCL/C 1É7 0É12 È
a CL, clay loam; ZCL, silty clay loam; SCL, sandy clay loam; C, clay ; SL, sandy loam.b ND, not determined.
Nitrogen response after wheat and sugar beet 325
day and frozen for storage if they could not be pro-cessed within 48 h. Sub-samples (40 g) of fresh orthawed soil were extracted with 200 cm3 2 M KCl andthe extracts Ðltered and analysed colorimetrically for
and A further sub-sample was oven-NH4-N NO3-N.dried to determine soil moisture content.
Crop samples were taken to determine above-grounddry matter and nitrogen content in April, from two0É5 m2 quadrats on each nil N plot. The plant materialwas oven-dried, weighed, ground and the N contentdetermined by KjeldahlÏs method. Sites 1 and 2 werenot sampled for or crop N from February onwardsNminbecause they inadvertently received a small dose of Nfertiliser. Site 7 was not sampled in April for the samereason. All chemical analyses were as described in Anon(1986).
Plots were sufficiently large for an area of 40 m2 to beharvested by combine harvester, taking a swath throughthe plot centre. For each plot, the grain was weighedand a sub-sample taken for determination of moisturecontent (by moisture meter) and N concentration (byNIR). Prior to harvest, whole crop samples were takenfrom each plot to determine the partitioning of nitrogenbetween grain and straw plus cha† (the NitrogenHarvest Index).
Statistical analysis
Nitrogen response curves were Ðtted to grain yieldsusing the linear plus exponential function (George1984) :
Y \ a ] brN ] cN
where Y was the grain yield in t ha~1 at 85% DM, Nthe amount of N applied in kg ha~1 and a, b, c and rwere constants determined by maximum likelihoodsquares Ðt for each site.
The optimum nitrogen rate and corresponding(Nopt)grain yield were taken as the point on the Ðtted curve atwhich there was a 3É0 kg response in grain productionper kg N applied ; unbiased optima were obtained asdescribed by Sylvester-Bradley et al (1984).
A two straight line function was Ðtted to grain nitro-gen o†take (Bloom et al 1988) :
Y \ a ] bN(N\ t)
Y \ c] dN(N[ t)
The breakpoint (t) was determined by maximum likeli-hood and the intercepts (a and c) and the gradients (band d) of the two lines were calculated.
The paired t-test was used to test for di†erencesbetween sites after wheat and after sugar beet.
RESULTS AND DISCUSSION
Wheat was always drilled later after sugar beet thanafter wheat ; the di†erence varied from 1 to 8 weeks
between pairs of sites (Table 1). The soils within theexperiment series were dominated by clay loam tex-tures, whereas sugar beet in the UK is more usuallygrown on sandier soils. Most farmers did not compen-sate for possible adverse soil conditions due to late har-vesting of sugar beet and did not increase wheat seedrate ; plant populations in February were signiÐcantlysmaller (P\ 0É05) after beet than after wheat (Table 2).
Soil mineral N
Sugar beet was still present in many of the Ðelds whenthe sites were sampled in October, but the majority ofthe sites after wheat had been cultivated. Autumn soil
is a†ected by the balance between fertiliser appliedNminto the previous crop and crop uptake (Chaney 1990),and mineralisation of soil organic matter and crop resi-dues (Powlson 1994). There was signiÐcantly (P\ 0É05)less after sugar beet than after wheat (Table 2),Nminsupporting other reports of small amounts of autumn
after beet (Last and Draycott 1975 ; WerhmannNminand Sharpf 1989 ; Shepherd et al 1993). This must bebecause beet continues to grow and take up soil inNminthe autumn. The di†erential between wheat and beetmight have been further increased by additional min-eralisation in the wheat Ðelds, as a result of cultivation(Stokes et al 1992).
There was a net increase in at most sitesNminbetween October and November but the di†erencebetween wheat and sugar beet was maintained, signiÐ-cant at P\ 0É01 (Table 2). This conÐrms the conclusionof Prins et al (1988) that sugar beet can be considered alow risk crop for nitrate leaching, because it generallyleaves only small amounts of However, this willNmin .depend also on the pattern of mineralisation of N heldin the tops.
in February was similar after beet and wheatNmin(Table 2) but the size of the decrease between Novemberand February di†ered signiÐcantly (P\ 0É01) being 20and 3 kg N ha~1 after wheat and beet respectively, forthe nine pairs of sites where was measured. TheNminthree pairs of sites where plant N was also measuredindicated that some of the di†erence was probably dueto greater crop N uptake by the earlier drilled wheatwhere it followed wheat ; on average there was 23 and7 kg N ha~1 in the crop following wheat and beetrespectively. Earlier drilling is well noted for better earlygrowth and N uptake (eg Milford et al 1993).
Crop N uptake on nil N plots was measured at mostsites (excluding those which had received fertiliser N inerror) in April. There was no di†erence between Nminplus crop N (soil nitrogen supply ; SNS) following wheator beet but there was a signiÐcant e†ect (P\ 0É05) ofprevious crop on the change between October andApril ; an increase of 2 and 25 kg N ha~1 followingwheat and beet respectively, for the eight pairs of sites
326R
Sylvester-Bradley,M
AShepherd
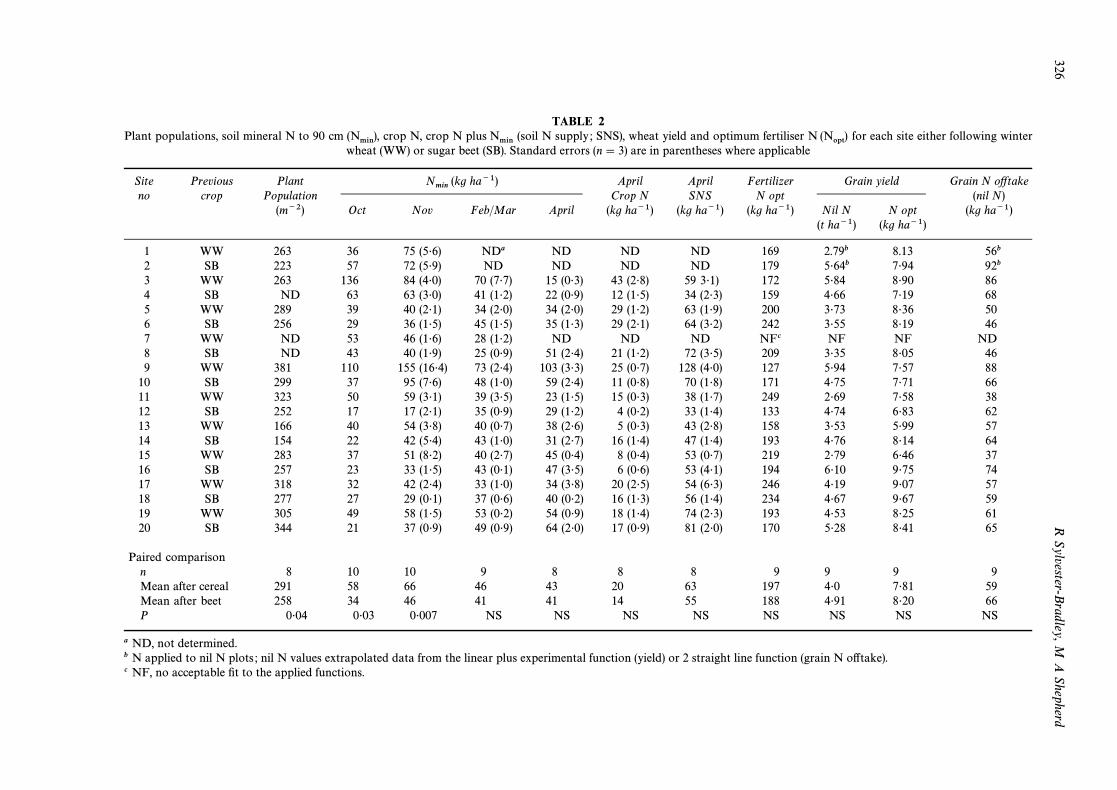
TABLE 2Plant populations, soil mineral N to 90 cm crop N, crop N plus (soil N supply ; SNS), wheat yield and optimum fertiliser N for each site either following winter(Nmin), Nmin (Nopt)
wheat (WW) or sugar beet (SB). Standard errors (n \ 3) are in parentheses where applicable
Site Previous Plant Nmin
(kg ha~1) April April Fertilizer Grain yield Grain N o†takeno crop Population Crop N SNS N opt (nil N)
(m~2) Oct Nov Feb/Mar April (kg ha~1) (kg ha~1) (kg ha~1) Nil N N opt (kg ha~1)(t ha~1) (kg ha~1)
1 WW 263 36 75 (5É6) NDa ND ND ND 169 2.79b 8.13 56b2 SB 223 57 72 (5É9) ND ND ND ND 179 5É64b 7É94 92b3 WW 263 136 84 (4É0) 70 (7É7) 15 (0É3) 43 (2É8) 59 3É1) 172 5É84 8É90 864 SB ND 63 63 (3É0) 41 (1É2) 22 (0É9) 12 (1É5) 34 (2É3) 159 4É66 7É19 685 WW 289 39 40 (2É1) 34 (2É0) 34 (2É0) 29 (1É2) 63 (1É9) 200 3É73 8É36 506 SB 256 29 36 (1É5) 45 (1É5) 35 (1É3) 29 (2É1) 64 (3É2) 242 3É55 8É19 467 WW ND 53 46 (1É6) 28 (1É2) ND ND ND NFc NF NF ND8 SB ND 43 40 (1É9) 25 (0É9) 51 (2É4) 21 (1É2) 72 (3É5) 209 3É35 8É05 469 WW 381 110 155 (16É4) 73 (2É4) 103 (3É3) 25 (0É7) 128 (4É0) 127 5É94 7É57 88
10 SB 299 37 95 (7É6) 48 (1É0) 59 (2É4) 11 (0É8) 70 (1É8) 171 4É75 7É71 6611 WW 323 50 59 (3É1) 39 (3É5) 23 (1É5) 15 (0É3) 38 (1É7) 249 2É69 7É58 3812 SB 252 17 17 (2É1) 35 (0É9) 29 (1É2) 4 (0É2) 33 (1É4) 133 4É74 6É83 6213 WW 166 40 54 (3É8) 40 (0É7) 38 (2É6) 5 (0É3) 43 (2É8) 158 3É53 5É99 5714 SB 154 22 42 (5É4) 43 (1É0) 31 (2É7) 16 (1É4) 47 (1É4) 193 4É76 8É14 6415 WW 283 37 51 (8É2) 40 (2É7) 45 (0É4) 8 (0É4) 53 (0É7) 219 2É79 6É46 3716 SB 257 23 33 (1É5) 43 (0É1) 47 (3É5) 6 (0É6) 53 (4É1) 194 6É10 9É75 7417 WW 318 32 42 (2É4) 33 (1É0) 34 (3É8) 20 (2É5) 54 (6É3) 246 4É19 9É07 5718 SB 277 27 29 (0É1) 37 (0É6) 40 (0É2) 16 (1É3) 56 (1É4) 234 4É67 9É67 5919 WW 305 49 58 (1É5) 53 (0É2) 54 (0É9) 18 (1É4) 74 (2É3) 193 4É53 8É25 6120 SB 344 21 37 (0É9) 49 (0É9) 64 (2É0) 17 (0É9) 81 (2É0) 170 5É28 8É41 65
Paired comparisonn 8 10 10 9 8 8 8 9 9 9 9Mean after cereal 291 58 66 46 43 20 63 197 4É0 7É81 59Mean after beet 258 34 46 41 41 14 55 188 4É91 8É20 66P 0É04 0É03 0É007 NS NS NS NS NS NS NS NS
a ND, not determined.b N applied to nil N plots ; nil N values extrapolated data from the linear plus experimental function (yield) or 2 straight line function (grain N o†take).c NF, no acceptable Ðt to the applied functions.

Nitrogen response after wheat and sugar beet 327
where measurements were made. This relationship alsoheld for the change between November and April ; therewas an increase in SNS at the majority of sites followingbeet and a decrease at the majority of sites followingwheat. The change in SNS is the net result of severalprocesses (N uptake, mineralisationÈimmobilisation,leaching, denitriÐcation and volatilisation) and it islikely that the relative e†ects of these processes willdi†er following the di†erent crops. However, it seemsthat much of the di†erence after wheat and beet can beattributed to mineralisation of the beet tops.
E†ects of previous crop on wheat fertiliser requirements
The linear plus exponential function Ðtted the yieldresponses at 19 of the 20 sites. Yield response was vari-able at site 7. The 2 straight line function also gavesatisfactory Ðts at 19 of the 20 sites for grain N o†take ;site 7 was again the exception. Figure 1 provides anexample of the yield responses and grain N o†takeswith the Ðtted functions. The breakpoint (t) is the nitro-gen fertiliser application at which the rate of grain Nuptake decreases. Across all sites (except site 7) therewas a signiÐcant association between this breakpointand the calculated Nopt (Fig 2).
The nitrogen harvest index (ie the ratio of N in grainto N in grain plus cha† and straw) was calculated fromthe whole crop samples for each N rate. The relation-ship was then used to calculate total N o†take by theabove ground crop based on grain N o†take measuredin the combine harvested grain samples. Averagedacross 19 sites, total N o†take and were the sameNopt(187 kg ha~1), and there was a weak but signiÐcantcorrelation (R2 adjusted \ 15%, P\ 0É05). Thus, at
Fig 1. An example (site 2) of the linear plus experimental func-tion Ðtted to grain yield and two straight line function(L)
Ðtted to grain N o†take (…).
Fig 2. The relationship between the wheat optimum nitrogenrate and the breakpoint in grain N o†take. They are weakly
correlated (R2 adjusted \ 29%, P\ 0É01).
N fertiliser application balanced N o†take by theNopt ,crop, on average.
Although both optimum yield and variedNoptbetween sites, there was no signiÐcant di†erence inmean following a cereal or beet crop (Table 2). SiteNopt7 (after wheat) and the corresponding site after beet (8)were omitted from this comparison because of the poorÐt of the linear plus experimental function at site 7.Widdowson (1974) also concluded that there was only asmall contribution of N from beet tops to a followingcereal. His conclusions were based on observations forbarley grown on the same site with and without beettops, hence eliminating the complication of diseasebreaks and other factors. Thomsen and Christensen(1996) calculated that 100 kg N ha~1 in beet topsincorporated before winter cereal could replace c 19 kgN ha~1 mineral fertiliser. We measured a di†erence of20 kg N ha~1 in soil mineral N in November with nosubsequent di†erence in With wheat, average yieldNopt .was 0É4 t ha less (though not signiÐcantly di†erent) fol-lowing wheat than following beet ; it appears that thelesser root disease observed after sugar beet generallycounteracted the e†ects on yield of the delayed drilling.
Sylvester-Bradley et al (1987) reported that wheatafter a break crop yielded more but N recovery was thesame ; it appeared that N was converted to yield moreefficiently following the break crop. No di†erence wasfound here in the apparent N fertiliser recovery in thegrain at (46 and 43% following wheat and beet,Noptrespectively) or in the amount of yield produced per kgN fertiliser applied (19É6 or 17É5 kg grain per kg appliedN, following wheat or beet).
There was no correlation between optimum yield andHowever, there was a strong relationship betweenNopt .
yield response (ie yield at at nil N) andNoptÈyield Nopt(Fig 3) as was found by Shepherd (1993). There was no

328 R Sylvester-Bradley, M A Shepherd
Fig 3. The relationship between yield response yield at(Y resp ,at nil N) and the optimum nitrogen rate. TheNopt-yield
regression line is highly signiÐcant(Yresp \ 0É025 Nopt-1É14)(R2 adjusted \ 62%, P\ 0É001).
relationship between and autumn or springNopt Nmin .However, only small amounts of were measuredNminover a relatively narrow range. Shepherd (1993)reported a strong linear relationship between andNmin
but the data included a wide range ofNopt Nmin .
Fate of N in sugar beet tops
There was no di†erence in nil N yield or nil N graino†take following wheat or sugar beet (Table 2). This,and the similar N optima after beet and wheat indicatethe soil N supply to be similar after both crops. The soilN supply comprises of autumn and subsequentlyNminmineralised N, as modiÐed by loss processes. Abshahi etal (1984) and Destain et al (1990) used 15N-labelledtops, which allowed the fate of the N to be better fol-lowed. Whilst they found that recoveries by the follow-ing wheat were low (27 and 5%, respectively), only c30% was found in the soil, suggesting that most of theN from the tops was mineralised and subsequently lost.
In contrast, Thomsen and Christensen (1996) found that65% of incorporated beet top N remained in the soilafter the following cereal was harvested.
Sugar beet leaves typically have a nitrogen concentra-tion of c 2É4% (Powlson et al 1994), equivalent to 24 kgN t~1 dry matter returned. Jenkinson (1984) calculatedthat leaves of this composition would mineralise c 66%of the N, which is in broad agreement with the 30%remaining in the soil measured by Abshahi et al (1984)and Destain et al (1990). Based on this general calcu-lation, in a typical return of 100 kg N ha~1, it would beexpected that c 66 kg N ha~1 will be mineralised andavailable for crop uptake or losses processes. However,on average, 8% of root yield remains in the Ðeld atharvest (Anon 1989). These are unharvested roots, rootcrowns and other root materials with a sugar concen-tration of approximately 16% (of fresh weight). Thisrepresents about 500È700 kg ha~1 of soluble carbo-hydrate, distributed unevenly throughout the soil andlikely to cause some localised N immobilisation or deni-triÐcation. However, much of this e†ect will depend onthe rate of degradation of the crown and root material.
Our study does not allow us to quantify the amountsof N mineralised from the beet tops, but there are indi-cations that this N was making a signiÐcant contribu-tion to the wheatÏs N supply, and that this wasmineralised in winter or early spring. Soil wasNminmeasured at harvest on three pairs of sites, allowing anestimate of net N mineralisation between spring andharvest (Table 3). These data are somewhat inconclu-sive. Only one of the pairs showed greater net N min-eralisation after beet than after wheat. Some of the netmineralisation estimates in Table 3 are surprisinglysmall compared with, for example, the average netincrease of 42 kg N ha~1 measured by Powlson et al(1994) in 31 experiments predominantly on light soils. Itmay be that on these heavier soils nitrogen is being lostby, in particular, denitriÐcation during the spring orsummer.
The three pairs of experiments show that there weregenerally only small amounts of remaining atNminharvest on nil N plots. The comparison was therefore
TABLE 3Estimates of net nitrogen mineralisation between spring and harvest at selected sites
W haddon 1985 Gestingthorpe 1985 Gestingthorpe 1986
3 4 5 6 15 16
Previous crop WW SB WW SB WW SBSpring SNSa (kg ha~1) 59 34 63 64 53 53Grain ] straw N at harvest (kg ha~1) 133 83 67 64 42 86Nminb at harvest (kg ha~1) 27 21 18 13 21 15Total (kg ha~1) 160 103 85 77 63 101Net N mineralisation (kg ha~1) 101 69 22 13 10 48
a SNS, Soil N supply, ie soil mineral N (0È90 cm) plus crop N, measured to 90 cm.b Nmin

Nitrogen response after wheat and sugar beet 329
extended to all sites where was measured in April,Nminby estimating net N mineralisation on nil N plots as :
net N mineralisation
\ (grain N o†take/N harvest index) [ April SNS.
Net summer mineralisation varied between the ninepairs of sites included in the comparison, and there wasno signiÐcant di†erence between crops following sugarbeet (20 kg N ha~1) and wheat (11 kg N ha~1). Itappears that the majority of net N mineralisationoccurred over-winter rather than in autumn or summer.Thus, although autumn was smaller after sugarNminbeet than after wheat, the additional N release overwinter brought to levels equivalent to those afterNminwheat by the spring. Given that most of the net mineral-isation following sugar beet was detected after the mainphase in which leaching would be expected, and thatonly moderate quantities of mineralised N weredetected, it is possible that a signiÐcant component ofthe N in sugar beet residues remained to be mineralisedafter the wheat harvest. However, the evidence is onlycircumstantial.
CONCLUSIONS
The series of paired experiments have shown that Nminin autumn is considerably smaller after sugar beet thanafter wheat despite the large amounts of N that arereturned in sugar beet tops. Therefore, land afterharvest of sugar beet only o†ers a small risk of nitrateleaching over winter. However, greater net mineral-isation over winter after beet than after wheat resultedin a similar soil N supply throughout growth of the suc-ceeding wheat crop. Yields of wheat unrestricted by Nwere not signiÐcantly di†erent in the two circumstancesand optimum amounts of fertiliser N were similar. It isconcluded that N fertiliser applications should be com-parable following sugar beet and following wheat. It ispossible that the sugar beet residues were incompletelymineralised during growth of the subsequent wheatcrop but more work would be required to determineany longer term e†ects of this nitrogen on the soilÏs Nsupply.
ACKNOWLEDGEMENTS
The authors thank Mr D P Kennedy and Mr A DRochford for co-ordinating the Ðeld work and acknow-ledge funding by the Ministry of Agriculture, Fisheriesand Food (MAFF).
REFERENCES
Abshahi A, Hills F J, Broadbent F E 1984 Nitrogen utilizationby wheat from residual sugar beet fertilizer and soil incorp-orated sugar beet tops. Agron J 76 954È958.
Anon 1986 T he Analysis of Agricultural Materials (MAFFReference Book 427). HMSO, London, UK.
Anon 1989 Sugar Beet. A GrowerÏs Guide (4th edn). Sugar BeetResearch and Education Committee, London, UK.
Anon 1993 Agriculture in the United Kingdom: 1992. HMSO,London, UK.
Bloom T M, Sylvester-Bradley R, Vaidyanathan L V, MurrayA W 1988 Apparent recovery of fertilizer nitrogen by winterwheat. In : Nitrogen Efficiency in Agricultural Soils and theEfficient Use of Fertilizer Nitrogen. CEC Seminar, Edin-burgh, UK.
Burnhill P, Fairgrieve J 1993 T he British Survey of FertiliserPractice. Edinburgh University, Edinburgh, UK.
Chaney K 1990 E†ect of nitrogen fertilizer rate on soil nitratenitrogen content after harvesting winter wheat. J Agric SciCamb 114 171È176.
Destain J P, Francois E, Guiot J 1990 Fertilizer nitrogenbudgets of 15N-labelled sugar beet. (Beta vulgaris) tops and
dressings split-applied to winter wheat (T riticumNa15NO3aestivum) in microplots on a loam soil. In : Plant NutritionÈPhysiology and Applications, ed van Beusichem M L.Kluwer, Amsterdam, pp 557È559.
George B J 1984 The design and interpretation of nitrogenresponse experiments. In : T he Nitrogen Requirements ofCereals (MAFF Reference Book 385). HMSO, London,UK, pp 133È148.
Jenkinson D S 1984 The supply of nitrogen from the soil. In :T he Nitrogen Requirements of Cereals (MAFF ReferenceBook 385). HMSO, London, UK, pp 79È92.
Last P J, Draycott A P 1975 Growth and yield of sugar beeton contrasting soils in relation to nitrogen supply. II.Growth, uptake and leaching of nitrogen. J Agric Sci Camb85 27È37.
Milford G F J, Penny A, Prew R D, Darby R J, Todd A D1993 E†ects of previous crop, sowing date, and winter andspring applications of nitrogen on the growth, nitrogenuptake and yield of winter wheat. J Agric Sci Camb 1211È12.
Powlson D S 1994 Water quality and fertiliser useÈunderstanding the nitrate problem. In : W ater Services andAgriculture : Key Issues and Strategic Options, eds MarshallB J & Miller F A. Centre for Agricultural Strategy,Reading, UK, pp 84È103.
Powlson D S, Jenkinson D S, Pruden G, Johnston A E 1985The e†ect of straw incorporation on the uptake of nitrogenby winter wheat. J Sci Food Agric 36 26È30.
Powlson D S, Stockdale E A, Jarvis S C, Shepherd M A 1994A Review of Nitrogen Mineralization and Immobilization inUK Agricultural Soils. MAFF, London, UK.
Prins W H, Dilz K, Neeteson J J 1988 Current recommen-dations for nitrogen fertilisation within the EEC in relationto nitrate leaching. Fert Soc Proc 276 .
Shepherd M A 1993 Measurement of soil mineral nitrogen topredict the response of winter wheat to fertilizer nitrogenafter applications of organic manures or after ploughed-outgrass. J Agric Sci Camb 121 223È231.
Shepherd M A, Davies D B, Johnson P A 1993 Minimisingnitrate leaching from arable soils. Soil Use Manage 9 94È99.
Stokes D T, Scott R K, Tilston C H, Cowie G, Sylvester-Bradley R 1992 The e†ect of time of soil disturbance onnitrate mineralisation. Asp Appl Biol 30 279È282.
Sylvester-Bradley R, Dampney P M R, Murray A W A 1984The response of winter wheat to nitrogen. In : T he Nitrogen

330 R Sylvester-Bradley, M A Shepherd
Requirement of Cereals (MAFF Reference Book 385).HMSO, London, UK, pp 151È174.
Sylvester-Bradley R, Addiscott T M, Vaidyanathan L V,Murray A W A, Whitmore A P 1987 Nitrogen advice forcereals ; present realities and future possibilities. Fert SocProc 263 .
Thomsen I K, Christensen B T 1996 Availability to sub-sequent crops and leaching of nitrogen in 15N-labelledsugarbeet tops and oilseed rape residues. J Agric Sci Camb126 191È199.
Werhmann J, Scharpf H C 1989 Prediction of nitrate leachingin a vegetable formÈfertilization, crop rotation and plantresidues. In : Management Systems to Reduce Impact ofNitrates, ed Germon J C. Elsevier, London, UK, pp 147È157.
Widdowson F V 1974 Results from experiments measuringthe residues of nitrogen fertilizer given for sugar beet, and ofploughed-in sugar beet tops, on the yield of followingbarley. J Agric Sci Camb 83 415È421.