effects of hot streak and phantom cooling … library/events/2014/utsr-workshop... · turbine stage...
TRANSCRIPT

EFFECTS OF HOT STREAK AND PHANTOM COOLING ON HEAT TRANSFER IN A COOLED TURBINE STAGE INCLUDING PARTICULATE
DEPOSITION
THE OHIO STATE UNIVERSITY Robin Prenter, Daniel Zagnoli, Steven Whitaker,
Ali Ameri, Jeffrey Bons
2014 UTSR Workshop – 21 Oct. 2014
1

MOTIVATION
2
• Future gas turbines operating with HHC fuels will have higher turbine inlet temperatures relative to natural gas operation.
• Increased temperatures require better materials and more efficient cooling schemes. Increased cooling is unacceptable, so coolant must be used smarter and more sparingly.
• Requires better prediction of combustor exit temperature distribution (pattern factor) and migration of high temperature core (hot streak) through high pressure turbine.
Prediction of hot streak migration in uncooled turbine stage using inviscid, unsteady simulation. (Shang & Epstein, JTurbo 1997)
Time averaged surface temperature on rotor suction (left) and pressure (right) surfaces.
Hot Streak enters center of vane passage
Pile-up on Rotor PS
Migration to rotor blade
root.
MOTIVATION
3
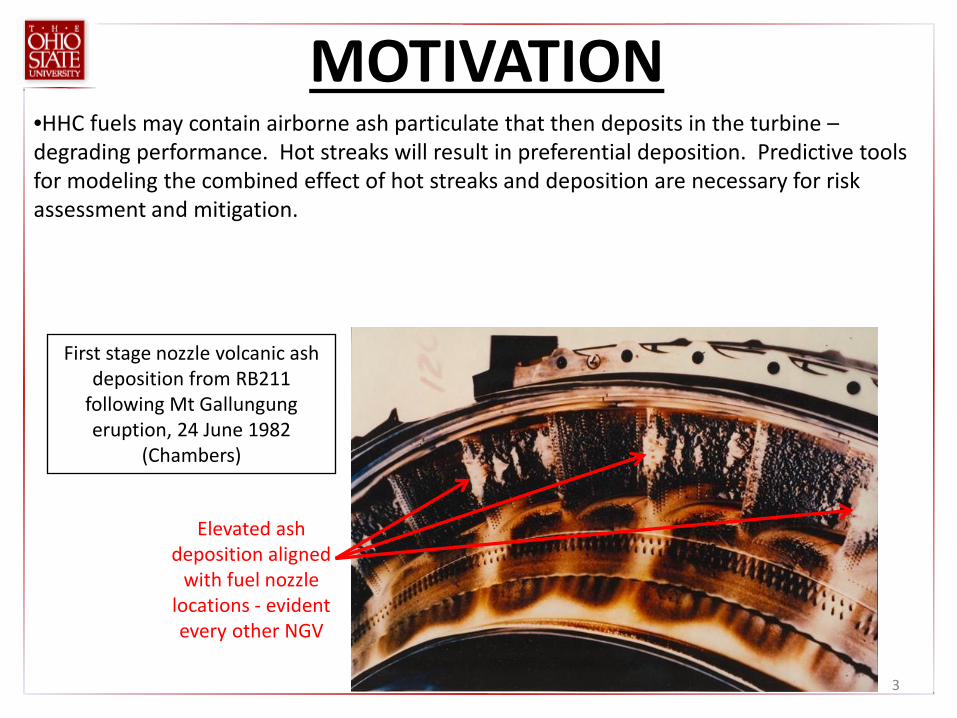
•HHC fuels may contain airborne ash particulate that then deposits in the turbine – degrading performance. Hot streaks will result in preferential deposition. Predictive tools for modeling the combined effect of hot streaks and deposition are necessary for risk assessment and mitigation.
First stage nozzle volcanic ash deposition from RB211
following Mt Gallungung eruption, 24 June 1982
(Chambers)
Elevated ash deposition aligned
with fuel nozzle locations - evident every other NGV

CRITICAL NEED
4
Additional research is NEEDED to…
• model hot streak migration in a modern, cooled first stage turbine
• model effect of hot streak on coolant flow (phantom cooling)
• model deposition in HHC, elevated temperature environment
• validate models with steady (stator) and unsteady (rotor) experimental data

OBJECTIVES
5
• The objective of this work is to develop a validated modeling capability to characterize the effect of hot streaks on the heat load of a modern gas turbine. • As a secondary objective the model will also be able to predict deposition locations and rates. This will be accomplished for a cooled turbine stage (stator and rotor) AND will be validated with experimental data from facilities at OSU. The effort includes both experimental and computational components, with work divided into three phases of increasing complexity: 1) Uncooled Vane 2) Cooled Vane 3) Cooled Vane + Rotor

RESEARCH TEAM
6
Dr. Jeffrey Bons Professor Department of Mechanical and Aerospace Engineering Ohio State University Columbus, OH
Dr. Ali Ameri Research Scientist Department of Mechanical and Aerospace Engineering Ohio State University Columbus, OH
TEAM LEAD Focus: Experimental Heat Transfer and Deposition Measurements in OSU Hot Cascade Facility
Co-PI Focus: Deposition Model Development and Heat Transfer CFD
External Deposition on a Cooled Nozzle Guide Vane with Non-Uniform Inlet
Temperatures

• Turbine Reacting Flow Rig – TuRFR
• Simulates hot section of gas turbine
• Natural gas combustor • Max temperature ~ 1365 K • Inlet Mach ~ 0.1
• Ash injected in combustion
chamber • Vane housing enables integration
of actual engine hardware
• Film cooling and hot streak capabilities
Experimental Facility - TuRFR
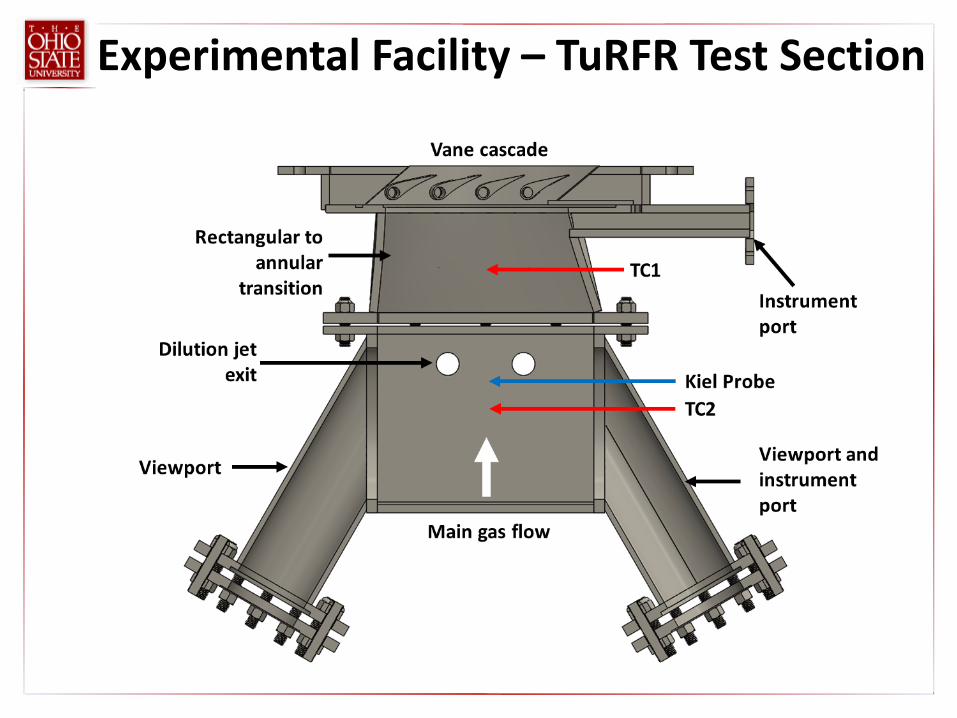
Main gas flow
Video and IR viewport
Optical viewport and
instrument port
Rectangular to annular
transition
Vane Cascade
Thermocouple
Thermocouple
Kiel Probe
Experimental Facility – TuRFR Test Section

Experimental Test Piece • Simple geometry
• Rolls Royce 2D research profile • Extruded profile with flat endwalls • Four vanes, one cooled
• A single span-wise slot used as cooling scheme
• Easy to model • Fundamental effects • Ease of manufacturing
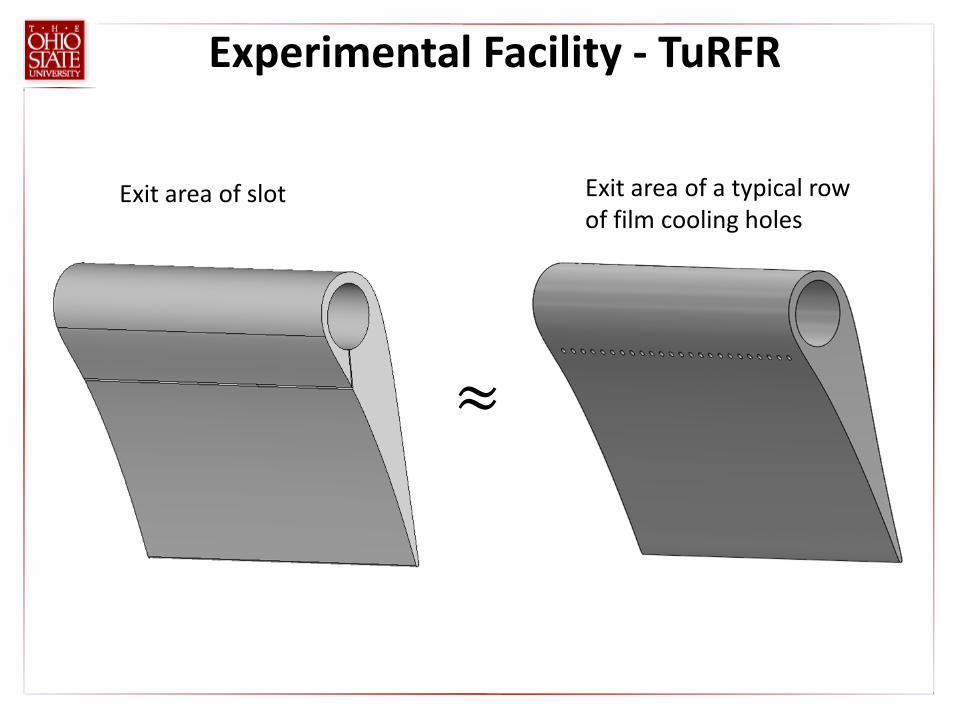
Experimental Facility - TuRFR
≈
Exit area of a typical row of film cooling holes
Exit area of slot
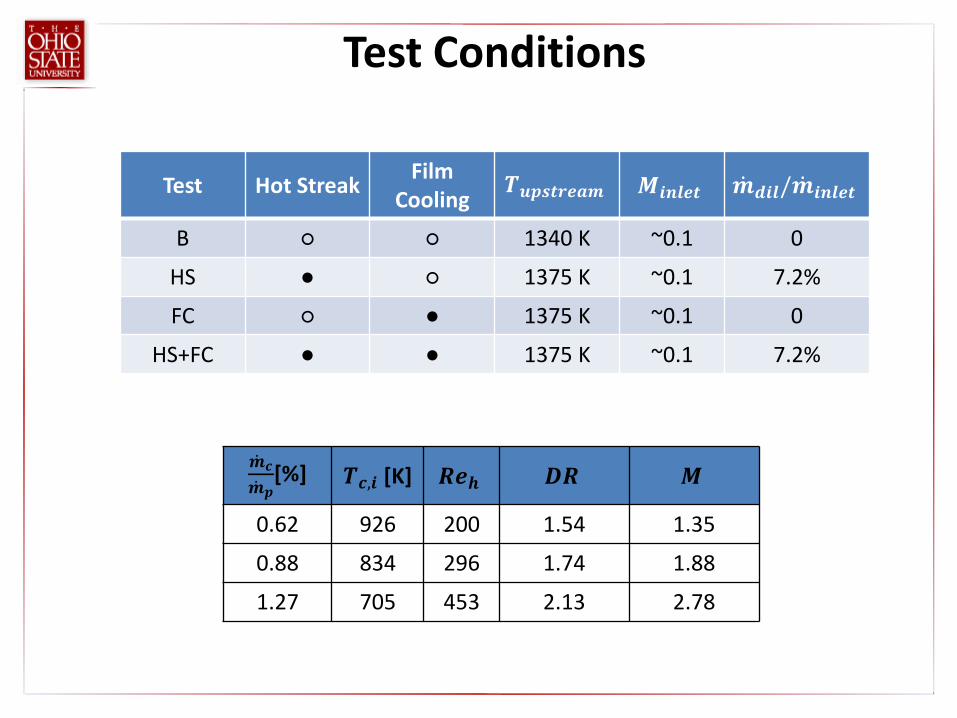
Test Conditions
Test Hot Streak Film Cooling
𝑻𝑻𝒖𝒖𝒖𝒖𝒖𝒖𝒖𝒖𝒖𝒖𝒖𝒖𝒖𝒖𝒖𝒖 𝑴𝑴𝒊𝒊𝒊𝒊𝒊𝒊𝒖𝒖𝒖𝒖 �̇�𝒖𝒅𝒅𝒊𝒊𝒊𝒊/�̇�𝒖𝒊𝒊𝒊𝒊𝒊𝒊𝒖𝒖𝒖𝒖
B ○ ○ 1340 K ~0.1 0
HS ● ○ 1375 K ~0.1 7.2%
FC ○ ● 1375 K ~0.1 0
HS+FC ● ● 1375 K ~0.1 7.2%
�̇�𝒖𝒄𝒄�̇�𝒖𝒖𝒖
[%] 𝑻𝑻𝒄𝒄,𝒊𝒊 [K] 𝑹𝑹𝒖𝒖𝒉𝒉 𝑫𝑫𝑹𝑹 𝑴𝑴
0.62 926 200 1.54 1.35
0.88 834 296 1.74 1.88
1.27 705 453 2.13 2.78

Film Cooling-Only Tests

Film Cooled-Only Tests
0 1 2 3 4 5
x 10-3
0.5
1
1.5
2
2.5
3
3.5
Φ
Cap
ture
Effi
cien
y η
[%]
Vane 2Vane 3
0 1 2 3 4 5
x 10-3
0.5
1
1.5
2
2.5
3
3.5
Φ
Cap
ture
Effi
cien
y R
atio
ηV
2/ ηV
3
Capture Efficiencies Capture Efficiency Ratios
• Capture efficiency for uncooled vane relatively consistent (~3%)
• Capture efficiency for cooled vane reduced with higher cooling levels
• Almost 70% reduction at the highest cooling level.
𝜂𝜂𝑣𝑣,𝑖𝑖 = 𝑁𝑁𝑚𝑚𝑣𝑣,𝑖𝑖𝑚𝑚𝑡𝑡
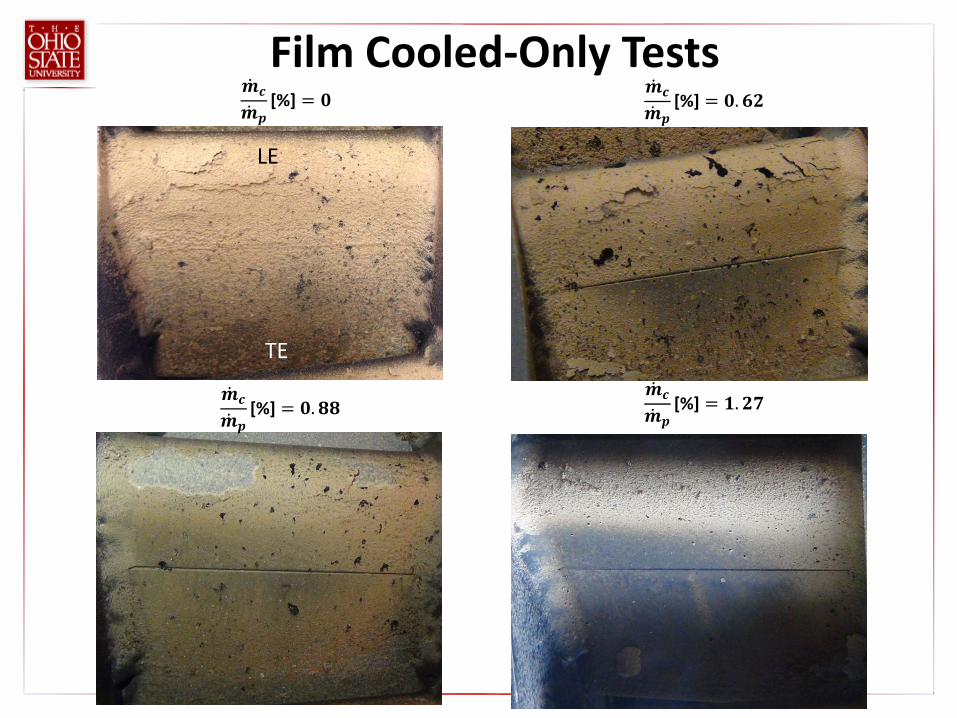
LE
TE
�̇�𝒖𝒄𝒄
�̇�𝒖𝒖𝒖[%] = 𝟎𝟎.𝟔𝟔𝟔𝟔
�̇�𝒖𝒄𝒄
�̇�𝒖𝒖𝒖[%] = 𝟎𝟎
�̇�𝒖𝒄𝒄
�̇�𝒖𝒖𝒖[%] = 𝟎𝟎.𝟖𝟖𝟖𝟖
�̇�𝒖𝒄𝒄
�̇�𝒖𝒖𝒖[%] = 𝟏𝟏.𝟔𝟔𝟐𝟐
Film Cooled-Only Tests
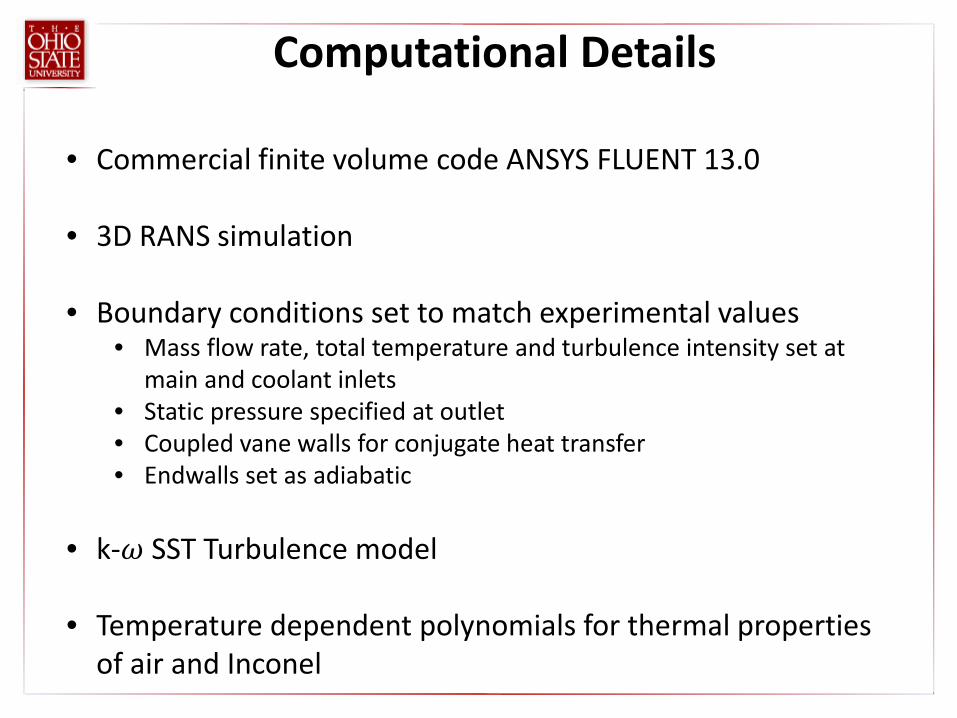
Computational Details
• Commercial finite volume code ANSYS FLUENT 13.0
• 3D RANS simulation
• Boundary conditions set to match experimental values • Mass flow rate, total temperature and turbulence intensity set at
main and coolant inlets • Static pressure specified at outlet • Coupled vane walls for conjugate heat transfer • Endwalls set as adiabatic
• k-𝜔𝜔 SST Turbulence model
• Temperature dependent polynomials for thermal properties
of air and Inconel

Computational Results
Experiment CFD
LE
TE
LE
TE
𝜃𝜃 𝜃𝜃
Slot
Stag. line
Slot
𝜃𝜃 =𝑇𝑇𝑠𝑠,𝑏𝑏 − 𝑇𝑇𝑠𝑠,𝑐𝑐
𝑇𝑇𝑠𝑠,𝑏𝑏 − 𝑇𝑇𝑐𝑐,𝑖𝑖

• High cooling effectiveness upstream of the slot
• High L/h ratio
• Qualitatively similar to experimental
• High effectiveness upstream of slot
• Effectiveness decreases towards TE
• CFD over predicts cooling
effectiveness • Especially in region
upstream of slot
0 20 40 60 80 1000
0.05
0.1
0.15
0.2
0.25
0.3
0.35
0.4
0.45
Wetted Distance [%]
θ
CFD Φ = 0.00139CFD Φ = 0.00245CFD Φ = 0.00443IR Φ = 0.00139IR Φ = 0.00245IR Φ = 0.00443
Conjugate Heat Transfer Results

Hot Streaks and Film Cooling

Hot Streaks and Film Cooling

Hot Streaks and Film Cooling –Inlet Characterization

Baseline Hot Streak Difference = THS - TB
Hot Streaks and Film Cooling –Inlet Characterization
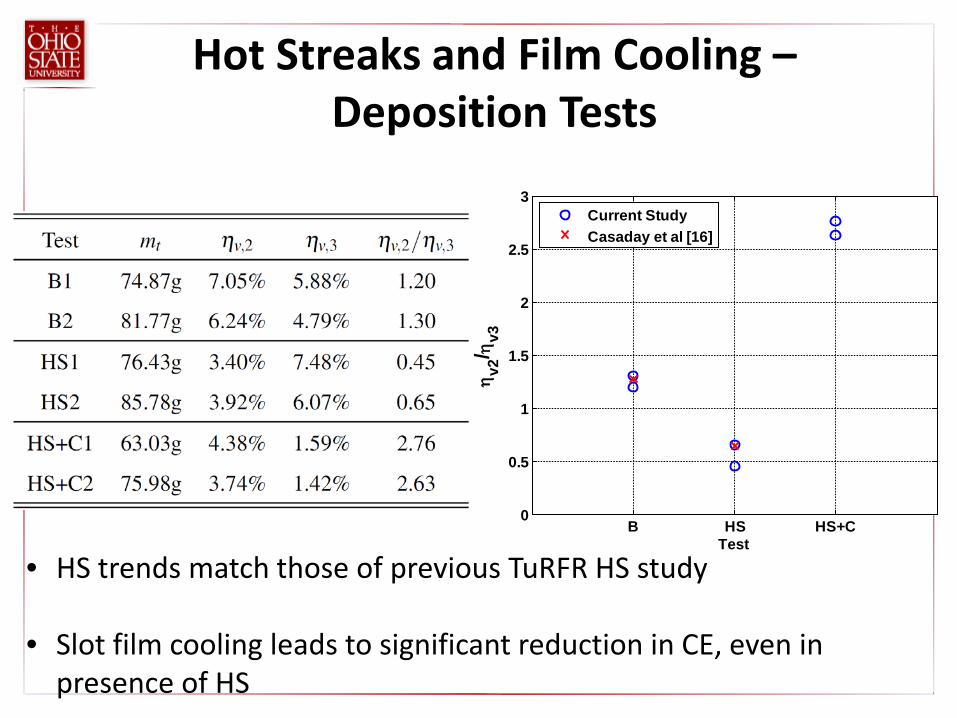
B HS HS+C0
0.5
1
1.5
2
2.5
3
Test
ηv2
/ ηv3
Current StudyCasaday et al [16]
Hot Streaks and Film Cooling – Deposition Tests
• HS trends match those of previous TuRFR HS study
• Slot film cooling leads to significant reduction in CE, even in presence of HS

Hot Streaks and Film Cooling – Deposition Tests

Hot Streaks and Film Cooling - Computational
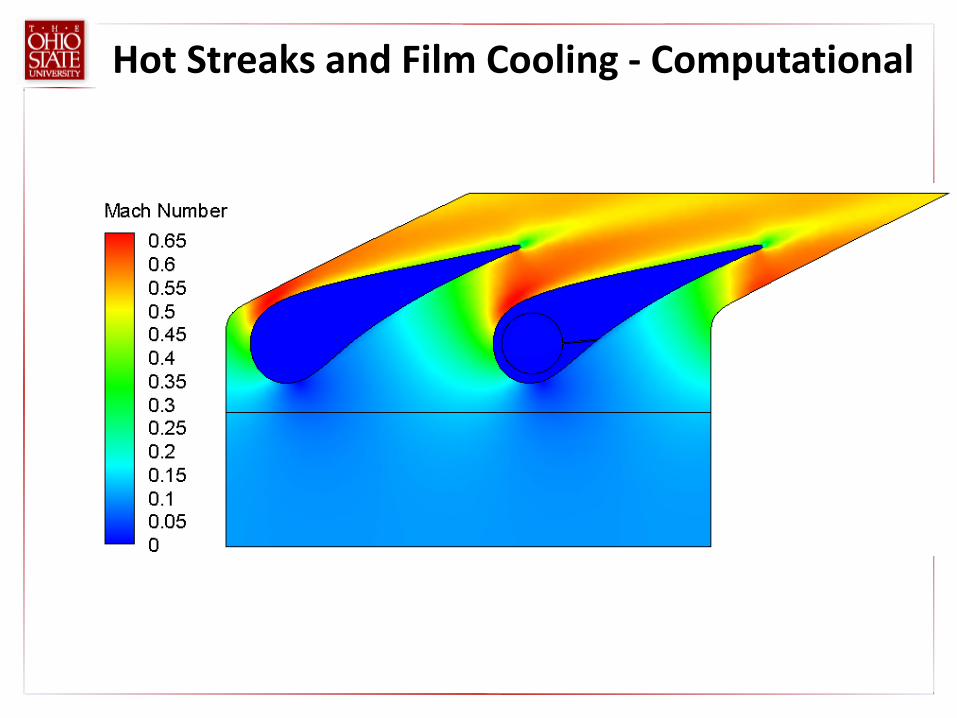
Hot Streaks and Film Cooling - Computational

Baseline Hot Streak
Hot Streak and Film Cooling
Hot Streaks and Film Cooling - Computational
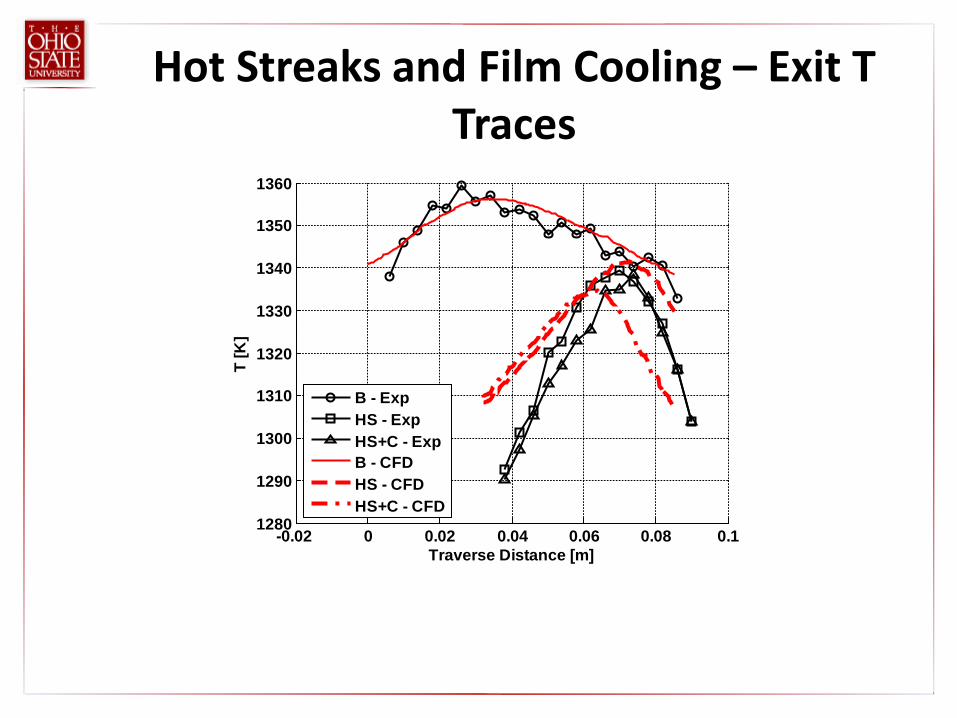
-0.02 0 0.02 0.04 0.06 0.08 0.11280
1290
1300
1310
1320
1330
1340
1350
1360
Traverse Distance [m]
T [K
]
B - ExpHS - ExpHS+C - ExpB - CFDHS - CFDHS+C - CFD
Hot Streaks and Film Cooling – Exit T Traces
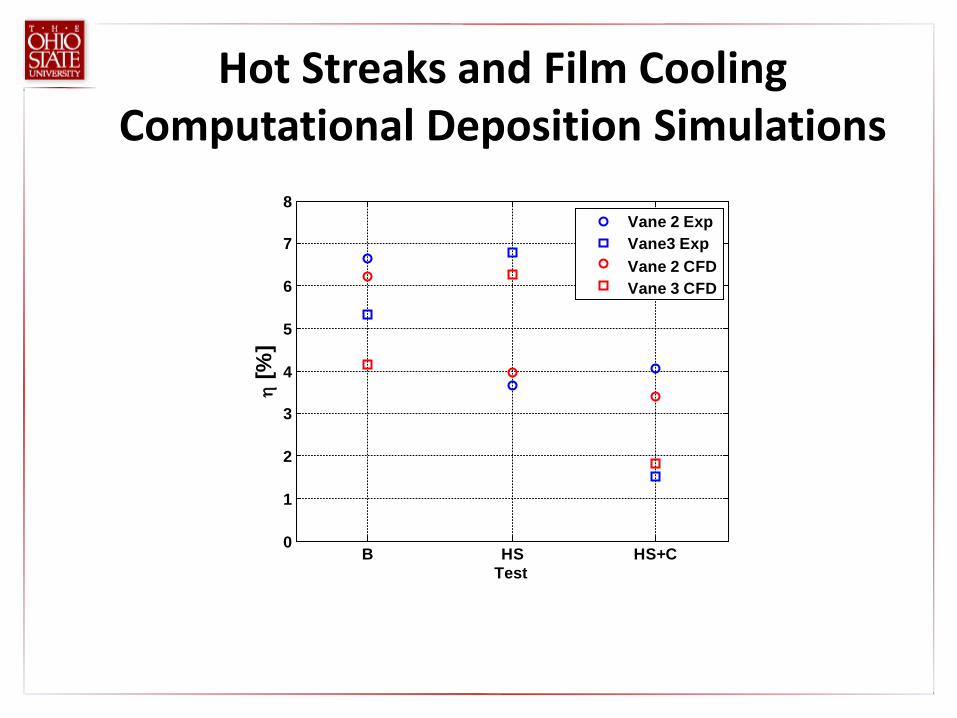
B HS HS+C0
1
2
3
4
5
6
7
8
Test
η [%
]
Vane 2 ExpVane3 ExpVane 2 CFDVane 3 CFD
Hot Streaks and Film Cooling Computational Deposition Simulations
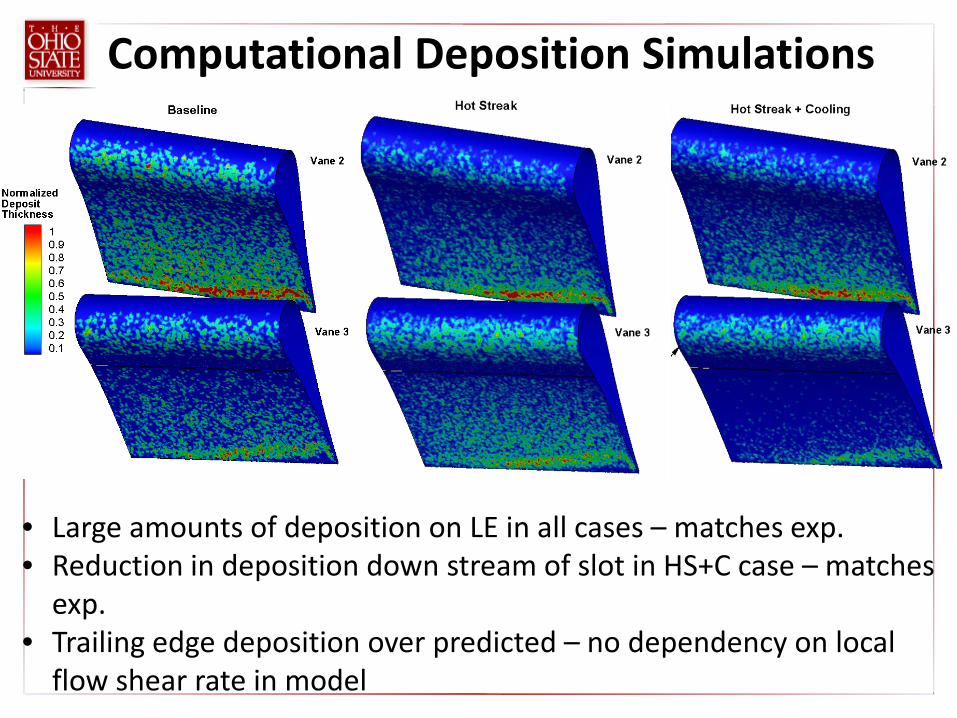
Computational Deposition Simulations
• Large amounts of deposition on LE in all cases – matches exp. • Reduction in deposition down stream of slot in HS+C case – matches
exp. • Trailing edge deposition over predicted – no dependency on local
flow shear rate in model

Hot Streaks and Film Cooling - Computational
Bare Vane
• Particle cools in thermal BL Temperature reduced by 70K for
this case
• Reduction in sticking probability
• Does not rule out surface temperature effects (if any)

Fundamental Deposition Modeling

Fundamental Deposition Modeling Roadmap and Progress
• There are many impact models that include elastic and plastic deformation, as well as effects from adhesion.
• These models require knowledge of ash properties: Mechanical properties (Young’s Modulus, yield strength, Poison’s
ratio) Surface energy adhesion parameter Almost every impact model uses these properties.
• Often models neglect the effects of local flow shear rate. • Need to determine:
Are impact models valid for ashes (which are non-homogenous materials)? o Need mechanical properties
Surface energy parameter, important effect? Effect of local flow shear rate?
Not well known for fly ash.

Evaluation of Elastic-Plastic Rebound Properties of Coal Fly Ash
• CoR measured using Particle Shadow Velocimetry (PSV) • LED, High speed camera
• Three ash types tested • Bituminous, Lignite, JBPS
• Polymer tested • PMMA

Evaluation of Elastic-Plastic Rebound Properties of Coal Fly Ash Bituminous
20 40 60 80 100 1200
0.2
0.4
0.6
0.8
1
Normal Impact Velocity [m/s]
Nor
mal
CoR
295 K395 K
Lignite
20 40 60 80 100 1200
0.2
0.4
0.6
0.8
1
Normal Impact Velocity [m/s]
Nor
mal
CoR
295 K395 K
JBPS
20 40 60 80 100 1200
0.2
0.4
0.6
0.8
1
Normal Impact Velocity [m/s]
Nor
mal
CoR
295 K395 K
PMMA
20 40 60 80 100 1200
0.2
0.4
0.6
0.8
1
Normal Impact Velocity [m/s]
Nor
mal
CoR

Evaluation of Elastic-Plastic Rebound Properties of Coal Fly Ash
• Several impact models evaluated so far Bitter (Hertzian Impact Model) Weir and McGavin (Plastic – JKR Impact Model) Wu et al. (FE Model)
• Mechanical properties unknown Law of mixtures
• Comparison of CoR results to impact models Hertzian Impact Model – over predict Vy Plastic – JKR Impact Model – over predict Vy FE Model – good estimation of Vy for PMMA
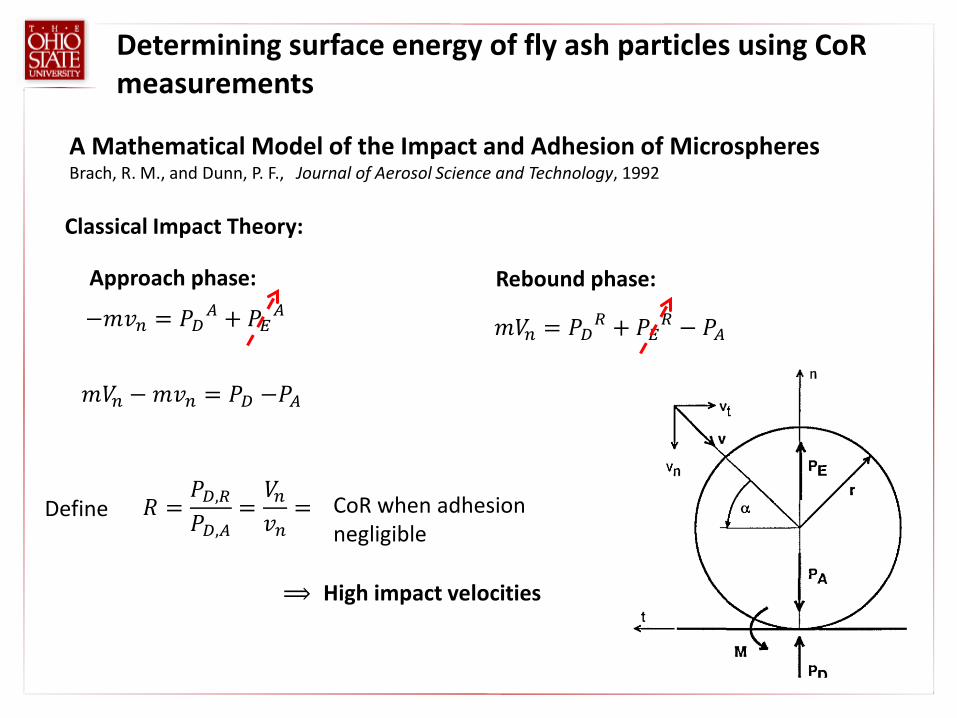
A Mathematical Model of the Impact and Adhesion of Microspheres Brach, R. M., and Dunn, P. F., Journal of Aerosol Science and Technology, 1992
−𝑚𝑚𝑣𝑣𝑛𝑛 = 𝑃𝑃𝐷𝐷𝐴𝐴 + 𝑃𝑃𝐸𝐸𝐴𝐴 𝑚𝑚𝑉𝑉𝑛𝑛 = 𝑃𝑃𝐷𝐷𝑅𝑅 + 𝑃𝑃𝐸𝐸𝑅𝑅 − 𝑃𝑃𝐴𝐴
Approach phase: Rebound phase:
𝑅𝑅 =𝑃𝑃𝐷𝐷,𝑅𝑅𝑃𝑃𝐷𝐷,𝐴𝐴
=𝑉𝑉𝑛𝑛𝑣𝑣𝑛𝑛
=
𝑚𝑚𝑉𝑉𝑛𝑛 −𝑚𝑚𝑣𝑣𝑛𝑛 = 𝑃𝑃𝐷𝐷 −𝑃𝑃𝐴𝐴
Define CoR when adhesion negligible
⟹ High impact velocities
Classical Impact Theory:
Determining surface energy of fly ash particles using CoR measurements

Work done by an impulse:
𝑊𝑊 = 𝑃𝑃 𝑣𝑣𝑛𝑛 + 𝑉𝑉𝑛𝑛 /2 ⟹ 𝑊𝑊𝐴𝐴
Kinetic energy loss from an impact:
𝑇𝑇𝐿𝐿 =12𝑚𝑚 𝑉𝑉𝑛𝑛2 − 𝑣𝑣𝑛𝑛2 = −𝑊𝑊𝐴𝐴 +
12𝑚𝑚𝑣𝑣𝑛𝑛
2 1 − 𝑅𝑅2
𝑊𝑊𝐴𝐴 =12𝑚𝑚𝑣𝑣𝑛𝑛
2 𝑉𝑉𝑛𝑛2
𝑣𝑣𝑛𝑛2− 𝑅𝑅2
Determining surface energy of fly ash particles using CoR measurements
20 30 40 50 60 70 80 90 1000.55
0.6
0.65
0.7
0.75
0.8
0.85
0.9
0.95
Normal impact velocity vn [m/s]
Nor
mal
CoR
Vn/v
n
R FitCoR Curve FitData
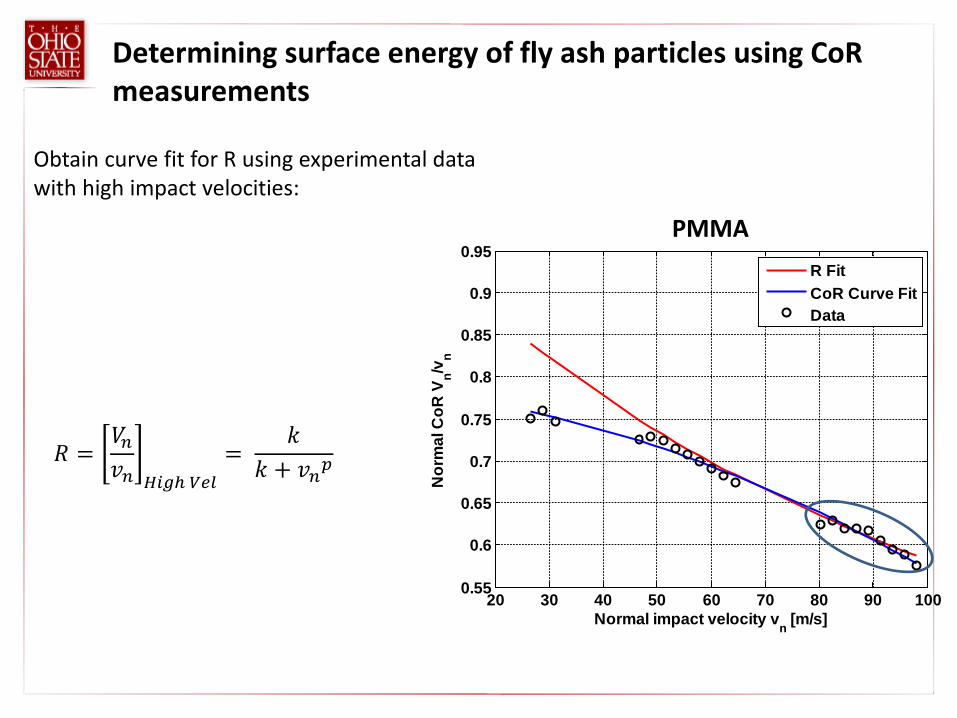
𝑅𝑅 =𝑉𝑉𝑛𝑛𝑣𝑣𝑛𝑛 𝐻𝐻𝑖𝑖𝐻𝐻𝐻 𝑉𝑉𝑉𝑉𝑉𝑉
= 𝑘𝑘
𝑘𝑘 + 𝑣𝑣𝑛𝑛𝑝𝑝
Obtain curve fit for R using experimental data with high impact velocities:
PMMA
Determining surface energy of fly ash particles using CoR measurements

𝑊𝑊𝐴𝐴 = −54𝜌𝜌𝜋𝜋
9/2 𝑘𝑘1 + 𝑘𝑘22/5
𝛾𝛾𝑟𝑟2𝑣𝑣𝑛𝑛4/5
Hertzian Theory:
𝐹𝐹𝐴𝐴 = 2𝜋𝜋𝜋𝜋𝑓𝑓0
Idealized line force to represent adhesion force:
𝑊𝑊𝐴𝐴 =−2𝜋𝜋𝑚𝑚2𝐹𝐹𝐴𝐴
3𝑟𝑟 𝜋𝜋𝑚𝑚 =15𝜋𝜋
8 𝑘𝑘1 + 𝑘𝑘2 𝑟𝑟212𝑚𝑚𝑣𝑣𝑛𝑛
21/5
𝛾𝛾 =2𝐹𝐹𝐴𝐴3𝜋𝜋𝑟𝑟
Work of adhesion force set to JKR surface adhesion energy, then surface energy adhesion parameter becomes:
⟹
Determining surface energy of fly ash particles using CoR measurements
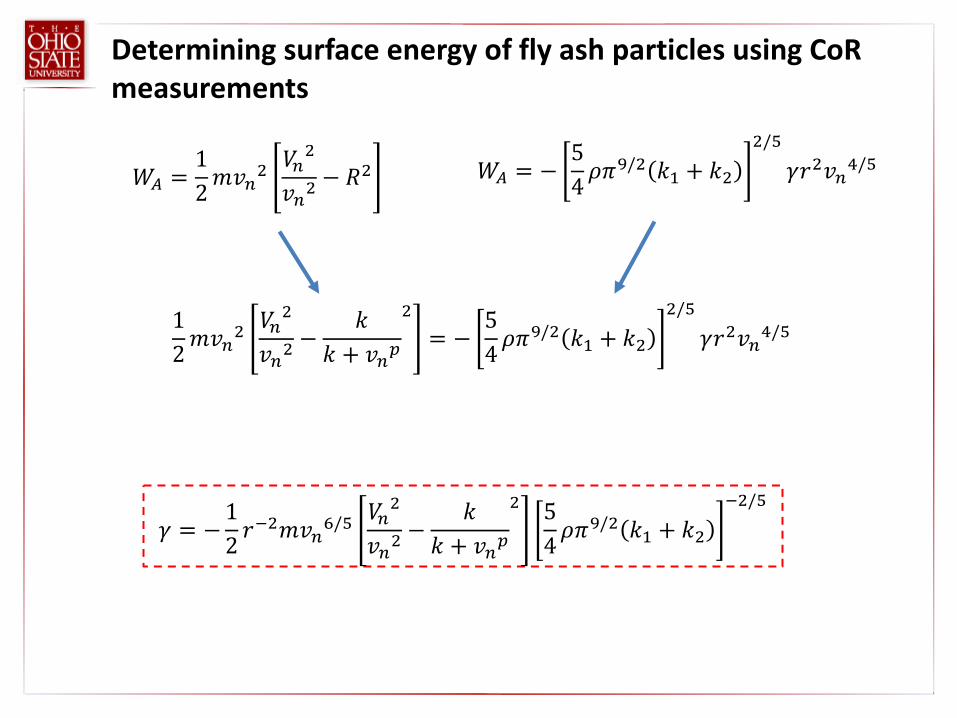
12𝑚𝑚𝑣𝑣𝑛𝑛
2 𝑉𝑉𝑛𝑛2
𝑣𝑣𝑛𝑛2−
𝑘𝑘𝑘𝑘 + 𝑣𝑣𝑛𝑛𝑝𝑝
2
= −54𝜌𝜌𝜋𝜋
9/2 𝑘𝑘1 + 𝑘𝑘22/5
𝛾𝛾𝑟𝑟2𝑣𝑣𝑛𝑛4/5
𝛾𝛾 = −12 𝑟𝑟
−2𝑚𝑚𝑣𝑣𝑛𝑛6/5 𝑉𝑉𝑛𝑛2
𝑣𝑣𝑛𝑛2−
𝑘𝑘𝑘𝑘 + 𝑣𝑣𝑛𝑛𝑝𝑝
2 54𝜌𝜌𝜋𝜋
9/2 𝑘𝑘1 + 𝑘𝑘2−2/5
𝑊𝑊𝐴𝐴 =12𝑚𝑚𝑣𝑣𝑛𝑛2
𝑉𝑉𝑛𝑛2
𝑣𝑣𝑛𝑛2− 𝑅𝑅2 𝑊𝑊𝐴𝐴 = −
54𝜌𝜌𝜋𝜋
9/2 𝑘𝑘1 + 𝑘𝑘22/5
𝛾𝛾𝑟𝑟2𝑣𝑣𝑛𝑛4/5
Determining surface energy of fly ash particles using CoR measurements

Fundamental Deposition Modeling – Moving Forward
• ORNL to conduct high temperature tests to determine mechanical properties
• Obtain adhesion parameter by curve fitting CoR data together with impact model
• Currently developing an experiment to investigate role of local flow shear rate

FULL TURBINE STAGE SIMULATIONS
43

44
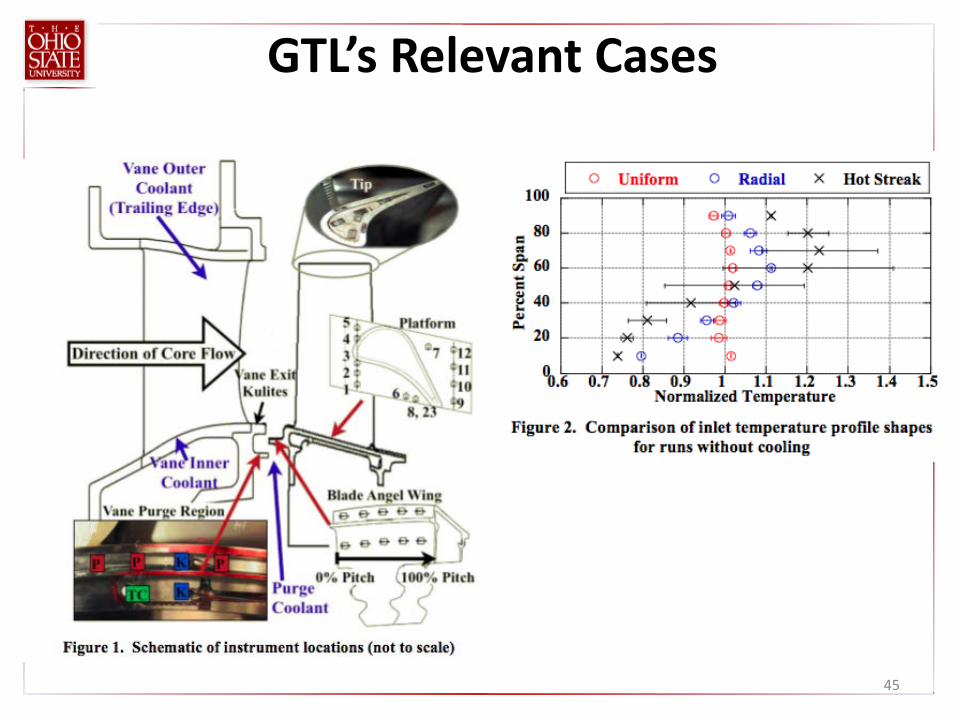
• Experiments on single stage HP turbines were conducted at OSU GTL under URETI program.
• Both uncooled vane and cooled vane were used. • Inlet Temperature Distributions:
• Uniform Distribution • Radial Distribution • Hot Streak targeted at mid-pitch or vane leading
edge • Hot Streak intensity varied • Cooling rate varied • Qwall measured
URETI /GTL’s Stage
45
GTL’s Relevant Cases
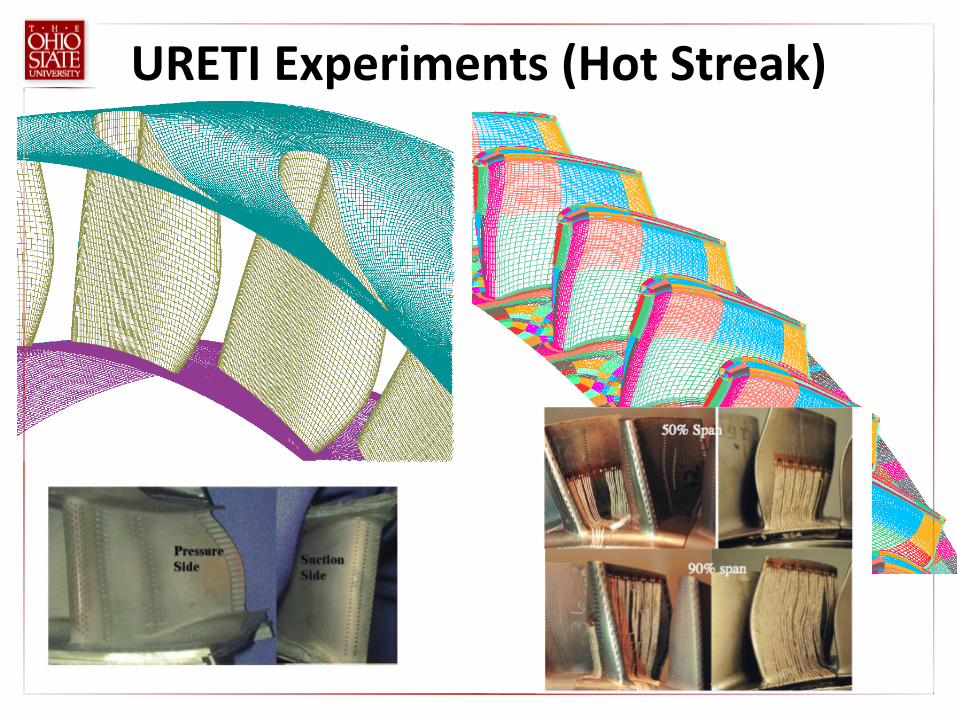
URETI Experiments (Hot Streak)

47
Steady Mesh

48
Unsteady Mesh
49
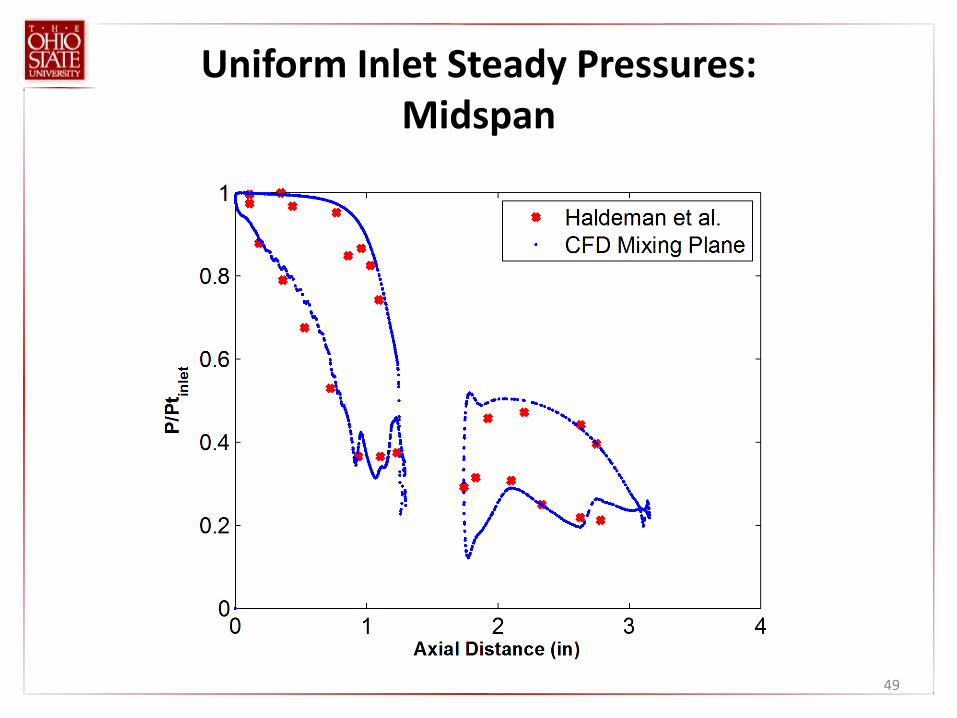
Uniform Inlet Steady Pressures: Midspan

50
Uniform Inlet Unsteady Pressures: -27% WD Pressure Surface
51
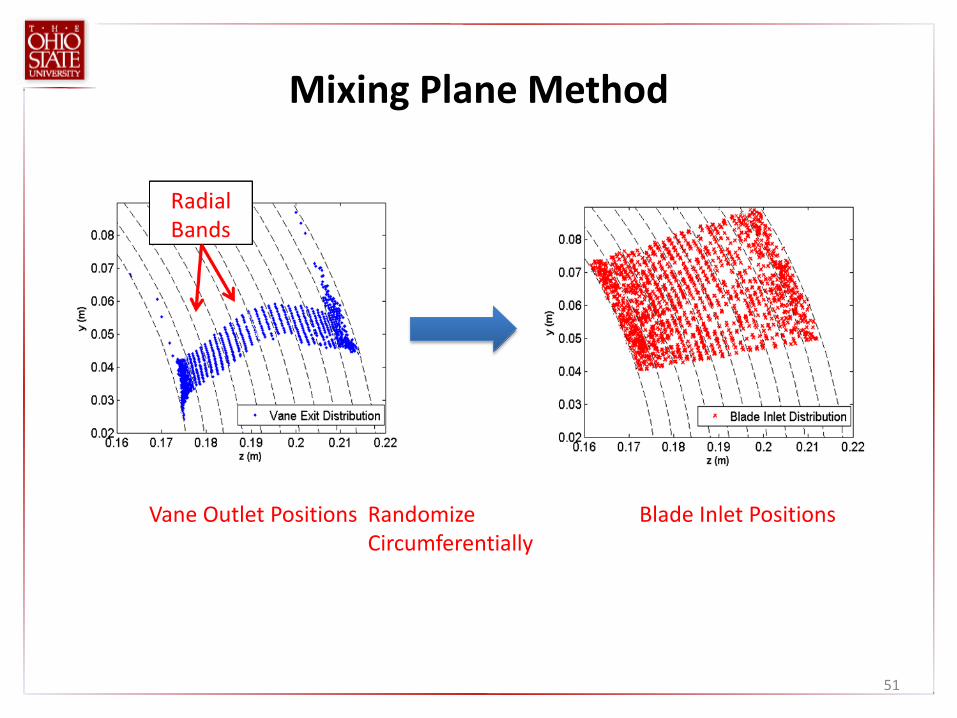
Mixing Plane Method
Randomize Circumferentially
Vane Outlet Positions Blade Inlet Positions

52
Averaged vs. Preserved Method
53
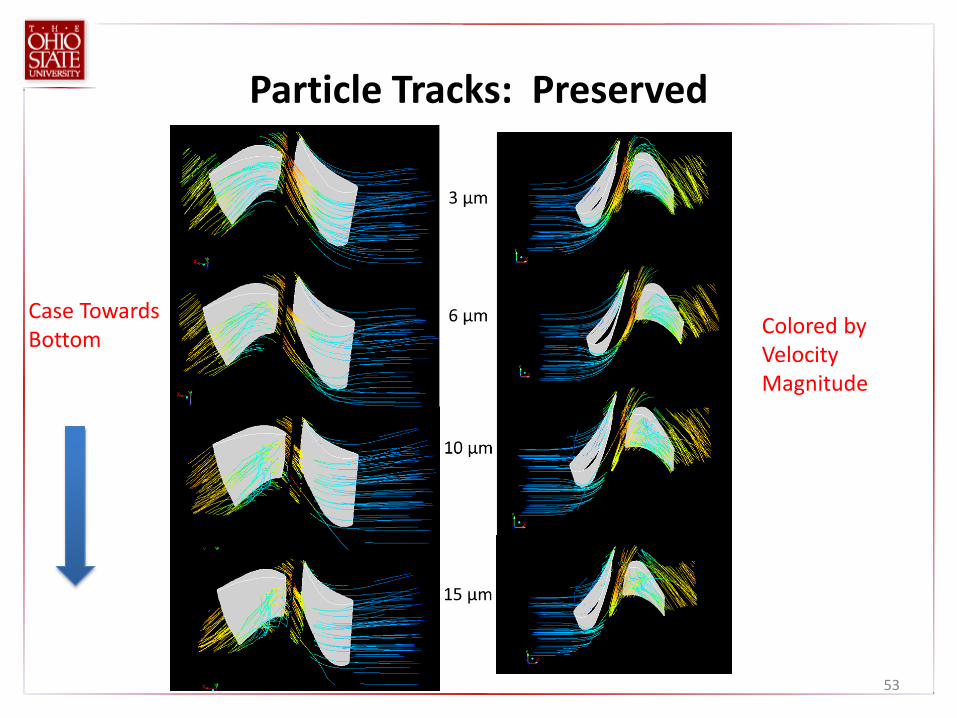
Particle Tracks: Preserved
Colored by Velocity Magnitude
Case Towards Bottom

54
Impact and Deposit Distributions
55
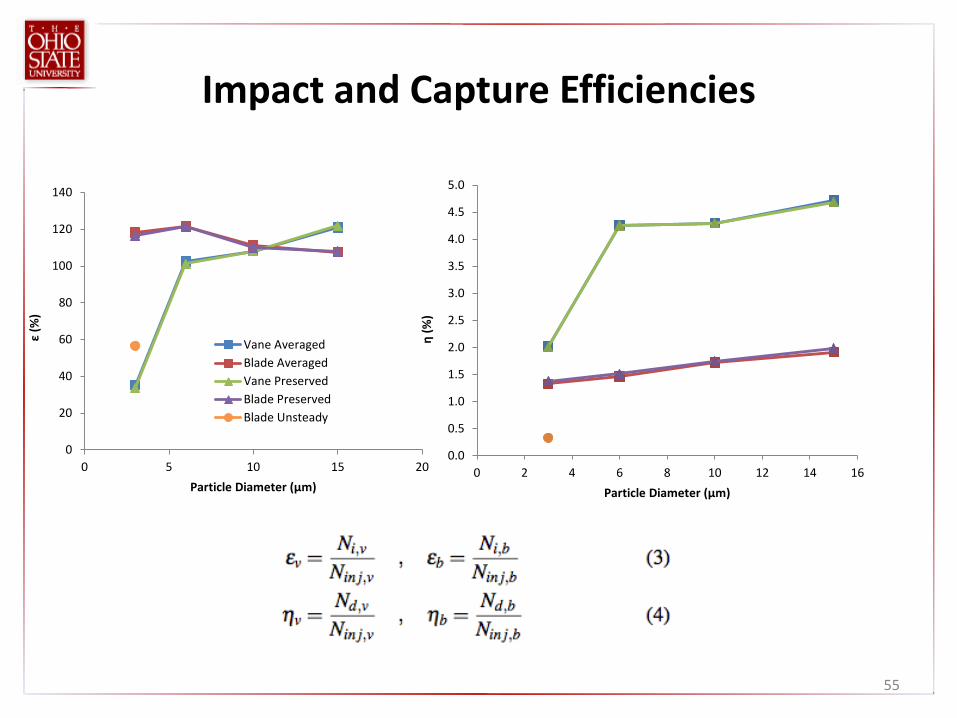
Impact and Capture Efficiencies
0
20
40
60
80
100
120
140
0 5 10 15 20
ε (%
)
Particle Diameter (μm)
Vane AveragedBlade AveragedVane PreservedBlade PreservedBlade Unsteady
0.0
0.5
1.0
1.5
2.0
2.5
3.0
3.5
4.0
4.5
5.0
0 2 4 6 8 10 12 14 16
η (%
)
Particle Diameter (μm)

56
Impact Efficiencies vs. Stokes
D (μm) Stk, vane Stk, blade 3 0.2 2.8 6 0.9 11.1
10 2.5 30.9 15 5.7 69.6
0
20
40
60
80
100
120
140
0 20 40 60 80
η (%
)
Stokes Number
Vane Averaged
Blade Averaged
Vane Preserved
Blade Preserved
Blade Unsteady

URETI Stage Plan
• Have the tools we need to perform deposition modeling with mixing plane method. We are honing our tools for unsteady simulations.
• A case with radial profile and hot streak will be performed next to be able to compare the results.
• Will perform unsteady modeling of hot streak through a stage and effect of phantom cooling from vane coolant will be performed.