effects of fibre sizing on damage … · effects of fibre sizing on damage development in...
TRANSCRIPT
EFFECTS OF FIBRE SIZING ON DAMAGEDEVELOPMENT IN UNIDIRECTIONAL
GLASS/EPOXY COMPOSITES
M. Kharrat 1,3, T. Monlèon 1,2, L. Carpentier 3, A. Chateauminois 1 and M.L. Maspoch2
1 Laboratoire d’Ingéniérie et Fonctionnalisation des SurfacesEcole Centrale de Lyon, BP 163, 69131 Ecully Cedex, France
2 Departament de Ciència dels Materials i Enginyera Metal-lurgicaUniversitat Politècnica de Catalunya, 647 Avda Diagonal, 08028 Barcelona, Spain
3 Laboratoire de Tribologie et Dynamique des SystèmesEcole Centrale de Lyon, BP 163, 69131 Ecully Cedex, France
SUMMARY:. The micro and macro mechanical behaviour of unidirectional glass/epoxycomposites differing by their fibre sizing has been investigated. Three different model sizinghave been considered: A1100 only, A1100 with an epoxy prepolymer (DGEBA) and A1100with a linear polyurethane (PU). The composite based on the A1100/PU sizing wascharacterised by a much greater sensitivity to damage development under impact and fatigueloading in flexural mode. This difference was related to a low shear strength, which inducedan enhanced delamination under mechanical loading. On the other hand, micro-indentationtests were unable to reveal any difference in the fibre/matrix interfacial shear strength. Thelow macro-mechanical properties of the A1100/PU composite were interpreted by consideringthe highly heterogeneous fibre distribution which resulted from the low wettability of thesizing by the epoxy matrix. The main effect of the sizing was thus to affect the impregnationprocess during manufacturing, rather than modifying the intrinsic mechanical properties of theinterface.
KEYWORDS: Fibre sizing; interface; fatigue; strength; micro-indentation; micro/macromechanical properties; Glass/epoxy
INTRODUCTION
The major contribution of the interface between fibres and polymers – or the so-calledinterphase – has been widely recognised since the early days of synthetic fibre composites. Ithas especially been demonstrated that damage development in composite subjected tomechanical loading is strongly dependent upon the strength of the interface (see [1] forexample). The prediction of composite durability thus rely largely on the assessment of themechanical properties of the interface in relation to fibre treatments and processingconditions.Two major routes can be used to investigate interfacial properties. The first one relies onmacro-mechanical tests carried out under loading conditions where the interface shear

response is enhanced (off-axis tensile tests, short beam bending tests…). The resultingmechanical behaviour, is, however, dependent upon many extraneous factors such as fibremisalignments, void content…As a result, several doubts surround the extraction of intrinsicinterface properties from such macro-mechanical tests [2].Direct investigations of the interfacial behaviour at the micro-mechanical level have thusreceived a growing interest over the past years. Except for the micro-indentation technique,most of the existing tests (fragmentation, pull-out, droplet micro-tension) involves modelsystems based on a single filament embedded into a polymer matrix. In such systems, thedescription of the real physico-chemical state of the interface in a composite remainsquestionable. Moreover, some controversial has recently emerged regarding the failure modeof the interface. Although great progress has been made with fracture analysis of interfacefailure, it has been pointed out that the centro-symmetry of single filament micro-mechanicaltests is unable to reproduce the interface failure modes really encountered in composites [3].The purpose of this study was thus to investigate some of the aspects of the correlationbetween macro and micro-mechanical behaviour in the case of glass/epoxy composites. Theemphasis was put on the potential of a combination of micro and macro-mechanical testing toassess the effects of fibre sizing on the damage resistance of unidirectional composites. Thestudy of the macro-mechanical behaviour was focused on damage development underdynamic loads (fatigue, impact) which are known to be very sensitive to the interface strength.Micro-mechanical tests were carried using a micro-indentation test which presents theadvantage of using real composites. Composites with different model sizing have beenelaborated and the correlation between microscopic and macroscopic behaviour was analysedin the light of the materials microstructure.
RESULTS AND DISCUSSION
Materials and experimental details
Materials
Unidirectional glass/epoxy composites were used for this study. The matrix was obtainedfrom a diglycidil ether of bisphenol-A (DGEBA) resin (CIBA LY556), which was cured usinga stoichiometric amount of isophorone diamine hardner (IPD, Hüls).The reinforcement was anE-glass roving (800 tex) supplied by Vetrotex International. Prior to impregnation, the fibreswere coated with γ-aminopropyl triethoxysilane (A1100) based sizing. Three different modelsizing have been selected:
i) a sizing containing A1100 only (denoted as S1),ii) a sizing including an epoxy prepolymer (DGEBA) in addition to A1100 (denoted as S2),iii) a sizing containing A1100 and a linear polyurethan (denoted as S3).
The weight fractions of the sizing layer on the fibres were respectively 0.03%, 1.1% and0.46% for S1, S2 and S3. From a previous physico-chemical investigation by Lacrampe[4], S1and S2 were expected to give a glassy interface of limited thickness. On the other hand, the S3sizing was only poorly miscible within the epoxy matrix and it was therefore supposed to givea thicker interphase, with a lower crosslinking density and glass transition temperature.Unidirectional plates 3 mm thick have been elaborated by filament winding. The cure cyclewas 2.5 h at 140 °C followed by 15 mn at 165 °C. Fibre volume fractions, void fractions andglass transition temperatures (Tα, measured at 1 Hz by D.M.T.A.) are reported in Table 1.Depending on the sizing composition, the glass fibres did not exhibit the same wettability by
the epoxy resin during the impregnation step. As a result, it was not possible to achieveexactly the same fibre fraction and void content for the three different composites. Specimens100 x 10 mm2 were cut out from the plates for all the mechanical tests.
Table1: Fibre fractions, voids content and temperatures of the α thermo-mechanicaltransition of the composites (1 Hz, 1°/min).
Sizing Fibre volumefraction (%)
Void fraction(%)
Tα(°C)
A1100 only 41 3.3 165.7A1100 + DGEBA 37 4.8 167
A1100 + PU 49 7.3 161.3
Fatigue tests
Dynamic fatigue tests were performed under three-point-bending conditions at imposedsinusoidal displacement. The test frequency was set to 25 Hz with a strain ratio R = εmin/εmaxequal to 0.1 ( εmin and εmax are respectively the minimum and the maximum strain during thefatigue cycle). A span-to-depth ratio equal to 20 was selected in order to minimise shearstresses. The stiffness-loss curves were continuously recorded as a function of the number ofcycles using a load cell located below the loading nose. A 10% decrease in the relativestiffness was chosen as a conventional lifetime criterion. Using this criterion, it was stillpossible, at the end of the test, to identify the original damage mechanisms that led to samplefailure.In addition to fatigue testing, quasi-static flexural properties have been measured using thesame span-to-depth ratio and a cross-head speed of ca. 2 mm.mn-1. The Inter-Laminar ShearStrength (ILSS) was also measured at the same loading rate using a span-to-depth ratio equalto 5.
Impact tests
Impact tests have been performed using a conventional ‘Charpy’ impact testing machine.Specimens were tested under a three point bending configuration with a 50 mm span. Theimpact energy was set to 50 J.
Micro-indentation testing
Micro-indentation has been carried out using a specific device described elsewhere [5]. Testswere performed using thick (10mm) polished cross-sections of the composite plates. Theloading was carried out at imposed displacement rate (0.2 µm.s-1) using a Vickers diamondindenter. The normal load and the indenter displacement were continuously monitored duringloading and unloading. The maximal load was set to a value of ca. 0.5 N, which was found tobe sufficient to induce a systematic fibre debonding. The latter was checked after each test bymeans of optical microscope observations of the indented fibre. The occurrence of debondingwas indicated by a black circle surrounding the edge of the fibre. Tests with fractured fibreswere systematically discarded from data analysis.
Strength properties
The strength properties of the composites have been tested under quasi-static flexuralconditions (Table 1). A slightly higher strain to failure was achieved with the DGEBA/A1100(S2) sizing. If stresses to failure are considered, most of the observed differences can beattributed to the changes in the fibre content as the sizing was modified.The most significant difference was related to the failure mode of composite S2. Whereas S1and S3 specimens exhibited a progressive failure by fibre breakage and delamination from thetensile side, composite S3 failure was associated with a localised micro-buckling of the fibresbeneath the loading nose. Such a mechanism is known to be due to an indentation effect of theloading nose, which induces locally high compressive and shear stresses on the compressiveside of the specimen [6]. This kind of failure can therefore not be considered as trulyrepresentative of the intrinsic bending behaviour of the composite and it only provides anunderestimated value of the flexural strength. These compressive mode failures have beenfound to be especially enhanced in the case of creep sensitive matrix, such as water plasticisedepoxy [7]. In the present case, it can be noted that the composite S3 exhibited a lower αthermo-mechanical transition temperature than composites S1 and S2 (Table 1). This indicatesa lower cross-link density of the epoxy matrix when a PU polymer was used in the sizingformulation. These lower thermo-mechanical properties could account for an highersensitivity to creep and fibre micro-buckling beneath the loading nose during flexural loading.
Table 2: Flexural strength and inter-laminar shear strength (ILLSS) properties of thecomposites. (standard deviations within brackets).
Sizing Stress to failure:σr (MPa)
Strain to failure:εr (%)
ILSS(MPa)
S1 920 (25) 3.05 (0.07) 72 (0.8)S2 880 (50) 3.41 (0.15) 69 (4)S3 1060 (40) 3.06 (0.17) 41 (0.7)
A strong difference was also noted between the ILSS properties of the composite S1 and S2and those of the composite S3, which exhibited an anomalous low shear strength. This lowshear strength of material S3 can be attributed to either a poor fibre/matrix adhesion or tomacroscopic defects such as voids, which can act as stress concentrators. The possiblecontribution of voids to the observed premature shear failure is further supported by the highvoid content of composite S3 (Table1). At this stage, it is, however, not possible todifferentiate between the respective contributions of the interface strength and themacroscopic defects to the macro-mechanical shear properties.
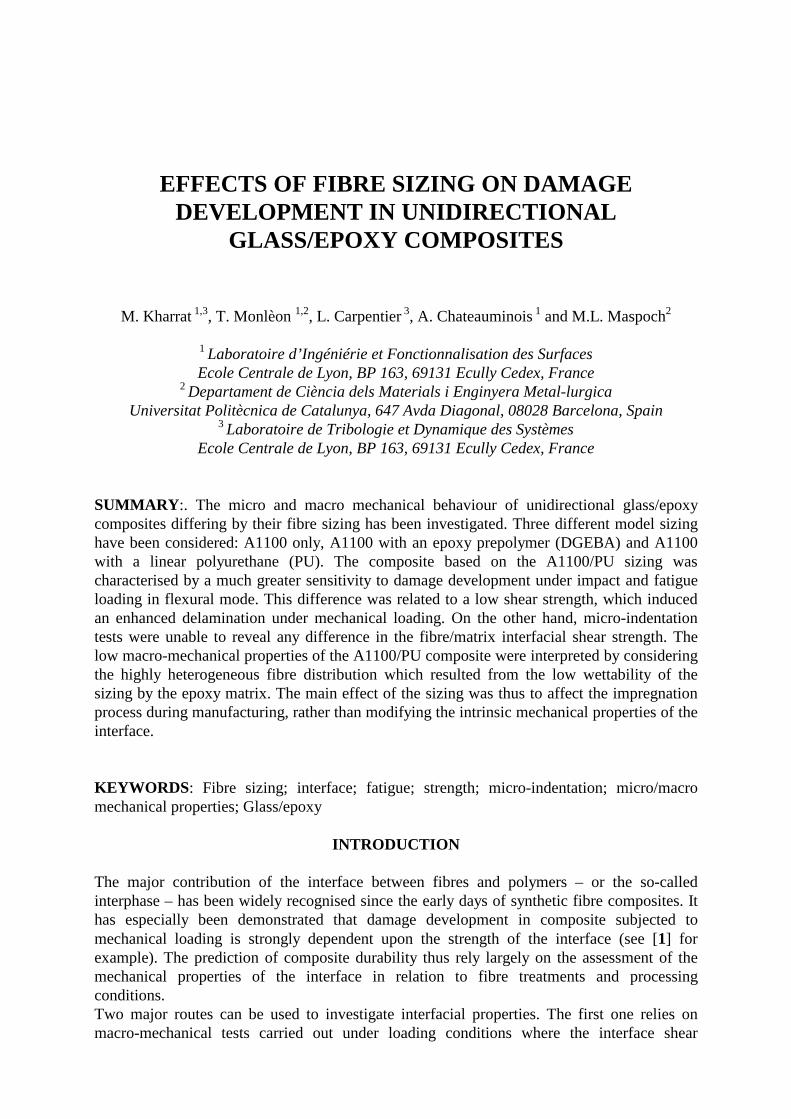
Impact behaviourUnder impact testing, a strong difference in the failure mechanisms was also observedbetween composite S1 and S3 (No tests were carried out with material S2). Composite S1exhibited a localised failure close to the impacter, which involved mostly fibre breakage fromthe tensile side of the specimens. On the other hand, S3 failed in a shear mode along the mid-plane of the samples, with a only limited damage on the tensile side of the specimens. Thisdifference in failure modes resulted in very different impact resistance (182 kJ/m2 forcomposite S1 and 331 kJ/m2 for composite S3). The highly dissipative shear failure ofcomposite S3 can be related to its low ILSS.
(a) (b)
Fig. 1: Failure modes of composites S1 (a) and S3 (b) under impact testing.
Fatigue behaviour
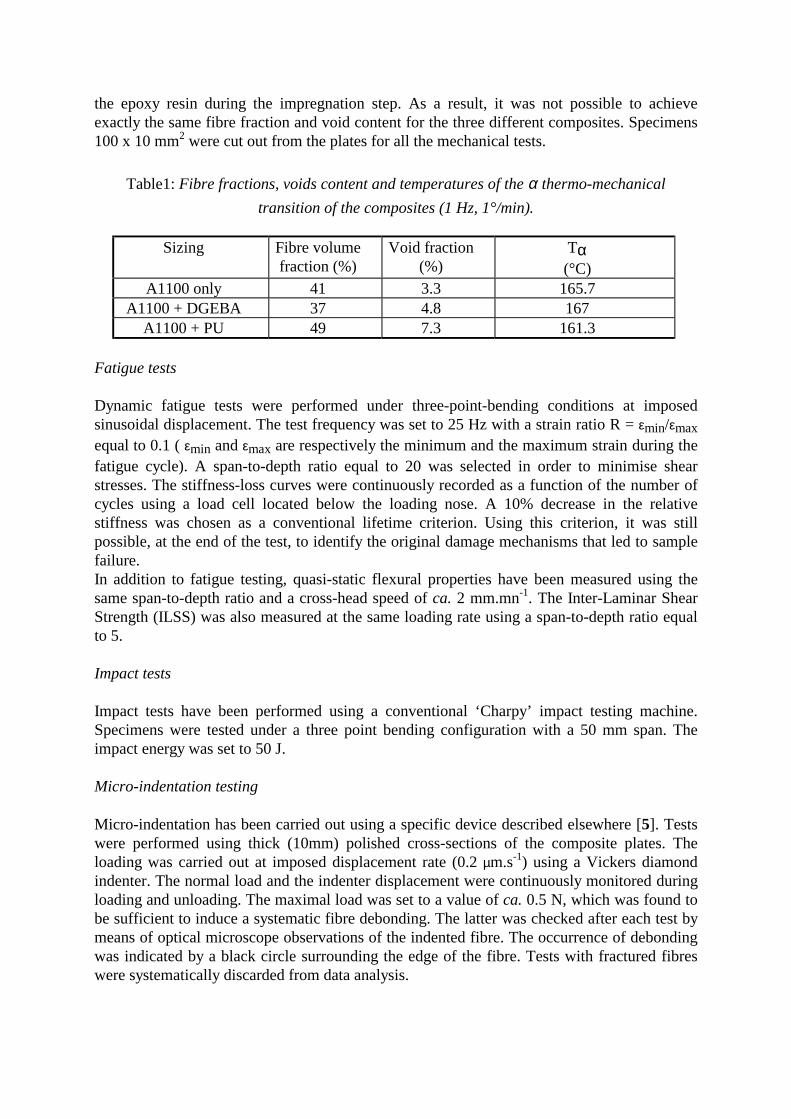
Three point bending tests have been carried out using composites S1 and S3. fatigue data havebeen reported in conventional S-N diagrams giving the maximum applied strain εmax as afunction of the lifetime criterion N10.(Fig. 2 and 3).In the investigated strain range, the fatigue behaviour of the material S1 can be describedusing a Wöhler’s relationship:
εmax = A – B log N10 (1)
with A and B are constants equal to 5.2% and 0.5%/decade respectively.
104 105 106 107
1.8
2.0
2.2
2.4
2.6
2.8
3.0
[5]
N10
ε εεε max
(%)
Fig. 2 : S-N fatigue curve of composite S1.(Arrows correspond to run-outs).
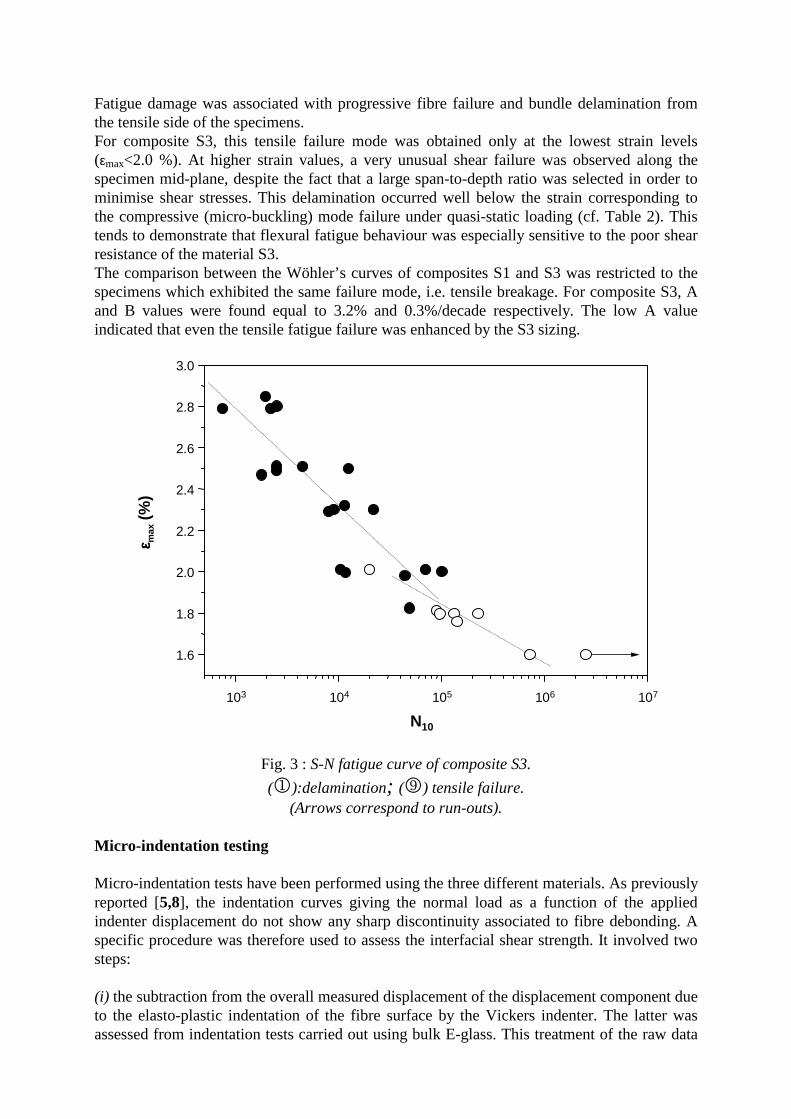
Fatigue damage was associated with progressive fibre failure and bundle delamination fromthe tensile side of the specimens.For composite S3, this tensile failure mode was obtained only at the lowest strain levels(εmax<2.0 %). At higher strain values, a very unusual shear failure was observed along thespecimen mid-plane, despite the fact that a large span-to-depth ratio was selected in order tominimise shear stresses. This delamination occurred well below the strain corresponding tothe compressive (micro-buckling) mode failure under quasi-static loading (cf. Table 2). Thistends to demonstrate that flexural fatigue behaviour was especially sensitive to the poor shearresistance of the material S3.The comparison between the Wöhler’s curves of composites S1 and S3 was restricted to thespecimens which exhibited the same failure mode, i.e. tensile breakage. For composite S3, Aand B values were found equal to 3.2% and 0.3%/decade respectively. The low A valueindicated that even the tensile fatigue failure was enhanced by the S3 sizing.
103 104 105 106 107
1.6
1.8
2.0
2.2
2.4
2.6
2.8
3.0
ε εεε max
(%)
N10
Fig. 3 : S-N fatigue curve of composite S3.(!):delamination; (") tensile failure.
(Arrows correspond to run-outs).
Micro-indentation testing
Micro-indentation tests have been performed using the three different materials. As previouslyreported [5,8], the indentation curves giving the normal load as a function of the appliedindenter displacement do not show any sharp discontinuity associated to fibre debonding. Aspecific procedure was therefore used to assess the interfacial shear strength. It involved twosteps:
(i) the subtraction from the overall measured displacement of the displacement component dueto the elasto-plastic indentation of the fibre surface by the Vickers indenter. The latter wasassessed from indentation tests carried out using bulk E-glass. This treatment of the raw data

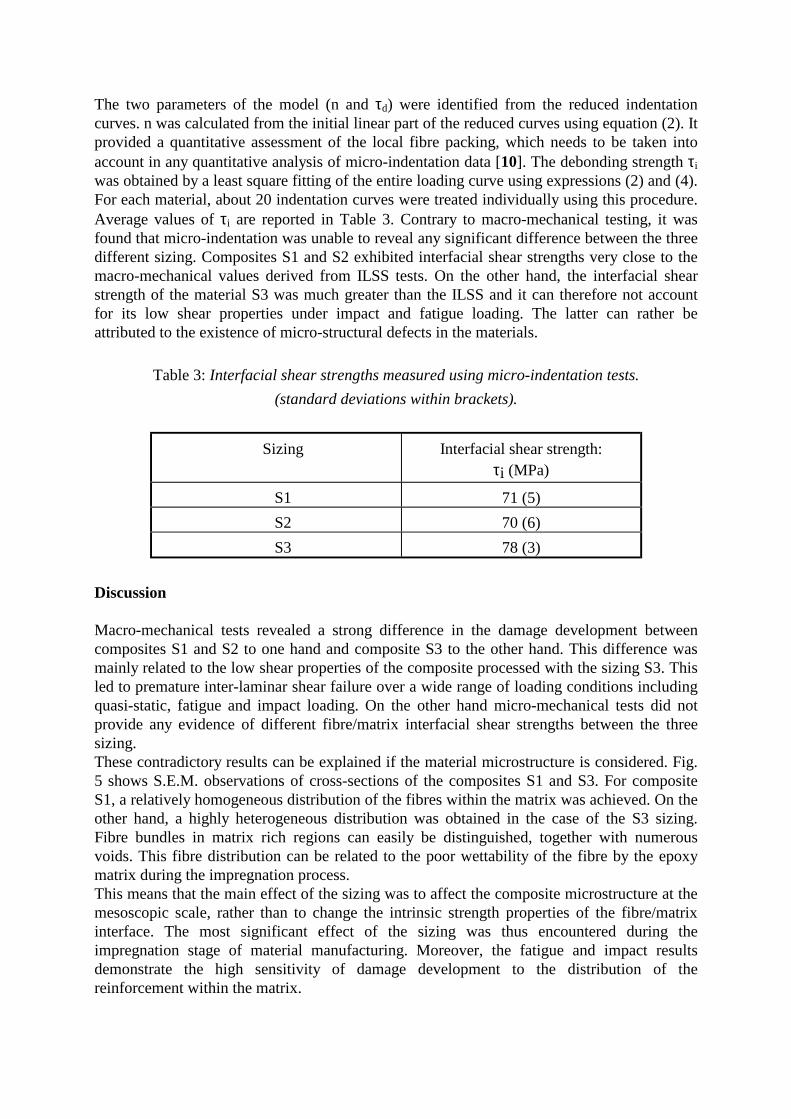
resulted in ‘reduced’ indentation curves giving the elastic displacement uo of the fibre surfaceas a function of the applied load P. The reduced indentation curves systematically exhibited anon linear behaviour (Fig. 4) which was associated with the progressive debonding of thefibre.
(ii) a shear-lag model taking into account the occurrence of debonding was used to assess theinterfacial shear strength τi from the reduced indentation curves. The following twoexpressions have been derived for the loading step :
F<Fd unEo
o=σ (2)
Where Fd is the debonding load, σ0 is the nominal applied stress (P/πa2), E is the fibreYoung’s modulus and a is the fibre diameter. n is given by :
nk
aE=
2 (3)
where k is a global stiffness constant including the elastic properties of the matrix as well asthe environment of the fibre.
F>Fd
u
nEoo
dd= +
12
2σσ
σ
(4)
Where σd is the debonding stress. Full details regarding the extraction of reduced indentationcurves and the derivation of the shear lag model can be found in refs [5] and [9].
u 0 (µm)
P (N
)
0
0.1
0.2
0.3
0.4
0.5
0.6
0.7
0 0.2 0.4 0.6 0.8 1 1.2 1.4 1.6
Fig. 4 : Typical reduced indentation curve (composite S1).
The two parameters of the model (n and τd) were identified from the reduced indentationcurves. n was calculated from the initial linear part of the reduced curves using equation (2). Itprovided a quantitative assessment of the local fibre packing, which needs to be taken intoaccount in any quantitative analysis of micro-indentation data [10]. The debonding strength τiwas obtained by a least square fitting of the entire loading curve using expressions (2) and (4).For each material, about 20 indentation curves were treated individually using this procedure.Average values of τi are reported in Table 3. Contrary to macro-mechanical testing, it wasfound that micro-indentation was unable to reveal any significant difference between the threedifferent sizing. Composites S1 and S2 exhibited interfacial shear strengths very close to themacro-mechanical values derived from ILSS tests. On the other hand, the interfacial shearstrength of the material S3 was much greater than the ILSS and it can therefore not accountfor its low shear properties under impact and fatigue loading. The latter can rather beattributed to the existence of micro-structural defects in the materials.
Table 3: Interfacial shear strengths measured using micro-indentation tests.(standard deviations within brackets).
Sizing Interfacial shear strength:τi (MPa)
S1 71 (5)S2 70 (6)S3 78 (3)
Discussion
Macro-mechanical tests revealed a strong difference in the damage development betweencomposites S1 and S2 to one hand and composite S3 to the other hand. This difference wasmainly related to the low shear properties of the composite processed with the sizing S3. Thisled to premature inter-laminar shear failure over a wide range of loading conditions includingquasi-static, fatigue and impact loading. On the other hand micro-mechanical tests did notprovide any evidence of different fibre/matrix interfacial shear strengths between the threesizing.These contradictory results can be explained if the material microstructure is considered. Fig.5 shows S.E.M. observations of cross-sections of the composites S1 and S3. For compositeS1, a relatively homogeneous distribution of the fibres within the matrix was achieved. On theother hand, a highly heterogeneous distribution was obtained in the case of the S3 sizing.Fibre bundles in matrix rich regions can easily be distinguished, together with numerousvoids. This fibre distribution can be related to the poor wettability of the fibre by the epoxymatrix during the impregnation process.This means that the main effect of the sizing was to affect the composite microstructure at themesoscopic scale, rather than to change the intrinsic strength properties of the fibre/matrixinterface. The most significant effect of the sizing was thus encountered during theimpregnation stage of material manufacturing. Moreover, the fatigue and impact resultsdemonstrate the high sensitivity of damage development to the distribution of thereinforcement within the matrix.

Fig. 5 : S.E.M. observations of composites S1 (a) and S3 (b).
CONCLUSION
Macro and micro-mechanical tests have been carried out using unidirectional glass/epoxycomposites differing by their fibre surface treatments. Strong differences have been observedregarding damage development under fatigue and impact loading, whereas micro-indentationtests were unable to reveal any significant change in the interfacial shear strengths. Thesedifferences between the micro and macro-mechanical behaviour were interpreted by means ofobservations of the fibre distribution within the composite. By modifying the wettability of thefibre by the matrix during the impregnation process, the changes in the sizing resulted in verydifferent microstructures. When a highly heterogeneous fibre distribution was achieved, theresulting low shear properties resulted in a drop in the fatigue and impact resistance. It musttherefore emphasised that any assessment of the effects of fibre treatments on the interfacialproperties from macro-mechanical tests can be misleading if it does not integrate a detailedanalysis of the composite microstructure.
(a)
(b)

ACKNOWLEDGEMENTS
The authors fully acknowledge Vetrotex International (Chambery, France) for supplying thematerials.
REFERENCES
1. Reifsnider, K.L., “Modelling of the interphase in polymer-matrix composite materialsystems”, Composites, Vol. 25, N° 7, 1994, pp.461-469.
2. Verpoest, I., Desaeger, M., Ivens, J., Wevers, M, “Interfaces in polymer matrixcomposites: from micromechanical tests to macromechanical properties”, Makromol. Chem.,Macromol. Symp., Vol. 75, 1993, pp. 85-98.
3. Pigott, M.R., “Why interface testing by single-fibre methods can be misleading”,Composites Science and Technology, Vol. 57, 1997, pp. 965-974.
4. Lacrampe, V., PhD Dissertation, Institut National des Sciences Appliquées de Lyon(INSA), France, 1992.
5. Kharrat, M., Chateauminois, A., Carpentier, L., Kapsa, Ph., “On the interfacialbehaviour of a glass/epoxy composite during a micro-indentation test: assessment ofinterfacial shear strength using reduced indentation curves”, Composites Part A, Vol. 28A,1997, pp. 39-46.
6. Berg, C.A., Tirosh, J., Israeli, M., “Analysis of short beam bending of fiber reinforcedcomposites”, ASTM STP 497, American Society for Testing and Materials, Philadelphia,1972, p. 206-218.
7. Chateauminois, A., Chabert, B., Soulier, J.P., Vincent, L., "Hygrothermal ageingeffects on the static fatigue of glass/epoxy composites", Composites, Vol. 24, N° 7,1993,pp.547-555;
8. Desaeger, M., Verpoest, I., “On the use of the micro-indentation test technique tomeasure the interfacial shear strength of fibre-reinforced polymer composites”, CompositesScience and Technology, Vol. 48, 1993, pp. 215-226.
9. Zidi, M., Carpentier, L., Chateauminois, A., Sidoroff, F., “Quantitative analysis of themicro-indentation behaviour of fibre reinforced composites: Development and validation ofan analytical model”, Submitted to Composite Science and Technology.
10. Mandell, J.F., Grande, D.H., Tsiang, T.H., McGarry, F.J, “Modified micro-debondingtest for direct in situ/fiber matrix bond strength determination in fiber composites”,Composite Materials: Testing and Design (Seventh Conference), ASTM STP 893, J. M.Whitney, J.M., Ed., American Society for Testing and Materials, Philadelphia, 1986, pp. 87-108.