effects of farm subsidies for the rich on poor farmersaic.ucdavis.edu/publications/farm subsidy and...
TRANSCRIPT
Effects of Farm Subsidies for the Rich on Poor Farmers
Northwestern University
February 5, 2013
Daniel A. Sumner
University of California Agricultural Issues Center and
Agricultural and Resource Economics, UC, Davis

Objectives and Plan Better understand how US policy affects farmers in poor counties • There is a story, but it is complicated and the answer is not
simple. • Requires some background on global growth and
agricultural trade patterns • Major farm policy institutions and facts including the WTO,
the farm bill and a decade of history of disputes • To keep things focuses we will talk about the WTO cotton
case and the effects of cotton subsidies on the poor in Africa • Conclude with some current issues in what has become the
2013 farm bill
My Background
• An economist not a lawyer or negotiator. Chief economist and assistant secretary at the USDA in the early 1990s, but do not represent anyone but myself on farm policy issues.
• My research deals with agricultural commodities, the rural environment, animal welfare, nutrition and food and agriculture in developing countries.
• Work for years with Brazil and attorneys at Sidley and Austin in Geneva on the economics of the WTO cotton case
• Help Brazil on effects of current U.S. farm subsidy proposals • Written on the effects of U.S. farm policies on the poor for the
World Bank and a range of “think tanks” from Oxfam to CATO and AEI
• Worked for years with Canadian Cattlemen and the Government of Canada on the WTO COOL case.
US Commodity Subsidies Overview and some complications
• Biggest subsidies have applied to grains, cotton and oilseeds • Poor consumers gain, competing producer lose • But, high recent prices mean subsidies are smaller, especially
those with the biggest supply incentives • Ethanol demand subsidy penalizes poor food consumers, so
the net effect for grain and oilseeds has been to drive up food prices.
• Cotton subsidy still drives down prices consistent with the WTO case and negative effects on very poor farm faamilies
• “Risk management” schemes also have subsidy and potentially large production incentives

Effects of US policy elsewhere with emphasis on impacts on the poor
• As a large player US domestic and export subsidy policies may affect markets and global prices
• US agricultural policy affects policies in other countries and trade agreements
• Limits on market access affect potential exporters • Some policies are directed towards the worlds poor Contradictions between farm policy and trade policy
and the contributions of US policy to global disarray in agriculture is not a new theme (DGJ, 1947)

Import Protection and Export Subsidy
• Tariffs and other import barriers are mostly low, but matter for a few products produced in poor countries (eg. sugar)
• New food safety rules and country of origin labeling (COOL) • Can policies be applied in an evenhanded way to not penalize
imports from poor countries, especially from those supply a small share of the US market, with many small farms and limit facility for traceback?
• COOL issue with Mexico shows discrimination is likely • Result: Mexican cattle are now priced lower to account for
added costs segregation and tracing costs compared to US born cattle.
• Finally, Export credit subsidies reward buyers and bankers in poor countries, while harming competitive exporters
COOL WTO case shows discriminatory protectionist effects are likely
• COOL from 2002 and 2008 farm bill applied meat with separate label based on birth origin of the animal
• Rules imply segregation cost to keep animals and meat in a isolated stream to make label accurate
• Firms avoid segregation costs by using only US animals (since Mexico has such a small share it is not feasible for any firm to use Mexican only)
• Result Mexican cattle paid less to account for added costs. Supply from Mexico to US still relatively inelastic

US Agricultural R&D that increases productivity has potential to help the poor
• US productivity R&D lowers costs, increases supply and lowers prices for consumers
• US R&D often improves productivity of poor farmers, but when it does not poor farmers can lose
• Attention to the world’s very poor suggests more attention to productivity and less to other also worth objectives
• Sadly, R&D designed for the rich (environmental concerns, animal welfare, etc.) do less for the poor

The WTO: Monster, poodle or simple forum?
Is the WTO a toothless poodle or an uncontrollable fire breathing dragon?
Actually…neither The WTO is a modest forum and court sytem created to help open markets and allow a framework for settling disputes.
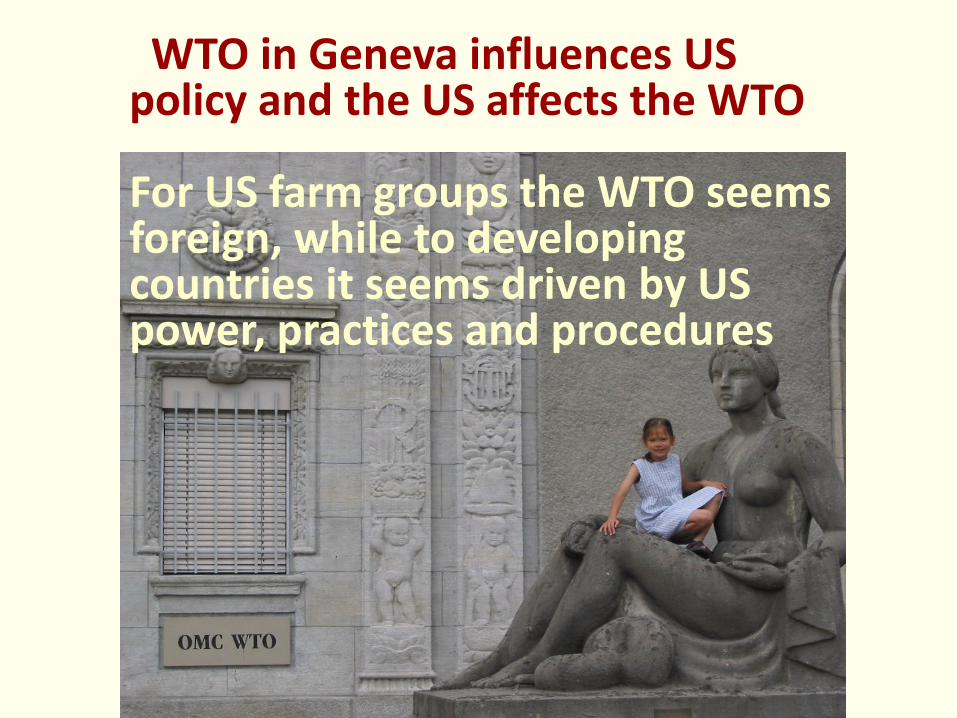
WTO in Geneva influences US policy and the US affects the WTO For US farm groups the WTO seems foreign, while to developing countries it seems driven by US power, practices and procedures
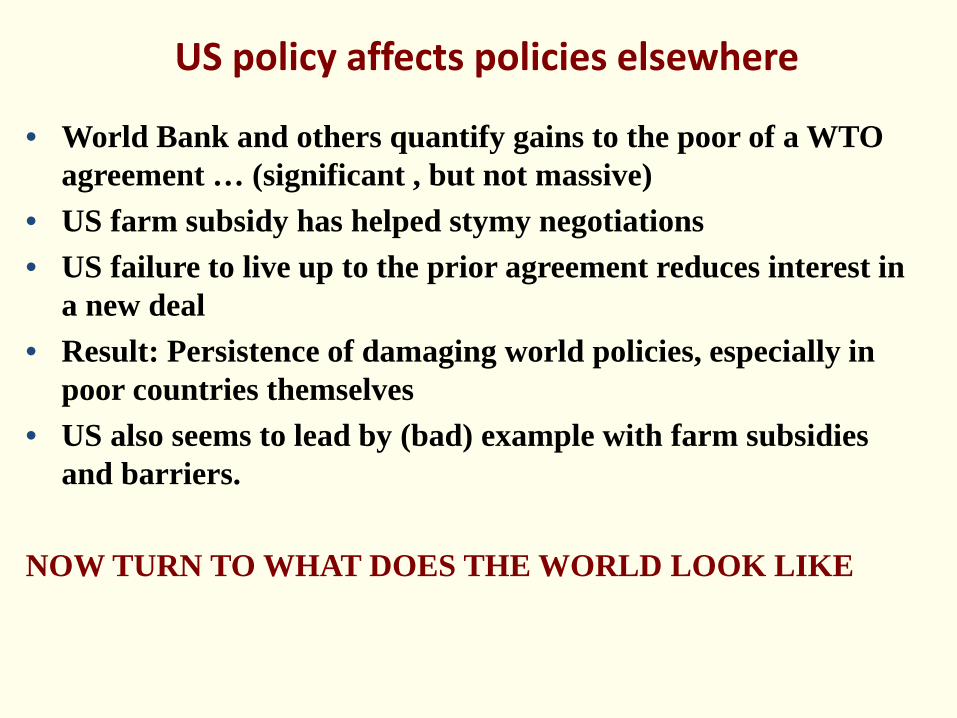
US policy affects policies elsewhere
• World Bank and others quantify gains to the poor of a WTO agreement … (significant , but not massive)
• US farm subsidy has helped stymy negotiations • US failure to live up to the prior agreement reduces interest in
a new deal • Result: Persistence of damaging world policies, especially in
poor countries themselves • US also seems to lead by (bad) example with farm subsidies
and barriers.
NOW TURN TO WHAT DOES THE WORLD LOOK LIKE
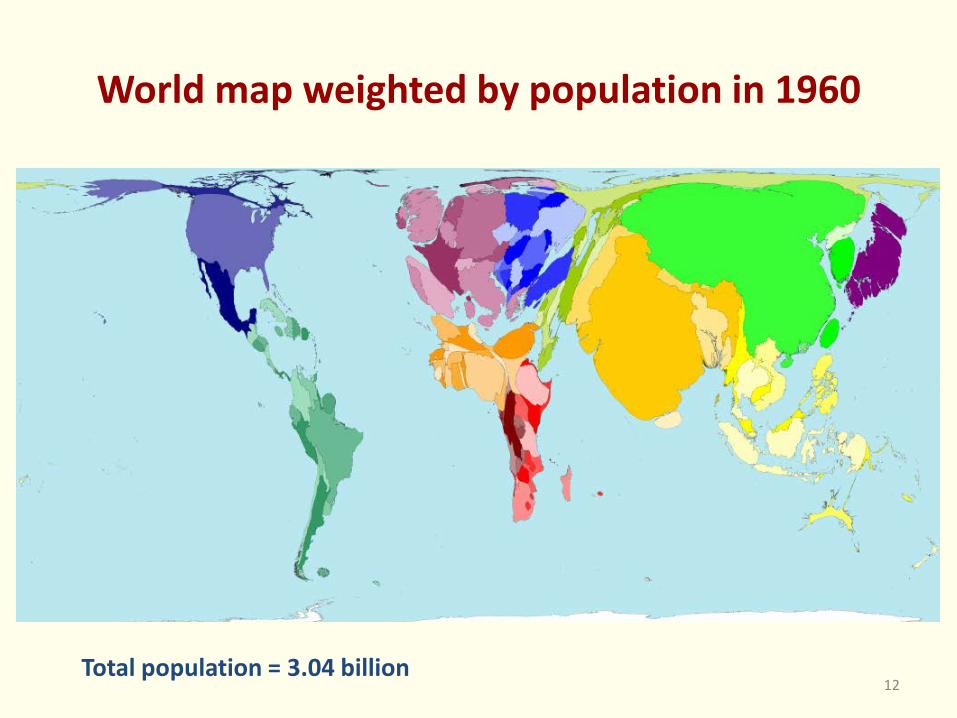
World map weighted by population in 1960
Total population = 3.04 billion 12

World population, 1950-2050 (projected)
0
500
1000
1500
2000
2500
3000
3500
4000
4500
500019
5019
5319
5619
5919
6219
6519
6819
7119
7419
7719
8019
8319
8619
8919
9219
9519
9820
0120
0420
0720
1020
1320
1620
1920
2220
2520
2820
3120
3420
3720
4020
4320
4620
49
Mill
ions
Sub-Saharan Africa
N. Africa and Middle East
North America
CIS
Western Europe
Asia
Latin America
13

World map weighted by estimated population in 2050
Total population (est.) = 9.07 billion 14

Rice production, 1960-2012, by country (million tons)
0
20
40
60
80
100
120
140
160
Bangladesh
China
India
Indonesia
Vietnam

Rice exports 1960-2012, by country (million tons)
0
2
4
6
8
10
12
China
India
Pakistan
Thailand
United States
Vietnam

World map weighted by GDP in 1960

Leading Importers of Agricultural Products
Source: WTO
0
20
40
60
80
100
120
140
160
180
200
EU-27 US China Japan Russia Canada Korea
$ bi
llion

Leading Exporters of Agricultural Products
0
20
40
60
80
100
120
140
160
US. EU-27 Brazil Canada China Argentina Indonesia
$ billi
on
Source: WTO
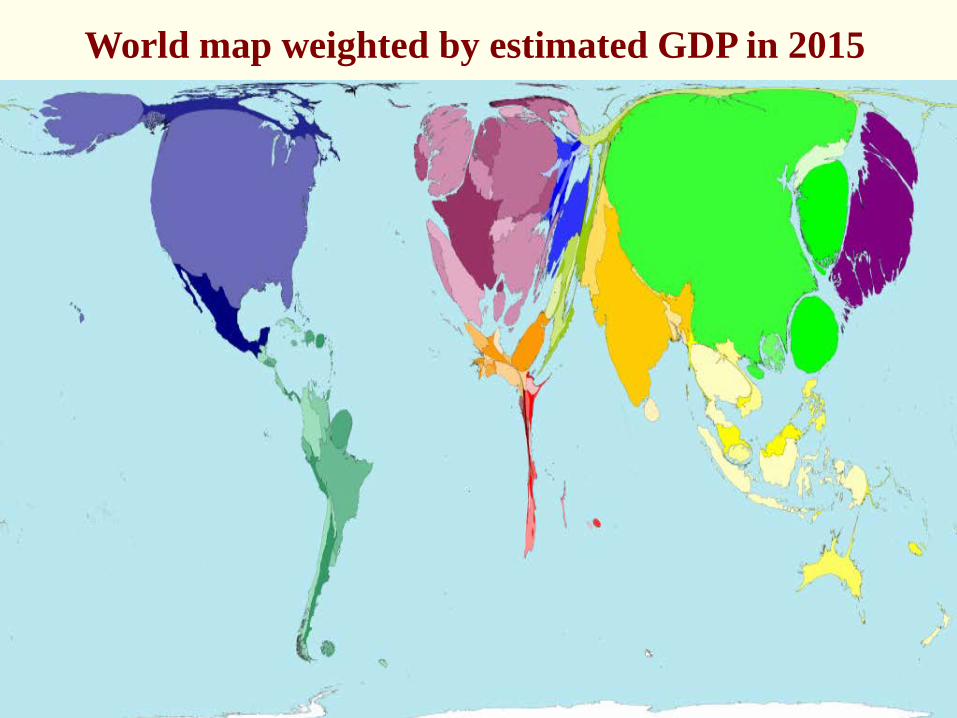
World map weighted by estimated GDP in 2015
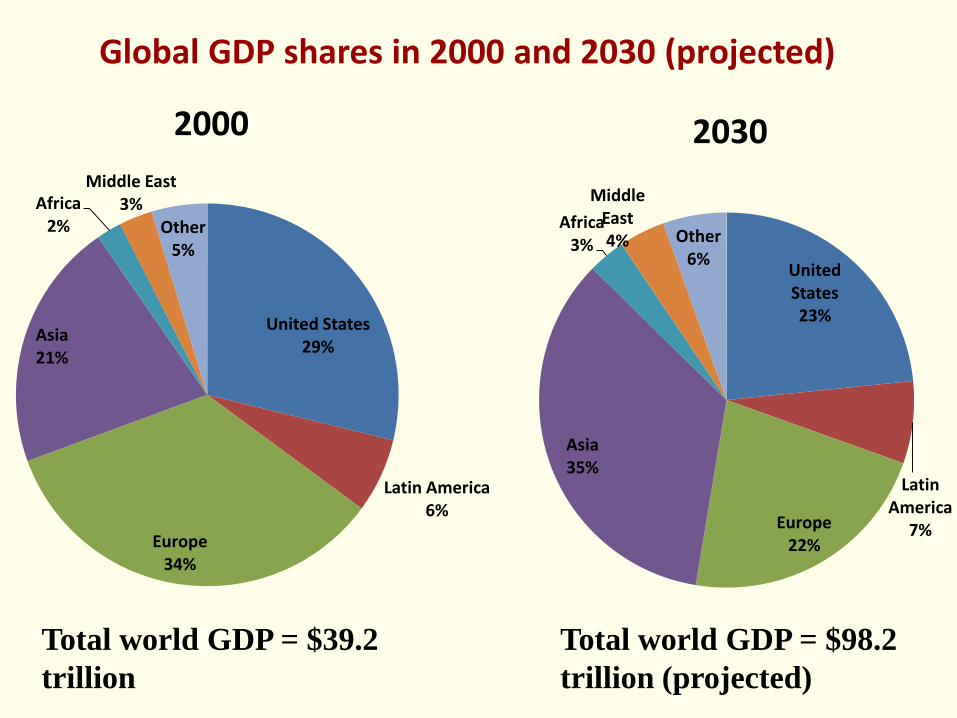
United States 23%
Latin America
7% Europe 22%
Asia 35%
Africa 3%
Middle East 4% Other
6%
2000 2030
United States 29%
Latin America 6%
Europe 34%
Asia 21%
Africa 2%
Middle East 3%
Other 5%
Global GDP shares in 2000 and 2030 (projected)
Total world GDP = $39.2 trillion
Total world GDP = $98.2 trillion (projected)
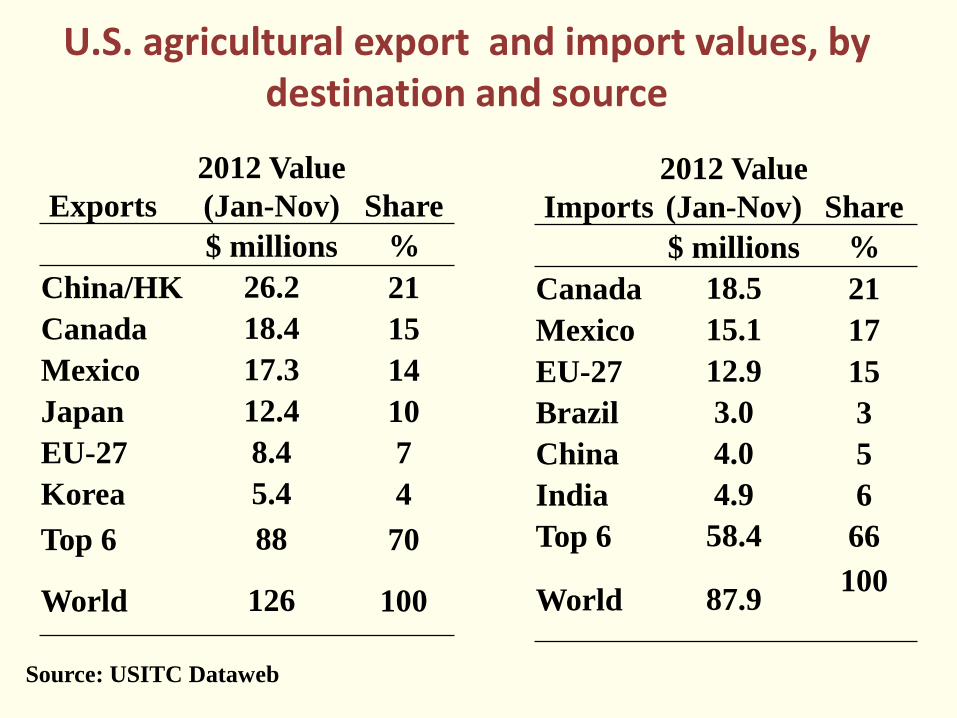
Exports 2012 Value (Jan-Nov) Share
$ millions % China/HK 26.2 21 Canada 18.4 15 Mexico 17.3 14 Japan 12.4 10 EU-27 8.4 7 Korea 5.4 4 Top 6 88 70
World 126 100
Source: USITC Dataweb
U.S. agricultural export and import values, by destination and source
Imports 2012 Value (Jan-Nov) Share
$ millions % Canada 18.5 21 Mexico 15.1 17 EU-27 12.9 15 Brazil 3.0 3 China 4.0 5 India 4.9 6 Top 6 58.4 66
World 87.9 100

CCP
MLG/LDP
Government Payments under the 2002 and 2008 Farm Bills
Target Price – $0.724
Loan Rate – $0.52 Fixed payment – $0.0667
} } }
Do not have to currently produce to get these payments
Paid per unit of production
Market Receipts
Market Price
Government cotton subsidy have averaged about half of total revenue for cotton farms
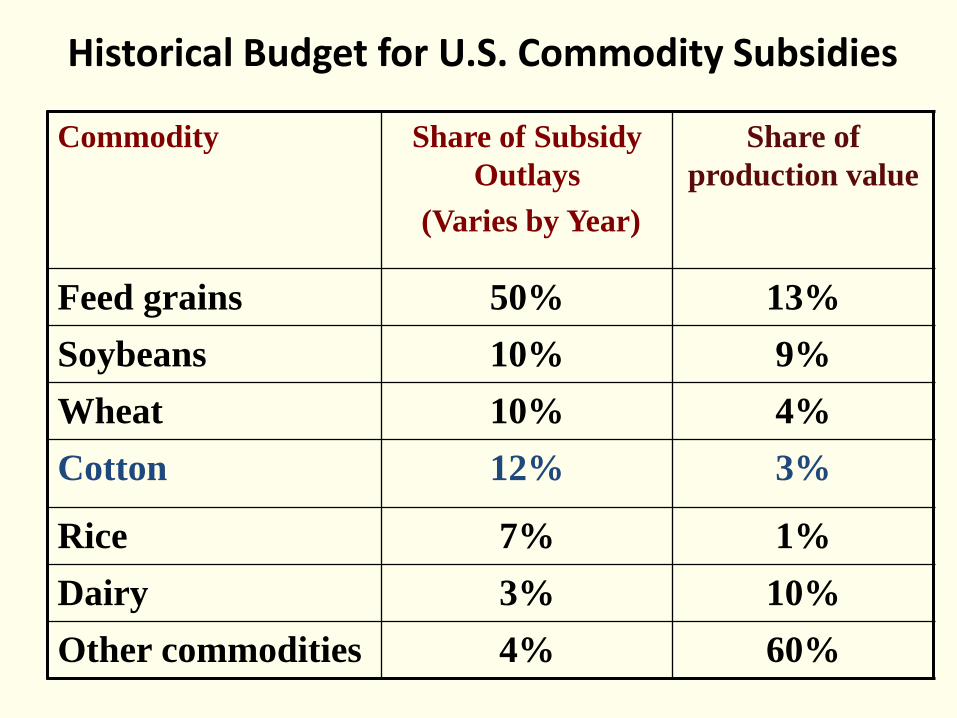
Historical Budget for U.S. Commodity Subsidies
Commodity Share of Subsidy Outlays
(Varies by Year)
Share of production value
Feed grains 50% 13% Soybeans 10% 9% Wheat 10% 4% Cotton 12% 3%
Rice 7% 1% Dairy 3% 10% Other commodities 4% 60%
How does farm subsidy in rich countries affect farm production patterns in poor countries?
Some work with a former graduate student Omid Rohani
• Can we measure statistically the effects on poor counties?
• Is the impact large and widespread enough to see impacts across commodities for many countries?
• And, could we find the impacts against a backdrop of agronomic, climatic and other forces that dominate revenue patterns over time across countries and commodities?
• The answers to these questions are: Yes and Yes.
25
30
35
40
45
50
1986 1987 1988 1989 1990 1991 1992 1993 1994 1995 1996 1997 1998 1999 2000 2001 2002 2003 2004
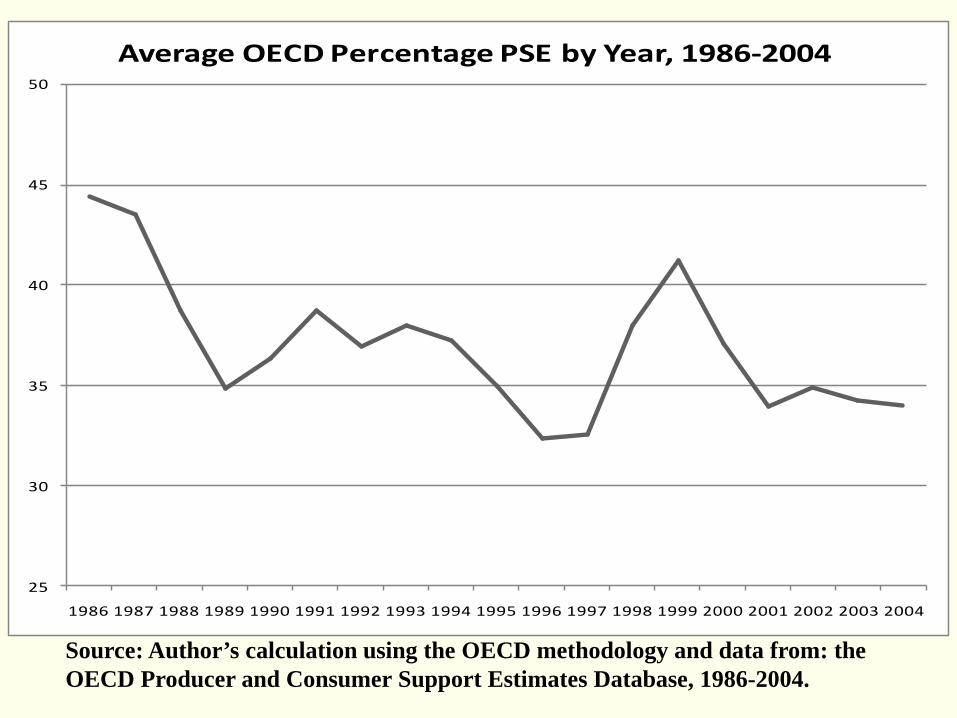
Average OECD Percentage PSE by Year, 1986-2004
Source: Author’s calculation using the OECD methodology and data from: the OECD Producer and Consumer Support Estimates Database, 1986-2004.

Drivers of an effect • The negative impact across commodities, countries, and
years, of expected subsidies on world prices is larger when: • (i) the expected subsidy is larger, • (ii) supply response to the subsidy in rich countries is larger, • (iii) the world market share of rich countries is larger, • (iv) the demand response to lower prices is muted, and • (v) the supply response to lower price in poor countries is
muted.
• Look for effects on farm revenue by commodity and year for 147 poor for 23 commodities and 19 years.

The basic estimating equation
Rev.Shareijt = αi + β(Et-1(RelativeSubjt)) + uijt
• Estimate the parameter β to test if rich country subsidies affect production patterns in developing countries
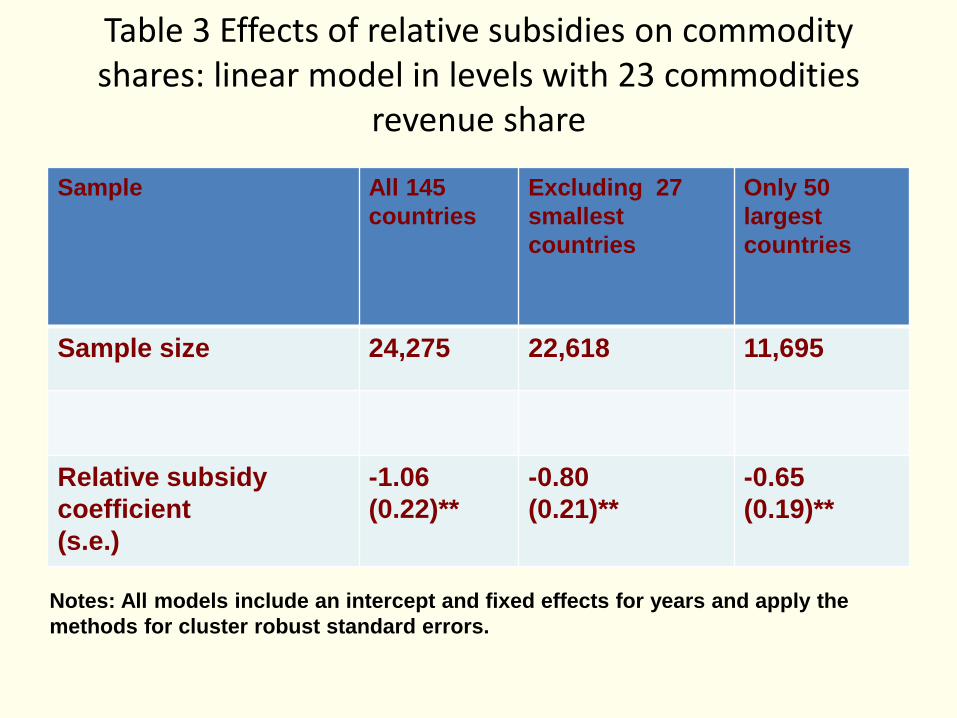
Table 3 Effects of relative subsidies on commodity shares: linear model in levels with 23 commodities
revenue share
Sample All 145 countries
Excluding 27 smallest countries
Only 50 largest countries
Sample size 24,275 22,618 11,695
Relative subsidy coefficient (s.e.)
-1.06 (0.22)**
-0.80 (0.21)**
-0.65 (0.19)**
Notes: All models include an intercept and fixed effects for years and apply the methods for cluster robust standard errors.

Interpretation
• For rice, a 1.2 unit decrease in relative subsidy would raise the mean share of rice from 15.4 percent of commodity revenue to 16.6 percent of commodity revenue.
• This 8 percent increase in the revenue share for rice is significant.
• Most of what a country produces is determined by local climate, soil, and local eating habits, so factors causing a 1 percentage point change in revenue shares are economically significant and plausible.

The WTO Cotton Case
• The Case against U.S. cotton subsidies brought by Brazil lasted from 2002 through 2009 with complete victory for Brazil
• But, the case continues because the U.S. refuses to implement policy changes acceptable to Brazil

A WTO trade dispute over effects of subsidies
• Brazil claimed that the US subsidy policy stimulates US production and thereby depresses world cotton prices. The US said no.
• The question is: What would have been the level of world prices if the US subsidies would not have been in place?
• The economics to be applied is basic supply and demand, but, – In a complex setting with expectations about prices and
many suppliers and demanders interacting – Much debate about size of supply and demand response to
subsidies and market prices.
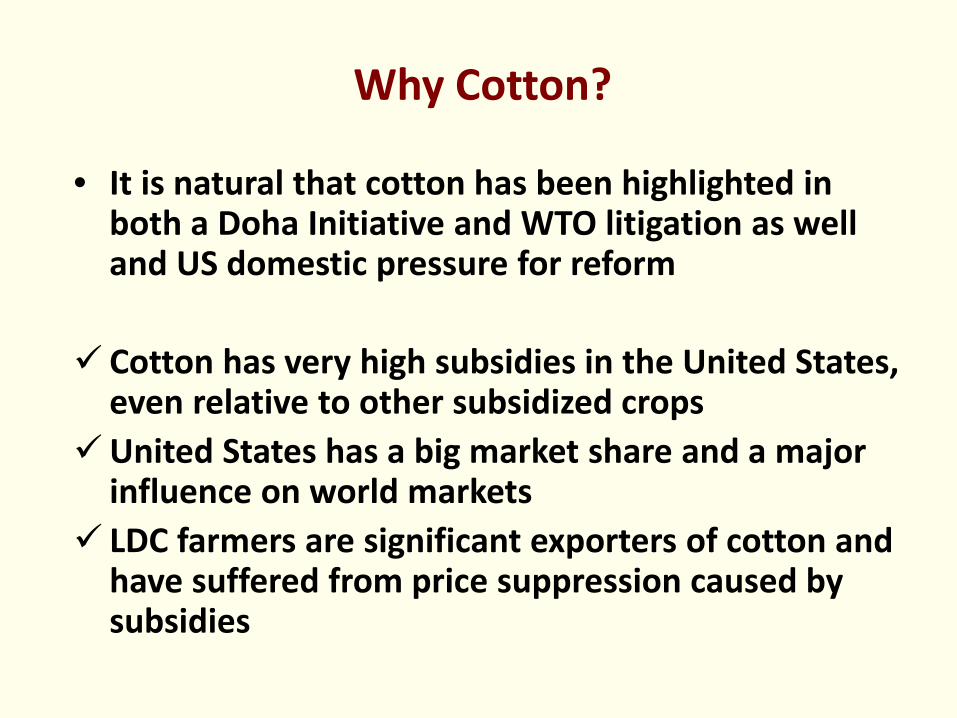
Why Cotton?
• It is natural that cotton has been highlighted in both a Doha Initiative and WTO litigation as well and US domestic pressure for reform
Cotton has very high subsidies in the United States,
even relative to other subsidized crops United States has a big market share and a major
influence on world markets LDC farmers are significant exporters of cotton and
have suffered from price suppression caused by subsidies

Cotton Subsidy Proceedings
• Brazil’s WTO cotton dispute on US cotton subsidies began in 2002 and went through several rounds.
• In summer 2003 some US cotton wanted me fired or worse.
• Back in 2002, Africans chose not to join the case and instead pursued a separate negotiation strategy to persuade the US to “do the right thing”
• The African cotton initiative of the Doha Development Agenda asked for compensation and an end to subsidies immediately
• The next US farm bill (2013) is a vehicle for cotton subsidy changes and could be a chance to settle the WTO dispute implementation.

Cotton production, million bales
0
5
10
15
20
25
30
35
40Brazil
China
India
Africa
United States
Uzbekistan

Harvesting cotton in the United States
0
5
10
15
20
25
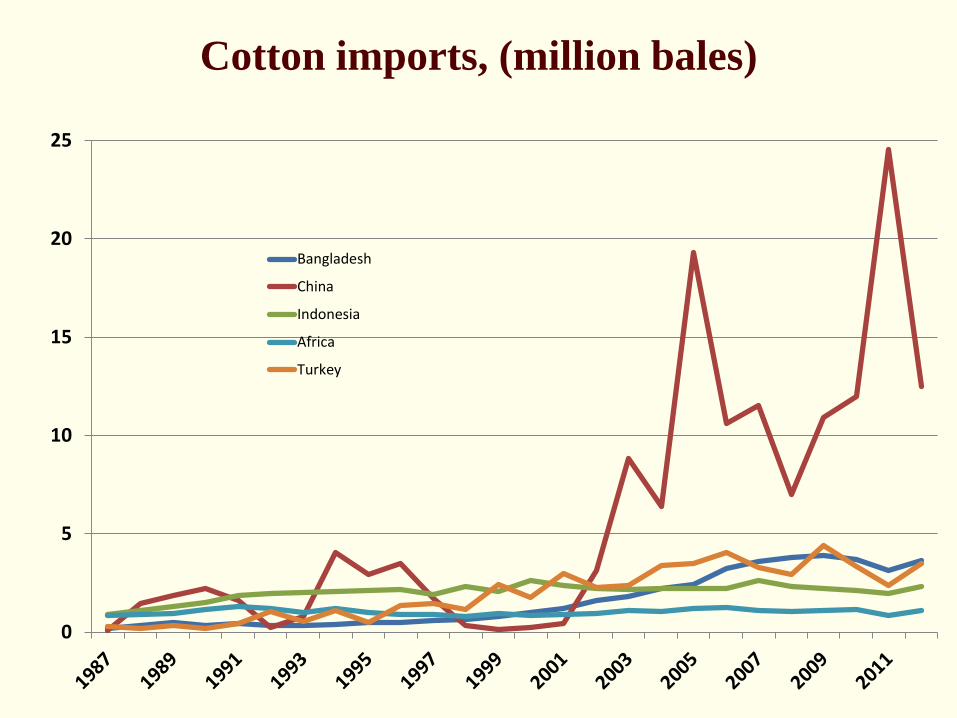
Bangladesh
China
Indonesia
Africa
Turkey
Cotton imports, (million bales)
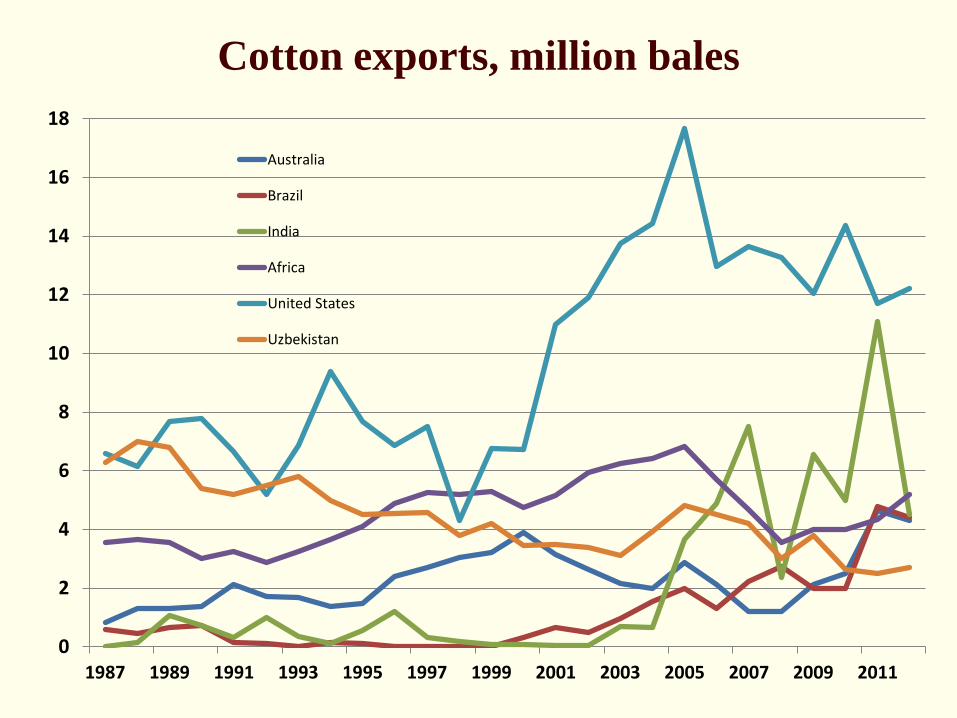
Cotton exports, million bales
0
2
4
6
8
10
12
14
16
18
1987 1989 1991 1993 1995 1997 1999 2001 2003 2005 2007 2009 2011
Australia
Brazil
India
Africa
United States
Uzbekistan

Cotton transport on U.S. farms
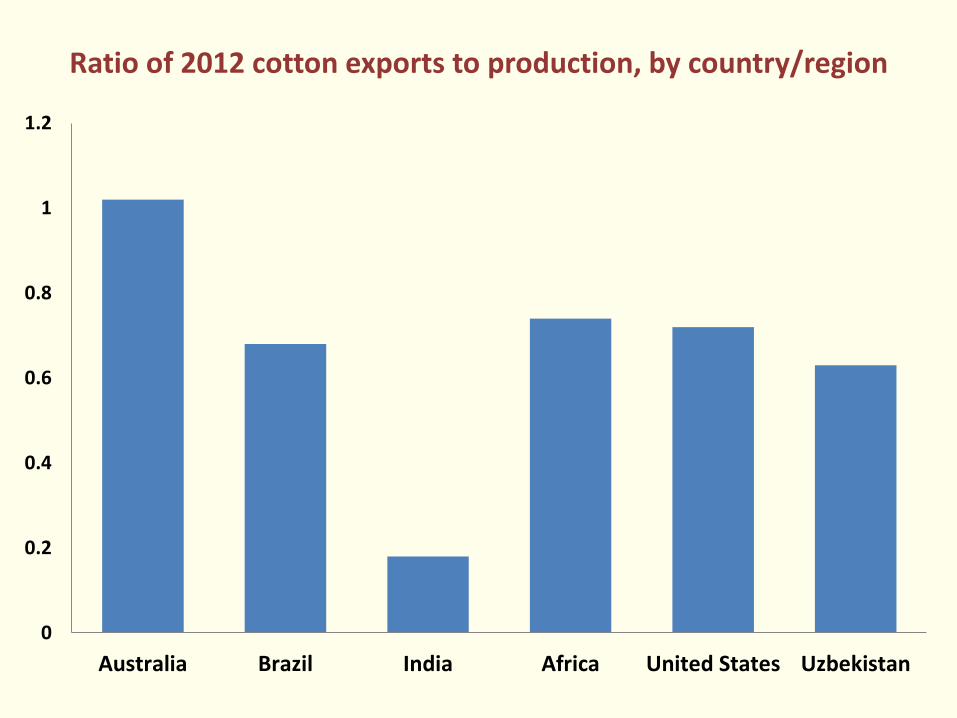
Ratio of 2012 cotton exports to production, by country/region
0
0.2
0.4
0.6
0.8
1
1.2
Australia Brazil India Africa United States Uzbekistan
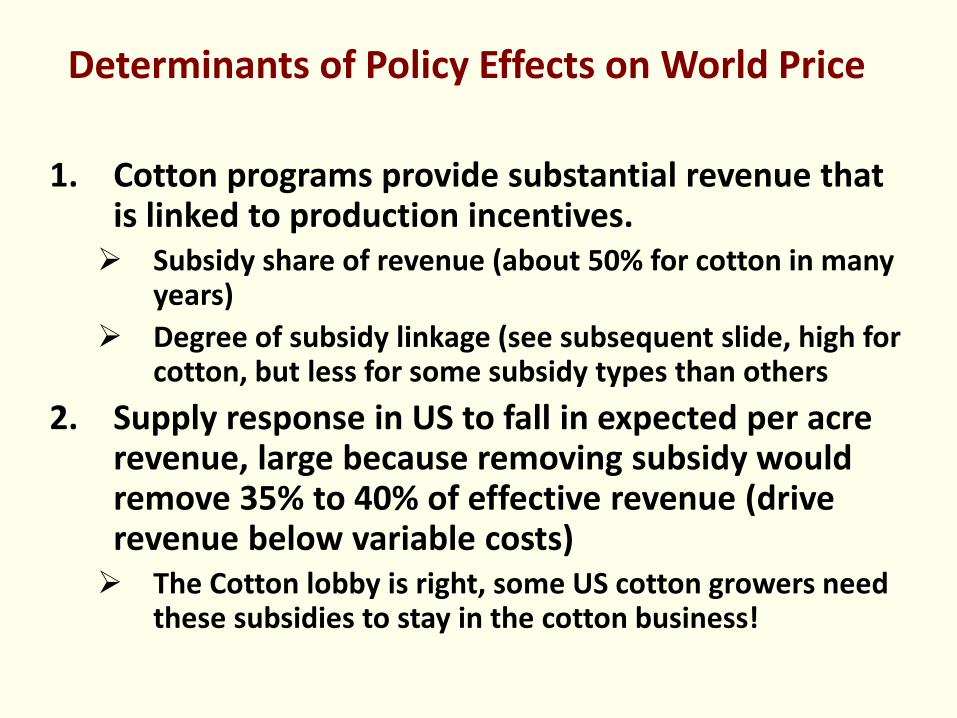
Determinants of Policy Effects on World Price
1. Cotton programs provide substantial revenue that is linked to production incentives. Subsidy share of revenue (about 50% for cotton in many
years) Degree of subsidy linkage (see subsequent slide, high for
cotton, but less for some subsidy types than others 2. Supply response in US to fall in expected per acre
revenue, large because removing subsidy would remove 35% to 40% of effective revenue (drive revenue below variable costs) The Cotton lobby is right, some US cotton growers need
these subsidies to stay in the cotton business!
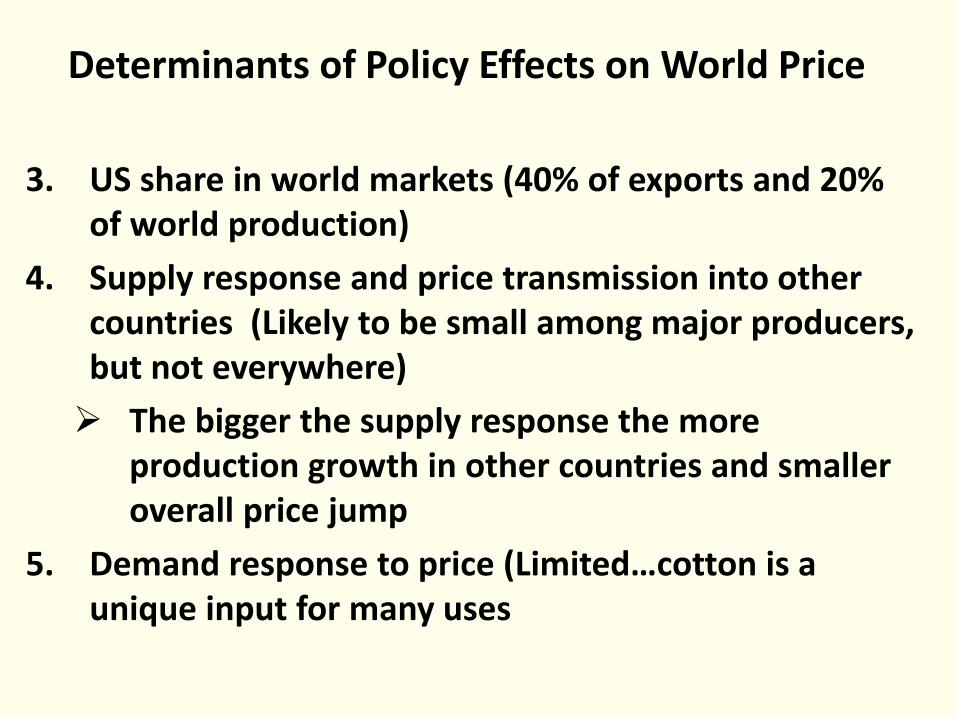
Determinants of Policy Effects on World Price
3. US share in world markets (40% of exports and 20% of world production)
4. Supply response and price transmission into other countries (Likely to be small among major producers, but not everywhere) The bigger the supply response the more
production growth in other countries and smaller overall price jump
5. Demand response to price (Limited…cotton is a unique input for many uses
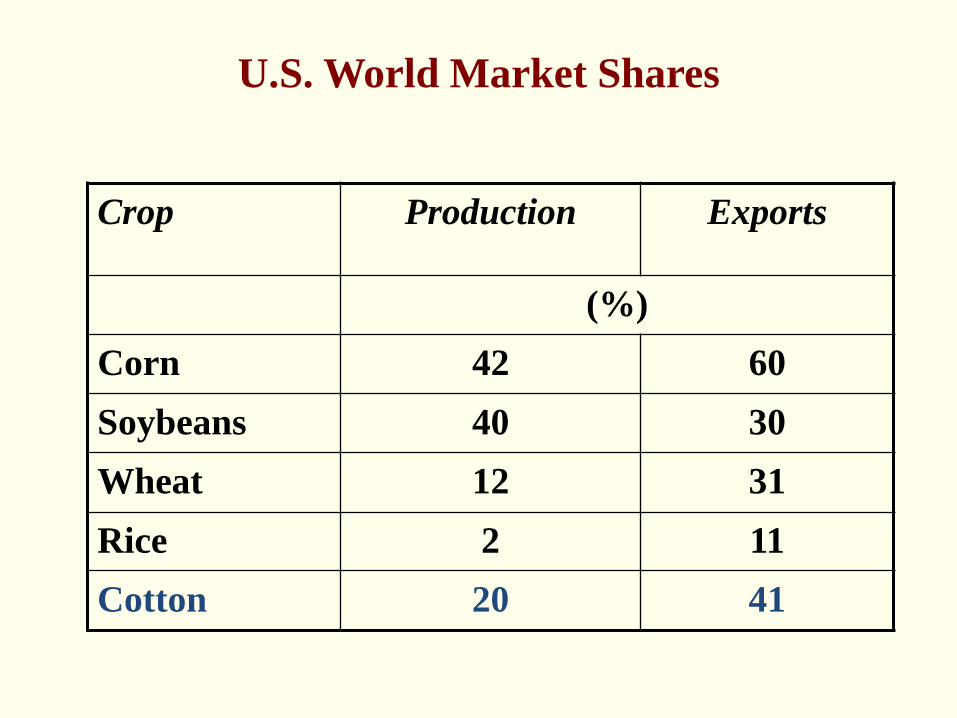
U.S. World Market Shares
Crop Production Exports
(%) Corn 42 60 Soybeans 40 30 Wheat 12 31 Rice 2 11 Cotton 20 41
(1 )%%(1 )
su u
su u su o
GP −δ ε −α ∆∆ =
δ ε α + −δ ε −η
.
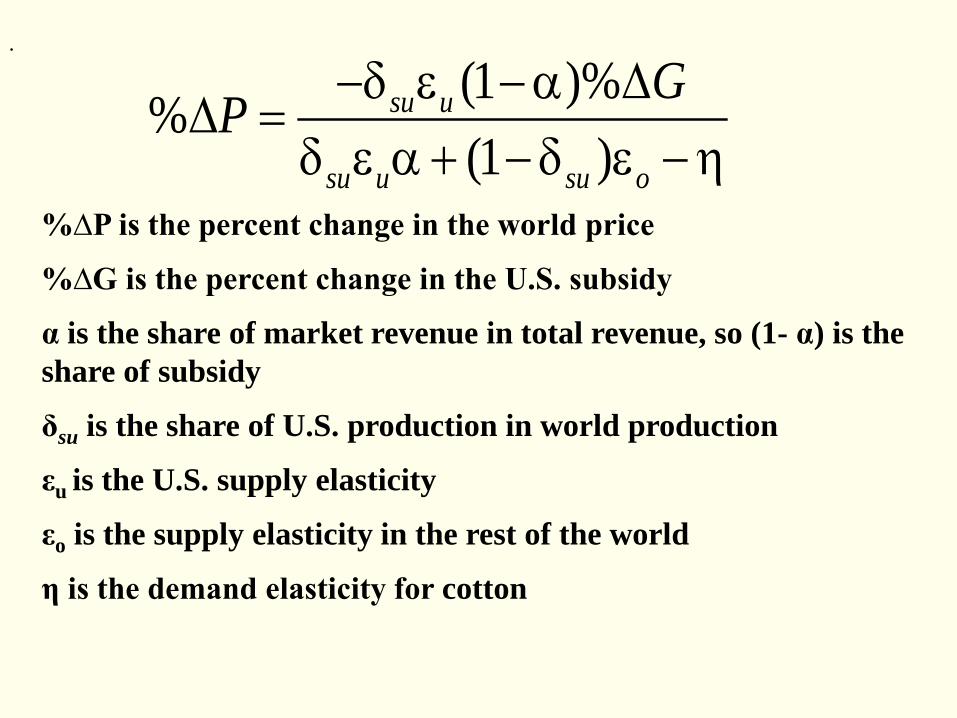
%∆P is the percent change in the world price
%∆G is the percent change in the U.S. subsidy
α is the share of market revenue in total revenue, so (1- α) is the share of subsidy
δsu is the share of U.S. production in world production
εu is the U.S. supply elasticity
εo is the supply elasticity in the rest of the world
η is the demand elasticity for cotton
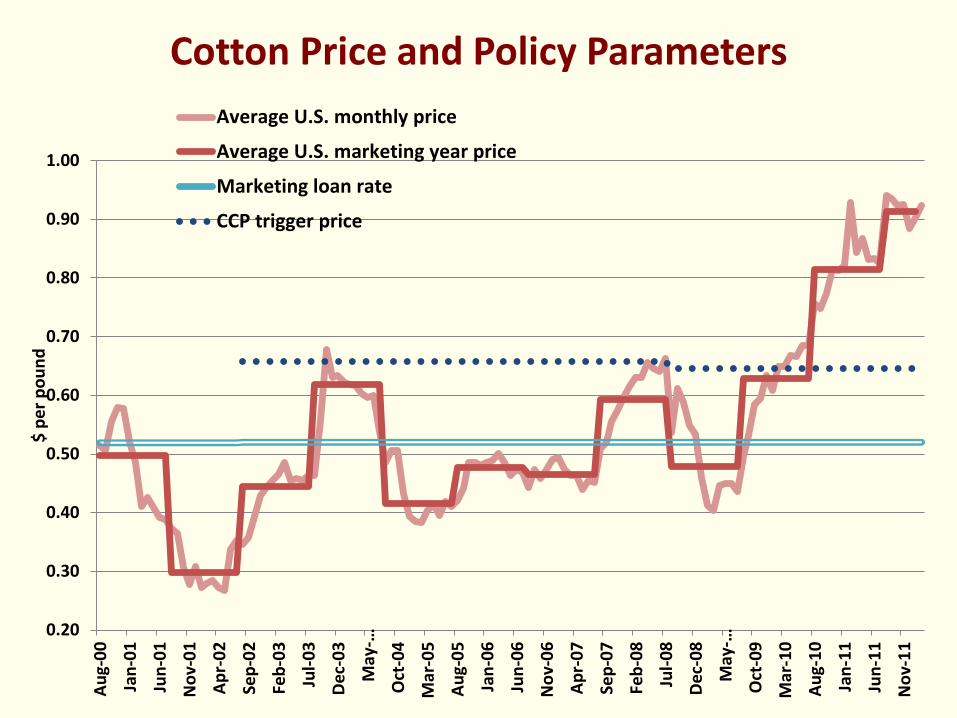
Cotton Price and Policy Parameters
0.20
0.30
0.40
0.50
0.60
0.70
0.80
0.90
1.00
Aug-
00
Jan-
01
Jun-
01
Nov
-01
Apr-
02
Sep-
02
Feb-
03
Jul-0
3
Dec-
03
May
-…
Oct
-04
Mar
-05
Aug-
05
Jan-
06
Jun-
06
Nov
-06
Apr-
07
Sep-
07
Feb-
08
Jul-0
8
Dec-
08
May
-…
Oct
-09
Mar
-10
Aug-
10
Jan-
11
Jun-
11
Nov
-11
$ pe
r pou
nd
Average U.S. monthly price
Average U.S. marketing year price
Marketing loan rate
CCP trigger price

Program 2000 2002 2003 2004 2006 2008 2010
Production Flexibility Contract payments 575 451 0 0 0 0 0
Direct payments 0 0 477 622 575 574 589
Counter Cyclical payments 0 0 1,264 217 1,410 267 890
Market Loss Assistance payments 612 0 0 0 0 0 0
User Marketing (Step 2) payments 236 177 416 544 350 0 0
Marketing Loan Program benefits 531 2,550 891 193 1,189 1 9
Crop insurance subsidy 426 277 279 79 119 91 129
Total support 2,380 3,455 3,326 1,655 3,644 932 1,617
Government payments for cotton by fiscal year and program

Economic modeling and the basic result
I examined dozens of scenarios in an economic simulation model
• Basic result without the cotton programs, U.S.
exports of cotton would have been lower by about 40 percent, and global prices of cotton would have increased by about 10 percent depending on the year and subsidies included.
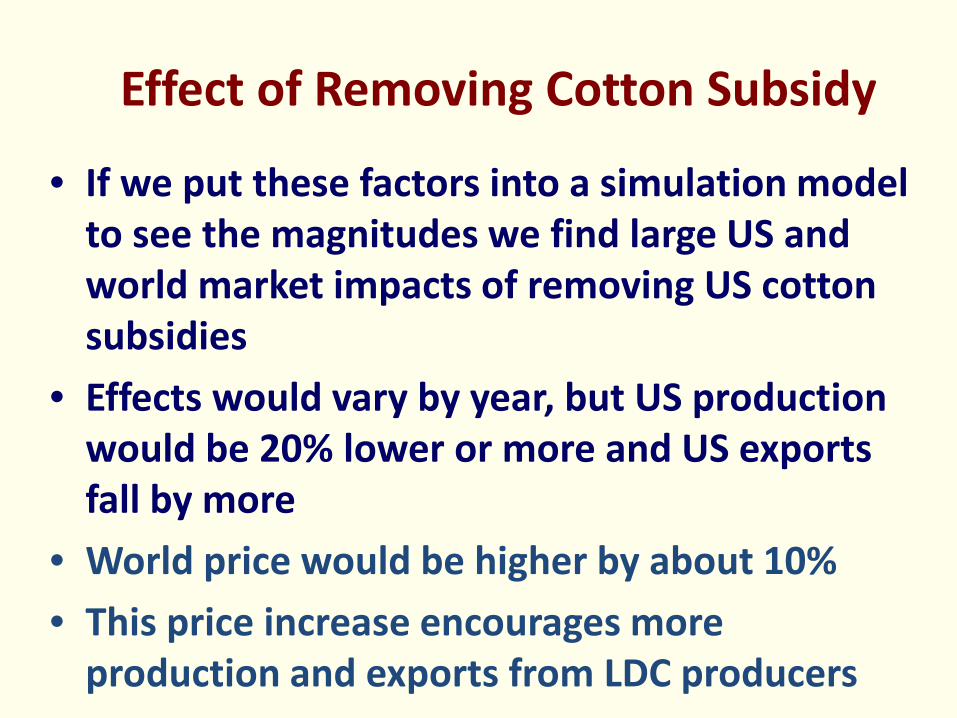
Effect of Removing Cotton Subsidy
• If we put these factors into a simulation model to see the magnitudes we find large US and world market impacts of removing US cotton subsidies
• Effects would vary by year, but US production would be 20% lower or more and US exports fall by more
• World price would be higher by about 10% • This price increase encourages more
production and exports from LDC producers
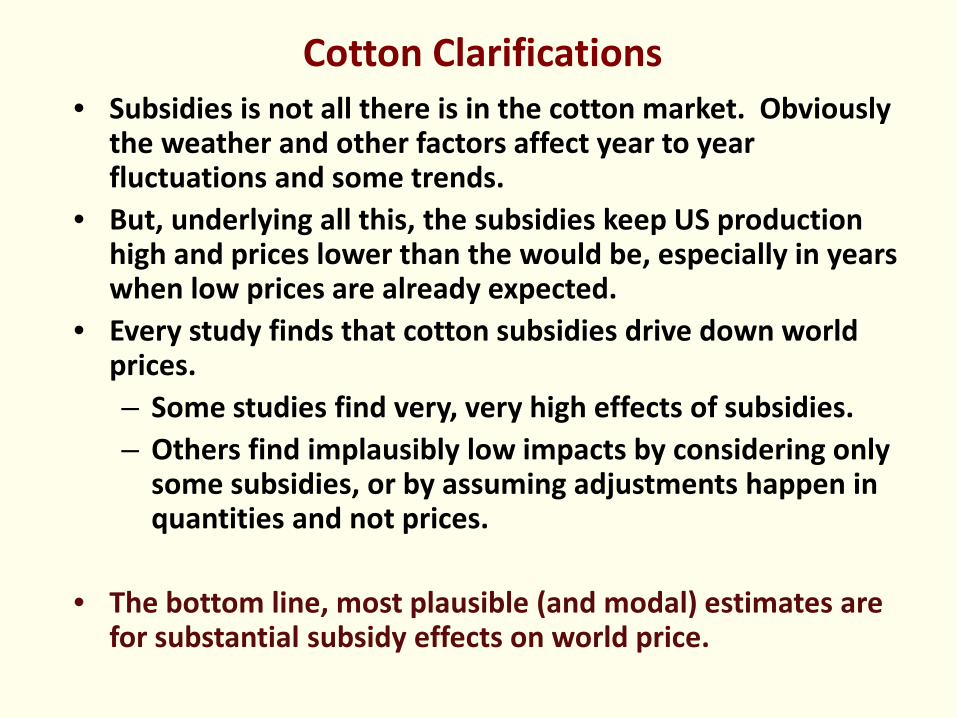
Cotton Clarifications • Subsidies is not all there is in the cotton market. Obviously
the weather and other factors affect year to year fluctuations and some trends.
• But, underlying all this, the subsidies keep US production high and prices lower than the would be, especially in years when low prices are already expected.
• Every study finds that cotton subsidies drive down world prices. – Some studies find very, very high effects of subsidies. – Others find implausibly low impacts by considering only
some subsidies, or by assuming adjustments happen in quantities and not prices.
• The bottom line, most plausible (and modal) estimates are for substantial subsidy effects on world price.

WTO cotton dispute rolls on • The WTO Panel and Appellate body ruled in favor of Brazil • The US government eliminated one program and claimed
they had done enough • Brazil asked the US to implement the WTO decision fully or
pay damages • After US failure to implement, the WTO awarded Brazil
rights to retaliate (withdrawal of concessions) • Finally Brazil agreed to temporarily postpone application of
withdrawal of concession in return for $147 million of payments per year from the U.S. government to Brazil to be used on behalf of the cotton industry
• But, the new 2013 farm bill renews the case and the US may claim that now it has done enough
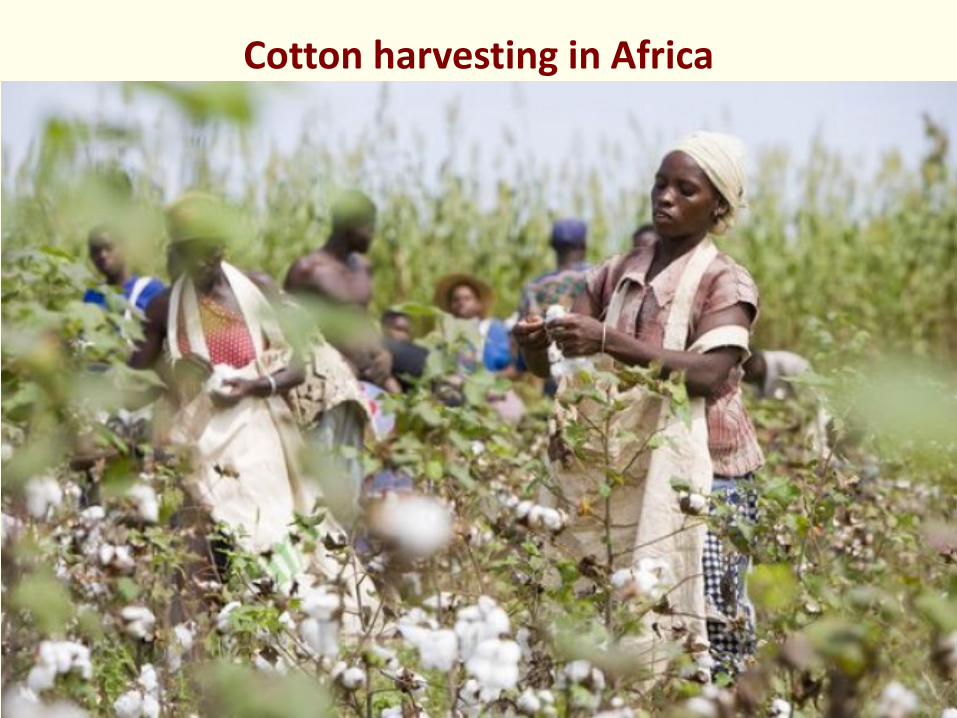
Cotton harvesting in Africa

Country
Value of agricultural
GDP
Agriculture’s share of GDP
Share of cotton of all agricultural
exports (2008)
Share of cotton of
all exports (2008)
Export value of cotton lint
(2008)
Production of cotton
(2010)
($ billions) (percent) ($ millions) (1000 480lb bales)
Benin 1.4 (2005) 32.2 30.4 13.1 136.9 375 Burkina Faso 1.9 (2006) 34.1 74.4 41.0 203.1 850
Cameroon 3.9 (2007) 19.5 7.3 1.6 70.0 275 Chad 0.8 (2008) 13.6 37.0 0.7 32.1 100
Ivory Coast 5.7 (2009) 24.4 1.8 0.8 80.4 400
Mali 2.3 (2007) 36.5 58.2 10.3 203.9 475 Nigeria
53.7 (2007) 32.7 2.7 0.0 23.0 475
Total, listed countries 69.7 749.4 2,950
Value of agricultural GDP, agriculture’s share of GDP, share of cotton in agricultural exports and all exports, and production of cotton in Africa
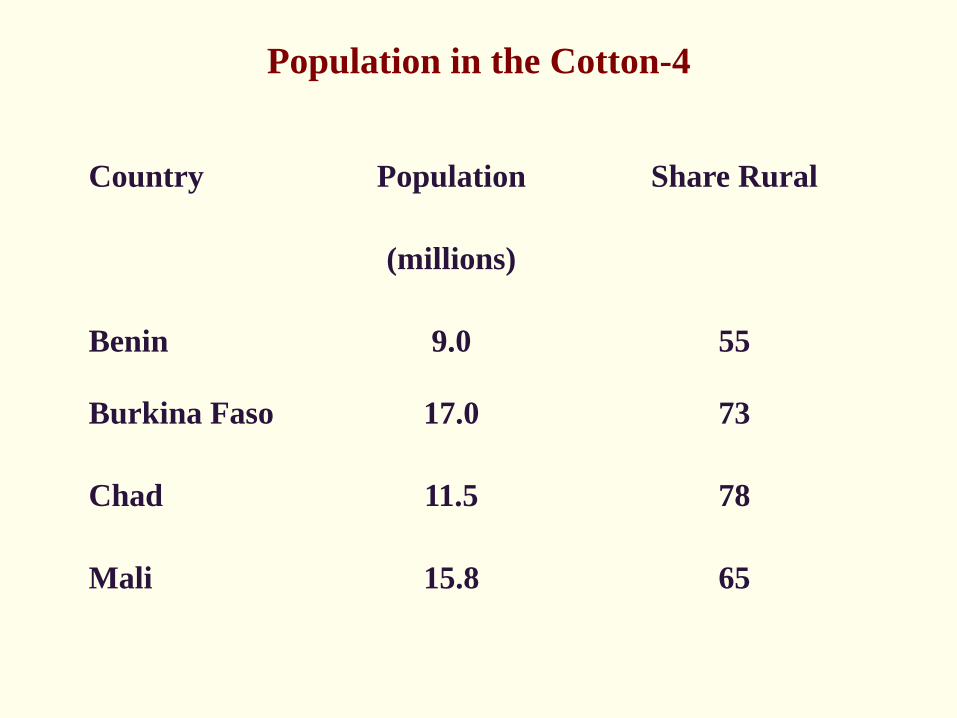
Population in the Cotton-4
Country Population Share Rural
(millions)
Benin 9.0 55
Burkina Faso 17.0 73
Chad 11.5 78
Mali 15.8 65
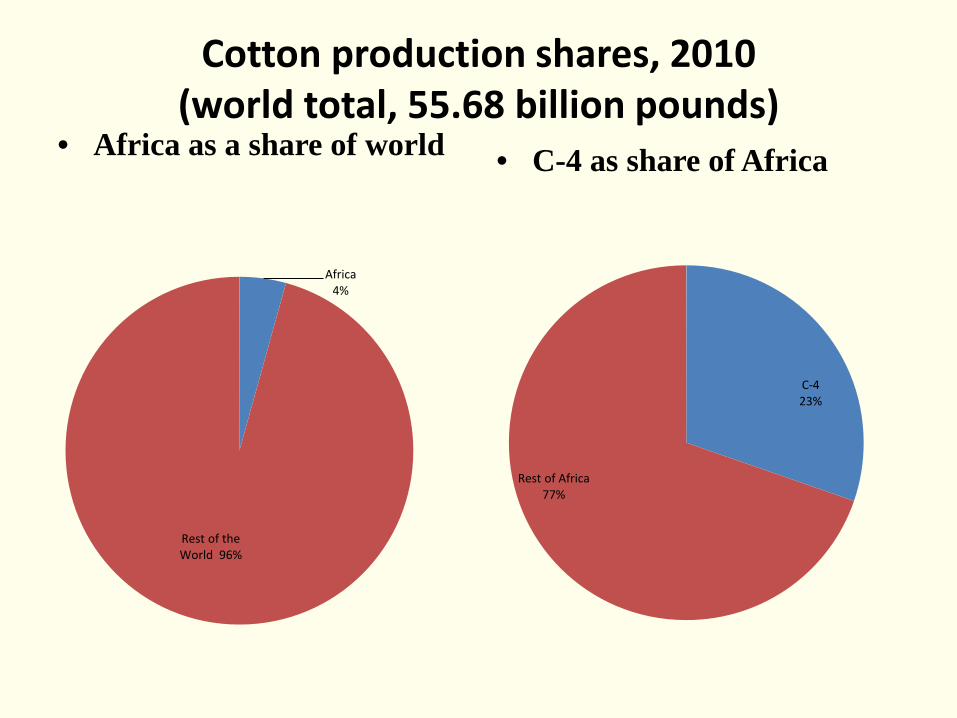
Cotton production shares, 2010 (world total, 55.68 billion pounds)
• Africa as a share of world • C-4 as share of Africa
Africa 4%
Rest of the World 96%
C-4 23%
Rest of Africa 77%

Cotton export shares, 2010 (world total, 17.04 billion pounds)
• Africa as a share of world • C-4 as share of Africa
Africa 10%
Rest of the
World 90%
C-4 27%
Rest of Africa 73%

Country Production of cotton
in 2006
Change in total revenue resulting from removal
of subsidies (1000 480lb bales) ( $ millions)
Benin 475 23.9 Burkina Faso 1,300 65.5 Cameroon 365 18.4 Chad 200 10.1 Ivory Coast 312 15.7 Mali 792 39.9 Nigeria 400 20.2 Other 167 12.0 Total 4,083 205.9
Cotton production and estimated effect of U.S. Cotton subsidies benefits on cotton revenues, by country
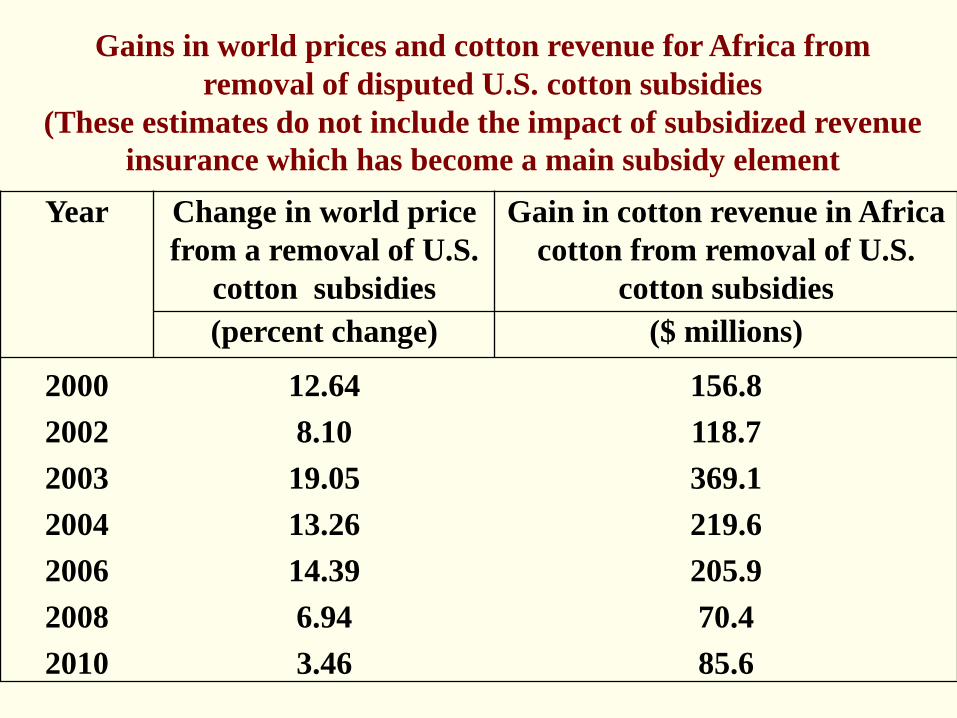
Year Change in world price from a removal of U.S.
cotton subsidies
Gain in cotton revenue in Africa cotton from removal of U.S.
cotton subsidies (percent change) ($ millions)
2000 12.64 156.8 2002 8.10 118.7 2003 19.05 369.1 2004 13.26 219.6 2006 14.39 205.9 2008 6.94 70.4 2010 3.46 85.6
Gains in world prices and cotton revenue for Africa from removal of disputed U.S. cotton subsidies
(These estimates do not include the impact of subsidized revenue insurance which has become a main subsidy element

• An outdoor advertisement for U.S. cotton in London that appeared during the final stages of the cotton dispute
• This ad was considered especially offensive by the African C-4, where farmers often try to live on one dollar per day
•
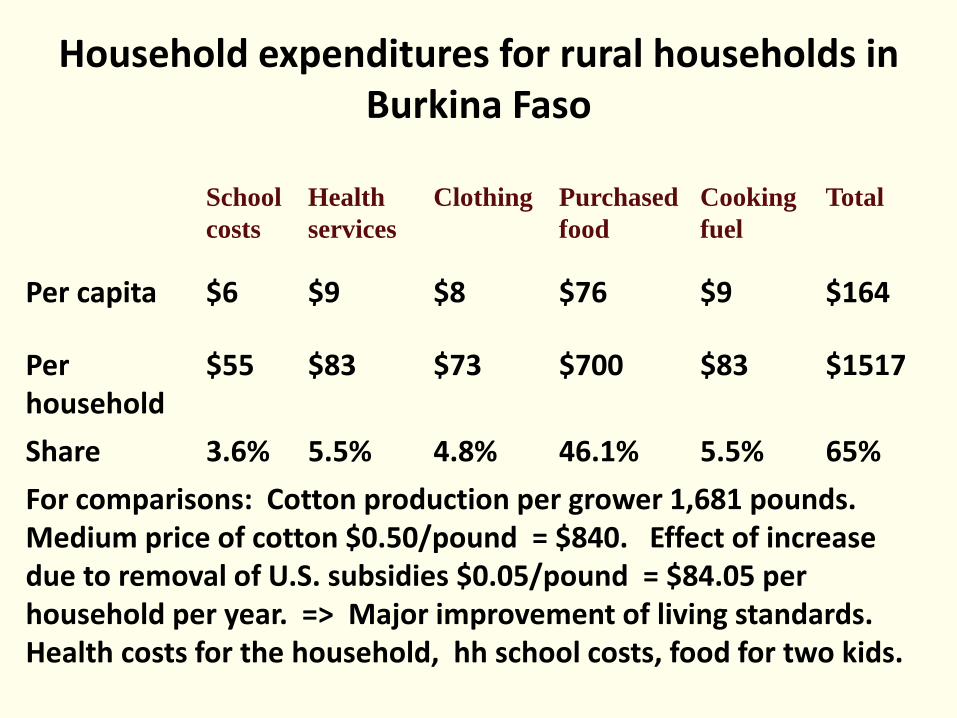
Household expenditures for rural households in Burkina Faso
School costs
Health services
Clothing Purchased food
Cooking fuel
Total
Per capita $6 $9 $8 $76 $9 $164
Per household
$55 $83 $73 $700 $83 $1517
Share 3.6% 5.5% 4.8% 46.1% 5.5% 65% For comparisons: Cotton production per grower 1,681 pounds. Medium price of cotton $0.50/pound = $840. Effect of increase due to removal of U.S. subsidies $0.05/pound = $84.05 per household per year. => Major improvement of living standards. Health costs for the household, hh school costs, food for two kids.

Cotton transport in Africa
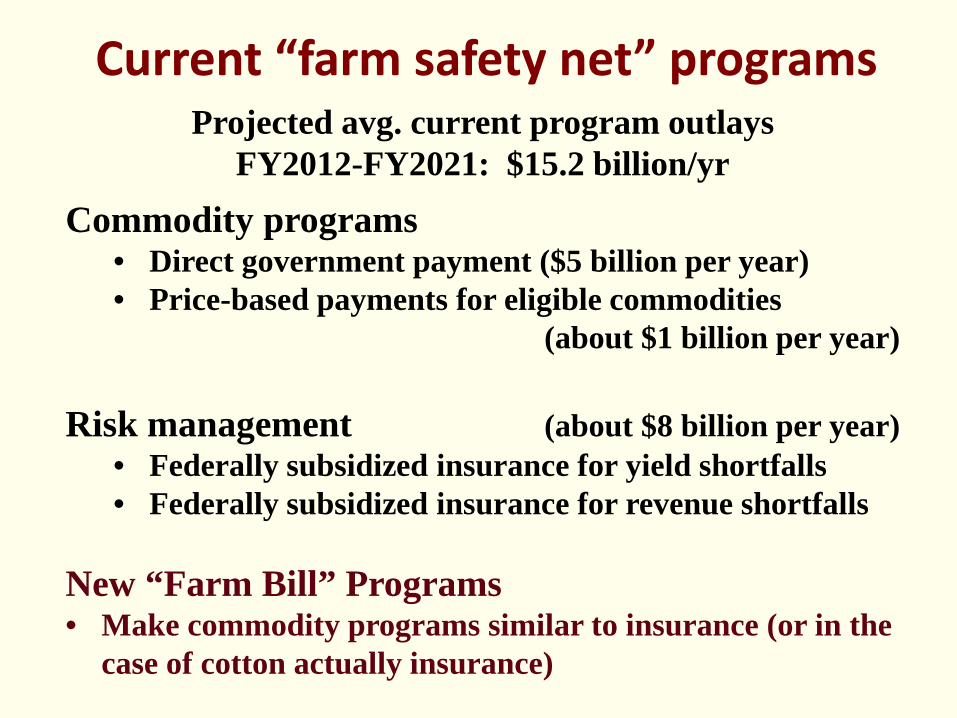
Current “farm safety net” programs Projected avg. current program outlays
FY2012-FY2021: $15.2 billion/yr Commodity programs
• Direct government payment ($5 billion per year) • Price-based payments for eligible commodities (about $1 billion per year)
Risk management (about $8 billion per year)
• Federally subsidized insurance for yield shortfalls • Federally subsidized insurance for revenue shortfalls
New “Farm Bill” Programs • Make commodity programs similar to insurance (or in the
case of cotton actually insurance)

Government costs of U.S. crop insurance, 2002 - 2011 (2012!!!)
0
2
4
6
8
10
12
2002 2003 2004 2005 2006 2007 2008 2009 2010 2011
Billi
on d
olla
rs
Total government costs
Premium Subsidy
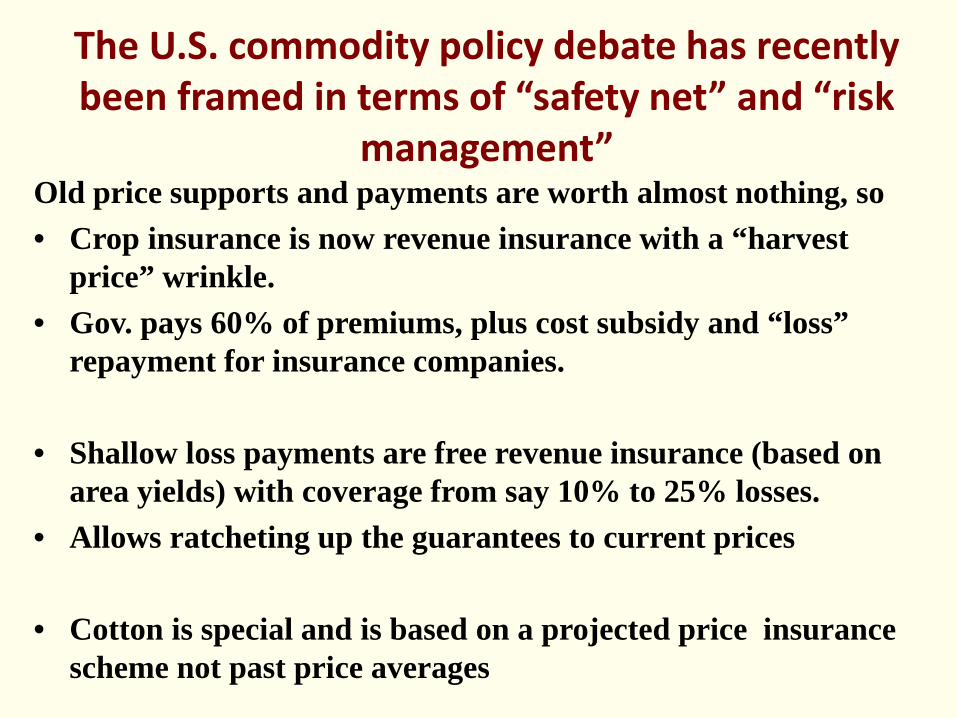
The U.S. commodity policy debate has recently been framed in terms of “safety net” and “risk
management” Old price supports and payments are worth almost nothing, so • Crop insurance is now revenue insurance with a “harvest
price” wrinkle. • Gov. pays 60% of premiums, plus cost subsidy and “loss”
repayment for insurance companies.
• Shallow loss payments are free revenue insurance (based on area yields) with coverage from say 10% to 25% losses.
• Allows ratcheting up the guarantees to current prices
• Cotton is special and is based on a projected price insurance scheme not past price averages
Current price-based programs are unlikely to pay much and direct payments are dead, so farm groups devised a new plan—”shallow loss revenue subsidy”
• Free revenue insurance for corn and other crops based on historical revenue
• Cotton has a STAX plan to pay when revenue is below expected and to maintain a price guarantee
• These subsidies do not include crop insurance and rise substantially in a ‘bad’ year.
• I estimate price suppression of around 5% in normal years and more when prices would already be low.

Many farm policies affect the world’s poor
• Many hurt poor farmers who compete with the US, • Some policies benefit poor consumers by lowering
food prices for some products • Backdoor protection is a growing issue with new
COOL and food safety regulation • US policy also seems to facility maintaining bad
policy in other countries • R&D in the US and in poor countries has the best
potential to improve the lot of poor consumers and poor farmers

Effects of US policy elsewhere with emphasis on impacts on the poor
• The effects on the worlds poor of US policies raise another set of reasons for a radical remake of US agricultural policy
• Vigilance to craft even handed regulations to avoid protection will be very hard.
• Attention to the poor entails elimination of many (almost all) current programs with an increase in R&D

FARMER FARMER?
TAXPAYER
