effects of dietary melamine and cyanuric - mospace
TRANSCRIPT


x
5.2. Effects of melamine on the gross appearance of organs…………………………...114 5.3. Effects of melamine and melamine plus cyanuric acid on the kidney of barrows...115 5.4. Crystals observed in the urine of pigs fed melamine and melamine plus cyanuric
acid……………………………………………………………………...………116 5.5. Effects of melamine plus cyanuric acid on the kidneys of young barrows………117 5.6. Microscropic effects of melamine in the kidney of barrows………………………118 5.7. Effects of melamine plus cyanuric acid on the kidney of young barrows…………119

xi
EFFECTS OF DIETARY MELAMINE AND CYANURIC ACID IN YOUNG PEKIN DUCKS AND WEANLING PIGS
Benjamin Robert Landers
Dr. David Ledoux, Thesis Advisor
ABSTRACT
In 2007 the intentional contamination of feed ingredients with melamine (MEL)
to artificially increase the calculated crude protein and thus monetary value of feed
ingredients lead to the deaths of cats and dogs across North America. It was later
documented that waste material from contaminated pet food was fed to swine and poultry
across the United States. To determine the effects of feeding MEL and cyrnauric acid
(CYA), a structural analog of melamine, three experiments were conducted to determine
the individual and combined effects of MEL and CYA on young Pekin ducks and
weanling pigs. In young Pekin ducks ≥ 1.00 % MEL caused a decrease in performance
and changes in serum chemistry values indicating renal failure. Up to 1.50% CYA did
not affect performance of young Pekin ducks and the addition of CYA to diets containing
MEL alleviated the negative effects of MEL. Lesions such as pale and enlarged kidneys
with crystals present in the lumina of the collecting ducts/tubules detected in ducks fed ≥
1.00 % MEL were similar to lesions documented in broilers, poults, and cats. In young
barrows, up to 1.25 % MEL did not cause changes in blood urea nitrogen or creatinine
levels, renal pathology, or mortality during the treatment period. However, levels ≥
1.00 % MEL did cause a reduction in body weight gain over the 21 day experimental
period. However, the combination of 0.75% MEL + 0.75% CYA caused barrows to have

xii
lower body weight gains than controls and higher blood urea nitrogen and creatinine
levels than controls. From the MEL residue data collected it appears that bile is a route of
elimination of MEL used by young Pekin ducks and weanling pigs (barrow). Samples of
kidney, muscle, and bile from the ducks and pigs were analyzed for MEL residue levels
via high-performance liquid chromatography (HPLC). Results of HPLC analyses
revealed the bile to have the highest concentration of MEL followed by the kidney and
finally the muscle, in both the duck and pig. The HPLC data also suggests that ingestion
of a combination of MEL and CYA leads to precipitation of a MEL-CYA complex in the
gastrointestinal tract that decreases the absorption of MEL into the body. This reduced
absorption reduces MEL residue levels in the muscle, bile, and kidney of ducks and
barrows.

1
CHAPTER 1
Introduction
In March of 2007, deaths related to renal failure were documented in dogs and
cats across North American and South Africa (Hilts and Pelletier, 2009). It was later
determined that wheat gluten imported from China and incorporated into the pet food was
contaminated with melamine and related compounds (cyanuric acid, ammeline, and
ammelide) (Byungghul et al., 2008). By April of 2007 some 100 different brands of dog
and cat food had been voluntarily recalled across the United States (FDA, 2007).
Approximately four months later the American Association of Veterinary Laboratory
Diagnosticians reported that some 347 cases met the criteria for “pet food-induced
nephrotoxicity” based on high concentrations of blood urea nitrogen and creatinine
(Burns, 2007).
Following the contamination of pet food, it was determined that waste material
containing melamine and/or cyanuric acid from pet food manufacturing was incorporated
into swine, poultry (Buur et al., 2008; Karbiwnyk et al., 2009; USDA, 2007a) and
aquaculture feeds (Karbiwnyk et al., 2009). After contamination of feeds with melamine
and related compounds was confirmed, all animals that had consumed the adulterated
feed were placed under quarantine (USDA, 2007a). However, after the testing of muscle
tissue and urine from these animals, USDA announced that poultry and swine products

2
from the animals were “not adulterated” and were able to be offered for slaughter
(USDA, 2007a).
Since the 2007 incidence of pet food contamination with melamine and related
analogs, several case reports and experiments have been published (Baynes et al., 2008;
Brand, 2011; Brown et al., 2007; Gonzalez et al., 2009; Reimschuessel et al., 2008; Stine
et al., 2011). In 2008, there were documentations of children in China treated for renal
complications after having consumed infant formula contaminated with melamine (Chan
et al., 2008; WHO, 2008a). Brand (2011) did considerable work on the individual and
combined effects of melamine and cyanuric acid in young broilers and poults. During
this Brand (2011) found that the addition of cyanuric acid to a diet containing melamine
caused less toxicity in poults than diet contaminated with only melamine. These results
are in contrast to results in mammals (dogs, cats, and pigs), where the combination of the
two compounds was found to be more toxic than either compound alone (Puschner et al.,
2007; Reimschuessel et al., 2008; Stine et al., 2011).
The objectives of the current thesis were to document the individual and
combined effects of melamine and cyanuric acid in young Pekin ducks and weanling pigs
(barrows). Additionally, the studies presented in the current thesis were used to
determine melamine concentrations in the kidney, muscle, and bile of young Pekin ducks
and weanling pigs fed dietary treatments for 21 days. A final objective was to determine
if mammals used bile as a route to eliminate melamine from their bodies; a process
reported to occur in poultry by Brand (2011).

3
CHAPTER 2
Literature Review
Chemical Properties and Applications:
Melamine (2,4,6-triamino-1,3,5-triazine) is a white, crystalline powder (OSHA,
2006; SafetyData, 2008) that was first synthesized by Liebig in 1834 (Zhang et al., 2007).
It is a small polar molecule (Baynes et al., 2008) with a molecular formula of C3H6N6
(OSHA, 2006; SafetyData, 2008). Due to the presence of several basic amino groups it
has a PKb of 9.0 (Baynes et al., 2008) and melting point of 345º C (SafetyData, 2008).
Figure 2.1. depicts the structure of melamine with its three ring N atoms and three amino
groups which enables melamine to act as both a hydrogen-bond donor and acceptor
(Zhang et al., 2007), thus enabling it to form extensive hydrogen bonds (Colombo et al.,
1985).
Commercial production of melamine involves heating dicyandiamide or urea in
the presence of ammonia (Tyan et al., 2009). Bizzari and Yokose (2008) reported that
approximately 1.2 million tonnes of melamine was produced worldwide in 2007, with
China being the largest producer and consumer. Applications of melamine include use in
manufacturing of plastics, adhesives, laminates, paints, permanent-press fabrics, flame
retardants, textile finishes, tarnish inhibitors, paper coating, and fertilizer mixtures (Hilts
and Pelletier, 2009). Cyromazine is an example of a chemical insecticide that contains
melamine and acts as an insect growth regulator (Chou et al., 2003). It is used for feed-

4
through fly control in caged layers (Chou et al., 2003) and is usually incorporated into
laying hen diets at 0.50 parts per million (ppm) (Agrochemicals, 1993). Though it is a
highly effective pesticide, it can potentially be degraded to melamine (Chou et al., 2003).
While melamine has wide spread use in manufacturing, fertilizers, and pesticides,
it is not approved for use in animal feed (Lee et al., 2011) or human food (CDC, 2008);
however, melamine is a known contaminant of both (Bhalla et al., 2009; Tyan et al.,
2009). Contamination of food and feeds can occur through several different routes
including: 1) trace levels of melamine found in the environment contaminating the food
chain; 2) the accidental contamination of animal feed or human food that have been
treated with products that contain melamine, such as fertilizer and pesticides; 3) the
leaching of melamine monomers from plastic and tableware products; 4) or adulteration
which is “the intentional addition of melamine or its analogues directly to food, food
ingredients, animal feed, feed ingredients, or pelletizing agents” (Hilts and Pelletier,
2009). Individuals intentionally adulterate feed and food with melamine because of
melamine’s high nitrogen content, 66% by mass (Yang et al., 2009). This high nitrogen
content gives an invalid estimate of protein content when the Kjeldahl method is used for
protein analysis (Yang et al., 2009). Thus, feedstuff contaminated with melamine
appears to have a crude protein (CP) content that is not representative of the amino acid
content of the feedstuff (WHO, 2008a).
Cyanuric acid, along with ammeline and ammelide, are structural analogues of
melamine (Tyan et al., 2009; WHO, 2008a) and all belong to the class of chemicals
known as s-triazines (Wackett et al., 2002) (Figure 2.1.). Hydrolysis or amination of one
s-triazine can result in the production of another s-triazine; the pathway through which

5
this occurs is depicted in Figure 2.2 (Baynes and Riviere, 2010). Jutzi et al. (1982)
showed that degradation of melamine can occur by bacterial degradation. Filigenzi et al.
(2007) stated that there is no known metabolism of melamine in mammals. However,
Baynes and Riviere (2010) suggest that bacterial degradation might occur in the
gastrointestinal tract or biological fluids.
Cyanuric acid is a crystalline powder (MSDS, 2010) with many common uses
including its use in swimming pools (WHO, 2008b). Sodium dichloroisocyanurate is
commonly used in swimming pools to disinfect water, and as it dissolves several
compounds can be released including isocyanuric acid (Hilts and Pelletier, 2009).
Cyanuric acid is not approved by the United States Food and Drug Administration
(USFDA) for use as a non-protein nitrogen source in poultry or swine feed, but is
approved for use in ruminant feed as a component of feed-grade biuret (Hilts and
Pelletier, 2009; WHO, 2008b). Human exposure to cyanuric acid can occur by
swallowing pool water, consuming contaminated drinking water, or consumption of fish
which can accumulate the chemical (WHO, 2008b).
There are several possible routes by which a feedstuff can be contaminated by
both melamine and cyanuric acid or a related compound. The first is through the
intentional adulteration of a feedstuff with both compounds (WHO, 2008a). Another
route is through bacterial degradation of melamine to cyanuric acid or other structurally
related compounds (Jutzi et al., 1982). Degradation can also occur after or during
production of melamine, resulting in a powder that is contaminated with melamine and
other related analogs (Dobson et al., 2008). Therefore, there exist several possible routes

6
by which both melamine and related compounds can be found in biological systems
simultaneously.
Toxicity:
Melamine, when individually consumed, has a low acute toxicity in mammals
(FDA, 2009; WHO, 2008b). Melnick et al. (1984) determined the LD50 of melamine in
rats to be 3,161 mg/kg body weight (BW). During the Melnick et al. (1984) study, an
increase of bladder stones and hyperplasia was observed in rats fed 4500 ppm of
melamine for 13 weeks. During a chronic 105 week study, Melnick et al. (1984)
observed chronic inflammation in the kidneys of rats fed melamine. However, no toxic
effects were observed in research conducted on dogs, cats, or swine by Lipschitz and
Stockey (1945), Puschner et al. (2007), or Stine et al. (2011), respectively.
Additional reports have suggested that melamine can combine with uric acid to
form insoluble compounds (Grases et al., 2009; Ogasawara et al., 1995). Grases et al.
(2009) examined a calculus removed from the bladder of an 11-month-old girl that
consumed baby formula contaminated with melamine. The calculus exhibited Fourier
transform infrared (FTIR) spectra and scanning electron microscopy features that were
identical to those of a melamine-uric acid crystal that was prepared in vitro (Grases et al.,
2009). Further in vitro testing by Grases et al. (2009) revealed that at pH values less than
5.0, melamine and uric acid form insoluble compounds, “probably with a structure
similar to that of the insoluble compound formed between melamine and cyanuric acid.”
A report published by the World Health Organization (WHO) (WHO, 2008a) stated that
preliminary research by the USFDA showed that chickens, which excrete large amounts

7
of uric acid, form spherulites that are presumably composed of melamine-urate crystals
that can dissolve quickly in formalin.
With the exceptions of humans, some primates, birds, and most vertebrates
produce an enzyme, urate oxidase, which catabolizes uric acid to allantoin (Wu et al.,
1989). Absence of this enzyme in humans causes serum uric acid levels to be 10 to 20
times higher compared to other mammals that express the enzyme (WHO, 2008a).
Therefore, doses of melamine needed to produce melamine-uric acid stones in rats and
other experimental animals may be higher than what is needed in humans (WHO, 2008a).
Johnson et al. (1969) showed that rats with impaired uric acid oxidase have a higher
probability of crystal formation in uric acid nephropathy. Additionally, a report in
Pediatric Environmental Health Specialty Units (PEHSU) (PEHSU, 2009) stated that
infants have lower glomerular filtration rates as compared to older children, possibly
resulting in lower flow rate of urine through the tubules (PEHSU, 2009). Lower flow
rate could possibly allow co-crystallization to occur between melamine and uric acid.
PEHSU (2009) also reported that infants excrete uric acid into their urine at a greater rate
than older children. This is supported by unpublished data from China that showed renal
stones from infants consuming melamine contaminated formula to be comprised of
melamine and uric acid in a 1.2:1 to 2.1:1 molar ration with no cyanuric acid present
(WHO, 2008a).
Cyanuric acid, like melamine, has a low acute toxicity in mammals (OECD,
1999). Several experiments have shown that ingestion of cyanuric acid can cause renal
damage, such as necrosis of the tubular epithelium, increased basophilic tubules,
mineralization, and dilatation of the renal tubules (OECD, 1999). However, the LD50 for
8
cyanuric acid in rats is relatively high at 7,700 mg/kg BW (OECD, 1999). The no-
observed-adverse-effect-level (NOAEL) for cyanuric acid was determined to be 150
mg/kg/day for male and female rats (OECD, 1999).
The high LD50’s for melamine and cyanuric acid, when consumed alone, suggest
that separately they are relatively nontoxic (Gonzalez et al., 2009). However, recent
studies and case reports have demonstrated that the simultaneous consumption of both
compounds is toxic to mammals even at low doses (Nilubol et al., 2009; Puschner et al.,
2007; Reimschuessel et al., 2008). Stine et al. (2011) determined the NOAEL for pigs fed
melamine and cyanuric acid in combination for 28 days to be 1.0 mg/kg BW/day, or
approximately 25 mg/kg of each compound in the diet. However, research conducted by
Brand (2011), suggested that in young birds the combination of melamine and cyanuric
acid is less toxic than in companion animals. Brand (2011) stated that the addition of
cyanuric acid to melamine contaminated diets was able to alleviate the negative effects
that were observed in poults that consumed melamine alone.
Increased toxicity from consumption of both melamine and cyanuric acid comes
from the ability of melamine and cyanuric acid to self-assemble and form a hydrogen-
bonded bimolecular network (Perdigao et al., 2006). Self-assembley can lead to the
formation of insoluble compounds that can precipitate in the kidneys, leading to renal
failure (Seffernick et al., 2010). Dobson et al. (2008) observed that melamine cyanuric
acid crystals were present in contaminated wheat gluten and were not disrupted by
processing. Tolleson (2009) indicated that lower pH levels, such as those present in the
digestive tract, increases the solubility of melamine and cyanuric acid. This enhanced
solubility facilitates increased absorption from the gastrointestinal tract (Tolleson, 2009).

9
Due to the different pKa’s of the compounds, 6.9 for cyanuric acid and 5.0 for melamine,
it is probable that the acid is absorbed in the stomach while the base is absorbed in the
small intestine (Dobson et al., 2008). Different sites of absorption would explain why the
two compounds do not recombine after leaving the stomach and entering an environment
with a higher pH (Dobson et al., 2008).
After absorption, the compounds are evenly distributed throughout total body
water (Hammond et al., 1986; Lipschitz and Stockey, 1945), but only precipitate out in
the kidneys (Dobson et al., 2008). Dobson et al. (2008) proposed several explanations as
to why crystal formation only occurs in the kidney: 1) recombination does not occur until
concentrations of the compounds exceeds a critical point, which could occur as the
compounds move down the osmotic gradient in the kidneys; 2) melamine and cyanuric
acid interfere with uric acid metabolism, which would precipitate in the tubules and
become a substrate for melamine and cyanuric acid to precipitate.
Tolleson (2009) reported that renal calculi were commonly detected in the distal
tubles, collecting ducts of pets, or the entire nephron in laboratory animals fed 400 mg/kg
of melamine plus cyanuric acid. Tolleson (2009) went on to suggest several different
pathways for renal failure to occur in association with triazine nephrotoxicity. The first is
classified as post-renal, and relates to urinary obstruction downstream from the
glomerulus that interfers with renal output. The second is classified as pre-renal, and
involves restriction of afferent blood flow to the glomeruli by decreaed cardiac output,
decreased arterial blood pressure, hypovolemia, thromboembolism, or arteriosclerosis.
Finally, Tolleson (2009) stated the nephrotoxicity could be associated with renal damage,
10
in which kidney cells are damaged by local ischemia, oxidative stress, or direct
cytotocixity leading to cellular death.
Background Issue:
Pet Food:
In March of 2007, deaths related to renal failure were documented in dogs and
cats across North America and South Africa (Hilts and Pelletier, 2009; WHO, 2008a).
Investigation into the deaths revealed that pet food consumed by affected animals was
contaminated with melamine and related analogs (Byungghul et al., 2008). It was later
reported that wheat gluten imported from China and incorporated into the pet food was
contaminated with melamine and other similar compounds (AVMA, 2007; Brown et al.,
2007; Burns, 2007). The intentional contamination of wheat gluten with melamine was
done in an attempt to artificially increase the crude protein content of wheat gluten,
allowing it to pass for a more valuable feedstuff (Hilts and Pelletier, 2009). Analysis of
some 200 pet food samples revealed melamine concentrations ranging from 0 to 2,263
mg/kg (Cianciolo et al., 2008). Cyanuric acid was also found in many of the pet foods at
levels greater than 10 mg/kg (Hilts and Pelletier, 2009). The USFDA estimated that
contaminated wheat gluten contained between 0.2 and 9 % melamine (Hilts and Pelletier,
2009).
By April of 2007 some 100 different brands of dog and cat food had been
voluntarily recalled across the United States (FDA, 2007). Approximately four months
later the American Association of Veterinary Laboratory Diagnosticians (AAVLD)
reported that 347 cases met the criteria for “pet food-induced nephrotoxicity” based on
11
high concentrations of blood urea nitrogen (BUN) and creatinine (Burns, 2007). Of
these reported cases, 235 involved cats and 112 involved dogs, with mortality occurring
in 61 and 74 % of cats and dogs, respectively (Burns, 2007). It was later discovered that
deaths in 2007 were not the first associated with melamine toxicity (Bhalla et al., 2009).
In 2004, pet deaths occurring in Asia related to food consumption was attributed to
mycotoxicosis. However, reevaluation of necropsies showed identical clinical,
histological, and toxicology findings as the pets involved in the 2007 melamine incident.
These similar findings suggest that the 2007 incident was not the first time feed had been
contaminated with melamine (Brown et al., 2007).
Production Animal Feed:
Following the contamination of pet food, it was determined that waste material
containing melamine and/or cyanuric acid from pet food manufacturing was incorporated
into swine, poultry, (Buur et al., 2008; Karbiwnyk et al., 2009; USDA, 2007a) and
aquaculture feed (Karbiwnyk et al., 2009). When pet food scraps are used in swine diets
it usually comprises 5 to 10 % of the diets (Hilts and Pelletier, 2009). However, it was
found that some hogs were fed feed that contained 50 to 100% pet food scraps (Hilts and
Pelletier, 2009). Bakery meal usually contains pet food scraps and can be included in
poultry rations between 3 and 15% (Hilts and Pelletier, 2009). Testing by the United
States Department of Agriculture (USDA) and other private labs revealed melamine and
related analogs in 56 samples of pet food scraps, 27 samples of bakery meal, 17 samples
of swine feed, 21 samples of poultry feed, and 7 samples of fish feed (Hilts and Pelletier,
2009). With the limit of detection (LOD) set at 50 parts per billion (ppb), melamine was
12
found in concentrations up to 1,952, 59.6, 120, and 400 mg/kg in pet food scraps, bakery
meal, swine feed, and fish fed, respectively (Hilts and Pelletier, 2009). Cyanuric acid
was found at levels as high as 2,180, 146.3, 22.2, and 2.63 mg/kg in pet food scraps,
bakery meal, swine feed and poultry feed, respectively (Hilts and Pelletier, 2009).
After it was confirmed that contaminated feed was fed to swine and poultry, the
USDA Food Safety and Inspection Service (FSIS) stated “that risk to human health from
consuming pork or poultry products from these animals was likely to be very low”
(USDA, 2007a). However, the FSIS could not be sure that products from swine and
poultry that had consumed contaminated feed was not itself contaminated (USDA,
2007a). Therefore, in cooperation with state and local producers, all animals that had
consumed feed contaminated with melamine or related compounds were placed under
quarantine (USDA, 2007a).
For example, on April 18th, 2007, a 1,500 head swine farm in California was
placed under quarantine when urine from swine tested positive for melamine (CDFA,
2007). During the time of quarantine the FSIS analyzed urine and muscle tissues from
animals that had consumed contaminated feed. Analysis of these samples allowed for a
relationship to be drawn between the level of melamine in the feed and levels in animal
tissues. Melamine was found below the LOD of 50 ppb in all poultry and swine tissues
tested, even in pigs that had consumed diets that contained pet food scraps at levels
between 50 and 100% (Hilts and Pelletier, 2009). The highest level of melamine in
swine urine was 2,220 mg/kg and the levels decreased as time from exposure to
melamine increased (Hilts and Pelletier, 2009). On May 15th, 2007, after analyzing tissue
samples, the USDA FSIS stated “that there is very low risk of harm to humans from

13
eating food containing low levels of melamine or related compounds” (USDA, 2007b).
The FSIS explained that in a worst case scenario if all the food a person ate in one day
contained melamine and cyanuric acid at levels potentially present in the meat, the
possible exposure would be about 250 times lower than the dose considered safe (USDA,
2007b). On the same day, the USDA announced that poultry and swine products from
animals that had consumed contaminated feed were “not adulterated” and were able to be
offered for slaughter (USDA, 2007a).
Human Food:
In September 2008, China reported that some 52,875 children had been treated for
renal complications, after having consumed infant formula and other related dairy
products that were contaminated with melamine (Chan et al., 2008; WHO, 2008a). By
November of 2008 some 294,000 infants had been affected, with more than 50,000
hospitalized and six reported deaths (WHO, 2008a). It was determined that melamine
was used to artificially increase the crude protein of milk that was used in the production
of infant formula (PEHSU, 2009; WHO, 2008a). This contamination raised concerns
across the United States, since formula manufactured in Asia was available for sale in the
U.S. (PEHSU, 2009).
A 2009 publication for pediatric health professionals (PEHSU, 2009), stated that
infants are more vulnerable to melamine induced renal failure due to several factors. One
being that formula is the primary food source of most infants, as compared to older
children who will eat a variety of food, thus receiving less melamine per unit of body
weight than infants. Infants also have smaller lumens in their urinary tract, which can

14
more easily become irritated by urinary stones. Finally, infants have a lower glomerular
filtration rate and higher levels of uric acid in their urine (PEHSU, 2009). Ogasawara et
al. (1995) and PEHSU (2009) suggested that uric acid might form crystals with melamine
in infants.
During the 2008 China incident documented clinical signs of melamine toxicity
included irritability, vomiting, fever, hematuria, dysuria, oliguria, anuria, high blood
pressure, oedema, and pain in the kidney areas (WHO, 2008a). Multiple stones were
reported and typically occurred without clinical signs. An eight-month-old female who
had consumed contaminated infant formula for 15 days presented with multiple stones in
both kidneys (WHO, 2008a). Unpublished data released by the Chinese showed that
these renal stones were composed of melamine and uric acid in a 1.2:1 to 2.1:1 molar
ratio, with no cyanuric acid present in the stones (WHO, 2008a). Serum potassium was
5.57 mmol/l, blood urea nitrogen was 24.7 mmol/l, and creatinine was 575.9 µm/l in
affected infants. After five days of peritoneal dialysis and intravenous sodium
bicarbonate the stones passed and the infant recovered. It is believed that most of the
melamine related deaths in humans was due to a lack or delay of treatment (WHO,
2008a) .
In 2007, the WHO established a tolerable daily intake (TDI) for melamine at 0.2
mg/kg BW, which applies to the whole population, including infants (WHO, 2007). In
the same publication, the WHO also established a TDI for cyanuric acid at 1.54 mg/kg
BW (WHO, 2007). Analysis of the adulterated infant formula in China revealed that
melamine, cyanuric acid, ammeline, and ammelide, were present in the raw material used
to manufacture the infant formula at levels of 188,000, 3.2, 14.9, and 293.0 mg/kg,
15
respectively (WHO, 2008a). Dietary exposure to the median level of melamine that was
reported in the most contaminated brand of infant formula was between 8.6 and 23.4
mg/kg BW (WHO, 2008a). This is approximately 40 to 120 times the TDI set by WHO
(WHO, 2008a). After this, many countries established limits for melamine in infant
formula and other foods (WHO, 2008a). In 2008 the FDA set a TDI at 0.63 mg/kg
BW/day (FDA, 2009) before reestablishing it to 0.063 mg/kg BW/day (FDA, 2008). The
limit established for infant formula was 1 mg/kg, while 2.5 mg/kg was used as the limit in
other foods (WHO, 2008a). “These limits provided a sufficient margin of safety for
dietary exposure relative to the TDI” (WHO, 2008a).
After the 2008 adulteration of milk products, including infant formula, reports
were published raising concerns that other foods originating from China might be
contaminated with melamine. Foods included fruits, vegetables, fresh eggs, powdered
and liquid egg products, non-dairy creamers, ammonium bicarbonate, and animal feed
(FSANZ, 2008; HKCFS, 2008; WHO, 2008a). This resulted in testing of these types of
food products and products containing these ingredients (WHO, 2008a).
Analysis:
Several different methods are available for the detection and quantification of
melamine and its related analogs (WHO, 2008a). Methods discussed in a report released
by the WHO (2008a) include enzyme-linked immunosorbent assay (ELISA), high-
performance liquid chromatography (HPLC) – ultraviolet (UV)/diode array detection
(DAD), gas chromatography (GC) –mass spectrometry (MS), GC-MS/MS, and liquid
chromatography (LQ) –MS/MS. Several other methods have been developed or improved

16
in the years following and include surface-enhanced Raman spectroscopy (SERS),
isotope dilution, and SERS coupled with gold nanosubstrates (Tyan et al., 2009). Each
method has its own level of selectivity, sensitivity, and cost associated with it (WHO,
2008a). Some methods are only suitable for the detection of melamine, while others can
detect multiple compounds simultaneously (WHO, 2008a). A few techniques are only
appropriate for detecting melamine and should not be used for quantifying melamine,
while others can be used for both detecting and quantifying melamine in a particular
substrate (WHO, 2008a).
Before detection and or quantification of melamine or a related analogue can
occur sample extraction must first be performed (WHO, 2008a). During extraction care
must be taken to avoid hydrolysis of melamine and its analogues to cyanuric acid,
especially when using extremely basic extraction conditions (WHO, 2008a). It is also
critical to dissociate melamine from relatively insoluble complexes with cyanuric acid
before analysis (WHO, 2008a). Therefore, the pH of the extraction solvent may need to
be adjusted to cause melamine to dissociate from insoluble complexes (WHO, 2008a) .
Commonly an acidic aqueous solvent mixture is used to extract samples followed by
mixed-mode solid-phase extraction, when sensitive detection methods will be used
(WHO, 2008a). For melamine analysis cation exchange/reverse phases can be used
(Andersen et al., 2008). Smoker and Krynitsky (2008) isolated cyanuric acid using
mixed-mode anion exchange sorbents. Other solid phase sorbents used to aid in the
extraction include graphitized carbon phases and C18 (Chou et al., 2003; WHO, 2008a).
ELISA kits have been developed and considered for the detection of melamine
and other s-triazines when high-throughtput screening of samples is needed (Garber,

17
2008). Depending on the matrix being analyzed and the extraction method used,
quantification limits for melamine detection are between 0.1 and 25 mg/kg (WHO,
2008a). WHO (2008a) stated the ELISA test should be used for screening purposes only
and that positive results should be confirmed using a more selective confirmatory
method. Tyan et al. (2009) also stated that if samples test positive for melamine then
other tests may be required to ensure that cross-reacting compounds did not create a false
positive and to determine the exact level of melamine.
The most common methods used to detect melamine in foods and feedstuff are
GC-MS and HPLC combined with UV or MS detectors (Tyan et al., 2009). LOD and
linear ranges for the calibration curves for these GC-MS and HPLC-UV/MS are 0.1 to
0.02 ppm and 0.01 to 5 ppm, respectively (Tyan et al., 2009). The WHO (2008a) reported
that quantification limits for melamine and its related analogs using HPLC-UV/DAD
range from 0.05 to 65 mg/kg. The WHO (2008a) also stated that HPLC-UV/DAD can be
used as a confirmatory method only if it has been validated thoroughly for the matrices of
interest.
GC-MS and LC-MS are used by the US FDA to identify melamine in foods (Tyan
et al., 2009). These methods, along with tandem mass spectrometry (MS/MS) based
methods, can be used as either a screening or confirmatory method due to their medium
to high level sensitivity (WHO, 2008a). For GC-MS and GC-MS/MS quantification,
limits range from 0.05 to 10 mg/kg and 0.002 to 5 mg/kg, respectively (WHO, 2008a).
A method for the analysis of porcine muscle tissue by solid-phase extraction, followed by
HPLC-MS/MS, is described in a report by (Filigenzi et al., 2007). Chou et al. (2003)
described a method for determining levels of cyromazine and melamine in poultry meat

18
and eggs by HPLC analysis. The USFDA has also published several methods for
melamine analysis (Andersen et al., 2007; Smoker and Krynitsky, 2008; Turnipseed et
al., 2008).
A new approach to measure both melamine and cyanuric acid is by surfaced-
enhanced Raman spectroscopy (SERS) coupled with gold and other various
nanosubstrates (Mermelstein, 2009) . SERS is a branch of Raman spectroscopy that
measures the molecular vibrations made by scattering light (He et al., 2008). He et al.
(2008) demonstrated that SERS could provide a fast method for detection of melamine
and its derivatives in aqueous solutions. SERS is able to rapidly detect 2 ppm of
melamine in milk (Mermelstein, 2009), but has the potential of sample detection at the
parts per billion (ppb) level or even a signal molecule (He et al., 2008). A major
advantage of SERS is that melamine could be detected on site and in real time, about 15
minutes per sample (He et al., 2008; Liu et al., 2010; Mermelstein, 2009).
Biological Effects:
Case studies and experiments:
Humans:
Following the 2008 outbreak of melamine induced renal failure in children
several case reports were published in a report by the WHO (2008a). The reports
documented clinical symptoms of infants to include crying, vomiting, fever, hematuria,
dysuria, oliguria, anuria, oedema, high blood pressure, and pain in the kidney area.
However, it should be noted that most children did not show clinical signs. After
screening 1,129 children in Taiwan, Ho et al. (2009), suggest that hypercalciuria,

19
hematuria, or positive abdominal radiographs were not significantly increased in patients
that presented with kidney stones. Therefore, these systems should not be used to
diagnose renal damage associated with melamine, instead ultrasonography should be
performed to aid in diagnoses (Ho et al., 2009).
It was determined that renal stones associated with the 2008 China incident
contained uric acid and melamine with no cyanuric acid detected (WHO, 2008a). Grases
et al. (2009) suggested that such calculus could be prevented by the alkalinization of
urine. Grases et al. (2009) suggestion was based on in vitro testing where melamine and
uric acid only formed crystals when the pH of the aqueous solution was lower than 5.0.
The WHO (2008a) reported that children in China were treated with intravenous sodium
chloride with dextrose and sodium bicarbonate or sodium citrate to increase urine pH to
6.5 to 7.0. At the same time, children that presented with renal failure or anuria were
placed on dialysis and/or surgical removal of the stones was performed.
Dogs and Cats:
Some of the earliest animal research investigating melamine was done by
Lipschitz and Stockey (1945) who demonstrated the diuretic effects of melamine in dogs.
Results of Lipschitz and Stockey (1945) showed that melamine increased water output as
well as NaCl ouput, in a positive dose related manor. The research by Lipschitz and
Stockey (1945) also showed that 60 to 86.5 % of the melamine fed to dogs could be
recovered in the urine within 24 h of administration. Additional research involving the
effect of melamine on dogs and cats was not conducted until the reports of melamine
associated renal failure occurred in 2007.

20
Brown et al. (2007) examined tissues and the medical history of ten cats and six
dogs that died during 2007 and were reported to have consumed contaminated pet food.
All animals had exhibited anorexia, vomiting, lethargy, polyuria, and polydipsia.
Fourteen animals had blood serum analysis reported with creatinine levels from 7 to 15
mg/dl (reference range 0.9 to 2.1 mg/dl) and BUN greater than 130 mg/dl (reference
range 20 to 34 mg/dl) (Brown et al., 2007). BUN and creatinine levels are used as
indicators of kidney function,with elevated levels indicating kidney failure
(Excyclopedia, 2011). Eight of the 16 animals in the Brown et al. (2007) study had
extrarenal lesions associated with uremia. All 16 animals had polarizable crystals in the
distal tubules and collecting ducts of the kidney.
Cianciolo et al. (2008), exposed 70 cats to commercial canned or pouched
contaminated pet food and were able to document the histological and clinical signs
associated with melamine and cyanuric acid toxicity. In the study, 43 of the cats
developed signs of toxicosis. Clinical signs ranged from inappetence with or without
vomiting, polydipsia, polyuria, dehydration, lethargy, and anorexia. Gross examination
of 14 cats revealed 10 with bilateral enlargement of the kidneys. Further histological
evaluation of the kidneys showed aggregates of gold-brown crystals in the distal
segments of the nephron. Most crystals were between 15 and 30 µM in diameter, with
two concentric rings, giving the appearance of spokes radiating from the center
(Cianciolo et al., 2008). Puschner et al. (2007) also documented crystals as being pale
translucent, yellow to clear, with morphology that ranged from fan-shaped to starburst
prism to globular in cats fed combinations of melamine and cyanuric acid. All the

21
crystals observed in the Puschner et al. (2007) study displayed multicolored birefringence
to cross-polarized light.
Feeding trials conducted by Puschner et al. (2007) in which cats received 0.5 and
1.0% melamine in their diet, showed no evidence of renal failure after 11 days on test. In
the same study, a cat receiving cyanuric acid up to 1.0% of its diet, showed no evidence
of renal failure as measured by serum creatinine and urea nitrogen. However, cats fed a
combination of melamine and cyanuric acid in a one-to-one ratio at levels of 0.2, 0.5, and
1.0% of their diet, showed slight depression, vomiting and anorexia after 12 hours on test.
Cats fed melamine in combination with cyanuric acid showed histological lesions limited
to the kidneys with crystals present in the lumina of the collecting ducts and within the
distal tubules. Puschner et al. (2007) demonstrated that a single oral exposure of 32
mg/kg BW of both melamine and cyanuric acid to cats can result in acute renal failure.
Rodents:
Rats and mice have been used in several studies to determine the effects of
melamine and cyanuric acid on animals (Dobson et al., 2008; Mast et al., 1983; Melnick
et al., 1984; Ogasawara et al., 1995). An early study conducted by Mast et al. (1983)
showed that melamine is not metabolized in male rats after a single oral dose of
approximately 1.3 mg/kg BW. Mast et al. (1983) also stated that melamine appears to be
distributed in total body water with most excreted via the urine. Jingbin et al. (2010)
were able to show that melamine consumed by a pregnant rat can be passed through the
placenta to the fetus in a dose dependent manner.
22
Melnick et al. (1984) conducted three experiments to study the effects of acute,
(14 days), subchronic (13 weeks), and chronic (103 weeks), exposure to melamine in
male and female mice and rats. The LD50 of melamine in male rats and mice was 3,161
and 3,296 mg/kg BW, respectively. While the LD50 for female rats and mice was
reported as 3,828 and 7,014 mg/kg BW, respectively. Melnick et al. (1984) also noted
that the urinary bladder was the only organ affected after exposure to melamine for 13
weeks. Only chronic exposure to melamine at levels higher than 4,500 ppm caused a
significant increase in kidney inflammation. An increase in bladder stones and
hyperplasia of the transitional epithelium of the urinary bladder was reported in male rats
that receive melamine for 13 weeks. Data showed that male rats and mice fed melamine
had a greater probability of developing urinary bladder stones than females (Melnick et
al., 1984).
Research conducted shortly after the sudden deaths of dogs and cats in 2007 by
Dobson et al. (2008) found that feeding rats 10, 30, or 100 mg/kg of ammelmine or
ammelide alone did not cause kidney weights, BUN, or serum creatinine to increase.
Dobson et al. (2008) went on to study the effects of a mixture of trizaine in rats by
feeding 400 mg/kg BW melamine and 40 mg/kg BW each of ammamine, ammeline, and
cyanuric acid. A mixture of 400 mg/kg BW melamine and 400 mg/kg BW cyanuric acid
was also fed to rats. Both mixtures resulted in toxicity, with diuresis as the initial
symptom in most animals. By day three, animals (especially in the melamine and
cyanuric acid group), were oliguric with some hematuria. Serum analysis also showed
increased levels of BUN, creatinine, and creatinine clearance, which are indicators of

23
impaired renal function. Kidney weights were higher in rats fed a mixture of triazines,
with the tubules streaked with brownish-yellowish precipitates (Dobson et al., 2008).
Fish:
It has been documented that food used to feed farm-raised fish was also
contaminated with melamine (Tolleson, 2009; WHO, 2008a). However, little research
has been conducted on the effects of melamine on fish. Reimschuessel et al. (2008) fed
melamine and cyanuric acid alone or in combination to tilapia, channel catfish, rainbow
trout, and Atlantic salmon, for 3 days. Targeted doses were 400 mg/kg of melamine or
cyanuric acid alone, or a combination of 400 mg/kg of each compound. Two salmon that
received the combination diet died early in the study and were replaced with salmon fed
200 mg/kg of melamine and cyanuric acid (Reimschuessel et al., 2008).
Results of the Reimschuessel et al. (2008) study documented that trout, salmon,
and some catfish fed the combination diet passed white feces, with all combination fed
fish presenting with similar material in the intestinal lumen. No crystals were detected in
fish fed diets that contained melamine alone. Twenty five of the 26 kidneys from fish fed
combinations diets contained many crystals arranged in radial spherulities within the
tubules. These crystals were described as gold-brown and needle-like and had formed
radial spheroid aggregates. Some kidney tubules were dilated, contained necrotic cells,
and had basophilic, regenerative epithelium along the basement membrane
(Reimschuessel et al., 2008). Analysis of tissue samples revealed the presence of
melamine and cyanuric acid one day after administration of the compounds started.
Results also indicated that muscle from catfish fed a combination diet for one day had

24
lower melamine and cyanuric acid concentrations than catfish fed melamine or cyanuric
acid alone. Lower residue levels in combination fed fish can be attributed to precipitation
of the melamine cyanurate complex in the gastrointestinal tract and kidneys of fish
(Reimschuessel et al., 2008).
Ruminants:
Most research done in ruminants involves investigating the use of melamine as a
non-protein nitrogen (NPN) source (Clark, 1966; Newton and Utley, 1978). However,
after the melamine contamination of feed and food in 2007 and 2008, Shen et al. (2010)
reported on the ability of melamine to be transferred from feed ingredients to milk in
dairy cattle. Shen et al. (2010) fed 0, 90, 270, and 450 mg of melamine to Holstein cows
for 13 days and found milk from cattle receiving high dietary melamine levels to contain
more melamine than milk from cattle fed lower levels of melamine. It was also reported
that transfer efficiency was not associated with dietary melamine level, but instead
correlated to milking ability of cows, with higher producing cows able to transfer more
melamine from the diet to the milk. Using equations produced from data analysis and
maximum melamine levels for food ingredients, set by the USFDA, Shen et al. (2010)
suggested that if the mean daily melamine intake of a dairy cow exceeds 312.7 mg the
milk should not be used to produce infant formula. Shen et al. (2010) also noted that if
intake exceeds 715.1 mg the milk should not be used to produce common milk powder
because the powder might exceed levels set by the FDA. However, Shen et al. (2010)
went on to state that more testing is needed to confirm these levels.

25
Newton and Utley (1978) included either cottonseed meal, urea, or melamine at
0.5% of steer diets in order to evaluate melamine as a NPN source. After three days on
test, the mean ruminal ammonia concentration was lower for both melamine and
cottonseed meal, at 3.6 and 8.4 mM, respectively. It has been reported that 3.57 mM is
needed for maximum rumen protein synthesis, suggesting that melamine at the level fed
did not provide enough ammonia for maximum microbial protein synthesis (Newton and
Utley, 1978). It was also reported that while melamine was digested to the same extent
as cottonseed meal, more nitrogen appeared in the urine of melamine fed steers. Newton
and Utley (1978) went on to state that under test conditions used in their research
melamine did not provide adequate nitrogen supplementation for cattle and made no
mention of renal effects.
Clark (1966) reported feeding sheep melamine in multiple or single doses that
ranged from 10 to 100 mg. Administering 10 mg of melamine per day had toxic effects
in one sheep after 16 consecutive days of dosing and after 31 days for another sheep. A
third sheep went unaffected for 39 days, before it was removed from the trial. Sheep fed
melamine that underwent autopsy showed multiple crystals in the kidney tubules, with
nephrosis and erosive abomasitis also present. Clark (1966) stated that death occurring
after melamine administration was due to blockage of the kidney tubules with crystals
resulting in anuria and uraemia.
Poultry:
While melamine appears to be relatively non-toxic in most mammals including
rodents, pigs, and fish (Melnick et al., 1984; Reimschuessel et al., 2008; Stine et al.,
26
2011), studies by Brand (2011) and Bermudez et al. (2008) suggest that melamine can be
toxic in poultry species. Also, in contrast to findings that combinations of melamine and
cyanuric acid are toxic to pigs, fish, and rodents (Dobson et al., 2008; Reimschuessel et
al., 2008; Stine et al., 2011), research by Brand (2011) suggest that melamine fed in
combination with cyanuric acid is not as toxic in turkeys.
Brand (2011) included melamine at levels up to 3.0% of a broiler diet and
observed that melamine ≥ 1.0% of the diet is toxic, but mortality was not significantly
increased when fed at levels less than or equal to 2.0%. An increase in relative kidney
and liver weights was noted in broilers fed melamine greater than or equal to 1.5 and
2.5% of the diet, respectively. However, residue levels from broilers fed greater than or
equal to 1.0% melamine may exceed what is considered safe by the FDA. Brand (2011)
went on to report that melamine present in the bile of broilers suggests that avian species
can clear melamine through their bile. Ding et al. (2011) reported that broilers fed 100
mg/kg melamine had increased glutamic-pyruvic transaminase (GPT) and uric acid levels
after 21 days on test. After 32 days on test, broilers fed 100 mg/kg showed similar
growth performance as controls but showed toxicity in the liver and kidney (Ding et al.,
2011).
Poults, like broilers, can tolerate up to 5,000 mg/kg of melamine with no adverse
effect on growth performance (Brand, 2011). However, at this level the kidneys of poults
do contain significant concentrations of melamine. Moderate to severe tubulointerstitial
nephritis with mineralized casts were observed in the collecting tubules and collecting
ducts of poults fed melamine. Brand (2011) also reported 32% mortality in poults fed
greater than or equal to 1.5% melamine in the first ten days of feeding, with poults

27
surviving past day 10 appearing to be less sensitive to melamine. A similar occurrence
was reported by Lu et al. (2009), who reported lower melamine residue levels in broiler
that consumed contaminated diets for 42 d as compared to broilers that consumed
contaminated diets for 28 days.
Brand (2011) also evaluated the toxicity of cyanuric acid alone in broilers and
poults when it is included at up to 3.0% of their diets. Mortality, feed intake, body
weight gain, and feed conversion of broilers were not affected by cyanuric acid. This
suggests that cyanuric acid up to 3.0% of a diet is not toxic to broilers. Cyanuric acid did
not affect mortality, body weight gain, or feed conversion in poults. Gross examination
of poults showed no toxic effects with kidneys appearing unremarkable. These data
suggest that cyanuric acid fed alone, up to 3.0% of the diet, is not toxic to young broilers
and poults (Brand, 2011).
Feeding a combination of melamine and cyanuric acid, in a one-to-one ratio up to
3.0% of a broilers diets, Brand (2011) observed no effect on mortality. However, feeding
a combination of melamine and cyanuric acid did cause a depression in feed intake, body
weight gain, and an increase in relative kidney and liver weights. Crystals documented in
kidneys of broilers fed 0.5, 1.0, and 1.5% combination diets had the characteristic
polarizable melamine-cyanuric acid crystals describe in the literature. The polarizable
nature of melamine-cyanuric acid crystals can be used to differentiate them from
melamine crystals (Brand, 2011).
In poults, the addition of cyanuric acid to a diet that contained melamine,
appeared to reduce the negative effects of melamine on feed intake and body weight gain
(Brand, 2011). This same effect was observed on the relative kidney weight of poults fed

28
the combination diet. However, BUN levels were elevated in poults fed combination
diets, but all values fell within or near normal values for poultry species. Brand (2011)
stated that the addition of cyanuric acid to melamine contaminated diets was able to
prevent the formation of kidney lesions caused by melamine in young turkeys.
Two experiments have been conducted to study the effects of melamine in ducks.
The first conducted by Yan et al. (2009) involved feeding melamine at levels ranging
from zero to 1,000 mg/kg. Feeding less than 50 mg/kg melamine to ducks for 42 days
did not result in a detectable amount of melamine residue in the breast, liver, or kidney
tissue. However, melamine residues in tissue increased linearly with increasing dietary
levels greater than 100 mg/kg. It was also noted that concentrations of 500 and 1,000
mg/kg of melamine caused an uneven distribution of melamine to be deposited in the
tissues, with the kidneys having the highest concentration followed by liver and breast
(Yan et al., 2009)
Gao et al. (2010) conducted research to determine the effects of graded levels of
melamine, up to 100 mg/kg, in laying ducks. Gao et al. (2010) reported no effect on
average egg weight, egg production, feed intake, or feed conversion in Jinding laying
ducks fed less than or equal to 100 mg of melamine per kg of diet. Ducks fed melamine
at levels between 50 and 100 mg/kg had increased BUN levels. Histological lesions were
also reported in the kidneys of ducks fed greater than or equal to 25 mg/kg melamine.
Tubular cell necrosis and lymphocytic infiltration of the kidney was noted. Gao et al.
(2010) also noted that dietary melamine can be transferred to eggs, with melamine
concentrations in eggs increasing as dietary melamine levels increase.
29
Swine:
Shortly after the initial reports of melamine toxicity in 2007, pharmacokinetic
research of melamine in the pig was conducted by Baynes et al. (2008). Intravenous
injection of 6.13 mg of melamine/kg BW was administered to five weanling pigs and
blood samples were collected over a 48 h period. This equates to approximately 120 mg
melamine/kg feed, assuming 100 kg pigs consuming 3 kg of feed daily (Buur et al.,
2008). Distribution of melamine in the pigs was close to total body water, suggesting
distribution is limited to the extracellular fluid compartment and is not distributed to most
organs (Baynes et al., 2008). Baynes et al. (2008) also found that melamine is rapidly
removed from the pig via renal filtration, with a half life of 4.07 ± 0.39 hours.
Therefore, Baynes et al. (2008) suggested a one-compartment, first order kinetics model
with first order elimination.
Buur et al. (2008), utilizing physiologically based pharmacokinetic models, was
able to estimate the time that swine should be withheld from slaughter after single and
chronic oral exposures of 3 and 5.12 mg/kg BW of melamine. Two parameters used by
Buur et al. (2008) in the models were; 1) swine with kidney residue levels below 50 ppb
were considered safe for consumption; 2) due to the polar characteristics of melamine,
hepatic clearance was considered insignificant. Physiologically based pharmacokinetic
modeling estimate withholding swine from slaughter for 19.2 and 20.9 h for signal doses
of 3.0 and 5.12 mg/kg BW respectively. For seven day, chronic exposure withholding
times were estimated at 20 and 21.3 h for 3.0 and 5.12 mg/kg BW respectively.
Around the same time as the pharmacokinetic research was being conducted,
several case studies involving the possible contamination of swine feed and resulting

30
morbidity and mortality of swine herds were reported. The first, by Nilubol et al. (2009),
reported below average gain, slight pallor, and increased mortality at a swine farm in
Thailand between February and May of 2007. It was later determined that the starter diet
was contaminated with melamine, cyanuric acid, and ammeline at concentrations of
3,209, 1,126, and 949 mg/kg, respectively. Mortality started approximately two weeks
after weaning at 21 days of age, and one to two months later approached 100% or 4,000
weaned pigs. Pathologic examination of 10 mortalities revealed five with kidneys that
appeared yellowish, slightly swollen, glistening, and showed perirenal edema. The renal
pelvis was dilated with crystalline precipitates evident on the surface that was cut.
Histological lesions appeared in the cortex and medulla of the kidney and were also
observed throughout the nephron, with more appearing in the distal section. Yellow-
brown crystals with radiating striations caused epithelial disruption and necrosis with a
moderate number of intratubular and peritubular neutrophils observed in the distal
tubules and collecting ducts. Two pigs showed elevated levels of blood urea nitrogen at
121.2 and 157.9 mg/dl, and elevated creatinine levels at 11.9 and 15.0 mg/dl. Mortality
was attributed to the physical presence of crystals formed by the interaction of melamine
and cyanuric acid.
The second case study, reported by Gonzalez et al. (2009), involved between
three to four hundred 45 to 60 day old piglets from five different farms in Spain.
Clinicial signs started several days post weaning and included anorexia, depression,
lethargy, and polydipsia. Necropsy was conducted on nine piglets, with gross
abnormalities and histological lesions limited to the kidneys. The kidneys appeared
moderately enlarged and firm with slightly irregular, orange, cortical surfaces with

31
numerous multifocal yellow foci measuring 0.5 mm in diameter extending from the
cortex to the medulla. Crystals found in the cortex and medulla appeared multicolored
and birefringence with cross-polarized light. Crystals ranging from 20 to 60 µm, were
round and located in the lumen of distal convoluted tubules and collecting ducts.
Appearance of crystals varied with some having “basophilic round centers surrounded by
concentric lamellae with blue radial striations while others appeared pale green and
irregular or striated aggregates” (Gonzalez et al., 2009). Infiltrates included
macrophages, lymphocytes, plasma cells, and multinucleated foreign body-type cells and
were associated with chronic inflammation. Feed samples were not available for
analysis, but investigators believed that ammeline and ammelide were probably the major
contaminants of the feed since concentrations of these two compounds were higher than
concentrations of melamine and cyanuric acid in the kidney.
The final case study, reported by Lee et al. (2011) occurred in Malaysia during
2008. Yeast contaminated with 30,064 ppm melamine, was included in a pig diet at 5.0
%, giving the diet a melamine concentration of 750 to 1,500 ppm. Pigs consuming this
diet appeared inappetant, anorexic, thin, dull, and depressed. The kidney was the only
organ affected, appearing yellowish, discolored, and enlarged. A few kidneys from
severely affected pigs were small in size with clear pitting and dimpling, dark red and
brown in color, with acute tubular nephrosis and interstitual nephritis with multiple cysts
present in the cortex.
To provide experimental data on melamine toxicity, Reimschuessel et al. (2008)
feed 400 mg/kg BW of melamine and cyanuric acid alone or in combination to 16 week
old Yorkshire-crossed pigs. In each treatment either melamine, cyanuric acid, or

32
melamine plus cyanuric acid was fed to one pig for a three day period. Pigs fed
melamine or cyanuric acid alone showed no gross lesions or crystals present in the
kidneys. Blood urea nitrogen and creatinine, both fell within normal ranges for pigs of
the same age and sex. Kidneys from pigs fed the combination of melamine and cyanuric
acid appeared flaccid, with small red foci, and were associated with a large amount of
edema. The combination fed pig also had elevated blood urea nitrogen levels and
creatinine levels, and crystals were detected in wet mounts of kidney tissue. Crystals
appeared golden-brown and formed radial spheroid aggregates.
More recently, a NOAEL was determined by Stine et al. (2011). First, a
preliminary seven day study was conducted in which 0, 1.0, 3.3, 10.0, 33.0, or 100 mg/kg
BW/day of melamine-cyanuric acid or 200 mg/kg BW/day of melamine or cyanuric acid
alone was fed to weanling barrows. Barrows fed 100 mg/kg BW/day of melamine-
cyanuric acid had lower weight gains than controls and elevated blood urea nitrogen and
creatinine levels. A dose related response for kidney and relative kidney weight was
observed in barrows fed 10 mg/kg BW/day and higher of melamine-cyanuric acid
combinations. Finally, crystalline structures were found in the medulla and cortex of
kidneys from barrows fed 10 mg/kg BW/day and higher of melamine-cyanuric acid
combinations, and barrows fed 200 mg/kg/day of melamine alone. No difference in urine
analysis occurred among any treatment groups.
Stine et al. (2011) performed a 28 day study in which 24 barrows, eight per
treatment, were fed 0.0, 1.0, or 3.3 mg/kg BW/day of melamine-cyanuric acid. Only one
of eight barrows fed the 3.3 mg/kg of BW/day of melamine-cyanuric acid developed a
cluster of crystals in the kidneys. No other treatment related symptoms or findings were

33
observed in any other barrows on test. For this reason a NOAEL for weanling barrows
was set at 1.0 mg/kg body weight/ day of melamine plus 1.0 mg/kg body weight/day of
cyanuric acid, which is equivalent to 25 ppm of each compound in the feed.
Since crystals were found in one 200 mg/kg BW/day pig in the preliminary study,
Stine et al. (2011) performed a follow up study utilizing eight pigs that received 200
mg/kg BW/day melamine (approximately 5000 mg/kg of fed) while four control pigs
received no melamine for 28 days. Upon examination, no crystals were present in any
pigs receiving 200 mg/kg BW/day and there was no difference among treatments in any
variables measured.
Crystal morphology from the 200 mg/kg BW/day melamine fed pig in the 7 day
study by Stine et al. (2011) was closely related to crystal morphology from melamine-
cyanuric acid fed pigs. Furthermore, crystal composition from melamine fed pigs and
melamine-cyanuric acid fed pigs, determined by UPLC-MS/MS, was very similar. This
similarity indicates that crystals from the melamine fed pigs had a melamine cyanuric
acid composition of approximately one to one. Stine et al. (2011) stated that while
microbial conversion of melamine to cyanuric acid, documented by Seffernick et al.
(2010) and Wackett et al. (2002) does occur, it is unclear if the microorganisms
responsible for the conversion reside and are active in the gastrointestinal tract of
animals.

34
Figure 2.1. Structure of melamine, ammeline, ammelide, and cyanuric acid. Adapted from Tolleson (2009)
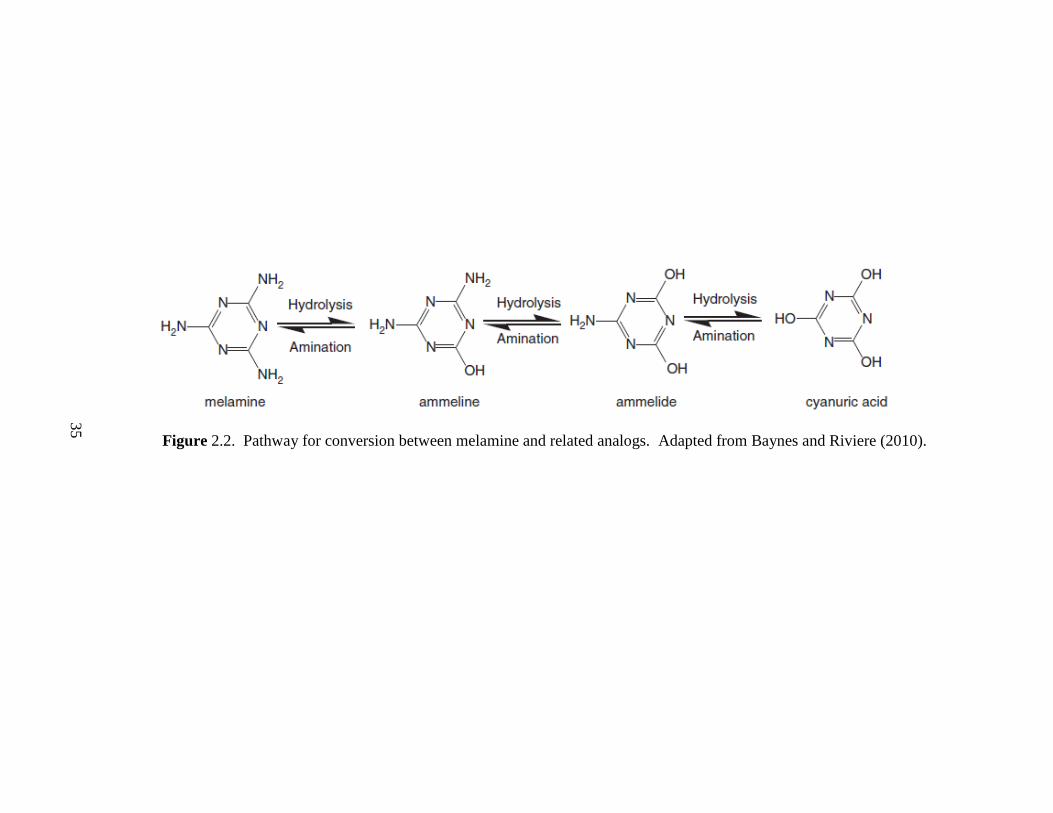
Figure 2.2. Pathway for conversion between melamine and related analogs. Adapted from Baynes and Riviere (2010).
35

36
CHAPTER 3
Effects of Melamine in Young Pekin Ducks
Introduction
Melamine (C3H6N6) is a white, crystalline powder (OSHA, 2006) with a wide
variety of industrial applications including use in the manufacturing of plastics,
adhesives, laminates, paints, flame retardants, textile finishes, and fertilizers (Hilts and
Pelletier, 2009). While melamine is not approved for use in animal feed (Lee et al.,
2011) or human food (CDC, 2008) it is a known contaminant of both (Bhalla et al., 2009;
Tyan et al., 2009). Contamination of feed or food can occur indirectly or accidently by
treatment of feed ingredients with products that contain melamine (WHO, 2008a).
Recently, the intentional adulteration of feeds and foods with melamine (Hilts and
Pelletier, 2009) has received international attention. Melamine is 66% nitrogen (Yang et
al., 2009), therefore, protein analysis using the Kjeldahl method, will result in an invalid
or an over estimate of the actual protein content of a matrix that contains melamine
(Yang et al., 2009). For this reason melamine was intentionally added to feed ingredients
or feeds to increase their monetary value (Cianciolo et al., 2008).
In 2007, deaths related to renal failure were documented in dogs and cats across
North America and South Africa (Hilts and Pelletier, 2009). It was later determined that
wheat gluten from China was used to manufacture the pet food and it was intentionally
contaminated with melamine and cyanuric acid (Hilts and Pelletier, 2009). After

37
examining six dogs and ten cats that had consumed contaminated pet food, Brown et al.
(2007) noted that most had increased blood urea nitrogen (BUN) and creatinine levels,
with polarizable crystals present in the distal tubules and collecting ducts of the kidney.
By September of the following year, some 52,875 children in China had been
hospitalized after consuming infant formula contaminated with melamine (Chan et al.,
2008). Some children developed renal stones that were composed of melamine and uric
acid (WHO, 2008a). As a result of this incident, the World Health Organization (WHO)
established a tolerable daily intake (TDI) for melamine at 0.2 mg/kg of body weight and a
TDI for cyanuric acid at 1.54 mg/kg body weight (WHO, 2007).
Following the contamination of pet food in 2007 it was determined that
contaminated waste material from pet food manufacturing was incorporated into swine,
poultry (Buur et al., 2008; USDA, 2007a), and aquaculture feed (Karbiwnyk et al., 2009).
Several studies where then conducted to determine the effects of melamine and cyanuric,
alone or in combination, on animal health and possible residue levels in meat destined for
human consumption (Brand, 2011; Reimschuessel et al., 2008; Shen et al., 2010; Stine et
al., 2011).
Brand (2011) did considerable work on the effects of melamine and cyanuric acid
in young broilers and poults and reported that melamine significantly decreased the
performance of broiler and poults, when included in the diet at ≥ 1.5%. Brand (2011)
also found that the addition of cyanuric acid to a diet contaminated with melamine reduce
the toxic effects of melamine in poults but not in broilers.
In an experiment by Yan et al. (2009), ducks were fed graded levels of melamine
ranging from zero to 1,000 mg/kg. No melamine was detected in the breast, liver, or
38
kidney of ducks consuming less than 50 mg/kg of melamine in their diet for 42 days (Yan
et al., 2009). However, dietary levels of melamine between 100 and 1,000 mg/kg diet
resulted in tissue residues levels that increased linearly with increasing dietary levels,
with ducks receiving 500 and 1,000 mg/kg having the highest concentrations of
melamine in the kidneys (Yan et al., 2009).
Gao et al. (2010) fed ducks between zero and 100 mg/kg of melamine and
observed histological lesions in the kidneys of ducks fed ≥ 25 mg/kg melamine. Ducks
fed 50 and 100 mg/kg of melamine also had increased BUN levels. However, no effect
was noticed on average egg weight, egg production, feed intake, or feed conversion when
≤ 100 mg/kg of melamine was fed.
The objective of the current study was to determine the effects of feeding
melamine at concentrations ranging from 0 to 2.25 % of the diet to young Pekin ducks for
21 days. Additionally, the study was used to determine if melamine accumulates in the
tissues of Pekin ducks, and if hepatic clearance via bile is a possible route of melamine
elimination.
Materials and Methods
Diet Preparation:
A basal diet (Table 3.1.) was formulated to meet or exceed all requirements of
young Pekin ducks set forth by the National Research Council (NRC, 1994). Ten dietary
treatments were prepared from the basal diet by adding melamine (MEL), purchased
from Fisher Scientific. MEL was substituted for sand to obtain the desired dietary MEL
concentrations (0.00, 0.25, 0.50, 0.75, 1.00, 1.25, 1.50, 1.75, 2.00, and 2.25 %).

39
Birds, Management and Response Variables:
The animal care and use protocol was reviewed and approved by the University of
Missouri Animal Care and Use Committee (ACUC). Two hundred, day-old Pekin ducks
were purchased from a commercial hatchery, weighed, wing banded, and assigned to
pens in stainless steel batteries. A completely randomized design was used, with five
replicate pens assigned to each of the ten dietary treatments. Each replicate pen
contained four ducks. Ducks were housed in an environmentally controlled room and
placed on a 24-h constant light schedule. Feed and water were supplied for ad libitum
consumption for 21 d. Ducks were observed daily and mortality was recorded as it
occurred. All ducks that died before day 21 were weighed and sent to the avian
pathology lab at the University of Missouri (Columbia, MO) for necropsy.
On day 21, ducks and feed were weighed and average body weight gain, average
feed intake, and feed conversion were calculated. All ducks were euthanized with carbon
dioxide and blood samples were collected. Following blood collection cervical
dislocation was performed to ensure death by physical means. The liver and kidneys
were removed from three ducks per pen and weighed. Relative liver and kidney weights
were calculated by dividing organ weight by body weight. Blood samples were collected
via cardiac puncture from three birds per pen, centrifuged (Sorvall, RC 3 B plus) at 1,400
x g for 30 minutes at 7ºC before serum was separated. Serum was analyzed for glucose
(GLU), albumin (ALB), total protein (TP), globulin (GLOB), calcium (Ca), asparate
transaminase (AST), gamma glutamyltranserase (GGT), and uric acid (UA) at the
University of Missouri Veterinary Pathology Laboratory (Columbia, MO). Sections of

40
kidney from eight ducks per treatment were fixed in 10% neutral buffered formalin for
histopathological evaluation. Sections of kidneys, breast muscle, and bile from all
treatments were collected and frozen for later analysis of MEL concentrations.
Melamine Analysis:
MEL extraction from tissue and bile samples was based on the method used by
Brand (2011), and involved high-performance liquid chromatography (HPLC) via UV
detection. For kidney and muscle, 10 mL of water:acetonitrile (1:2) was added to 1 g of
tissue and the tissues homogenized for 30 sec in a 50 mL conical centrifuge tube. The
homogenized sample was then centrifuged for 5 min at 1,000 rpm (Dynac II centrifuge;
Sparks, MD) and the supernatant transferred to microcentrifuge tubes and further
centrifuged for 5 min at 10,000 rpm (Spectrafuge 16M; Woodbridge, NJ). The
supernatant was extracted and filtered through a MycoSep® 224 AflaZon columns
(Romer Labs, 2011). Finally, 500 µL of the filtered supernatant was diluted (1:1) with
buffer solution (BUFF; 1.924 g citric acid and 2.34 g of octanesulfonate dissolved in L of
distilled water, pH adjusted to 3 using NaOH) before HPLC analysis was performed.
For bile, extraction involved adding 200 µL of bile to 1,800 µL of
water:acetonitrile (1:2), vortexing and transferring the samples to microcentrifuge tubes
and centrifuging for d min at 10,000 rpm (Spectrafuge 16M). The supernatant was
collected and filtered through MycoSep® 224 AflaZon column (Romer Labs, 2011).
Finally, 500 µL of the filtered supernatant was diluted (1:1) with BUFF before high-
performance liquid chromatography (HPLC) analysis was performed.
A Hitachi Model L-7100 pump with a Model L-7485 fluorescence detector,
Hitachi Model L-7200 autosampler with Hitachi D-7000 data acquisition interface and

41
ConcertChrom software on a microcomputer were used for HPLC analysis (Tokyo,
Japan). A HyperClone (Phenomonex) C18 column (100 x 4.60 mn) was used with a
retention time of 6 min and flow rate of 1 mL/min. UV detection occurred at 240 nm.
The mobile phase consisted of BUFF:acetrilnitril(ACN; 87:13).
A primary standard of 2,000 ppm MEL solution was diluted with BUFF:ACN
(1:1) to prepare standards of 1, 5, 10, and 20 ppm MEL. MEL Standards were ran before
and after each set of samples and used to calculate a standard curve. The area under the
curve was calculated, plotted on the standard curve, and used to calculate individual MEL
concentrations in samples. The limit of detection was set at 8.0 ppm.
Statistical Analysis:
Data were analyzed using the general linear model procedures of Statistical
Analysis Software (SAS) (SAS, 2006). Pen was the experimental unit. Variables that
showed significant differences in the ANOVA were compared using Fisher’s protected
least significant difference procedure (SAS, 2006). Regression analysis was performed
on all data to determine linear (yi = a + bxi + Ei) or quadratic (yi = a + bxi + cx2i + Ei)
response. Statistical significance was accepted at a P-value of ≤ 0.05. An arcsine
transformation was applied to percent mortality data before statistical analysis was
performed, and a log10 transformation to MEL residue levels in the kidney.
Results
Performance and Mortality:
The effect of MEL on body weight gain, feed intake, feed conversion, and
mortality are shown in Table 3.2. Increasing levels of MEL caused body weight gain (P

42
< 0.0001) and feed intake (P < 0.0001) to decrease linearly. Inclusion of MEL in the diet
at ≥1.00 % caused body weight gain and feed intake to be less (P < 0.0001) than that of
control birds. Figure 3.1 shows the size difference in Pekin ducks after consumption of
MEL contaminated feed for 21 d.
Feed conversion increased in a quadratic (P < 0.0023) fashion with increasing
dietary MEL concentrations. Feed to gain was increased (P < 0.0001) above that of
controls in ducks that consumed diets containing ≥ to 1.50 % MEL. Percent mortality
also increased in quadratic (P < 0.0119) fashion with increasing dietary MEL
concentrations. Compared to controls, mortality was higher (P = 0.0008) in ducks that
consumed ≥ 2.00 % MEL.
Organ Weights:
Table 3.2 summarizes the effect of MEL on relative organ weights. Increasing
dietary levels of MEL caused a quadratic (P = 0.0034) response in relative liver weight of
ducks. However, there were no differences (P > 0.05) in relative liver weights among
controls and ducks fed ≥ 0.25 % MEL. Relative kidney weights increased linearly (P <
0.0001) with increasing levels of MEL, with ducks fed ≥ to 1.00 % MEL having heavier
(P < 0.0001) relative kidney weights than control ducks. Figure 3.2 shows the difference
in appearance of the kidneys from a control duck (photo ‘A’) and a duck fed MEL (photo
‘B’) for 21 days.
Serum Chemistry:
The effect of MEL on the serum chemistry of young Pekin ducks is summarized
in Table 3.3. While both GLU (P = 0.0193) and AST (P = 0.0021) increased linearly as
MEL levels increased, there was no difference (P > 0.05) among controls and ducks fed

43
any level of MEL. Compared to controls, ALB (P = 0.0002), TP (P < 0.0001), GLOB (P
< 0.0001), and UA (P < 0.0001) were all higher in ducks fed ≥ 1.00% MEL and all
increased in a linear (P < 0.0001) fashion with increasing dietary MEL levels. Serum
GGT levels of ducks fed 1.50 and ≥ 2.00% MEL were higher (P < 0.0001) than levels in
control ducks, and also increased in a linear (P < 0.0001) fashion as dietary MEL levels
increased.
Tissue Residues:
Table 3.4 shows residue levels of MEL in the kidney, breast muscle, and bile as
determined by HPLC. MEL residue levels in the kidney increased quadratically (P <
0.0001) as dietary MEL increased. Ducks fed ≥ 0.25 % MEL had MEL residue levels in
the kidneys that were higher (P < 0.0001) than levels found in controls. Residue levels in
breast muscle were higher (P < 0.0001) in ducks fed ≥ to 0.75% MEL than in controls.
This increase in MEL levels in the breast muscle was found to be linear (P < 0.0001).
However, at each inclusion level, MEL residue levels were lower in the breast muscle
than in the kidney. Due to logistical problems during termination, bile from ducks in
each treatment were accidentally pooled. Therefore, statistical analysis could not be
performed on the bile data. Means presented in Table 3.4 are averages of duplicate
HPLC analysis performed on bile samples taken from each treatment. Residue levels in
the bile increased as dietary inclusion increased, with a low of 25 ppm in ducks fed 0.25
% MEL and a high of 640 ppm in ducks fed 2.25 %.

44
Pathology:
Gross Pathology –Mortality:
Table 3.2 showed the percent mortality that occurred in each treatment group. In
total, 14 ducks died over the 21 day experimental period. Two mortalities, one in the
control and one in the 0.75 % MEL group, were the results of hemorrhaging and trauma
and appeared to be unrelated to the treatment. The three mortalities in the 1.50 % MEL
treatment group had pale and enlarged kidneys with little to no feed in the upper
gastrointestinal tract. One of these three ducks also had crystals in its bile. One mortality
occurred in the 1.75 % MEL treatment group and presented with pale enlarged kidneys.
The 2.00 and 2.25 % MEL treatment groups had four mortalities each. All but one duck
from 2.00 and 2.25 % MEL groups had pale or pale and enlarged kidneys with little to no
feed in the upper gastrointestinal tract. At time of death, white crystals were present in
the bile of three of the mortalities from the 2.00 and 2.25 % MEL groups. Figure 3.3
shows crystals present in the bile from a duck fed control diet with MEL (photo ‘B’),
while photo ‘A’ shows the clear bile from a duck fed the control diet.
Histopathology – Mortality:
Histopathologic examination of the kidneys from early mortalities occurring in
the 1.50 % and higher MEL groups revealed moderate to severe autolysis in all sections
with numerous basophilic mineralized casts noted within the renal tubules and collecting
ducts. The renal lesions noted in these mortalities were compatible with MEL toxicity
seen in other avian species.
Gross Pathology – Termination:

45
By the end of the 21 day study there was clear size difference between ducks from
the control group and ducks fed diets that were contaminated with high levels of MEL
(Figure 3.1). Gross examination of ducks that received diets with high levels of MEL ( ≥
1.0 % MEL) revealed enlarged and pale kidneys (Figure 3.2).
Histopathology – Termination:
Microscopic examination of the pooled bile specimens collected during
termination revealed a moderate number of one to ten micrometer spherical brown
crystals with numerous aggregated crystals in treatments fed 1.00 % MEL and ≥ 1.50 %
MEL. Bile from ducks fed 2.25 % MEL had crystals that measured one to 20 µm with
identical appearance as crystals in the bile of ducks fed ≥ 1.00 % MEL. The crystals
observed in the bile of treatments fed ≥ 1.00 % MEL exhibited birefringence when
viewed under polarized light. Figure 3.4 shows crystals present in the bile of ducks fed
2.25 % MEL for 21 days.
Histopathology of kidney sections from treatments fed 0.00, 0.25, and 0.50 %
MEL were unremarkable. Two kidneys from the 0.75 % treatment group had mild
dilation of the embryonal nephrons with eosinophilic to basophilic casts present. Several
kidney sections from each treatment fed ≥ 1.00 % MEL contained eoinophilic to
basophilic casts, with some casts containing spherical crystals. The incidence of crystals
increased as percent MEL in the diet increased. Crystals were also present in the
interstitial spaces with mild multifocal heterphil infiltration present in kidney sections of
ducks fed ≥ 1.00 % MEL (Figure 3.5). The previously described pathology is compatible
with mild MEL toxicity. In addition to the previously described findings, several kidneys
from ducks fed ≥ 2.00 % MEL had moderate to severe dilation of embryonal nephrons,

46
collecting tubules and urinary space of the golmeruli. These finding suggest mild to
severe melamine toxicity in treatments fed ≥ 2.00 % MEL.
Discussion
Compared to controls, mortality was higher in ducks fed ≥ 2.00 % MEL. Brand
(2011) reported poults fed ≥ 1.5 % MEL and broilers fed ≥ 2.5 % MEL to have
significantly higher mortality than controls. In the current study, body weight gain and
feed intake were both reduced when ducks consumed diets that contained ≥ 1.00 % MEL.
These results are consistent with research by Brand (2011), in which broilers and poults
that consumed ≥ 1.00 % MEL had decreased body weight gains. The ability of ducks to
convert feed to gain was reduced when ≥ 1.50 % MEL was included in the diet. Brand
(2011) did not observe an increase in feed to gain in broilers until dietary MEL levels
were ≥ 2.5 % and no changes in feed conversion were documented in poults fed up to
1.50% MEL and survived for the 21 day experimental period. When feeding up to 100
mg/kg (0.01 % of the diet) MEL to laying ducks for 42 days, Gao et al. (2010) did not
observe any negative effect on body weight gain, feed intake or feed conversion. Data
from the current study shows that ≤ 0.75 % MEL in the diet does not reduce performance
of young Pekin ducks. Data also shows that MEL does not cause significant mortality
until inclusion is ≥ 2.00 % of the diet. However, it should be noted that ducks fed 1.50%
MEL had 15% mortality (not different (P > 0.05) from controls) with histopathological
examination of the kidneys revealing renal lesions compatible with MEL toxicity leading
to mortality.

47
Relative liver weights responded in a quadratic fashion as dietary melamine levels
increased. Brand (2011) report heavier relative liver weights in young broilers fed ≥ 2.25
% MEL, which is higher than levels used in the current study. A linear increase in
relative liver weight was also documented in poults fed up to 1.5 % MEL and survived to
termination (Brand, 2011). Relative kidney weight increased linearly as dietary levels of
MEL increased. The kidneys were found to be heavier than the controls in ducks fed ≥
1.00 % MEL. Increased relative kidney weights have been observed in studies with
broilers fed ≥ 1.50 % MEL and poults fed ≥ 1.00 % MEL (Brand, 2011). Gao et al.
(2010) fed 100 mg/kg of MEL (0.01 % of the diet) to laying Jinding ducks and observed
heavier relative kidney weights after 21 days on test. These data suggest a great deal of
variability in how different types and ages of birds are affected by MEL. However, it
appears that young Pekin ducks are affected in a similar manner to young broilers and
poults, with ≥ 1.00 % MEL needed to significantly affect body weight gain, feed intake,
and relative kidney size.
All blood parameters measured (GLU, ALB, TP, GLOB, AST, GGT, and UA)
were found to be increased above levels found in control birds and/or were found to
increase in a linear fashion as dietary MEL increase. Brand (2011) documented increased
serum ALB, TP, GLOB, AST, and GGT above levels of control birds, in broilers fed
graded levels of MEL up to 3.00 % of the diet. No changes in serum chemistry was
documented in poults fed up to 1.50 % MEL (Brand, 2011). However, poults receiving
2.00, 2.50, and 3.00 % MEL were terminated early due to high treatment related
mortality, and blood serum was not collected for analysis.

48
Elevated UA can be used to diagnose renal failure, with increased levels
occurring when more than 70 % of kidney function is lost (Cornell, 2010c). In the
present study, ducks consuming 2.25 % MEL had UA levels that were 4.7 times that of
control ducks. GGT is an enzyme present in the liver, kidney and pancreas (Nicoll et al.,
2012) that catalyzes the transfer of amino acids from one peptide to another (Vroon and
Israili, 1990). Elevated levels of GGT can be also an indication of renal failure (Limdi
and Hyde, 2003). Therefore, elevated levels of UA and GGT in the current study point
towards a decrease in renal function.
Dehydration could explain the elevated levels of ALB, TP, GLOB, and GLU.
Dehydration can occur due to the loss of appetite and nausea associated with kidney
failure (early mortality ducks fed ≥ 2.00 % MEL had little to no feed in the upper
gastrointestinal tract). Another possible cause of dehydration is the diuretic effect of
MEL, which has been documented in dogs (Lipschitz and Stockey, 1945). Serum
concentrations of ALB, TP, and GLOB can all be elevated during periods of dehydration
(Cornell, 2010a; Nicoll et al., 2012). This concentration of solids in the blood, which is
usually the result of fluid loss to the tissues, is termed hemoconcentration (Merriam-
Webster, 2012). The occurrence of hemoconcentration has been reported during periods
of dehydration (Diseases, 2008). The measurement of packed cell volume could be used
to confirm these results, but was not measured in the current experiment.
Asparate transaminase (AST), an enzyme that catalyzes the transfer of alpha
amino groups from aspartic acid to alpha-ketoglutaric acid (Cornell, 2010b) was found to
increase in a linear fashion during the current experiment. AST is not organ specific but
is known to be found in renal epithelial cells (Cornell, 2010b). Therefore, damage to the
49
epithelial cell could result in release of AST into the blood, thus elevating serum AST
levels in ducks fed higher dietary levels of MEL.
MEL residue in the kidney increased in a quadratic fashion. Ducks fed ≥ 0.25 %
MEL had residue levels in the kidney that were higher than controls. Ducks fed 2.25 %
MEL had kidney residue concentration of 295 mg/kg. Broilers fed 2.25 % MEL for 21
days had kidney residue values of 846 ppm (Brand, 2011) which is 2.8 fold higher than
residue levels found in the kidneys of ducks fed 2.25 % MEL for 21 days. Brand (2011)
fed 2.25 % MEL to poults and reported kidney MEL concentrations of 586 mg/kg. This
twofold difference between poults and ducks could be due to the differences in how the
two species absorb and eliminate MEL. Extremely high mortality (≥ 63 %) was observed
by Brand (2011) when feeding ≥ 2.00 % MEL in the diet to poults. In the current study,
mortality was only 20 % for ducks fed 2.00 and 2.25 % MEL. These data suggest that
ducks, unlike poults are able to excrete MEL more efficiently. Thus MEL does not
accumulate in the kidney of ducks to the degree it does in poults and renal related
mortality is reduced [32 % in poults (Brand, 2011) and 15 % in ducks: both fed 1.50 %
MEL].
Muscle residue levels were lower than residue levels seen in the kidney. This is
similar to data reported by Lu et al. (2009), in which the kidneys of broilers fed 0.1 %
MEL for 42 days had a residue value of 9.17 ppm, which is higher than the 3.73 ppm
detected in the breast meat of ducks from the same treatment. Higher MEL residue
values in the kidney than the breast muscle is supported by data by Baynes et al. (2008)
who suggested MEL distribution in the pig was related to total body water and is not
distributed to most organs, and Dobson et al. (2008) and Puschner et al. (2007) who noted

50
precipitation of MEL and CYA complexes in the kidney. Precipitation of MEL and CYA
complexes in the kidney probably occur because of increased concentrations of the
compounds as they move down the osmotic gradient (Dobson et al., 2008). Therefore, it
is reasonable to assume that MEL concentrations in the kidney would be greater than that
in the muscle, due to the compound becoming more concentrated by the function of the
kidneys. In the current study, bile had a much higher concentrations of MEL than the
kidney, suggesting that bile is a route of elimination in Pekin ducks. Use of the bile as a
route of elimination has been suggested to occur in other avian species by Brand (2011).
Gross and histopathology of early mortalities revealed that birds fed ≥ 1.50 %
MEL treatments to have been off feed at time of death. All but one of these ducks had
pale and enlarged kidneys. Enlarged and pale kidneys have been documented in poults
and broilers fed ≥ 1.00 and ≥ 2.00 % MEL, respectively (Brand, 2011). The renal lesions
noted in early mortality ducks were comparable to those seen with MEL toxicity in
broilers and poults (Brand, 2011).
Gross pathology of ducks that survived to termination revealed similar findings
as early mortality ducks, with pale and enlarged kidneys. Histopathology revealed that
MEL did not affect the kidney until dietary inclusion is ≥ 0.75 %. Dietary levels between
0.75 % MEL to 1.75 % MEL caused renal damaged compatible with mild toxicity.
Dietary MEL ≥ 2.00 % caused renal damage compatible with mild to severe toxicity.
The pathology documented in ducks fed ≥ 0.75 % MEL is comparable to that
documented in chickens and turkeys (Brand, 2011). Mature Jinding ducks exposed to 25
mg/kg of fed (0.0025 % of the diet) for 21 days showed signs of tubular cell necrosis and
lymphocytic infiltration of the kidneys during histological examination (Gao et al., 2010).

51
It appears that concentrations of MEL in the bile need to be ˃ 203 ppm to favor
crystal formation. This is based on the residue levels of MEL detected in the bile via
HPLC analysis. The bile of ducks fed 0.75 % MEL had a residue value of 203 ppm and
no crystals visible during microscopic examination while ducks fed 1.00 % MEL had bile
residue values of 475 ppm and a moderate number of crystals present in the bile.
Histopathology evaluation revealed that 1.00 % MEL was the lowest dietary treatment to
induce crystals in the kidney. At this level, HPLC analysis determined a MEL residue
level of 335 ppm in the kidney. The next lowest treatment, 0.75 % MEL, had a kidney
residue value of 161 ppm. This suggests that melamine concentrations need to exceed
161 ppm to induce crystal formation in the kidney.
In conclusion, there are documented changes in the gross renal appearance and
findings of the histological examination that are indicative of renal damage. These
findings coupled with elevated levels of GLU, ALB, TP, GLOB, AST, GGT, and UA,
indicate decreased renal function suggesting renal failure induced by MEL damage is the
most likely cause of decreased performance and mortality noted during the current study.
With significant decreases in body weight gain, feed intake and increases in relative
kidney weights occurring in ducks fed ≥ 1.00 % MEL, along with changes in serum ALB,
TP, GLOB, and UA, at the same level, it appears that dietary concentrations ≤ 0.75 % is
the threshold level that can be tolerated, without significant negative effects, on young
Penkin ducks. Finally, HPLC analysis shows that the bile is used as a way for ducks to
eliminate MEL from their body.
52
Table 3.1. Ingredients and nutrient composition of basal ration used to make individual experimental diets for young Pekin ducks Ingredient
Composition (%)
Corn 59.988 Soybean Meal 34.774 Dicalcium Phosphate 1.458 Limestone 0.507 Corn Oil 0.451 Salt 0.333 Trace Mineral1 0.100 Vitamin Mix2 0.075 DL-Methionine 0.060 Copper Sulfate 0.004 Sand 2.250 Total 100.000 Nutrient composition (calculated) Crude Protein (%) 22.00 Metabolizable Energy (kcal/Kg) 2,900 Lysine (%) 1.19 Methionine (%) 0.40 Methionine + Cysteine (%) 0.76 Threonine (%) 0.82 Calcium (%) 0.65 None Phytate Phosphorus (% Av.) 0.40
1Trace mineral mix provided (mg/kg of diet): manganese, 110 mg from MnSO4; iron, 60 mg from FeSO4•7H2O; zinc, 110 mg from ZnSO4; iodine, 2 mg from ethylenediamine dihydroidodide. 2Vitamin mix provided(per kg of feed): vitamin A (retinyl acetate), 8,800 IU; cholecalciferol, 3,855 ICU; vitamin E (DL-α-tocopheryl acetate), 14 IU; niacin, 55 mg; calcium pantothenate, 17 mg; riboflavin, 6.6 mg; pyridoxine, 2.2 mg; menadione sodium bisulfate, 1.7 mg; folic acid, 1.4 mg; thiamin mononitrate, 1.1 mg; biotin, 0.2 mg; cyanocobalamin, 11 µg.

53
Table 3.2. Effects of melamine on performance and organ weights of Pekin ducks
Treatment1
Response Variables2 Melamine
(%) BWG (g)
FI (g)
F:G (g:g)
Mortality3 (%)
Liver4
(%) Kidney4
(%)
Basal Diet + 0.00% M 832a 1,658a 2.01d 5bc 3.89 1.18d
Basal Diet + 0.25% M 787a 1,647a 2.09d 0c 3.84 1.20d
Basal Diet + 0.50% M 774a 1,590a 2.05d 0c 4.04 1.32cd
Basal Diet + 0.75% M 775a 1,557a 2.04d 5bc 4.08 1.26cd
Basal Diet + 1.00% M 615b 1,324b 2.17d 0c 4.23 1.95bc
Basal Diet + 1.25% M 615b 1,361b 2.22d 0c 4.12 1.94c
Basal Diet + 1.50% M 458c 1,128c 2.65c 15ab 4.00 2.64ab
Basal Diet + 1.75% M 439cd 1,146c 2.73bc 5bc 3.97 2.84a
Basal Diet + 2.00% M 358d 1,028c 3.12a 20a 3.67 3.30a
Basal Diet + 2.25% M 392cd 1,052c 3.02ab 20a 3.71 3.33a
ANOVA:5 S.E.M. 32 59 0.11 0.08 0.15 0.24
P-Value < 0.0001 < 0.0001 < 0.0001 0.0008 0.2104 < 0.0001
Regression:6 L: P-Value < 0.0001 < 0.0001 < 0.0001 < 0.0001 0.1879 < 0.0001
Q: P-Value 0.6289 0.9144 0.0023 0.0119 0.0034 0.0952
1Treatments were the addition of melamine, in percent indicated, to a basal diet. Diets were fed for 21 consecutive days. 2Data are means of five replicate pens, with four ducks per pen for BWG, AFI, F:G, and Mortality, and three ducks per pen for relative liver and kidney weights. 3Means are percent of mortality that occurred out of 20 birds. Statistical analysis was performed on transformed data (arcsine). 4Relative organ weights, expressed as a percentage of body weight. 5One way analysis of variance values. 6Regression: Linear (L) or quadratic (Q) regression. a-dMeans within a column with no common superscript are different (P < 0.05). BWG = average body weight gain; FI = feed intake; F:G = feed to gain; M = melamine.

Table 3.3. Effects of melamine on serum chemistry of Pekin ducks
Treatment1
Response Variables2
Melamine (%)
GLU (mg/dL)
ALB (g/dL)
TP (g/dL)
GLOB (g/dL)
AST (U/L)
GGT (U/L)
UA (mg/dL)
Basal Diet + 0.00% M 224 1.32c 3.12c 1.82c 53.4 2.68de 7.34d Basal Diet + 0.25% M 226 1.32c 3.10c 1.78c 36.9 2.32e 8.62d Basal Diet + 0.50% M 184 1.34bc 3.26c 1.90c 38.5 2.48e 7.78d Basal Diet + 0.75% M 199 1.34bc 3.30c 1.98c 28.0 2.54e 11.56cd Basal Diet + 1.00% M 263 1.62a 3.96ab 2.40ab 29.5 3.86bcd 25.10ab Basal Diet + 1.25% M 239 1.50ab 3.80b 2.30b 73.4 3.00cde 21.44bc Basal Diet + 1.50% M 252 1.50ab 3.98ab 2.46ab 99.7 4.02bc 31.62ab Basal Diet + 1.75% M 248 1.54a 4.10ab 2.54a 57.3 3.86bcd 35.48a Basal Diet + 2.00% M 255 1.58a 4.10ab 2.52a 239.8 4.74ab 33.84a Basal Diet + 2.25% M 270 1.60a 4.18a 2.58a 188.6 5.44a 34.74a
ANOVA:3 S.E.M 25 0.06 0.12 0.08 52.2 0.45 4.18 P-Value 0.2825 0.0002 < 0.0001 < 0.0001 0.0733 < 0.0001 < 0.0001
Regression:4 L: P-Value 0.0193 < 0.0001 < 0.0001 < 0.0001 0.0021 < 0.0001 < 0.0001 Q: P-Value 0.6393 0.4101 0.1555 0.1016 0.0609 0.0710 0.6567
1Treatments were the addition of melamine, in percent indicated, to a basal diet. Diets were fed for 21 consecutive days. 2Data are means of five replicate pens with three ducks per pen. 3One way analysis of variance values. 4Regression: Linear (L) or quadratic (Q) regression. a-eMeans within a column with no common superscript are different (P < 0.05). GLU = glucose; ALB = albumin; TP = total protein; GLOB = globulin; AST = asparate transaminase; GGT = gamma glutamyltranserase; UA = uric acid; M = melamine.
54
55
Table 3.4. Residue levels of melamine in kidney, muscle, and bile of Pekin ducks
Treatment1
Response Variables Melamine
(%) Kidney2
(ppm) Muscle3 (ppm) Bile4
(ppm)
Basal Diet + 0.00% M NDe NDf 0
Basal Diet + 0.25% M 29d 14f 25
Basal Diet + 0.50% M 42c 13f 91
Basal Diet + 0.75% M 161b 74e 203
Basal Diet + 1.00% M 335a 127d 475
Basal Diet + 1.25% M 284a 135cd 427
Basal Diet + 1.50% M 385a 212b 613
Basal Diet + 1.75% M 388a 184bc 575
Basal Diet + 2.00% M 340a 173bcd 640
Basal Diet + 2.25% M 295a 262a 560
ANOVA5: S.E.M 0.05 17 -
P-Value < 0.0001 < 0.0001 -
Regression6: L: P-Value < 0.0001 < 0.0001 -
Q: P-Value < 0.0001 0.4728 -
1Treatments were the addition of melamine, in percent indicated, to a basal diet. Diets were fed for 21 consecutive days. 2Data are means of four replicate pens, with one duck per pen. Statistical analysis for kidney was performed on transformed data (log10). 3Data are means of four replicate pens, with one duck per pen. 4Bile from all replicates was pooled and data are means of duplicate HPLC analysis per treatment. Statistical analysis not performed due to lack of replicates. 5One way analysis of variance values. 6Regression: Linear (L) or quadratic (Q) regression. a-fMeans within a column with no common superscript are different (P < 0.05). M = melamine; ND = none detected.

56
Figure 3.1. Effects of melamine on the performance of young Pekin ducks fed treatments from hatch to 21 days of age. Duck on left belong to the control treatment while the duck on the right received a diet contaminated with MEL.
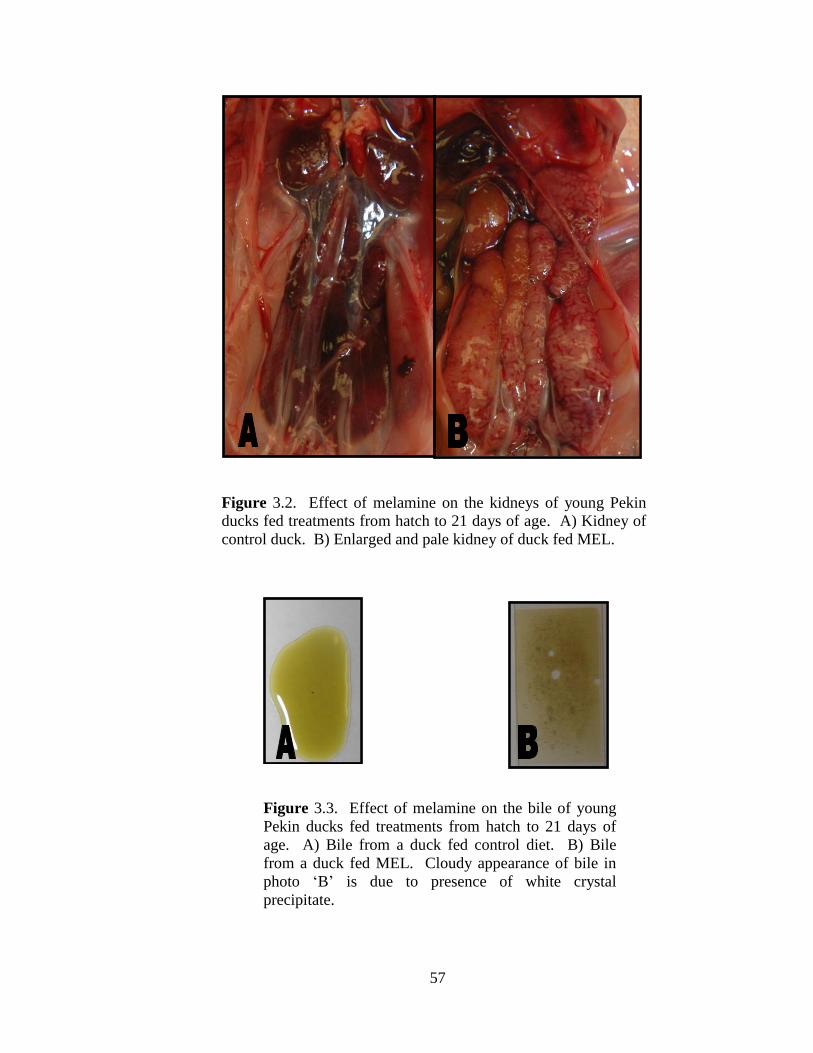
57
Figure 3.2. Effect of melamine on the kidneys of young Pekin ducks fed treatments from hatch to 21 days of age. A) Kidney of control duck. B) Enlarged and pale kidney of duck fed MEL.
Figure 3.3. Effect of melamine on the bile of young Pekin ducks fed treatments from hatch to 21 days of age. A) Bile from a duck fed control diet. B) Bile from a duck fed MEL. Cloudy appearance of bile in photo ‘B’ is due to presence of white crystal precipitate.

58
Figure 3.4. Microscopic examination of bile from ducks fed graded levels of melamine. Crystals observed at 400 x magnification in the bile of duck fed 2.25 % MEL for 21 days.
Figure 3.5. Kidney section from a control and duck fed 2.25 % melamine, viewed at 100 x magnification. Photo ‘A’ shows the appearance of a normal kidney section while photo ‘B’ shows the effects of 2.25 % MEL on the kidney of a young Pekin duck from hatch to 21 days of age. Arrows point to dilated tubules with casts present.

59
Chapter 4
Individual and Combined Effects of Melamine and Cyanuric Acid in
Young Pekin Ducks
Introduction
Melamine (C3H6N6) is a white, crystalline powder (OSHA, 2006) with a wide
variety of industrial applications including use in the manufacturing of plastics,
adhesives, laminates, paints, flame retardants, textiles finishes, and fertilizers (Hilts and
Pelletier, 2009). Melamine is 66% nitrogen by mass and will artificially increase the
protein content of a matrix when the Kjeldahl method is used for protein analysis (Yang
et al., 2009). Therefore, melamine has been added to feed ingredients to increase their
apparent crude protein value and subsequently their monetary value (WHO, 2008a).
Cyanuric acid, along with ammeline and ammelide, are structural analogues of melamine
(Tyan et al., 2009; WHO, 2008a) and all belong to the class of chemicals known as s-
triazines (Wackett et al., 2002). Hydrolysis or amination of one s-triazine can result in
the production of another s-triazine (Baynes and Riviere, 2010).
Conversion of melamine to cyanuric acid can occur during the manufacturing of
melamine resulting in a final product that is not 100% pure (Dobson et al., 2008). Jutzi et
al. (1982) documented that bacteria can convert melamine to cyanuric acid with Filigenzi
et al. (2007) stating that no known conversion of melamine to related compounds exist in
mammals. However, Baynes and Riviere (2010) state that bacterial degradation could

60
possibly take place in the gastrointestinal tract or biological fluids. Therefore, there exist
several possible routes by which both melamine and related compounds can be found in
biological systems simultaneously.
In 2007, the deaths of cats and dogs related to renal failure were documented
across North America and South Africa (Hilts and Pelletier, 2009). It was later
determined that wheat gluten, imported from China and incorporated into pet food, had
been contaminated with melamine and cyanuric acid (Hilts and Pelletier, 2009). Brown
et al. (2007) examined six dogs and ten cats that consumed contaminated pet food and
observed that all had elevated blood urea nitrogen and creatinine levels with polarizable
crystals in the distal tubules and collecting ducts of their kidneys.
Toxicity in mammals occurs because of the ability of melamine and cyanuric acid
to self-assemble and form a hydrogen-bonded bimolecular network (Perdigao et al.,
2006). Self-assembly can lead to the formation of insoluble compounds that can
precipitate in the kidneys, leading to renal failure (Seffernick et al., 2010). Publications
by Tolleson (2009) and Dobson et al. (2008) described possible routes of absorption of
melamine and related compounds as well as precipitation of insoluble compounds which
can lead to renal failure.
Following the incident of contamination of pet food in 2007, it was determined
that waste material containing melamine and cyanuric acid from pet food manufacturing
was incorporated into swine, poultry, and aquaculture feeds (Buur et al., 2008;
Karbiwnyk et al., 2009; USDA, 2007a). The Food Safety and Inspection Service (FSIS)
division of the USDA, in cooperation with state and local producers, quarantined all
animals that had consumed contaminated pet food scraps (USDA, 2007a). However,

61
after extensive testing, the USDA FSIS determined that products from poultry and swine
which consumed feed contaminated with melamine and related compounds were “not
adulterated” and were able to be offered for sale (USDA, 2007a, b). Since the
contamination of pet food and subsequent contamination of swine and poultry feed,
several publications have reported on the effects of consumption of both melamine and
cyanuric acid, alone or in combination, to poultry and swine (Brand, 2011;
Reimschuessel et al., 2008; Stine et al., 2011).
Brand (2011) conducted six experiments to determine the effects of feeding
melamine and cyanuric acid, alone or in combination, to broilers and poults from hatch to
21 days of age. It was determined that melamine alone depressed growth performance of
young broilers and poults when it was included in the diet at ≥ 1.5% (Brand, 2011).
Inclusion of up to 3.0 % cyanuric acid to young broiler and poult diets did not affect
performance or kidney function (Brand, 2011). The inclusion of cyanuric acid to diets
that contained melamine (0.5, 1.0, and 1.5% of each compound) reduced the negative
effects of melamine in poults (Brand, 2011). However, in young broilers, the
combination of cyanuric acid and melamine resulted in poorer growth performance and
production of crystals in the kidneys as compared to either compound alone (Brand,
2011).
The objective of the current study was to determine the effects of feeding
melamine and cyanuric acid, alone or in combination, to Pekin ducks from hatch to 21
days of age. Dietary treatments included melamine and cyanuric acid, individually at 0.5,
1.0, and 1.5% of the diet, and combinations of 0.5, 1.0, and 1.5% of both compounds.
Another objective of this study was to determine if melamine accumulated in the tissues
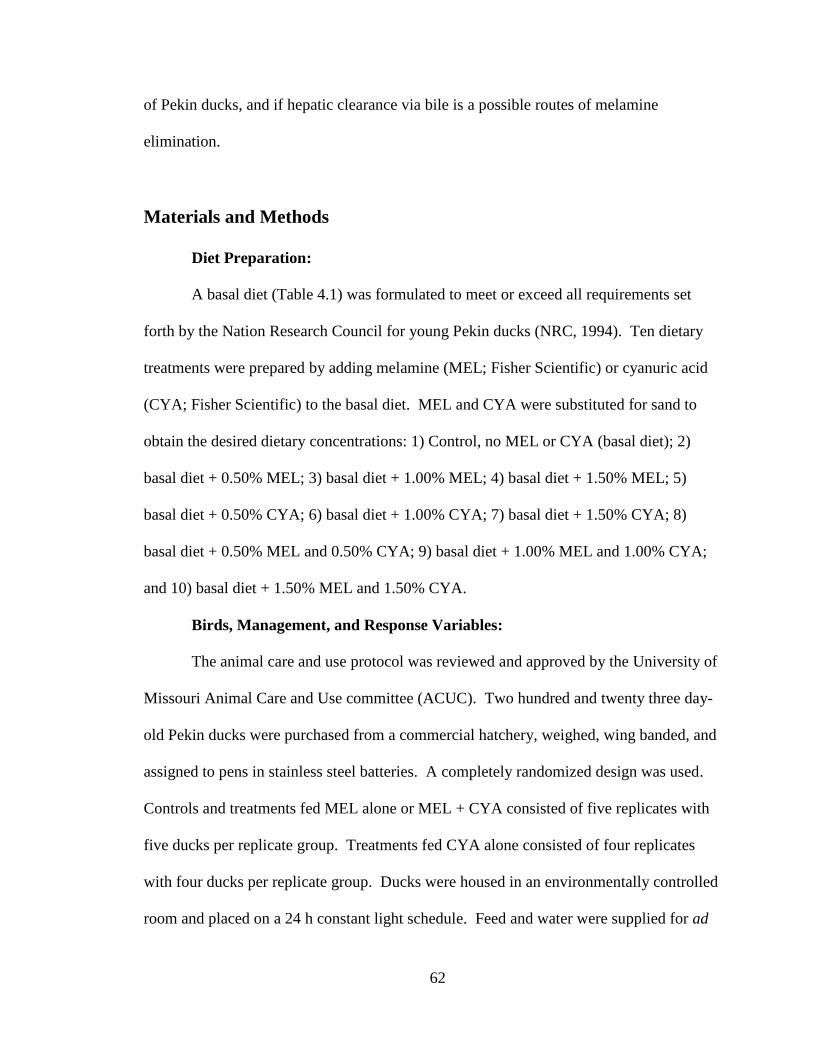
62
of Pekin ducks, and if hepatic clearance via bile is a possible routes of melamine
elimination.
Materials and Methods
Diet Preparation:
A basal diet (Table 4.1) was formulated to meet or exceed all requirements set
forth by the Nation Research Council for young Pekin ducks (NRC, 1994). Ten dietary
treatments were prepared by adding melamine (MEL; Fisher Scientific) or cyanuric acid
(CYA; Fisher Scientific) to the basal diet. MEL and CYA were substituted for sand to
obtain the desired dietary concentrations: 1) Control, no MEL or CYA (basal diet); 2)
basal diet + 0.50% MEL; 3) basal diet + 1.00% MEL; 4) basal diet + 1.50% MEL; 5)
basal diet + 0.50% CYA; 6) basal diet + 1.00% CYA; 7) basal diet + 1.50% CYA; 8)
basal diet + 0.50% MEL and 0.50% CYA; 9) basal diet + 1.00% MEL and 1.00% CYA;
and 10) basal diet + 1.50% MEL and 1.50% CYA.
Birds, Management, and Response Variables:
The animal care and use protocol was reviewed and approved by the University of
Missouri Animal Care and Use committee (ACUC). Two hundred and twenty three day-
old Pekin ducks were purchased from a commercial hatchery, weighed, wing banded, and
assigned to pens in stainless steel batteries. A completely randomized design was used.
Controls and treatments fed MEL alone or MEL + CYA consisted of five replicates with
five ducks per replicate group. Treatments fed CYA alone consisted of four replicates
with four ducks per replicate group. Ducks were housed in an environmentally controlled
room and placed on a 24 h constant light schedule. Feed and water were supplied for ad
63
libitum consumption for 21 days. Ducks were observed daily and mortality was recorded
as it occurred. All ducks that died before day 21 were weighed and sent to the Avian
Pathology Lab at the University of Missouri (Columbia, MO) for necropsy.
On day 21, ducks and feed were weighed and body weight gain, feed intake, and
feed conversion were calculated. All ducks were then euthanized by carbon dioxide
followed by cervical dislocation. Blood samples were collected, via cardiac puncture,
from ten ducks per treatment, centrifuged (Sorvall, RC 3 B plus) at 1,400 x g for 30
minutes at 7ºC before serum was separated. Serum was then sent to the University of
Missouri Veterinary Pathology Laboratory (Columbia, MO) for analysis of glucose
(GLU), albumin (ALB), total protein (TP), globulin (GLOB), calcium (Ca), asparate
transaminase (AST), gamma glutamyltranserase (GGT), and uric acid (UA). Liver and
kidneys were removed from three ducks per pen and weighed. Relative liver and kidney
weights were calculated by dividing organ weight by body weight. Sections of liver and
kidney were taken from six ducks per treatment and fixed in 10% neutral buffered
formalin for histopathological evaluation. Sections of liver, kidney, and breast muscle,
along with bile from all treatments, were collected and frozen for later analysis of MEL
concentrations.
Melamine Analysis:
MEL extraction from tissue and bile samples was based on the method used by
Brand (2011), and involved high-performance liquid chromatography (HPLC) via UV
detection. For kidney and muscle, 10 mL of water:acetonitrile (1:2) was added to 1 g of
tissue and the tissues homogenized for 30 sec in a 50 mL conical centrifuge tube. The
homogenized sample was then centrifuged for 5 min at 1,000 rpm (Dynac II centrifuge;
64
Sparks, MD) and the supernatant transferred to microcentrifuge tubes and further
centrifuged for 5 min at 10,000 rpm (Spectrafuge 16M; Woodbridge, NJ). The
supernatant was extracted and filtered through a MycoSep® 224 AflaZon columns
(Romer Labs, 2011). Finally, 500 µL of the filtered supernatant was diluted (1:1) with
buffer solution (BUFF; 1.924 g citric acid and 2.34 g of octanesulfonate dissolved in L of
distilled water, pH adjusted to 3 using NaOH) before HPLC analysis was performed.
For bile, extraction involved adding 200 µL of bile to 1,800 µL of
water:acetonitrile (1:2), vortexing and transferring the samples to microcentrifuge tubes
and centrifuging for d min at 10,000 rpm (Spectrafuge 16M). The supernatant was
collected and filtered through MycoSep® 224 AflaZon column (Romer Labs, 2011).
Finally, 500 µL of the filtered supernatant was diluted (1:1) with BUFF before high-
performance liquid chromatography (HPLC) analysis was performed.
A Hitachi Model L-7100 pump with a Model L-7485 fluorescence detector,
Hitachi Model L-7200 autosampler with Hitachi D-7000 data acquisition interface and
ConcertChrom software on a microcomputer were used for HPLC analysis (Tokyo,
Japan). A HyperClone (Phenomonex) C18 column (100 x 4.60 mn) was used with a
retention time of 6 min and flow rate of 1 mL/min. UV detection occurred at 240 nm.
The mobile phase consisted of BUFF:acetrilnitril(ACN; 87:13).
A primary standard of 2,000 ppm MEL solution was diluted with BUFF:ACN
(1:1) to prepare standards of 1, 5, 10, and 20 ppm MEL. MEL Standards were ran before
and after each set of samples and used to calculate a standard curve. The area under the
curve was calculated, plotted on the standard curve, and used to calculate individual MEL
concentrations in samples. The limit of detection was set at 8.0 ppm.

65
Statistical Analysis:
Data were analyzed using the general linear model procedures of Statistical
Analysis Software (SAS, 2006). Pen was the experimental unit. Variables that showed
significant differences in the ANOVA were compared using Fisher’s protected least
significant difference procedure. Statistical significance was accepted at a P-value of ≤
0.05. An arcsine transformation was applied to percent mortality data before statistical
analysis was performed. Data for MEL residue levels in the muscle tissue and kidneys
were ranked, based on a method developed by Conover and Iman (1981), before analysis.
Results
Performance and Mortality:
The effects of MEL and or CYA on body weight gain, feed intake, feed
conversion, and mortality are summarized in Table 4.2. Inclusion of MEL at 0.50 % of
the diet did not negatively (P > 0.05) affect body weight gain, average feed intake, or
percent mortality. However, ducks fed MEL at 1.00 and 1.50 % of their diet had lower
(P < 0.0001) body weight gains and feed intake, and higher percent mortality than control
ducks. Inclusion of 1.50 % MEL in the diet increased (P < 0.0002) feed to gain compared
to that of control birds. Figure 4.1 demonstrates the effect of 1.50 % MEL (duck ‘D’) on
body gain weight of ducks up to 21 days of age.
The addition of CYA up to 1.50 % of the diet did not cause body weight gain,
average feed intake, feed conversion, or mortality to be different (P > 0.05) from that of
control ducks. The inclusion of CYA to diets that contained MEL, in a 1:1 ratio of CYA
to MEL, was able to reduce the negative effects of MEL on performance. There was no

66
difference (P > 0.05) among controls and birds fed combinations of MEL and CYA, up to
1.50 % of each compound, in body weight gain, average feed intake, feed conversion, or
percent mortality. Figure 4.1 shows the ability of CYA, added to a diet that contains
MEL (duck ‘J’), to alleviate the effects on body weight gain MEL (duck ‘D’).
Organ Weights:
The effects of MEL, CYA and combinations of MEL + CYA on organ weights of
young Pekin ducks are summarized in Table 4.2. There was no effect (P > 0.05) of MEL
or CYA, alone or in combination, on relative liver weights of ducks. Ducks fed 1.0 and
1.50 % MEL had heavier (P < 0.0001) relative kidney weights than controls. Ducks fed
CYA up to 1.5 % of the diet, and CYA in combination with MEL, did not have relative
kidney weights that were different (P > 0.05) from that of controls. Figure 4.2 shows the
effect of MEL (1.50 %; picture ‘B’) and MEL + CYA (1.50 % MEL + 1.50 % CYA;
picture ‘C’) on the kidneys of young Pekin ducks. Picture ‘A’ shows the kidneys of
ducks fed a control diet, which are similar to the kidneys of ducks fed MEL + CYA
(picture ‘C’). However, the kidneys from ducks fed MEL (1.50 %; picture ‘B’) are pale
in enlarged when compared to the kidneys from control ducks (picture ‘A’) and ducks fed
MEL + CYA (picture ‘C’).
Serum Chemistry:
Table 4.3 shows the effects of MEL and CYA, alone or in combination, on the
serum chemistry of young Pekin ducks. Serum concentrations of GLU, Ca, AST, and
GGT were not affected (P > 0.05) by any treatment. Serum ALB (P = 0.0004), TP (P = <
0.0001), GLOB (P = < 0.0001), and UA (P < 0.0001) were elevated above control levels

67
in ducks fed 1.00 and 1.50% MEL in the diet. No other treatments caused a change (P >
0.05) in levels of these serum parameters.
Tissue Residue:
The effects of MEL and CYA alone or in combination on the residue levels of
MEL in the kidneys, breast muscle, and bile of the ducks can be seen in Table 4.4.
Inclusion of MEL at ≥ 0.50 % of the diet increased concentrations of MEL in kidneys (P
< 0.0001) and breast muscle (P < 0.0001) compared to control ducks. No MEL was
detected in the kidneys or breast muscle of ducks fed ≤ 1.50 % CYA. Combination
(MEL + CYA) fed ducks had lower MEL residue levels in their kidneys and breast
muscle compared to ducks fed MEL (≤ 1.50 %) alone. Ducks fed the highest
combination of MEL + CYA (1.50 % of each compound) had no MEL residue in their
kidneys or breast muscle. Ducks fed lower concentrations of MEL + CYA (≤ 1.00 % of
each compound) had residue levels that were higher than ducks fed 1.50 % MEL + 1.50
% CYA, but approximately four fold lower than ducks fed 0.50% MEL alone.
Due to logistical problems during termination, bile from birds in each treatment
were pooled. Therefore, statistical analysis could not be performed on the bile. Means
presented in Table 4.4 are an average of duplicate HPLC analysis performed on bile
samples taken from each treatment. MEL levels in the bile increased as more MEL was
included in the diet, ranging from 92 ppm in ducks fed 0.50 % MEL to 568 ppm in ducks
fed 1.50 % MEL. Combination fed ducks (MEL + CYA) had MEL levels in the bile
ranging from 23 to 30 ppm. While these levels are higher than controls, they are much
lower than in ducks fed MEL only.

68
Pathology:
Mortality:
The percent mortality can be seen in Table 4.2. Only diets that included MEL
alone (0.50, 1.00, 1.50 %) incurred mortality at one, four, and eleven percent,
respectively. Eleven of the thirteen ducks that were examined had pale and enlarged
kidneys. Eight of the thirteen ducks had white crystals present in the bile during gross
examination. Figure 4.3 shows crystals present in the bile of a duck fed 1.50 % MEL.
Crystals from the bile of early these were spherical and brown in appearance.
Termination:
By day 21 of the study, there was a clear difference in size of ducks among
treatments. Ducks that consumed 1.00 and especially 1.50 % MEL were much smaller
than control ducks and ducks fed ≤ 1.50 % CYA (Figure 4.1). Microscopic examination
of pooled bile specimens collected during termination revealed isolated spherical crystals
present in the bile of ducks fed 1.00 % MEL, and numerous brown small spherical
crystals, with some aggregates of spherical crystals present in the bile of ducks fed 1.50
% MEL. Bile from all other groups appeared clear and without crystals when viewed
microscopically. Figures 4.4 and 4.5 show crystals in the bile of ducks fed 1.00 and 1.50
% MEL.
Histopathology of liver sections from all treatment groups were unremarkable.
Ducks fed 1.00 and 1.50 % MEL were the only treatments to have kidneys that showed
abnormalities during histopathological examination. Four kidneys sections from the 1.00
% MEL treatment group and five kidneys from the 1.50 % MEL treatment group had
mild dilation of the embryonal nephrons and collecting tubules. Eosinophilic to

69
basophilic casts, some containing spherical eosinophilic crystals were also present in the
embryonal nephrons and collecting tubules (Figure 4.6). One kidney from the 1.50 %
MEL treatment had moderate dilation of the embryonal nephrons and collecting tubules
with eosinophilic to basophilic casts, some with spherical eosinophilic crystals, present.
Affected nephrons were often surrounded by a mild heterophilic infiltration. In rare
occasions, casts or crystals, similar to the ones previously described, were found in the
interstitial spaces and associated with mild multifocal hetrophil infiltration (Figure 4.7).
Discussion
Only treatments fed MEL (0.50, 1.00, and 1.50 %) incurred mortality during the
current experiment. In a previous study, 15 % mortality was observed in ducks fed 1.50
% MEL (chapter 3). This mortality rate is lower than the 44 % mortality that occurred in
ducks fed 1.50 % MEL in the current study. Fifty six percent mortality was reported in
young poults receiving 1.50 % MEL for 21 days (Brand, 2011). However, Brand (2011)
reported no treatment related mortality when feeding up to 1.50 % MEL to young broilers
for 21 days. Lu et al. (2009) documented no visible signs of ill health, mortality rates, or
changes in the behavior of broilers fed graded levels of MEL up to 0.1 % of the diet for
42 days. Mortalities from the current study were MEL related with ducks having pale
and enlarged kidneys. Pale and enlarged kidneys as a result of MEL ingestion has been
reported in poults fed ≥1.00 MEL, early mortality broilers fed ≥ 2.00 % MEL (Brand,
2011), and in ducks fed ≥ 1.50 % MEL (Chapter 3).
In the current study, no mortality occurred in the control treatment or in ducks fed
CYA alone or MEL + CYA. Similar results were reported when feeding up to 3.00 %

70
CYA to young broiler and poults (Brand, 2011). Brand (2011) also reported no
significant difference in mortality rates between controls and young broilers fed a
combination of MEL and CYA (1.50 % of each compound).
Decreases in performance (body weight gain, feed intake, feed conversion) are in
agreement with results from chapter 3 where body weight gain and feed intake were
decreased in ducks fed ≥ 1.00 % MEL and feed conversion increased in ducks fed ≥ 1.50
% MEL. The reduction in body weight gain is consistent with research in broilers and
poults that consumed ≥ 1.00 % MEL (Brand, 2011). Feed intake was also reduced in
young broilers fed ≥ 1.00 % MEL for 21 days (Brand, 2011). Results of the current study
support results of Lu et al. (2009), who noted no effects on weight gain, feed intake, and
feed conversions of broilers fed up to 0.1 % MEL for 42 consecutive days.
Inclusion of up to 1.50 % CYA did not cause weight gain, feed intake, or feed
conversion to be different than that of control ducks. Inclusion of up to 3.00 % CYA in
the diets of young broilers and poults also did not cause weight gain, feed intake, or feed
conversion to be different from that of controls (Brand, 2011). Similar results were
observed in ducks fed combinations of MEL + CYA (up to 1.50 % of each compound),
with weight gain, feed intake and feed conversion being similar to controls. These results
are similar to those reported in poults, where the inclusion of CYA to a diet that
contained MEL (up to1.50 % of each compound) reduced the negative effects of MEL
with respect to body weight gain and feed intake (Brand, 2011) . In contrast to the
findings in the current study and the findings in poults by Brand (2011), broilers that
consumed a combination of MEL and CYA (up to 1.50 % of each compound) had poorer

71
performance (feed intake and body weight gain) than broilers fed MEL ( up to 1.50 %) or
CYA ( up to 1.50 %) alone (Brand, 2011).
Relative liver weights were unaffected in the current study. However, relative
kidney weights were increased in ducks fed ≥ 1.00 % MEL. Similar results are reported
in Chapter 3, where feeding ≥ 1.00 % MEL to ducks increased kidney weights above that
of controls. Increased relative kidney weight have also been observed in studies with
broilers fed ≥ 1.50 % MEL and poults fed ≥ 1.00 % MEL (Brand, 2011). Feeding CYA
alone or MEL + CYA did not cause relative kidney weights to differ from controls.
Brand (2011) reported similar finding in poults, where feeding a combination of MEL
and CYA (up to 1.50 % of each compound) did not increase their relative kidney weights.
However, the ability of CYA to reduce the negative effects of MEL on relative kidney
weights, observed in the current study and in poults (Brand, 2011), was not observed
when feeding combinations of MEL and CYA (up to 1.50 % of each) to young broilers
(Brand, 2011).
From the data discussed previously (mortality, performance, and organ weight) ≤
1.50 % CYA in a duck ration does not affect mortality, performance, or relative liver and
kidneys weight. The addition of ≥ 1.00 % MEL does cause a reduction in feed intake,
body weight gain, percent mortality, and increased relative kidney weight. However,
when ≤ 1.50 % CYA is added to a diet that contains MEL (one-to-one ratio of CYA to
MEL), CYA is able to reduce the negative effects of MEL on feed intake, body weight
gain, percent mortality, and relative kidney weights. This ability of CYA to reduce the
negative effects of MEL is in agreement with research in poults fed similar dietary
concentrations (Brand, 2011). However, these data are in contrast to findings in broilers

72
fed similar dietary concentrations where the combination of MEL and CYA was more
toxic that MEL alone. Data from the current experiment are also in contrast to swine
with respect to gain (Stine et al., 2011) where the combination of MEL and CYA (100
mg/kg BW/day, of each compound) caused a greater reduction in gain than MEL (200
mg/kg BW/day) alone.
Dehydration could explain the elevated levels of ALB, TP, and GLOB that were
observed in ducks fed ≥ 1.00 % MEL during the current study. Dehydration can occur
due to the loss of appetite and nausea associated with kidney failure. Another possible
cause of dehydration is the diuretic effect of MEL, which has been documented in dogs
(Lipschitz and Stockey, 1945). Serum concentrations of ALB, TP, and GLOB can all be
elevated during periods of dehydration (Cornell, 2010a; Nicoll et al., 2012). This
concentration of solids in the blood, which is usually the result of fluid loss to the tissues,
is termed hemoconcentration (Merriam-Webster, 2012). The occurrence of
hemoconcentration has been reported during periods of dehydration (Diseases, 2008).
The increase in UA during the present study, in ducks fed ≥ 1.00 % MEL, can be
caused by decreased renal function. Increased levels of UA are used to diagnose renal
failure, with increased levels occurring when more than 70 % of kidney function is lost
(Cornell, 2010c). Ducks that consumed 1.50 % MEL had UA levels that were 4.4 times
higher than levels in control animals. Increases in UA levels has also been reported in
mature laying ducks fed ≥ 50 ppm of MEL for 21 days (Gao et al., 2010) and young
Pekin ducks fed ≥ 1.00 % MEL (Chapter 3).
The increases in serum ALB, TP, GLOB, and UA levels of ducks fed ≥ 1.00 %
MEL confirms the findings during gross and histopathology that the kidneys of ducks fed

73
≥ 1.00 % MEL appeared pale and enlarged, with mild dilation of the embryonal nephrons
and collecting tubules. These findings also confirm the cause of death, renal failure,
which was seen in the ducks that died during the study.
The fact that ducks fed CYA (≤ 1.50 %) or MEL + CYA (≤ 1.50 % of each
compound) did not have increases in any serum parameter measured (GLU, ALB, TP,
GLOB, CA, AST, GGT, or UA) suggest that renal function was unaffected. Gross
appearance of the kidneys during termination revealed no apparent changes in size or
color among the kidney of ducks fed CYA (≤ 1.50 %), MEL + CYA (≤ 1.50 % of each
compound) or controls. This is supported by the histopathology reports that CYA (≤ 1.50
%) or MEL + CYA (≤ 1.50 % of each compound) fed ducks had kidneys that appeared
normal and unaffected by treatment.
The detection of MEL in the kidney, breast tissue, and bile observed in ducks fed
MEL during the current study were also observed in a previous study that involved
feeding graded levels of MEL to Pekin ducks (Chapter 3). The bile of ducks fed MEL
alone had the highest average MEL residues values (383 ppm) followed by the kidney
(154 ppm) and finally the breast muscle (93 ppm). The ability of the duck kidney to
accumulate MEL has been document by (Yan et al., 2009). These data are in agreement
with data presented in Chapter 3, where feeding graded levels of MEL (up to 2.25 %) to
young Pekin ducks, resulted in the bile having the highest residue level, followed by the
kidney and then breast muscle. These data suggest that ducks can use the hepatobiliary
system along with the kidneys as ways to eliminate MEL from their body. The ability to
eliminate MEL via the bile has been suggested to occur in ducks (Chapter 3) and in
broilers and poults (Brand, 2011). After feeding graded levels of MEL (up to 0.1 % of
74
the diet) to broilers for 42 consecutive days Lu et al. (2009) reported that breast meat had
lower MEL residue levels than the kidney.
In the current study, MEL + CYA (≤ 1.50 % of each compound) had lower
residue values in the kidney, breast muscle, and bile than ducks fed ≤ 1.50 % MEL.
Reimschuessel et al. (2008) observed similar results in fish, noting that fish that had
received only MEL or CYA usually contained higher residue levels of the compounds as
compared to fish that were administered both compounds simultaneously. Reimschuessel
et al. (2008) went on to state that the decrease in muscle residues levels was due to the
MEL-CYA complex precipitating out in the gastrointestinal tract and kidneys, thus
decreasing its bioavailability. The results of the current study support this hypothesis by
Reimschuessel et al. (2008), since lower muscle residue levels were detected in MEL +
CYA (≤ 1.50 % of each compound) fed ducks as compared to ducks fed ≤ 1.50 % MEL.
Ducks fed MEL + CYA (≤ 1.50 % of each compound) also had lower kidney residue
levels than ducks fed MEL (≤ 1.50 %). It is possible that most of the precipitation of the
MEL-CYA complex occurs in the gastrointestinal tract, thus not allowing MEL to be
absorbed. Another possibility is that ducks, unlike fish, can eliminate MEL in the bile,
thus decreasing the amount of MEL that passes through the kidneys.
With no lesions or pathologic changes observed in the liver section of ducks from
all treatments it appears that MEL, CYA, or MEL + CYA at these dietary inclusion levels
does not cause hepatic damage. Histopathology results also indicate that CYA, up to
1.50 % of the diet and fed for 21 consecutive days does not damage the kidney of young
Pekin ducks. The addition of ≥ 1.00 % MEL does cause renal lesions that are compatible
with mild MEL toxicity. Renal damage seen in ducks fed ≥ 1.00 % MEL contributed to

75
or directly caused the decreased performance and changes in blood serum chemistry
documented in the current experiment. Similar results in the gross and histopathology
appearance of the kidney have been documented in poults and broilers fed MEL (Brand,
2011). However, addition of CYA to a diet contaminated with MEL protected the kidney
against the damaging effects of MEL. This ability of CYA to alleviate the negative
effects of MEL has been documented in poults fed similar dietary levels of MEL and
CYA (Brand, 2011). However, the combination of MEL and CYA was more toxic than
MEL alone when fed to broilers at similar dietary levels as was used in the current study
(Brand, 2011).
Microscopic examination of the bile also determined the presence of MEL
crystals in ducks fed ≥ 1.00 % MEL. Crystals were not observed in the bile of ducks fed
0.50 % MEL, ≤ 1.50 % CYA, and MEL + CYA (up to 1.50 % of each compound).
Figures 4.3 and 4.5 shows the contrast in the concentration of MEL crystals present in the
bile of a duck that died during the study (Figure 4.3) to one that survived to termination
(Figure 4.5) (Both ducks received 1.50 % MEL). This suggests a greater
accumulation/concentration of MEL in the bile of the duck that died during the study.
Therefore, this duck might have been more efficient in absorbing MEL or less efficient in
excreting MEL. Differences in sensitivities to MEL was reported by Brand (2011) who
observed that a high number of poults died (due to renal failure) within the first half of
the experiment while others, consuming the same concentration of MEL in their diet,
survived until termination. Others have reported that birds fed MEL for 42 days had
lower tissue residue levels of MEL than birds that consumed MEL for 28 days (Lu et al.,
2009). Lu et al. (2009) went on to hypothesize that as birds age they develop a better

76
capacity to clear MEL from their body. Another hypothesis is that as these ducks age
residue values appear lower since the duck have increased in size, thus diluting the MEL
that is deposited in their tissues.
In conclusion, with the documented changes in performance, serum chemistry
values, and gross and microscopic appearance of the kidneys, the study indicates that
ducks fed ≥ 1.00 % MEL had decreased renal function leading to decreased growth and
eventually death. It is also evident that inclusion of up to 1.50 % CYA was not toxic to
young Pekin ducks. These data also indicate that inclusion of CYA to diets that contain
MEL (in a one to one ratio of MEL to CYA) is able to reduce the negative effect of MEL
in young Pekin ducks. It appears this decrease in toxicity of MEL due to CYA is from
the precipitation of the MEL-CYA complex in the gastrointestinal tract, thus decreasing
the absorption of MEL as compared to ducks fed MEL alone (Reimschuessel et al.,
2008). It also appears that young ducks can eliminate MEL via their bile, a process that
has been suggested to occur in other avian species (Brand, 2011).

77
Table 4.1. Ingredients and nutrient composition of basal ration Ingredient
Composition (%)
Corn 58.14 Soybean Meal 35.04 Dicalcium Phosphate 1.46 Limestone 0.51 Soybean Oil 1.06 Salt 0.33 Vitamin/mineral Mix1 0.35 DL-Methionine 0.11 Sand 3.00 Total 100.00 Nutrient composition (calculated) Crude Protein (%) 22.00 Metabolizable Energy (kcal/Kg) 2,900 Lysine (%) 1.19 Methionine (%) 0.44 Methionine + Cysteine (%) 0.80 Threonine (%) 0.82 Calcium (%) 0.65 None Phytate Phosphorus (% Av.) 0.40
1Vitamin/Mineral mix provided (mg/kg of diet): manganese, 40,000; zinc, 40,000; iron, 20,000; copper, 4,500; iodine, 600; selenium, 60; riboflavin, 2,640; pantothenic acid, 2,640; niacin, 11,000; vitamin B12, 4.0; choline, 154,000; biotin, 13.2; folacin, 275; thiamin, 550.

Table 4.2. Individual and combined effects of melamine and cyanuric acid on performance and organ weights of Pekin ducks
Treatment1
Response Variables2
Melamine (%)
Cyanuric Acid (%)
BWG (g)
FI (g)
F:G (g:g)
Mortality3 (%)
Liver4
(%) Kidney4
(%) 0.00 0.00 897ab 1,857a 2.07bc 0c 3.74 1.11c
0.50 0.00 857ab 1,783a 2.09bc 4bc 4.01 1.26bc 1.00 0.00 660c 1,361b 2.25b 16b 3.89 1.55b 1.50 0.00 447d 868c 2.49a 44a 3.97 2.22a 0.00 0.50 923a 1,897a 2.05c 0c 3.94 1.12c 0.00 1.00 880ab 1,759a 2.00c 0c 4.06 1.11c 0.00 1.50 870ab 1,826a 2.11bc 0c 3.90 1.04c 0.50 0.50 871ab 1,820a 2.09bc 0c 4.02 1.14c 1.00 1.00 839ab 1,721a 2.05c 0c 3.91 1.16c 1.50 1.50 829b 1,701a 2.05c 0c 3.79 1.08c
ANOVA:5 S.E.M. 28 68 0.06 0.1 0.19 0.12 P-value < 0.0001 < 0.0001 0.0002 < 0.0001 0.9778 < 0.0001
1Treatments were the addition of melamine and or cyanuric acid, in percent indicated, to a basal diet. Diets were fed for 21 consecutive days. 2Data are means of five replicate pens with five ducks per pen for control and treatments fed melamine alone or melamine + cyanuric acid. Data are means of four replicate pens with four ducks per pen for treatments fed cyanuric acid alone. 3Means are percents of mortality that occurred out total number of ducks in each treatment. Statistical analysis was performed on transformed data (arcsine). 4Relative organ weights, expressed as a percentage of body weight. 5One way analysis of variance values. a-dMeans within a column with no common superscript are different (P < 0.05). BWG = body weight gain; FI = feed intake; F:G = feed to gain.
78

Table 4.3. Individual and combined effects of melamine and cyanuric acid on serum chemistry of Pekin ducks Treatment1
Response Variables2
Melamine (%)
Cyanuric Acid (%)
GLU (mg/dL)
ALB (g/dL)
TP (g/dL)
GLOB (g/dL)
CA (mg/dL)
AST (U/L)
GGT (U/L)
UA (mg/dL)
0.00 0.00 223 1.31c 3.18cd 1.87cd 11.69 62.7 3.6 5.75c 0.50 0.00 188 1.38bc 3.39bc 2.01bc 12.14 21.1 3.9 7.95c 1.00 0.00 223 1.50ab 3.68ab 2.18b 11.63 55.2 4.1 15.56b 1.50 0.00 349 1.55a 3.96a 2.41a 12.34 94.2 3.6 25.48a 0.00 0.50 291 1.28c 3.17cd 1.89cd 11.14 59.5 3.4 8.38c 0.00 1.00 254 1.26c 2.98d 1.72d 12.03 59.2 2.8 6.11c 0.00 1.50 208 1.28c 3.05d 1.77d 11.79 34.7 3.3 4.83c 0.50 0.50 222 1.34c 3.22cd 1.88cd 11.88 59.9 3.1 5.45c 1.00 1.00 271 1.27c 3.07d 1.80d 11.69 17.7 3.9 4.70c 1.50 1.50 269 1.25c 3.03d 1.78d 11.78 24.4 3.4 6.13c
ANOVA:3 S.E.M. 38 0.05 0.11 0.06 0.41 25.95 0.3 2.35 P-value 0.1671 0.0004 < 0.0001 < 0.0001 0.7603 0.5731 0.2163 < 0.0001
1Treatments were the addition of melamine and or cyanuric acid, in percent indicated, to a basal diet. Diets were fed for 21 consecutive days. 2Data are means of ten ducks per treatment. 3One way analysis of variance values. a-dMeans within a column with no common superscript are different (P < 0.05). GLU = glucose; ALB = albumin; TP = total protein; GLOB = globulin; CA = calcium; AST = asparate transaminase; GGT = gamma glutamyltranserase; UA = uric acid
79

80
Table 4.4. Residue levels of melamine in kidney, breast muscle, and bile of Pekin ducks
Treatment1
Response Variables Melamine
(%) Cyanuric Acid
(%) Kidney2
(ppm) Breast Muscle2
(ppm) Bile3 (ppm)
0.00 0.00 NDc NDd ND
0.50 0.00 46b 32b 92
1.00 0.00 179a 93ab 490
1.50 0.00 238a 155a 568
0.00 0.50 NDc NDd ND
0.00 1.00 NDc NDd ND
0.00 1.50 NDc NDd ND
0.50 0.50 13b 11c 23
1.00 1.00 12b NDd 30
1.50 1.50 NDc NDd 24
ANOVA4 S.E.M. 2.1 2.1 -
P-value < 0.0001 < 0.0001 -
1Treatments were the addition of melamine and or cyanuric acid, in percent indicated, to a basal diet. Diets were fed for 21 consecutive days. 2Data are means of four replicate pens, with one duck per pen. Statistical analysis was performed on transformed data (ranked data). 3Bile from all replicates was pooled and data are means of duplicate HPLC analysis per treatment. Statistical analysis not performed due to lack of replicates.
4One way analysis of variance values. a-d Means within a column with no common superscript are different (P < 0.05). ND = none detected.
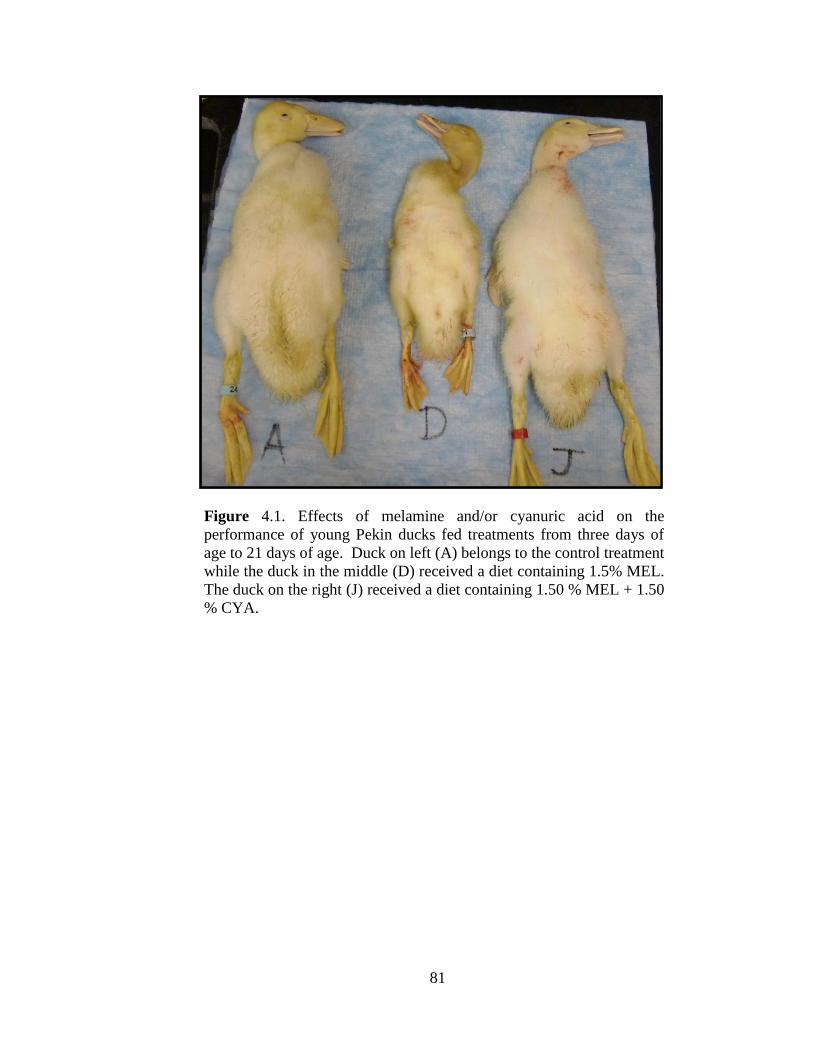
81
Figure 4.1. Effects of melamine and/or cyanuric acid on the performance of young Pekin ducks fed treatments from three days of age to 21 days of age. Duck on left (A) belongs to the control treatment while the duck in the middle (D) received a diet containing 1.5% MEL. The duck on the right (J) received a diet containing 1.50 % MEL + 1.50 % CYA.
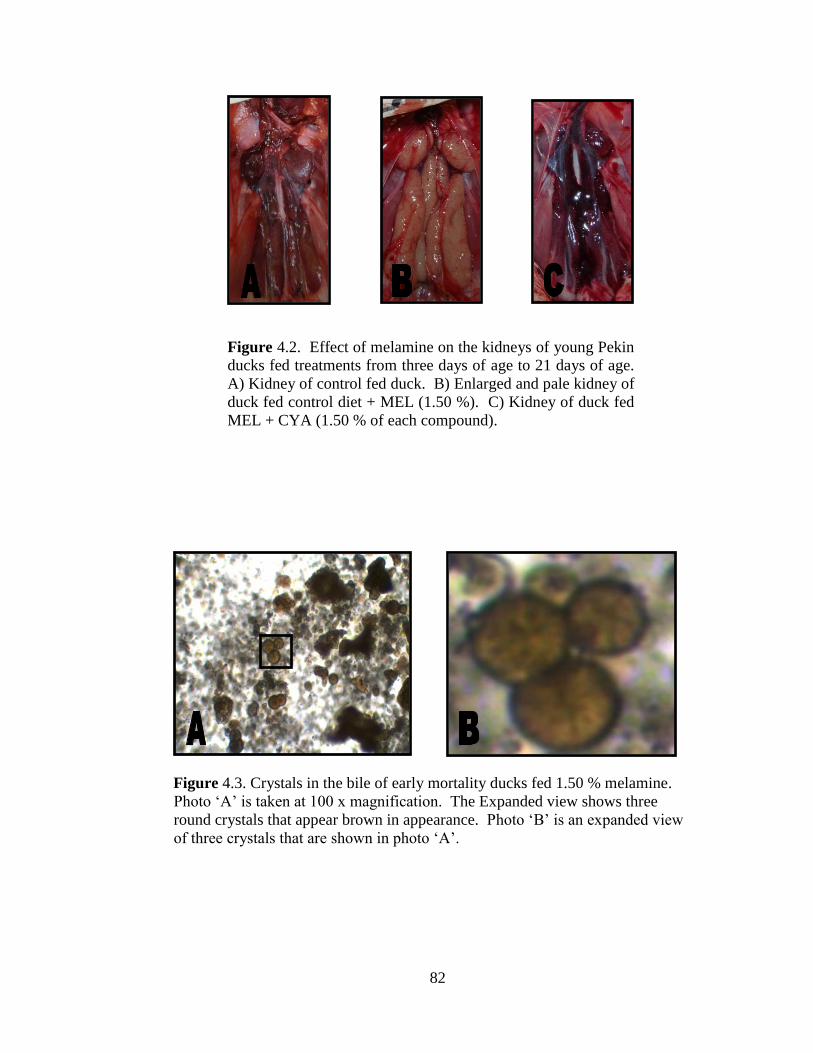
82
Figure 4.2. Effect of melamine on the kidneys of young Pekin ducks fed treatments from three days of age to 21 days of age. A) Kidney of control fed duck. B) Enlarged and pale kidney of duck fed control diet + MEL (1.50 %). C) Kidney of duck fed MEL + CYA (1.50 % of each compound).
Figure 4.3. Crystals in the bile of early mortality ducks fed 1.50 % melamine. Photo ‘A’ is taken at 100 x magnification. The Expanded view shows three round crystals that appear brown in appearance. Photo ‘B’ is an expanded view of three crystals that are shown in photo ‘A’.

83
Figure 4.4. Crystals in the bile of ducks fed 1.00 % melamine and survived to termination. Photo taken at 200 x magnification, shows round, brown crystals in the bile of ducks fed.
Figure 4.5. Crystals in the bile of ducks fed 1.50 % melamine that survived to termination. Photo taken at 100 x magnification.

84
Figure 4.6. Kidney sections from a control duck and one fed 1.50 % melamine. Photo ‘A’ is a kidney section from a control duck viewed at 100 x magnification. Photo ‘B’ is a kidney section from a duck fed 1.50 % MEL and viewed at 100 x magnification. Note dilated collecting tubules with casts present in photo ‘B’.
Figure 4.7. Kidney section from a duck fed 1.50 % melamine. Viewed at 100 x magnification casts and crystals are present in the interstitial space.

85
Chapter 5
Effects of Melamine in Young Barrows
Introduction
Melamine (C3H6N6) is a white, crystalline powder (OSHA, 2006) with a wide
variety of industrial applications including use in manufacturing of plastics, adhesives,
laminates, paints, flame retardants, textiles finishes, and fertilizers (Hilts and Pelletier,
2009). Cyanuric acid, along with ammeline and ammelide, are structural analogues of
melamine (Tyan et al., 2009; WHO, 2008a) and all belong to the class of chemicals
known as s-triazines (Wackett et al., 2002). The ability of melamine and cyanuric acid to
self-assemble and form a hydrogen-bonded bimolecular network (Perdigao et al., 2006),
allows the compounds to precipitate in the kidneys of animals that have ingested them,
causing renal failure (Seffernick et al., 2010).
Contamination of feed or food with melamine and/or cyanuric acid can occur
indirectly and accidently by treatment of feed ingredients with products that contain
melamine or cyanuric acid (WHO, 2008a). However, in recent years the intentional
adulteration of feed and food with melamine (Hilts and Pelletier, 2009) has received
international attention. Melamine is 66 % nitrogen (Yang et al., 2009), therefore, protein
analysis using the Kjeldahl method, will result in an invalid or an over estimate of the
actual protein content of a matrix that contains melamine (Yang et al., 2009). For this

86
reason melamine was intentional added to feed ingredients or feeds to increase their
monetary value (Cianciolo et al., 2008).
Precipitation of melamine-cyanuric acid crystals in the kidneys of dogs and/or
cats was documented by Brown et al. (2007), Cianciolo et al. (2008), and Puschner et al.
(2007). It has also been well documented (Brown et al., 2007; Dobson et al., 2008) that
blood urea nitrogen (BUN) levels increase in animals fed melamine and cyanuric acid
due to a decrease in kidney function. Studies by Tolleson (2009) and Dobson et al.
(2008) describe possible routes of absorption of melamine and related compounds as well
as how precipitation of the compounds can lead to renal damage and renal failure.
In 2007, renal failure, caused by ingestion of pet food that was contaminated with
melamine and cyanuric acid, caused the death of pets across North America and South
Africa (Hilts and Pelletier, 2009). Soon after, it was determined that pet food scraps
containing melamine and cyanuric acid were incorporated in swine, poultry, and
aquaculture feeds (Buur et al., 2008; Karbiwnyk et al., 2009; USDA, 2007a). Animals
that consumed the contaminated feed were placed under quarantine by the USDA Food
Safety and Inspection Service (FSIS) until it was certain that meats and other products
from these animals were not themselves contaminated (USDA, 2007a).
In September 2008, reports from China indicated that 52,875 children had been
treated for renal complications after having consumed infant formula and other related
dairy products contaminated with melamine (Chan et al., 2008; WHO, 2008a). By
November 2008, some 294,000 infants in China had been affected, with 50,000
hospitalized, and six reported deaths (Chan et al., 2008; WHO, 2008a). It was
determined that melamine was used to artificially increase the crude protein of milk that

87
was used in the production of infant formula (PEHSU, 2009; WHO, 2008a). However,
unlike the pet food incidence of 2007, the melamine added to the milk was relatively
pure, with levels of cyanuric acid, ammeline, and ammelide about 0.1% that of the
melamine level (WHO, 2008a). This level of contamination with cyanuric acid,
ammeline, and ammelide, was much lower than the levels present in the pet food
products in 2007 (WHO, 2008a).
Since the 2007 and 2008 incidents of contamination of animal feed and human
food with melamine and related analogs several case reports and experiments have been
published involving consumption of melamine and related compounds by swine.
Gonzalez et al. (2009), Lee et al. (2011), and Nilubol et al. (2009) each documented cases
where melamine and or related analogs were incorporated into swine feed. Nilubol et al.
(2009) reported that starter diets fed to swine on a farm in Thailand had melamine,
cyanuric acid, and ammeline concentrations of 3,209 ppm (0.32 % of the diet), 1,126
ppm (0.11 % of the diet), and 949 ppm (0.09 % of the diet), respectively. Mortality
started approximately two weeks after weaning and within two months approached
100%. Kidneys from affected pigs appeared yellowish, slightly swollen, glistening, and
showed perirenal edema. Crystal precipitates were evident on the surface of cut renal
sections, with crystals appearing yellow to brown with radiating striations (Nilubol et al.,
2009). Lee et al. (2011) documented melamine concentrations that ranged from 750 ppm
(0.075 % of the diet) to 1,500 ppm (0.15 % of the diet) in a swine diet in Malaysia.
During consumption of the contaminated feed Lee et al. (2011) reported pigs appearing
inappetant, anorexic, thin, dull, and depressed. The kidneys from these pigs were
enlarged and yellowish in appearance. Severely affected pigs had kidneys that were
88
small in size with clear pitting and dimpling, dark red and brown in color, with multiple
cysts present in the cortex.
Reimschuessel et al. (2008) provided the first experimental data regarding the
consumption of melamine by swine. In his research, Reimschuessel et al. (2008) fed 400
mg/kg BW ( 0.7 % of the diet) of melamine and cyanuric acid, alone or in combination,
to 16 week old Yorkshire-cross pigs. A three day feeding period was used with one pig
per treatment. Pigs fed melamine alone and cycauric acid alone showed no gross lesions
or crystals in the kidneys, and had normal blood urea nitrogen and creatinine levels.
Only the pigs fed the combination diet developed golden-brown crystals that formed
radial spheroid aggregates in the kidneys. The combination fed pigs also had elevated
blood urea nitrogen and creatinine levels. Reimschuessel et al. (2008) also suggested that
melamine-cyanurate and melamine-uric acid crystals might not be stable in formalin and
would dissolve when tissues are fixed in the formalin.
In 2011, a no-observed-adverse-effect-level (NOAEL), was determined in pigs by
Stine et al. (2011). Three separate studies were conducted with weanling barrows fed
melamine or cyanuric acid alone or in combination. The first study, a preliminary study,
found a dose related response in kidney weight and relative kidney weight when
melamine-caynuric acid was fed at levels greater than 10 mg/kg BW/day ( 0.025 % of
the diet). Crystalline structures were found in the medulla and cortex of kidneys from
barrows fed 10 mg/kg BW/day or more of the melamine-cyanuric acid combinations, and
in barrows fed 200 mg/kg BW/day ( 0.50 % of the diet) of melamine alone. In the second
experiment Stine et al. (2011) fed 0.0, 1.0, and 3.3 mg/kg BW/day ( 0.0, 0.0025, and
0.00825% of the diet) of melamine-cyanuric acid to barrows for 28 days. Only one

89
barrow fed 3.3 mg/kg BW/day developed a cluster of crystals in the kidneys, therefore
the NOAEL was set at 1.0 mg/kg BW/day of melamine in combination with 1.0 mg/kg
BW/day cyanuric acid. Finally, a follow-up study was conducted by feeding 200 mg/kg
BW/day of melamine to barrows. Upon examination no crystals were present in pigs
feed 200 mg/kg BW/day.
During the experiments by Stine et al. (2011), ultra-performance liquid
chromatography tandem mass spectrometry (UPLC-MS/MS) was used to determine
crystal composition. It was found that crystals removed from the kidney of pigs fed
melamine only were closely related to the morphology of crystals from pigs fed
combinations of melamine and cyanuric acid. Similar morphology and a one to one ratio
of melamine to cyanuric acid, determined by UPLC-MS/MS, indicates that crystals from
the melamine fed pig contained both melamine and cyanuric acid (Stine et al., 2011).
Stine et al. (2011) stated that while microbial conversion of melamine to cyanuric acid,
documented by Seffernick et al. (2010) and Wackett et al. (2002), does occur, it is
unclear if the microorganisms responsible for the conversion reside and are active in the
gastrointestinal tract of the animal.
Previous research has determined that combinations of melamine and cyanruic
acid can form renal crystals similar to those detected in pets (Reimschuessel et al., 2008)
and established a NOAEL for pigs fed a combination of melamine and cyanuric acid
(Stine et al., 2011). However to date, no research has addressed the effects of higher
dietary levels of melamine in young weanling pigs or tissue residue levels after
consumption. Therefore, the objectives of the current study were to determine the effects
90
of high dietary levels of melamine (up to 1.25 % of the diet) on weanling barrows, and to
determine melamine residue levels in the kidney, muscle, and bile.
Materials and Methods
Diet Preparation:
A basal diet (Table 5.1) was formulated to meet or exceed all requirements of
weanling pigs set forth by the National Research Council (NRC, 1998). Six dietary
treatments were prepared from the basal diet by adding melamine (MEL), purchased from
Fisher Scientific. MEL was substituted for sand to obtain the desired dietary MEL
concentrations (0.00, 0.25, 0.50, 0.75, 1.00, and 1.25 %).
Pigs, Management, and Response Variables:
The animal care and use protocol was reviewed and approved by the University of
Missouri Animal Care and Use Committee (ACUC). Thirty barrows, two weeks post
weaned, were purchased from a commercial producer, weighed, ear tagged, and placed in
individual pens with ad libitum access to feed and water. A completely randomized
design was used, with five replicate pens of one pig each assigned to each of the six
dietary treatments. Pigs were housed in an environmentally controlled building with
elevated 1.2 m2 pens with plastic covered grate flooring over a flush system. Each pen
had a stainless steel nipple waterer and a three-hole nursery feeder. Dietary treatments
were fed for 21 days with each pig inspected daily for signs of illness.
On day 21, two blood samples per pig were taken from pigs in the first three
replicates. The blood was collected via the anterior vena cava. Samples were collected
into a 20 mL vacutube, one containing heparin and one without heparin. A 20 gauge

91
(2.54 cm) needle for hematology was used for collection. Both samples were sent to the
University of Missouri Veterinary Diagnostic Laboratory (Columbia, MO) for analysis.
Samples collected in tubes containing heparin were used for a complete blood count
(CBC), which involves analysis of white blood cells, (WBC), red blood cells (RBC),
hemoglobin (HGB), hematocrit (HCT), mean corpuscular volume (MCV), mean
corpuscular hemoglobin (MCH), mean corpuscular hemoglobin concentration (MCHC),
and platelets (PLT). Blood samples collected in tubes without heparin were centrifuged
(Sorvall, RC 3 B plus) at 1,400 x g for 30 min at 7ºC before serum was separated. Serum
was analyzed for glucose (GLU), blood urea nitrogen (BUN), creatinine (CREA), sodium
(Na), potassium (K), chloride (Cl), albumin (ALB), total protein (TP), globulin (Glob),
calcium (Ca), phosphorus (Phos), magnesium (Mg), total bilirubin (T Bil), direct
bilirubin (D Bili), aspartate aminotransferase (AST), gamma-glutamyl transpeptidase
(GGT), and creatine phosphokinase (CPK). The following day (day 22) blood samples
from the remaining two replicates were taken and treated in the same manner as the first
group. Pigs were bleed and later killed in two groups due to time restrictions on the
necropsy floor.
On day 21, all pigs and feed were weighed and average body weight gain, average
feed intake, and feed conversion were calculated. On day 22, pigs in the first three
replicates were euthanized via captive bolt followed by exsanguination, after which
necropsies were performed at the University of Missouri Veterinary Diagnostic
Laboratory (Columbia, MO). The remaining pigs in the final two replicates were
euthanized in the same manner as the first group on day 23 of the study. The pigs were
bled and killed in two groups due to time constraints on the kill floor.
92
During necropsies the liver and kidneys were removed from each pig and weighed
to calculate relative weights (organ weight/body weight). Sections of liver, kidney, and
muscle (hind quarter) were taken from each pig and fixed in 10 % neutral buffered
formalin for histopathology. For histopathology tissues were also fixed in a 70 % ethanol
solution for 24 h, after which they were placed in a 95 % ethanol until the tissues were
trimmed for tissue processing and saved. Additional samples of kidney and muscle (hind
quarter) along with bile were frozen for later analysis of MEL residue by high pressure
liquid chromatography (HPLC).
Urine was collected from two pigs per treatment and sent to the University of
Missouri Veterinary Diagnostic Laboratory (Columbia, MO) for a complete and
physical/chemical urinalysis (color, clarity, specific gravity, glucose, bilirubin, ketones,
heme, pH, protein dipstick, SSA, urobilinogen, presence of white blood cells, red blood
cells, bacteria, round cells, squamous cells, casts, and crystals).
Two extra pigs were purchased to replace early mortalities and to ensure only
high quality pigs were used in the experiment. These pigs were fed the same basal diet as
pigs in the experiment. However, on day three of the experiment, since no mortality
occurred, the extra pigs were given a basal diet (same basal diet used to formulate
experimental treatments) that contained a combination of 0.75 % MEL and 0.75 %
cyanuric acid (CYA) (Fisher Scientific). These pigs were treated the same as the
experimental pigs. Feed intake, body weight gain, and all tissue collection and analysis
were performed in the same manner as the experimental pigs. The purpose of feeding the
combination diet to the extra pigs was to obtain kidney crystals (MEL-CYA) to compare
to crystals that might occur in the MEL only fed pigs. Extra pigs (MEL + CYA) are not

93
included in any statistical analysis and are not included when treatment group is used to
describe effects of MEL on barrows.
Melamine Analysis:
MEL extraction from tissue and bile samples was based on the method used by
Brand (2011), and involved high-performance liquid chromatography (HPLC) via UV
detection. For kidney and muscle, 10 mL of water:acetonitrile (1:2) was added to 1 g of
tissue and the tissues homogenized for 30 sec in a 50 mL conical centrifuge tube. The
homogenized sample was then centrifuged for 5 min at 1,000 rpm (Dynac II centrifuge;
Sparks, MD) and the supernatant transferred to microcentrifuge tubes and further
centrifuged for 5 min at 10,000 rpm (Spectrafuge 16M; Woodbridge, NJ). The
supernatant was extracted and filtered through a MycoSep® 224 AflaZon columns
(Romer Labs, 2011). Finally, 500 µL of the filtered supernatant was diluted (1:1) with
buffer solution (BUFF; 1.924 g citric acid and 2.34 g of octanesulfonate dissolved in L of
distilled water, pH adjusted to 3 using NaOH) before HPLC analysis was performed.
For bile, extraction involved adding 200 µL of bile to 1,800 µL of
water:acetonitrile (1:2), vortexing and transferring the samples to microcentrifuge tubes
and centrifuging for d min at 10,000 rpm (Spectrafuge 16M). The supernatant was
collected and filtered through MycoSep® 224 AflaZon column (Romer Labs, 2011).
Finally, 500 µL of the filtered supernatant was diluted (1:1) with BUFF before high-
performance liquid chromatography (HPLC) analysis was performed.
A Hitachi Model L-7100 pump with a Model L-7485 fluorescence detector,
Hitachi Model L-7200 autosampler with Hitachi D-7000 data acquisition interface and
ConcertChrom software on a microcomputer were used for HPLC analysis (Tokyo,

94
Japan). A HyperClone (Phenomonex) C18 column (100 x 4.60 mn) was used with a
retention time of 6 min and flow rate of 1 mL/min. UV detection occurred at 240 nm.
The mobile phase consisted of BUFF:acetrilnitril(ACN; 87:13).
A primary standard of 2,000 ppm MEL solution was diluted with BUFF:ACN
(1:1) to prepare standards of 1, 5, 10, and 20 ppm MEL. MEL Standards were ran before
and after each set of samples and used to calculate a standard curve. The area under the
curve was calculated, plotted on the standard curve, and used to calculate individual MEL
concentrations in samples. The limit of detection was set at 8.0 ppm.
Statistical Analysis:
Data were analyzed using the general linear model procedures of Statistical
Analysis Software (SAS) (SAS, 2006). Pen was the experimental unit. Variables that
showed significant differences in the ANOVA were compared using Fisher’s protected
least significant difference procedure (SAS, 2006). Regression analysis was performed
on all data to determine linear (yi = a + bxi + Ei) or quadratic (yi = a + bxi + cx2i + Ei)
responses. Statistical significance was accepted at a P-value of ≤ 0.05. A log10
transformation was applied to kidney MEL residue data before statistical analysis was
performed. Data for MEL residue levels in the muscle was ranked by a method
developed by Conover and Iman (1981) before analysis was performed. Regressions
analysis was not performed on ranked data.
95
Results
Performance and Mortality:
The effects of MEL on body weight gain, feed intake, feed conversion and
mortality are shown in Table 5.2. No mortality occurred during the 21 day treatment
period for MEL or MEL + CYA fed pigs. Body weight gain and average daily gain
decreased linearly (P = 0.0005) as percent MEL in the diet increased. Inclusion of ≥ 1.00
% MEL in the diet caused body weight gain and average daily gain to be less than (P =
0.0205) that of controls. Figure 5.1 shows the difference in pig size at the end of the 21
day experiment. The back pig (tag 18) in Figure 5.1 is a control pig which gained 12.76
kg during the 21 day study. The front pig in Figure 5.1 (tag 28) is a pig which received
1.25 % MEL in the diet, and gained 9.44 kg. Pigs fed MEL + CYA had an 18 day gain of
7.76 kg.
Gain to feed decreased in a quadratic (P = 0.0407) fashion with linear (P =
0.0076) sections as MEL levels in the diet increased. Pigs receiving 1.2 5 % MEL had a
lower (P = 0.0427) gain to feed value than controls. Gain to feed of MEL + CYA fed pigs
was 0.51. Feed intake was not affected (P = 0.7769) by the addition of up to 1.25 %
MEL in the diet. However, pigs fed MEL + CYA consumed 26 % less feed than controls
and 15 % less feed that pigs fed 1.25 % MEL.
Organ Weights:
Table 5.2 shows the effects of dietary inclusion of MEL up to 1.25 % of the diet,
on organ weights of young barrows. Liver weight, kidney weight, relative liver weight (%
of body weight), and relative kidney weight (% of body weight) were not affected (P >
0.05) by increasing dietary levels of MEL. Figure 5.2 shows that macroscopically the

96
liver and kidneys from a control fed pig (tag 24) and pig fed 1.25 % MEL (tag 15) were
similar.
The similarity of organ appearance among control pigs and pigs fed MEL alone is
in sharp contrast to Figure 5.3 which depicts the kidneys from a control pig (tag 26) and a
pig fed MEL + CYA (tag 2). The kidney from the MEL + CYA fed pig is larger in
appearance and yellow in color than the kidney from the control pig.
Complete Blood Count (CBC):
The results of the CBC are summarized in Table 5.3. Statistically there were no
treatment differences (P > 0.05) for WBC, RBC, HGB, HCT, MCHC or PLT. MCH
decreased in a linear (P = 0.0393) fashion with increasing dietary concentrations of MEL.
MCV was significantly lower from control levels, in pigs fed 1.25 % MEL. This
decrease in MCV as dietary MEL levels increased was determined to be linear (P =
0.0068). Pigs fed MEL + CYA had WBC counts that were 66 % greater than that of
control pigs and 60 % greater than that of pigs fed 1.25 % MEL.
Serum Chemistry:
The treatment means for the large animal maxi profile are summarized in Table
5.4 and Table 5.5. A linear decrease (P = 0.0124) was also observed for serum GLU as
dietary MEL levels increased. In contrast, AST increased (P = 0.0049) in a linear fashion
as MEL inclusion in the diet increased. MEL + CYA fed pigs had serum levels of BUN
that was 11 fold greater than control pigs and 12 fold greater that pigs fed 1.00 % MEL.
MEL + CYA fed pigs had a mean CREAT level that was 7 fold greater than that of
control pigs and pigs fed 1.25 % MEL. There was a linear (P = 0.0053) decrease in
serum Ca levels as percent MEL in the diet increased.

97
Urinalysis:
Urine analysis from two pigs per treatment showed no difference in any of the
parameters measured (clarity, specific gravity, glucose, bilrubin, ketones, heme, pH,
protein dipstick (4+ scale), urobilinogen, WBC, RBC, bacteria, round and squamous
cells, and casts). However, one pig each from the control, 0.50 % MEL, 0.75 % MEL,
and 1.00 % MEL groups presented with amorphous crystals. One pig each from the 1.00
% MEL and 1.25 % MEL groups presented with brushite crystals present in the urine.
One pig fed 1.25% MEL presented with MEL crystals. Figure 5.4 shows the similarity
between crystals taken from the urine of pigs fed 1.25 % MEL and MEL + CYA (photos
‘E’ and ‘F’, respectively). These crystals are similar in structure to crystals found by
Stine et al. (2011), who fed 100 mg/ kg MEL + 100 mg/kg CYA to young barrows
(Figure 5.4. photo ‘G’).
Additional analysis of urine from one pig of the control, 1.25 % MEL and MEL +
CYA groups was performed. This revealed calcium oxalate crystals present in the urine
of the control pig and calcium phosphate crystals in the urine of the pig fed 1.25 % MEL.
Crystals, with the structural appearance of MEL, were also found in the urine of the pig
fed 1.25 % MEL and the pig fed MEL + CYA. Figure 5.4 shows each type of crystal
present from the current study, along with examples of crystals of known origin for
comparison. The calcium oxalate crystals are of little clinical value as they often develop
if a urine specimen is left standing (Spencer, 2007). Calcium phosphate crystals, also
called brushite, can indicate urinary tract infections but otherwise are of little clinical
value (Spencer, 2007). The calcium phosphate crystals observed were probably the same
crystal observed in the original urine analysis.
98
The MEL + CYA pigs both presented with white blood cells present in the urine.
The urine also contained a moderate amount of crystals that were consistent with MEL-
CYA complexes. All other parameters measured were similar to results obtained from
treatment fed pigs.
Tissue Residue:
MEL levels in the kidney, muscle (hind quarter), and bile are summarized in
Table 5.6. MEL levels in the kidney increased in a quadratic fashion (P < 0.0001) with
linear components (P < 0.0001). Kidneys from pigs fed diets containing ≥ 0.25% MEL
had residue levels greater than controls (P < 0.0001). MEL concentrations in bile
increased linearly (P < 0.0001) with increasing MEL concentrations. Muscle (P <
0.0001) and bile (P < 0.0001) from pigs fed diet containing ≥ 0.50%MEL had residue
levels higher than controls. MEL + CYA pigs had average MEL concentration of 32 ppm
in the kidney, 17 ppm in the muscle and 46 ppm in the bile.
Pathology:
Gross Pathology:
No mortality occurred during the 21 day experimental period (Table 5.2.)
including the MEL + CYA pigs. During termination, no differences were noted in liver
and kidney size, or color among treatments. Figure 5.2 shows similar appearance in color
and size of the kidneys and liver of a control pig (tag 24) and pig fed 1.25 % MEL (tag
15). No crystals were present when the bile of pigs fed 1.25 % MEL was viewed
microscopically.
Livers from MEL + CYA pigs appear similar to that of livers from the control
pigs. However, kidneys from the MEL + CYA pigs were 82 % larger than kidneys from
99
control pigs. Kidneys from MEL + CYA pigs were yellow in color. Figure 5.3
demonstrates the sharp contrast in size and color of kidneys from a MEL + CYA fed pig
(tag 2) and a control pig (tag 26). Figure 5.5 shows the cross section of a kidney of a
MEL + CYA fed pig. Note that crystals are clearly present to the naked eye around the
renal medulla.
Histopathology:
Microscopic evaluation of liver, kidney, and muscle sections revealed no change
in appearance among control pigs and pigs fed MEL alone. Figure 5.6 shows a
microscopic section of a kidney from a control pig (photo A) and a pig fed 1.25 % MEL
(photo B). No changes in appearance of kidney sections are apparent in Figure 5.6. Bile
from a control pig, 1.25 % MEL fed pig, and MEL + CYA fed pig were examined
microscropically and all were found to be free of crystals. However, three pigs, one from
the 1.00 % MEL group and two from the 1.25 % MEL group, presented with moderate to
severe inflammation in the liver, kidney, and muscle. The hepatitis was chronic (portal
and periportal cholangiohepatitis) in general, with one pig having acute hepatitis. The
hepatitis did not appear to be directly related to MEL consumption.
Histopathology of tissues from the MEL + CYA pigs revealed no microscropic
lesions of the liver. The kidneys however, contained several lesions and crystals were
noted during histopathological examination. Crystals were golden brown to yellowish in
color and appeared round with spokes emanating from the center. Figure 5.7 shows
several examples of crystals present in the kidney of MEL + CYA pigs. Photo ‘A’ from
Figure 5.7 shows crystals spread throughout the kidney tissue. Photo ‘B’ shows the
round appearance of the crystal with spokes emanating from the center. The final two

100
photos, ‘C’ and ‘D’, were taken under polarized light, the crystals, clearly visible, shine
against the background.
It was also determined that while tissues fixed in formalin and ethanol had similar
microscopic characteristics, the ethanol fixations preserved crystals slightly better. The
total number of crystals in tissues fixed in formalin or ethanol was similar. However,
crystals in the formalin fixed tissues had a tendency to break off leaving empty spaces in
the tissue.
Discussion
Weight gain and gain to feed were the only performance variables that were
significantly lower than controls when MEL levels were ≥ 1.00 % and equal to 1.25 % of
the pig’s diet, respectively. Barrows fed 1.00 % and 1.25 % MEL gained 3.26 and 3.32
kg less than controls, respectively. While this decrease in weight gain for the 1.00 and
1.25 % MEL treatment groups was significant, no mortality occurred and feed intake,
while numerically lower in groups fed MEL, was not significantly decreased. This
suggests that while MEL consumed at ≥ to 1.00 % of the diet is not fatal, performance of
barrows is reduced. These data confirms research by Stine et al. (2011), in which feeding
200 mg/kg BW/day ( 0.50 % of the diet) to barrows had no effect on daily gain. Similar
to the current study Brand (2011) observed decreases in feed intake and body weight gain
of young broilers when MEL was fed at levels ≥ 1.0 % of the diet. Body weight gain was
reduced in poults fed 1.5 % MEL (Brand, 2011). Finally ducks fed ≥ 1.00 % MEL had
decreased weight gain and feed intake (Chapter 3).
101
Blood urea nitrogen (BUN) is a measure of urea or the end product of protein
metabolism and is excreted by the kidneys (Nicoll et al., 2012). Therefore, BUN is
directly related to protein intake, nitrogen metabolism, and kidney excretion rate and can
be used to measure kidney function (Nicoll et al., 2012). Creatinine (CREAT), a waste
product generated from muscle metabolism (Nabili, 2012) is cleared from the body via
filtration through the glomerulus (Nicoll et al., 2012). CREAT levels in the serum can be
used to measure glomerular filtration rate, with each 50 % reduction in glomerular
filtration rate correlating to a doubling of CREAT levels in the serum (Nicoll et al.,
2012). In the current study, BUN and CREAT concentrations of pigs fed MEL alone
were not different from controls and values were within or near (± 0.04) references
ranges (Merck, 2011). This suggests, along with no changes in kidney size (kidney
weight or relative kidney weight) and no changes in the appearance of the kidney (gross
or microscopic), that MEL at levels ≤ to 1.25% of the diet does not affect the kidney
function of young barrows.
Reimschuessel et al. (2008) reported similar results when feeding 400 mg/kg BW
( 0.7 % of the diet ) of MEL to 16 week old pigs with no gross lesions observed in the
kidney, and BUN and CREAT levels within the normal range. Stine et al. (2011), also
reported that barrows fed 200 mg/kg BW/day MEL ( 0.5 % of the diet) for 28 days
showed no differences among treatments in any variable measured (body weight gain,
average relative kidney weight, BUN or CREAT). Only one of ten pigs from the Stine et
al. (2011) study that received MEL had crystals present in the kidneys. The kidneys
from the other nine pigs were unaffected by inclusion of MEL. Melnick et al. (1984) fed
up to 18,000 ppm (1.8 % of the diet) MEL to rats for 13 weeks and noted that the kidneys

102
of male rats were unaffected by MEL. Brand (2011) reported that slightly higher levels
of MEL (1.5 %) than was used in the current study caused mild accumulation of spherical
basophilic crystals, and ≥ 2. 5 % MEL caused increased toxicity in young broilers. In
poults, Brand (2011) observed a greater sensitivity to MEL, with ≥ 1.00 % MEL causing
gross pathology that was associated with renal failure and ≥ 2.0 % MEL causing ˃ 63 %
mortality in poults.
Urine analysis revealed no difference among any variables measured. Only the
presence of brushite (calcium phosphate), calcium oxalate, and amorphous crystals were
different among treatments. The amorphous crystals identified from the current analysis
are most likely amorphous urates or amorphous phosphate crystals. However, the
presence of calcium phosphate and oxalate, and amorphous (urates or phosphate) crystals
does not appear to be treatment related and are often of little clinical value (Spencer,
2007) . One pig fed 1.25 % MEL had crystals in the urine that appear similar to crystals
taken from pigs fed MEL + CYA in the current study and from pigs fed MEL + CYA by
Stine et al. (2011). Stine et al. (2011) analyzed the crystals from the MEL only fed pigs
and found the crystals had MEL–CYA ratios of 1:1. With the ability of microorganisms
to convert MEL to CYA documented (Jutzi et al., 1982; Wackett et al., 2002), more
research is needed to confirm if this conversion of MEL to CYA can be accomplished by
microorganisms that reside in the gastrointestinal tract of mammals (Stine et al., 2011) or
alternatively if MEL can be metabolized to CYA by mammals.
Mean corpuscular volume (MCV), which measures the average volume of red
blood cells (Nicoll et al., 2012), showed significant difference among treatments.
However, MCV values from all treatments fell within the normal range for swine (Merck,

103
2011). Mean corpuscular hemoglobin (MCH) which indicates the amount of hemoglobin
per red blood cell (Nicoll et al., 2012) decreased in a linear fashion as dietary MEL levels
increased but all values were close to reference ranges (± 0.68) for swine (Merck, 2011).
Serum aspartate aminiotransferase (AST) increased in a linear fashion as MEL levels
increased. However, AST values from all treatments fell within the normal range for
swine (Merck, 2011)
Blood serum Ca levels decreased linearly as dietary MEL levels increased. It is
worth noting that decreased serum calcium levels can indicate renal insufficiency (Nicoll
et al., 2012), although renal function in barrows from the current study appeared
unaffected since BUN and CREAT levels were normal and unchanged by the treatment.
Linear decreases in serum GLU and ALB (numerical) were observed as MEL
levels increased in the diet. The decrease in serum GLU and ALB values could
potentially be explained by the numeric reduction in feed intake.
The highest MEL concentrations were found in the kidney and bile. MEL
concentrations in the muscle were about half of what was found in the kidney and bile.
For example, kidneys from 1.25% MEL pigs had MEL concentrations of 125 ppm, while
the muscle only had 57 ppm MEL. Higher concentrations of MEL in the kidney are
consistent with reports by Dobson et al. (2008) and Puschner et al. (2007) who noted
precipitation of MEL and CYA complexes in the kidney probably due to an increase in
the concentrations of the compounds as they move down the osmotic gradient (Dobson et
al., 2008). Therefore, it is reasonable to assume that MEL concentrations in the kidney
would increase, above concentrations in other tissue, due to the compound becoming
more concentrated as the kidneys filter unwanted compounds (MEL) out of the blood and
104
into the urine. The fact that the bile had similar MEL values as the kidney suggests that
the bile is a route of elimination in the pig. Brand (2011) reported that poultry also use
bile as a route of elimination.
Brand (2011) reported much higher levels of MEL in the breast, kidney and bile
of broilers and poults fed 1.00 % MEL than was observed in pigs receiving 1.0% MEL in
the current study. These differences in MEL residue concentrations between poultry and
swine can possibly be explained by species differences in how poultry and swine absorb
and process MEL. Another possible explanation could be the size difference between a
three wk old bird and eight wk old barrows. Assuming the same amount of MEL is
absorbed, MEL would be more concentrated in the smaller ( 550 g) bird than in the
larger ( 21,730 g) barrows. Differences in feed intake between an eight wk old pig and
three wk old duck could also explain the difference in MEL reside levels. Other possible
explanations include: 1) differences in how species absorb and transport MEL from their
gastrointestinal tract in to their body; 2) differences in how MEL is filtered by the liver;
3) the degree to with hepatobiliary recirculation occurs; 4) differences in the kidneys
ability to filter MEL from the blood; 5) and finally the ability of the kidneys to excrete
MEL into the urine without precipitation occurring. Water flow through the kidney could
play a large factor in the ability of the kidney to excreta MEL into the urine without
precipitation occurring, thus decreasing renal damage. Therefore, animal/species with
higher water consumption resulting in larger urine output might be better able to flush
MEL out of their kidney preventing precipitation.
Performance of the MEL + CYA (0.75 % of each compound) fed pigs was much
lower than the performance of pigs fed 0.75 % MEL. Relative kidney weights were

105
dramatically increased in MEL + CYA fed pigs (approximately double of controls).
Blood parameters such as BUN and CREAT were elevated well above that of controls
pigs ( 11 and 7 times higher, respectively), indicating renal failure. MEL + CYA pigs
also had elevated WBC counts and WBC present in the urine. Histopathology of kidneys
from the MEL + CYA pigs revealed several lesions and crystals that were golden brown
to yellow in color. Crystals from the MEL + CYA pigs were visible under polarized
light, a characteristic consistent with MEL + CYA crystals (Brand, 2011; Brown et al.,
2007; Puschner et al., 2007; Reimschuessel et al., 2008) These data are in agreement with
previous research in which a combination of MEL and CYA was shown to be more toxic
to mammals than MEL alone (Dobson et al., 2008; Puschner et al., 2007; Reimschuessel
et al., 2008; Stine et al., 2011). However, in poults, the addition of CYA to diets
containing MEL appeared to reduce the negative effects of MEL on feed intake and body
weight gain Brand (2011). Furthermore, the addition of CYA to diets containing MEL
appears to ameliorate the negative effects of MEL on performance and mortality rates in
young Pekin ducks (Chapter 4).
MEL residue levels in the kidney, muscle, and bile of MEL + CYA fed pigs were
lower than tissues from 0.75 % MEL fed pigs. This suggests that while a combination of
MEL and CYA is more toxic to the pig, there is less absorption of the MEL-CYA acid
complex from the gastrointestinal tract as compared to MEL alone. This decrease in
bioavailability of MEL-CYA complex as compared to MEL alone, due to precipitation of
MEL-CYA in the gastrointestinal tract, was first suggested by Reimschuessel et al.
(2008).

106
In conclusion dietary levels of ≤ 1.00 % MEL was toxic to young barrows fed
contaminated diets for 21 days. However, MEL levels between 1.00 % and 1.25 % of the
diet decreased growth performance of young barrows. There appeared to be no effect
from the treatment on kidney function, as determined by serum levels of BUN and
CREAT, and histopathology results. These results are in agreement with results from
similar experiments conducted on mammals by Melnick et al. (1984), Reimschuessel et
al. (2008), and Stine et al. (2011). Residue levels in the kidney and bile suggest that
MEL may be eliminated via the bile as well as the kidney. The use of the hepatobiliary
system as an alternative route of elimination has been suggested to occur in poultry by
Brand (2011). More research is needed to determine if conversion of MEL to CYA can
occur by microbes in the gastrointestinal tracts of mammals and/or by metabolism in
mammals. Finally more research is needed to determine if the liver/gallbladder are
affected by MEL consumption.

107
Table 5.1. Ingredients and nutrient composition of basal ration Ingredient
Composition (%)
Corn 49.77 Soybean Meal 27.50 Whey, Dried 10.00 Plasma 2.50 Choice White Grease 5.00 Dicalcium Phosphate 2.05 Limestone 0.87 Vitamin Premix1 0.50 Salt 0.20 L-Lysine 0.15 Trace Mineral Premix2 0.15 DL-Methionine 0.065 Sand 1.25 Total 100.00 Nutrient composition (calculated) Crude Protein (%) 20.5 Metabolizable Energy (kcal/Kg) 1580 Lysine (SID, %) 1.20 Methionine (SID, %) 0.34 Methionine + Cysteine (SID, %) 0.68 Threonine (SID, %) 0.72 Calcium (%) 0.95 Phosphorus (% Av.) 0.55
1Vitamin premix provided (mg/kg of diet): retinyl acetate, 11,000 IU; cholecalciferol, 1,100 IU; DL-α-tocophereryl acetate, 44.1 IU; menadione Na dimethylpyrimidinol bisulfate, 4.0; vitamin B12, 30.3 µg; riboflavin, 8.3 mg; D-Ca-pantothenate, 28.1 mg; nicotinamide, 33.1 mg; choline chloride, 551.3 mg; D-biotine, 0.22 mg; folic acid, 1.65 mg 2Trace mineral premix provided (mg/kg of diet): Zn, 165 mg (ZnSO4); Fe, 165 mg (FeSO4H2O); Cu, 16.5 mg (CuSO45H2o); Mn, 33 mg (MnSO4); I, 0.3 mg Ca(IO3)2; Se, 0.3 mg (Na2Se03). SID = Standardized ileal digestible basis.
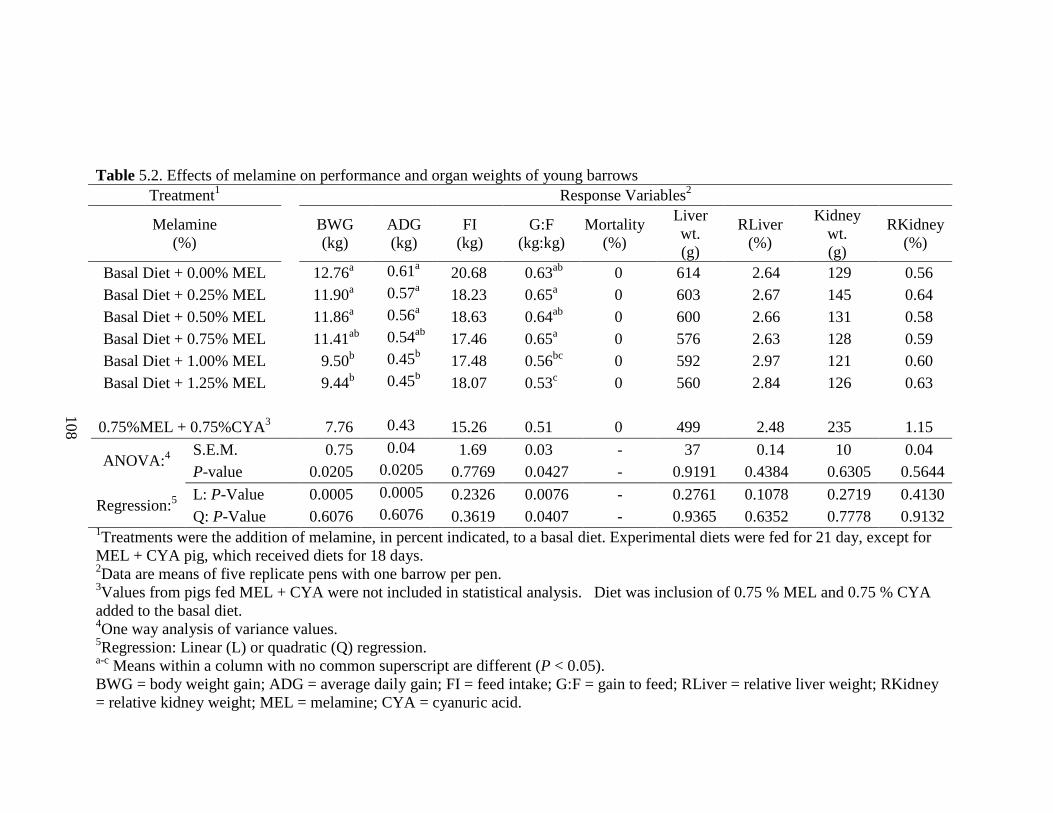
Table 5.2. Effects of melamine on performance and organ weights of young barrows Treatment1 Response Variables2
Melamine (%) BWG
(kg) ADG (kg)
FI (kg)
G:F (kg:kg)
Mortality (%)
Liver wt. (g)
RLiver (%)
Kidney wt. (g)
RKidney (%)
Basal Diet + 0.00% MEL 12.76a 0.61a 20.68 0.63ab 0 614 2.64 129 0.56 Basal Diet + 0.25% MEL 11.90a 0.57a 18.23 0.65a 0 603 2.67 145 0.64 Basal Diet + 0.50% MEL 11.86a 0.56a 18.63 0.64ab 0 600 2.66 131 0.58 Basal Diet + 0.75% MEL 11.41ab 0.54ab 17.46 0.65a 0 576 2.63 128 0.59 Basal Diet + 1.00% MEL 9.50b 0.45b 17.48 0.56bc 0 592 2.97 121 0.60 Basal Diet + 1.25% MEL 9.44b 0.45b 18.07 0.53c 0 560 2.84 126 0.63
0.75%MEL + 0.75%CYA3 7.76 0.43 15.26 0.51 0 499 2.48 235 1.15
ANOVA:4 S.E.M. 0.75 0.04 1.69 0.03 - 37 0.14 10 0.04 P-value 0.0205 0.0205 0.7769 0.0427 - 0.9191 0.4384 0.6305 0.5644
Regression:5 L: P-Value 0.0005 0.0005 0.2326 0.0076 - 0.2761 0.1078 0.2719 0.4130 Q: P-Value 0.6076 0.6076 0.3619 0.0407 - 0.9365 0.6352 0.7778 0.9132
1Treatments were the addition of melamine, in percent indicated, to a basal diet. Experimental diets were fed for 21 day, except for MEL + CYA pig, which received diets for 18 days. 2Data are means of five replicate pens with one barrow per pen. 3Values from pigs fed MEL + CYA were not included in statistical analysis. Diet was inclusion of 0.75 % MEL and 0.75 % CYA added to the basal diet. 4One way analysis of variance values. 5Regression: Linear (L) or quadratic (Q) regression. a-c Means within a column with no common superscript are different (P < 0.05). BWG = body weight gain; ADG = average daily gain; FI = feed intake; G:F = gain to feed; RLiver = relative liver weight; RKidney = relative kidney weight; MEL = melamine; CYA = cyanuric acid.
108

Table 5.3. Effects of melamine on blood variables of young barrows Treatment1
Response Variables2
Melamine (%) WBC
(10^3/µL) RBC
(10^6/µL) HGB (g/dL)
HCT (%)
MCV (fL)
MCH (pg)
MCHC (g/dL)
PLT (10^3/µL)
Basal Diet + 0.00% MEL 22.46 6.96 12.28 41.58 59.80a 17.70 29.60 446 Basal Diet + 0.25% MEL 25.63 6.98 11.96 40.14 57.64ab 17.18 29.78 366 Basal Diet + 0.50% MEL 25.95 6.77 11.78 39.46 58.38a 17.46 29.88 354 Basal Diet + 0.75% MEL 28.95 7.29 11.88 39.38 54.08b 16.32 30.18 412 Basal Diet + 1.00% MEL 26.35 7.12 12.14 40.58 56.94ab 17.04 29.90 419 Basal Diet + 1.25% MEL 23.40 6.89 11.28 37.58 54.56b 16.38 29.98 439
0.75%MEL + 0.75%CYA3 37.47 6.89 10.75 32.65 47.15 15.55 33.00 580
ANOVA:4 S.E.M. 3.36 0.28 0.47 1.63 1.27 0.45 0.34 44 P-value 0.7945 0.8188 0.7464 0.6358 0.0295 0.2085 0.8880 0.5950
Regression:5 L: P-Value 0.7153 0.7966 0.2675 0.1675 0.0068 0.0393 0.3475 0.6123 Q: P-Value 0.1590 0.6577 0.8254 0.9847 0.5499 0.7992 0.4969 0.1536
1Treatmensts were the addition of melamine, in percent indicated, to a basal diet. Experimental diets were fed for 21 day, except for MEL + CYA pig, which received diets for 18 days. 2Data are means of five replicate pens with one barrow per pen. 3Values from pigs fed MEL + CYA were not included in statistical analysis. Diet was inclusion of 0.75 % MEL and 0.75 % CYA added to the basal diet. 4One way analysis of variance values. 5Regression: Linear (L) or quadratic (Q) regression. a-b Means within a column with no common superscript are different (P < 0.05). WBC = white blood cell count; RBC = red blood cell count; HGB = hemoglobin; HCT = hematocrit; MCV = mean corpuscular volume; MCH = mean corpuscular hemoglobin; MCHC = mean corpuscular hemoglobin concentration; PLT = platelet count; CBC = complete blood count; MEL = melamine; CYA = cyanuric acid.
109

Table 5.4. Effects of melamine on serum proteins, bilirubin, and select enzymes of young barrows Treatment1
ANOVA:4
Regression:5
Response Variables2
Melamine (%)
S.E.M P-Value Linear
P-Value Quadratic P-Value
0.00% MEL
0.25% MEL
0.50% MEL
0.75% MEL
1.00% MEL
1.25% MEL
MEL +
CYA3 GLU 134 136 139 127 122 117 166 6 0.1436 0.0124 0.2182 AST 24.2 29.8 38.6 36.8 37.8 49.2 26.0 5.9 0.1033 0.0049 0.9670 BUN 10.2 8.6 10.2 9.8 10.0 8.8 111 1.3 0.8944 0.7568 0.7504 CREAT 0.84 0.76 0.82 0.88 0.86 0.78 5.8 0.05 0.6179 0.8971 0.5304 ALB 3.30 3.18 3.26 3.14 3.06 2.96 3.60 0.14 0.5698 0.0651 0.6671 GLOB 2.02 1.98 2.08 2.22 2.20 2.30 2.75 0.19 0.8166 0.1549 0.8947
T BIL 0.10 0.10 0.12 0.30 0.22 0.20 0.15 0.08 0.4496 0.1324 0.5017
D BILI 0.00 0.00 0.00 0.00 0.02 0.00 0.00 0.008 0.4389 0.3973 0.7955 TP 5.32 5.16 5.34 5.36 5.26 5.26 6.35 0.16 0.9494
0.9874 0.8170
GGT 33.0 31.6 27.4 30.4 27.8 33.6 30.5 2.6 0.4475
0.8030 0.0821 CPK 1014 1567 2262 914 746 1345 627.5 368 0.0794
0.5252 0.4010
1Treatments were the addition of melamine, in percent indicated, to a basal diet. Experimental diets were fed for 21 day, except for MEL + CYA pig, which received diets for 18 days. 2Data are means of five replicate pens with one barrow per pen. 3Values from pigs fed MEL + CYA were not included in statistical analysis. Diet was inclusion of 0.75 % MEL and 0.75 % CYA added to the basal diet. 4One way analysis of variance values. 5Regression: Linear (L) or quadratic (Q) regression. GLU = glucose (mg/dL); AST = aspartate aminotransferase (U/L); BUN = blood urea nitrogen (mg/dL); CREAT = creatinine (mg/dL); TP = total protein (g/dL); GLOB = globulin; T BIL = total bilirubin (mg/dL); D BILI = direct bilirubin (mg/dL); ALB = albumin (g/dL); GGT = gamma-glutamyl transpeptidase (U/L); CPK = creatine phosphokinase (U/L); MEL = melamine; CYA = cyanuric acid.
110

Table 5.5. Effects of melamine on serum mineral concentrations of young barrows Treatment1
ANOVA:4
Regression:5
Response Variables2
Melamine (%)
S.E.M P-Value Linear
P-Value Quadratic
P-Value 0.00% MEL
0.25% MEL
0.50% MEL
0.75% MEL
1.00% MEL
1.25% MEL
MEL +
CYA3 Ca 11.6 11.0 11.2 11.0 10.3 10.6 11.5 0.3 0.0542 0.0053 0.8687 P 11.2 10.8 10.7 10.6 10.3 11.2 12.8 0.5 0.7652 0.6582 0.2056 Mg 2.52 2.44 2.46 2.42 2.36 2.38 3.30 0.15 0.9762 0.4036 0.8879 Na 148 144 142 147 144 141 142 3 0.6225 0.2379 0.9891 K 6.24 5.82 5.92 5.82 6.00 6.86 6.20 0.54 0.7361 0.4137 0.1617 Cl 104 103 102 105 102 101 96 2 0.8319 0.4993 0.7971
1Treatments were the addition of melamine, in percent indicated, to a basal diet. Experimental diets were fed for 21 day, except for MEL + CYA pig, which received diets for 18 days. 2Data are means of five replicate pens with one barrow per pen. 3Values from pigs fed MEL + CYA were not included in statistical analysis. Diet was inclusion of 0.75 % MEL and 0.75 % CYA added to the basal diet. 4One way analysis of variance values. 4Regression: Linear (L) or quadratic (Q) regression. Ca = calcium (mg/dL); P = phosphorus (mg/dL); Mg = magnesium (mg/dL); Na = Sodium (mEq/L); K = potassium (mEq/L); Cl = chloride (mEq/L); M = melamine; CYA = cyanuric acid.
111

Table 5.6. Melamine concentrations in the kidney, muscle, and bile of young barrows Treatment1
Response Variables2
Melamine (%) Kidney2
(ppm) Muscle - hind quarter3
(ppm) Bile4
(ppm) Basal Diet + 0.00% MEL NDd NDc NDc Basal Diet + 0.25% MEL 41c 12c 20c Basal Diet + 0.50% MEL 75b 33b 63b Basal Diet + 0.75% MEL 75b 33b 77b Basal Diet + 1.00% MEL 143a 62a 85b Basal Diet + 1.25% MEL 125a 57a 126a
0.75%MEL + 0.75%CYA5 32 17 46
ANOVA:6 S.E.M. 0.06 2 9 P-value < 0.0001 < 0.0001 < 0.0001
Regression:7 L: P-Value < 0.0001 - < 0.0001 Q: P-Value < 0.0001 - 0.6718
1Treatments were the addition of melamine, in percent indicated, to a basal diet. Experimental diets were fed for 21 day, except for MEL + CYA pig, which received diets for 18 days. 2 Data are means of four replicate pens with one barrow per pen. Statistical analysis was performed on transformed data (log10). 3 Data are means of four replicate pens with one barrow per pen. Statistical analysis was performed on transformed data (ranked data). 4Data are means of five replicate pens with one barrow per pen. 5Values from pigs fed MEL + CYA were not included in statistical analysis. Diet was inclusion of 0.75 % MEL and 0.75 % CYA added to the basal diet. 6One way analysis of variance values. 7Regression: Linear (L) or quadratic (Q) regression. a-d Means within a column with no common superscript are different (P < 0.05). MEL = melamine; CYA = cyanuric acid; ND = none detected.
112
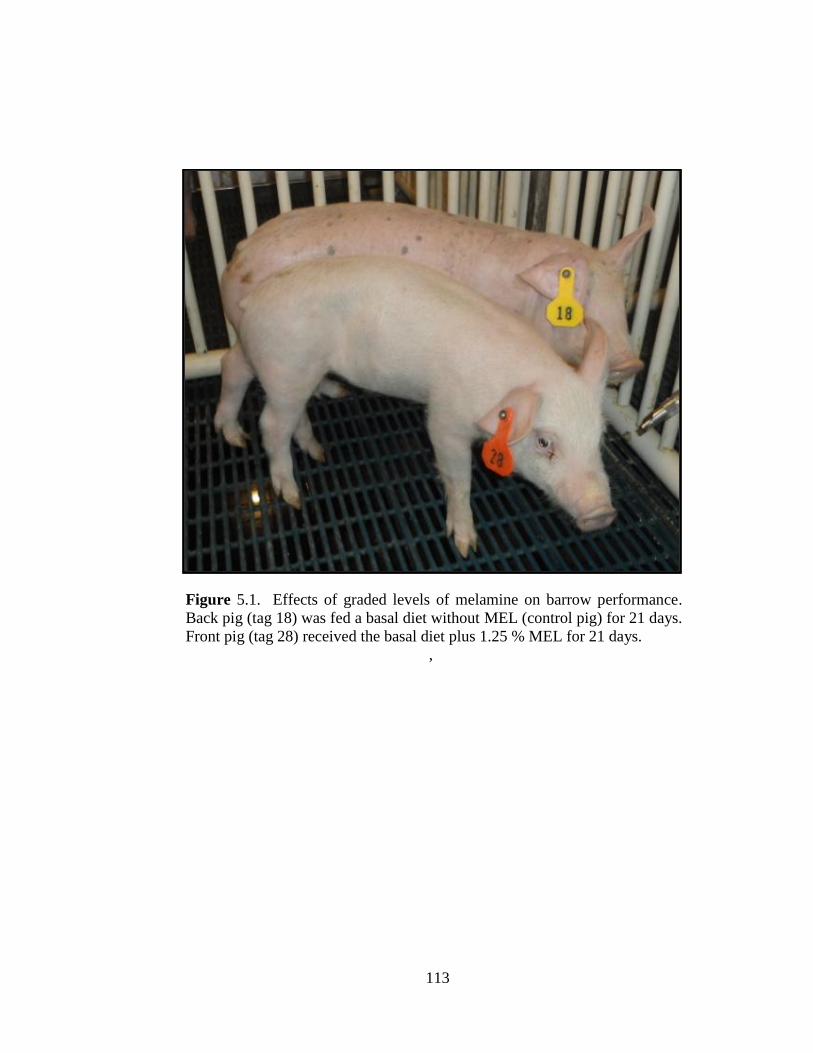
113
Figure 5.1. Effects of graded levels of melamine on barrow performance. Back pig (tag 18) was fed a basal diet without MEL (control pig) for 21 days. Front pig (tag 28) received the basal diet plus 1.25 % MEL for 21 days.
,

114
Figure 5.2. Effects of melamine on the gross appearance of organs. Top photo (tag 24) shows the liver and kidneys from a pig fed a basal diet without MEL (control pig). Bottom photo (tag 15) shows the liver and kidney from a pig fed the basal diet plus 1.25 % MEL.

115
Figure 5.3. Effects of melamine and melamine plus cyanuric acid on the kidneys of barrows. Kidneys on left (tag 2) are from a pig that received a diet that contained 0.75 % MEL and 0.75 % CYA. The kidney on the right (tag 26) is from a pig that received the basal diet without MEL (control pig).

116
Figure 5.4. Crystals observed in the urine of pigs fed melamine and melamine plus cyanuric acid. Photo ‘A’ shows calcium oxalate crystals in the urine from a control pig. Photo ‘B’ adopted from French et al. (2010a), showed an example of calcium oxalate dehydrate crystals. Photo ‘C’ shows calcium phosphate crystals in the urine of from a pig fed 1.25 % MEL. Photo ‘D’ adopted from French et al. (2010b), shows an example of calcium phosphate crystals. Photo ‘E’ shows MEL crystals present in the urine of a pig fed 1.25 % MEL. Figure ‘F’ shows crystals that were observed in the urine of MEL + CYA fed pigs. Photo ‘G’ adopted from (Stine et al., 2011) shows crystals observed in a pig fed MEL + CYA.

117
Figure 5.5. Effects of melamine plus cyanuric acid on the kidneys of young barrows. Cross section shows the effects of MEL + CYA (0.75 % of each compound) for 18 days on the kidneys of young barrows. Yellowish to golden discoloration, present at arrows, is due to the presence of crystal deposits.

118
Figure 5.6. Microscropic effects of melamine in the kidney of barrows. No changes were noted at the cellular level between treatments. Top photo (A) is from a pig fed basal diet without MEL. Bottom photo (B) is from a pig fed basal diet plus 1.25 % MEL.

Figure. 5.7. Effects of melamine plus cyanuric acid on the kidneys of young barrows. Photo ‘A’ and ‘B’ show golden-brown radial spheroid crystals in the kidneys of combination fed pigs. These crystals were visible under polarized light (photos ‘C’ and ‘D’).
119

120
Chapter 6
Conclusion
Two experiments were conducted to determine the individual and combined
effects of melamine (MEL) and cyanuric acid (CYA) in young Pekin ducks. A third
experiment was conducted to determine the effects of MEL in young weanling pigs
(barrows). All experiments were conducted at the University of Missouri – Columbia.
The animal care and use protocol was reviewed and approved by the University of
Missouri Animal Care and Use Committee before each experiment was performed.
Experiment one determined the effects of graded levels of MEL (0.00, 0.25, 0.50,
0.75, 1.00, 1.25, 1.50, 1.75, 2.00, and 2.25 % of the diet) in Pekin ducks from hatch to 21
days of age. Compared to controls, mortality was higher in ducks fed ≥ 2.00 % MEL.
Feed intake and body weight gain was lower than controls in ducks fed ≥ 1.00 % MEL.
Compared to controls, relative kidney weights were heavier in ducks fed ≥ 1.00 % MEL.
All blood parameters measured (glucose, albumin, total protein, globulin, aspirate
transaminase, gamma glutamyltranserase, and uric acid) increased in a linear fashion as
dietary MEL inclusion increased. MEL residue levels were highest in the bile, followed
by the kidney, and finally the muscle. The above data, along with the mild to severe
MEL induced lesions observed in the kidney of broilers fed ≥ 1.00 % MEL show that
renal failure induced by MEL toxicity can cause a decrease in performance (≥ 1.00 % of
the diet) of young Pekin ducks, and eventually death (≥ 2.00 %). Lesions included
dilation of the embryonal nephrons with eosinophilic to basophilic casts present. Some
of the casts contained spherical crystals. These data also confirm that young Pekin ducks

121
use bile as a route for eliminating MEL from their bodies. Finally, residue levels in the
breast muscle are not high enough to pose a health risk to humans, even when such high
dietary concentrations are consumed.
Experiment two studied the effects of MEL and CYA, alone or in combinations,
on Pekin ducks from hatch to 21 days of age. Diets included: 1) Control, no MEL or
CYA (basal diet); 2) basal diet + 0.50% MEL; 3) basal diet + 1.00 % MEL; 4) basal diet
+ 1.50 % MEL; 5) basal diet + 0.50 % CYA; 6) basal diet + 1.00 % CYA; 7) basal diet +
1.50 % CYA; 8) basal diet + 0.50 % MEL and 0.50 % CYA; 9) basal diet + 1.00 % MEL
and 1.00 % CYA; 10) basal diet + 1.50 % MEL and 1.50 % CYA. Only treatments fed
MEL alone caused mortality. Ducks fed ≥ 1.00 % MEL had lower feed intake and
weight gain, increased relative kidney weights, and increased serum ALB, TP, GLOB,
and UA levels as compared to the controls. The inclusion of up to 1.50 % CYA or MEL
+ CYA (up to 1.50 % of each) did not cause any of the previously mentioned variables to
be different from controls. Histopathology revealed kidneys from ≥ 1.00 % MEL fed
ducks to be have lesions compatible with MEL toxicity, while the kidneys from ducks fed
up to 1.50 % CYA and combinations of MEL + CYA (≤ 1.50 % of each compound) were
unaffected by MEL inclusion. MEL associated lesions included dilation of the
embryonal nephrons and collecting tubules. Eosinophilic to basophilic casts, some
containing spherical eosinophilic crystals, were present in some of the embryonal
nephrons and collecting tubules. These results suggest that: 1) CYA up to 1.50 % of a
duck’s diet is not toxic to young Pekin ducks; 2) inclusion of CYA to a diet that contains
MEL (a one-to-one ratio of MEL to CYA) can alleviate the negative effects of MEL on
young Pekin ducks. Finally, from the residue values collected on the breast muscle,

122
kidney, and bile, it appears that: 1) The bile can be used to eliminate MEL from the body;
2) the ability of CYA to alleviate the effects of MEL in young ducks appears to be caused
by the precipitation of a MEL-CYA complex in the gastrointestinal tract, thus reducing
the bioavailability of MEL.
Experiment three evaluated the effects of feeding MEL to weanling barrows for
21 days. MEL was included in the diet at 0.00, 0.25, 0.50, 0.75, 1.00, and 1.25 %. Two
additional pigs were fed diets that contained a combination of 0.75 % MEL + 0.75 %
CYA. No mortality occurred during the 21 day test period. Compared to controls, gain
and gain to feed were lower in treatments fed ≥ 1.00 % and 1.25 % MEL, respectively.
Blood urea nitrogen, creatinine levels and relative kidney weight were not affected by the
dietary inclusion of up to 1.25 % MEL. The average daily gain of the pigs fed the MEL
+ CYA combination was 1.4 fold lower than the average daily gain of controls. MEL +
CYA pigs had blood urea nitrogen and creatinine levels that were 11 and 7 fold higher
than levels in control pigs. MEL + CYA pigs also had heavier relative kidney weights
than controls. Crystals found in the kidneys of MEL + CYA pigs were round, golden
brown in color, and visible under polarized light. The only clinical significant difference
noted in the urine samples among treatments fed MEL was the presence of crystals in one
pig fed 1.25 % MEL. The crystals found in the urine of the pig fed 1.25 % MEL was
similar in appearance to those found in the urine of pigs fed MEL + CYA. Residue levels
in the kidney, muscle, and bile were lower in pigs fed MEL + CYA (0.75 % MEL + 0.75
% CYA) than pigs fed ≥ 0.50 % MEL.
Data collected on pigs fed up to 1.25 % MEL suggest that MEL levels between
1.00 and 1.25 % of a weanling pigs diet decreased growth performance but did not cause

123
mortality. Up to 1.25 % MEL does not appear to affect kidney size or function. In
contrast, the combination of CYA + MEL causes renal damage, indicated by increased
kidney size and elevated blood urea nitrogen and creatinine. Crystals found in the urine
of one pig fed 1.25 % MEL was similar in structure to crystals found in MEL + CYA fed
pigs. This suggests that conversion of MEL to CYA may occur via microorganisms in
the gastrointestinal tract or via metabolism. Residue values suggest that swine may also
eliminate MEL via the bile. It appears that the inclusion of CYA in a diet that contains
MEL is more toxic to pigs than MEL alone. However, due to precipitation of the MEL-
CYA complex in the gastrointestinal tract it appears that these pigs absorbed less MEL
than MEL only fed pigs. Finally, muscle residue values show that concentrations of
MEL in the muscle of swine from the current study would result in a daily intake of MEL
that is below the TDI of 0.063 mg/kg BW/day set by the FDA.
The results of these studies document the individual and combined effects of
MEL and CYA on young Pekin ducks and weanling barrows fed dietary treatments for 21
days. In young Pekin ducks ≥ 1.00 % MEL can cause a decrease in performance and
changes in serum chemistry values indicating decreased renal function. Up to 1.50 %
CYA does not affect performance of young Pekin ducks and the addition of CYA to a
diet that contains MEL can alleviate the negative effects of MEL. Lesions detected in
ducks fed ≥ 1.00 % MEL are similar to lesions documented in broilers, poults, and cats,
such as pale and enlarged kidneys with crystals present in the lumina of the collecting
ducts/tubules. In young barrows, up to 1.25 % MEL did not cause changes in renal
appearance, changes in blood urea nitrogen or creatinine levels, nor did it cause mortality
during the treatment period. However, levels ≥ 1.00 % MEL did cause a reduction in

124
body weight gain over the 21 day experimental period. At the same time the combination
of 0.75 % MEL + 0.75 % CYA caused barrows to have lower body weight gains than
controls and higher blood urea nitrogen and creatinine levels than controls.
From the data collected it appears that both young Pekin ducks and barrows use
bile as a route to eliminate MEL from their body. Feeding CYA in combination with
MEL causes precipitation of a MEL-CYA complex in the gastrointestinal tract of the
animals, thus decreasing the concentration of MEL in the muscles, kidneys, and bile as
compared to animals that only consume MEL. It should be noted that feeding CYA in
combination with MEL reduces the negative effects of MEL on renal function in young
Pekin ducks, but is more detrimental to renal function in young barrows.
Finally, more research is needed to determine why in some species the
combination of CYA added to a diet contaminated with MEL can prevent the negative
effects of MEL (poults and ducks) but in other species the combinations of MEL + CYA
is more toxic than MEL alone (pigs, cats, dogs) and why MEL accumulates more in some
species than others. Possible explanations, and areas for additional research, include: 1)
differences in how species absorb and transport MEL from their gastrointestinal tract in
to their body; 2) differences in how MEL is filtered by the liver; 3) the degree to with
hepatobiliary recirculation occurs; 4) differences in the kidney ability to filter MEL from
the blood; 5) and finally the ability of the kidneys to excrete MEL into the urine without
precipitation occurring. Water flow through the kidney could play a large factor in the
ability of the kidney to excreta MEL into the urine without precipitation occurring, thus
decreasing renal damage. Therefore, animal/species with higher water consumption

125
resulting in larger urine output might be better able to flush MEL out of their kidney
preventing precipitation.

126
BIBLIOGRAPHY
Agrochemicals. 1993. The Agrochemicals Handbook. In: D. Hartley and H. Kidd (eds.). Royal Society of Chemistry, Nottingham, England.
Andersen, W. C., S. B. Turnipseed, C. M. Karbiwnyk, C. S. B., M. R. Madson, C. M. Gieseker, R. A. Miller, N. G. Rummel, and R. Reimschuessels. 2008. Determination and confirmation of melamine residues in catfish, trout, tilapia, salmon, and shrimp by liquid chromatography with tandem mass spectrometry. Journal of Agricultural and Food Chemistry 56: 4340-4347.
Andersen, W. C., S. B. Turnipseed, C. M. Karbiwnyk, and M. R. Madson. 2007. Determination of Melamine Residues in Catfish Tissue by Triple Quadrupole LC-MS-MS with HILIC Chromatography. No. 2011. U.S. Food and Drug Administration, Laboratory Information Bulletin (LIB) 4396 Melamine Residues in Catfish Tissue.
AVMA. 2007. The American Veterinary Medical Association (AVMA). Melamine adulterates components of pellet feeds. http://www.avma.org/onlnews/javma/jul07/070701d.asp.
Baynes, R. E., and J. E. Riviere. 2010. Risks associated with melamine and related triazine contamination of food. Emerging Health Threats Journal 3: 1-10.
Baynes, R. E., G. Smith, S. E. Mason, E. Barrett, B. M. Barlow, and J. E. Riviere. 2008. Pharmacokinetics of melamine in pigs following intravenous administration. Food and chemical toxicology : an international journal published for the British Industrial Biological Research Association 46: 1196-1200.
Bermudez, A., K. Zavarize, D. R. Ledoux, R. Murarolli, R. Kutz, G. Rottinghaus, and M. Lin. 2008. Pathology and mortality associated with graded levels of melamine fed to young broiler chickens. In: Proceedings of the American Association of Veterinary Laboratory Diagnosticians, Greensboro, NC. p 112.
Bhalla, V., P. C. Grimm, G. M. Chertow, and A. C. Paos. 2009. Melamine nephrotoxicity: an emerging epidemic in an era of globalization. Kidney Int 75: 774-779.
127
Bizzari, S., and K. Yokose. 2008. Melamine In: Chemical economic handbook. , SRI Consulting Inc, Menlo Park, Ca.
Brand, L. M. 2011. Effects of dietary melamine and cyanuric acid in young broilers and turkey poults. M.S. Thesis., University of Missouri - Columbia, Mo.
Brown, C. A., K. Jeong, R. H. Poppenga, B. Puschner, D. M. Miller, A. E. Ellis, K. Kang, S. Sum, A. M. Cistola, and S. A. Brown. 2007. Outbreaks of renal failure associated with melamine and cyanuric acid in dogs and cats in 2004 and 2007. Journal of Veterinary Diagnostic Investigation 19: 525-531.
Burns, K. 2007. Researchers examine contaminants in food, deaths of pets. http://www.avma.org/onlnews/javma/dec07/071201c.asp 2011.
Buur, J. L., R. E. Baynes, and J. E. Riviere. 2008. Estimating meat withdrawal times in pigs exposed to melamine contaminated feed using a physiologically based pharmacokinetic model. Regul Toxicol Pharmacol 51: 324-331.
Byungghul, K., L. B. Perkins, and R. J. Bushway. 2008. Determination of melamine in pet food by enzyme immunoassay, high-performance liquid chromatography with diode array detection and ultra-peformance liquid chromatography with tandem mass spectrometry. Journal of AOAC International 9: 408-413.
CDC. 2008. Centers for disease control and prevention (CDC). Melamine in food products manufactured in China. http://www.bt.cdc.gov/agent/melamine/chinafood.asp.
CDFA. 2007. California Department of Food and Agriculture (CDFA). Stanisaus county hog farm quarantined. http://www.cdfa.ca.gov/egov/Press_Releases/Press_Release.asp?PRnum=07-038 2011.
Chan, E. Y. Y., S. M. Griffiths, and C. W. Chan. 2008. Public-health risks of melamine in milk products. The Lancet 372: 1444-1445.
Chou, S. S., D. F. Hwang, and H. F. Lee. 2003. High performance liquid chromatographic determination of dyromazine and its derivative melamine in poulty meats and eggs. Journal of Food and Drug Analysis 11: 290.

128
Cianciolo, R. E., K. Bischoff, J. G. Ebel, T. J. V. Winkle, R. E. Goldstein, and L. M. Serfilippi. 2008. Clinicopathological, histological, and toxicological findings in 70 cats inadvertently exposed to pet food contaminated with melamine and cyanuric acid. Journal of American Veterinary Medical Association 233: 729-373.
Clark, R. 1966. Melamine crystalluria in sheep. Journal of South African Veterinary Association 37: 349-351.
Colombo, A., L. Menabue, A. Motori, G. C. Pellacain, W. Porzio, F. Sandrolini, and R. D. Willett. 1985. Crystal structure and spectroscopic, magnetic, and electrical properties of a copper II dimer, Melaminium hexacholorociduprate II, exhibiting a new stacking interaction. Inorganic Chemistry 24: 2900-2905.
Conover, W. J., and L. Iman. 1981. Rank transformation as a bridge between aarametric and nonparametric statistics. The American Statistican 35: 124-129.
Cornell. 2010a. Cornell University, College of Veterinary Medicine: Chemistry Group Test: Albumin. http://ahdc.vet.cornell.edu/clinpath/modules/chem/albumin.htm.
Cornell. 2010b. Cornell University, College of Veterinary Medicine: Chemistry Group Test: Aspartate Aminotranserase. http://ahdc.vet.cornell.edu/Sects/ClinPath/modules/chem/AST.HTM 2012.
Cornell. 2010c. Cornell University, College of Veterinary Medicine: Chemistry Group Test: Uric Acid. http://ahdc.vet.cornell.edu/sects/clinpath/modules/chem/uricac.htm.
Ding, X., K. zhang, and L. Wang. 2011. Toxicity of Melamine in Broilers. 2011http://en.cnki.com.cn/Article_en/CJFDTOTAL-DWYX201101026.htm.
Diseases. 2008. Diseases. In: H. N. Holmes (ed.) No. 9th. Wolters Kluwer.
Dobson, R. L., S. Motlagh, M. Quijano, R. T. Cambron, T. R. Baker, A. M. Pullen, B. T. Regg, A. S. Bigalow-Kern, T. Vennard, A. Fix, R. Reimschuessel, G. Overmann, Y. Shan, and G. P. Daston. 2008. Identification and characterization of toxicity of contaminants in pet food leading to an outbreak of renal toxicity in cats and dogs. Toxicological sciences : an official journal of the Society of Toxicology 106: 251-262.
129
Excyclopedia, M. 2011. Prerenal Azotemia. http://www.ncbi.nlm.nih.gov/pubmedhealth/PMH0001537/.
FDA. 2007. Pet food recall: FDA's ongoing investigation. http://www.fda.gov/forconsumers/consumerupdates/ucm048192.htm 2011.
FDA. 2008. Update: Interim Safety and Risk Assessment of Melamine and its Analogues in Food for Humans. http://www.fda.gov/Food/FoodSafety/FoodContaminantsAdulteration/ChemicalContaminants/Melamine/ucm164520.htm 2012.
FDA. 2009. Interim Melamine and Analogues Safety/Risk Assessment. http://www.fda.gov/ScienceResearch/SpecialTopics/PeerReviewofScientificInformationandAssessments/ucm155012.htm 2011.
Filigenzi, M. S., E. R. Tor, R. H. Poppenga, L. A. Aston, and B. Puschner. 2007. The determination of melamine in muscle tissue by liquid chromatography/tandem mass spectrometry. Rapid Commun Mass Spectrom 21: 4027-4032.
French, T. W., J. T. Blue, and T. Stokol. 2010a. eClinPath Common Crystals. Cornell University.
French, T. W., J. T. Blue, and T. Stokol. 2010b. eClinPath Uncommon Crystals. Cornell University.
FSANZ. 2008. Food Standards Australia New Zealand (FSANZ). Melamine in foods from China. http://www.foodstandards.gov.au/scienceandeducation/factsheets/factsheets2008/melamineinfoodsfromchina/.
Gao, C. Q., S. G. Wu, H. Y. Yue, F. Ji, H. J. Zhang, Q. S. Liu, Z. Y. Fan, F. Z. Liu, and G. H. Qi. 2010. Toxicity of dietary melamine to laying ducks: biochemical and histopathological changes and residue in eggs. J Agric Food Chem 58: 5199-5205.
Garber, E. A. E. 2008. Detection of melamine using commerial enzyme-linked immunosorbent assay technology. Journal of Food Protection 71: 590.
Gonzalez, J., B. Puschner, V. Perez, M. C. Ferreras, L. Delgado, M. Munoz, C. Perez, L. E. Reyes, J. Velasco, V. Fernandez, and J. F. Garcia-Marin. 2009. Nephrotoxicosis

130
in Iberian piglets subsequent to exposure to melamine and derivatives in spain between 2003 and 2006. Journal of Veterinary Diagnostic Investigation 21: 558-563.
Grases, F., A. Costa-Bauza, I. Gomila, S. Serra-Trespalle, F. Alonso-Sainz, and J. M. del Valle. 2009. Melamine urinary bladder stone. Urology 73: 1262-1263.
Hammond, B. G., S. J. Barbee, T. Inoue, N. Ishida, G. J. Levinkas, M. W. Stevens, A. G. Wheeler, and T. Cascieris. 1986. A Review of Toxicology Studies on Cyanurate and its Chlorinated Derivatives. Envirommental Health Perspectives 69: 287-292.
He, L., Y. Liu, M. Lin, J. Awika, D. R. Ledoux, H. Li, and A. Mustapha. 2008. A new approach to measure melamine, cyanuric acid, and melamine cyanurate using surface enhanced Raman spectroscopy coupled with gold nanosubstrates. Sensing and Instrumentation for Food Quality and Safety 2: 66-71.
Hilts, C., and L. Pelletier. 2009. Background paper on occurrence of melamine in food and feed. World Health Organization: Meeting on toxicological and health aspects of melamine and cyanuric acid.
HKCFS. 2008. Hong Kong Center for Food Safety (HKCFS). Melamine in mainland's milk powder incident. http://www.cfs.gov.hk/english/whatsnew/whatsnew_fstr/whatsnew_fstr_Melamine_in_Mainland_Milk_Powder_Incident.html 2011.
Ho, S. S. Y., W. C. W. Chu, K. T. Wong, W. Wong, P. C. Ng, and A. T. Ahuja. 2009. Melamine and nephrolithiasis in children in Taiwan. http://www.nejm.org/doi/full/10.1056/NEJMc0810070.
Jingbin, W., M. Ndong, H. Kai, K. Matsuno, and F. Kayama. 2010. Placental transfer of melamine and its effects on rat dams and fetuses. Food and chemical toxicology : an international journal published for the British Industrial Biological Research Association 48: 1791-1795.
Johnson, W. J., B. Stavric, and A. Chartrand. 1969. Uricase inhibition in the rat by s-triazines: An animal model for hyperuricemia and hyperuricosuria. Proceedings of the Society for Experimental Biology and Medicine. 131.
Jutzi, K., A. M. Cook, and R. Hutters. 1982. The degradative pathway of s-triazine melamine: The steps to ring cleavage. Biochemistry Journal 208: 679-684.

131
Karbiwnyk, C. M., W. C. Andersen, S. B. Turnipseed, J. M. Storey, M. R. Madson, K. E. Miler, C. M. Gieseker, R. A. Miller, N. G. Rummel, and R. Reimschuessel. 2009. Determination of cyanuric acid residues in catfish, trout, tilapia, salmon and shrimp by liquid chromatography-tandem mass spectrometry. Anal Chimica Acta: 101-111.
Lee, C. H., P. T. Ooi, A. R. Sheikh Omar, and B. K. Lim. 2011. Melamine toxicity in pigs. Peranika Journal of Tropical Agricultural Science 34: 175-179.
Limdi, J. K., and G. M. Hyde. 2003. Evaluation of abnormal liver function tests. Postgraduate Medical Journal 79: 307-312.
Lipschitz, W. L., and E. Stockey. 1945. The mode of action of three new diuretics—melamine, adenine and formoguanamine. The Journal of Pharmacology and Experimental Therapeutics 83: 235-249.
Liu, B., M. Lin, and H. Li. 2010. Potential of SERS for rapid detection of melamine and cyanuric acid extracted from milk. Sensing and Instrumentation for Food Quality and Safety 4: 13-19.
Lu, M. B., L. Yan, J. Y. Guo, Y. Li, G. P. Li, and V. Ravindran. 2009. Melamine residues in tissues of broilers fed diets containing graded levels of melamine. Poultry science 88: 2167-2170.
Mast, R. W., A. R. Jeffcoat, B. M. Sadler, R. C. Kraska, and M. A. Friedman. 1983. Metabolism, disposition and excretion of [14C]melamine in male Fischer 344 rats. Food and Chemical Toxicology 21: 807-810.
Melnick, R. L., G. A. Boorman, J. K. Haseman, R. J. Montali, and J. Huff. 1984. Urolithiasis and bladder carcinogenicity of melamine in rodents. Toxiciology and Applied Pharmacology 72: 292-303.
Merck. 2011. The Merck Veterinary Manual. In: C. M. Kahn (ed.). Merck Sharp and Dohem Corp., Whitehouse Station, NJ, USA.
Mermelstein, N. H. 2009. Analyzing for Melamine. http://web.missouri.edu/~linme/paper/12.pdf 2011.
Merriam-Webster. 2012. Merriam-Webster.com. Hemoconcentration.
132
MSDS. 2010. Cyanuric acid. http://www.sciencelab.com/msds.php?msdsId=9923614 2011.
Nabili, S. T. 2012. Creatinine Blood Test. http://www.medicinenet.com/creatinine_blood_test/article.htm 2012.
Newton, G. L., and P. R. Utley. 1978. Melamine as a dietary nitrogen source for ruminants. Journal of Animal Science 47: 1338-1344.
Nicoll, D., S. J. McPhee, M. Pignone, and C. M. Lu. 2012. Pocket Guide to Diagnostic Tests, 5e. http://www.accessmedicine.com/pocketDiagnostic.aspx. 2012.
Nilubol, D., T. Pattanaseth, K. Boonsri, N. Pirarat, and N. Leepipatpiboon. 2009. Melamine- and cyanuric acid-associated renal failure in pigs in Thailand. Veterinary pathology 46: 1156-1159.
NRC. 1994. National Research Council (NRC). Nutrient Requirements of Poultry., National Academy of Science, Washington, D. C. 1994.
NRC. 1998. National Research Council (NRC). Nutrient Requirements of Swine, National Academy of Science, Washington, D. C. 1998.
OECD. 1999. Screening information data set for isocyanuric acid CAS No 108-80-5. http://www.chem.unep.ch/irptc/sids/OECDSIDS/108805.pdf 2011.
Ogasawara, H., K. Imaida, H. Ishiwata, K. Toyoda, T. Kawanishi, C. Uneyama, S. Hayashi, M. Takahashi, and Y. Hayashi. 1995. Urinary bladder carcinogenesis induced by melamine in F344 male rates: correlation between carcinogenicity and urolith formation. Carcinogenesis 16: 2773-2777.
OSHA. 2006. Occupational safety and health adminstration (OSHA). Chemical sampling information, melamine. www.osha.gov/dts/chemicalsampling/data/ch_250440.html 2011.
PEHSU. 2009. Pediatric Environmental Health Specialty Units (PEHSU). Melamine: Information for Pediatric Health Professionals. http://www.coeh.uci.edu/PEHSU/Melamine%20Factsheet.pdf 2011.

133
Perdigao, L. M., N. R. Champness, and P. H. Beton. 2006. Surface self-assembly of the cyanuric acid-melamine hydrogen bonded network. Chem Commun (Camb): 538-540.
Puschner, B., R. H. Poppenga, L. J. Lowenstine, M. S. Filigenzi, and P. A. Pesavento. 2007. Assessment of melamine and cyanuric acid toxicity in cats. Journal of Veterinary Diagnostic Investigation 19: 616-624.
Reimschuessel, R. C., M. Gieseker, R. A. Miller, J. Ward, J. Boehmer, N. Rummel, D. N. Heller, C. Nochetto, G. K. Hemakanthi de Alwis, N. Bataller, W. C. Andersen, S. B. Turnipseed, C. M. Karbiwnky, R. D. Satzger, J. B. Crowe, N. R. Wilber, M. K. Reinhard, J. F. Roberts, and M. R. Witkowski. 2008. Evaluation of the renal effects of experimental feeding of melamine and cyanuric acid to fish and pigs. American Journal of Veterinary Research 69: 1217-1228.
Romer Labs, I. 2011. MycoSep 224 AflaZon. In: I. Romer Labs (ed.), United States of America.
SafetyData. 2008. Safety data for melamine. http://msds.chem.ox.ac.uk/ME/melamine.html.
SAS. 2006. Statistical Analysis Software (SAS). No. 9.2. SAS Institute Inc., Cary, NC, USA.
Seffernick, J. L., A. G. Dodge, M. J. Sadowsky, J. A. Bumpus, and L. P. Wackett. 2010. Bacterial ammeline metabolism via guanine deaminase. J Bacteriol 192: 1106-1112.
Shen, J. S., J. Q. Wang, H. Y. Wei, D. P. Bu, P. Sun, and L. Y. Zhou. 2010. Transfer efficiency of melamine from feed to milk in lactating dairy cows fed with different doses of melamine. Journal of dairy science 93: 2060-2066.
Smoker, M., and A. J. Krynitsky. 2008. Interim Method for Determination of Melamine and Cyanuric Acid Residues In Foods using LC-MS/MS: Version 1.0. http://www.fda.gov/Food/ScienceResearch/LaboratoryMethods/DrugChemicalResiduesMethodology/ucm071673.htm 2011.
Spencer, D. 2007. Urinalysis. A Professinal Development Resourice by Daniel Spencer. http://www.texascollaborative.org/spencer_urinalysis/ds_act3-1_03_crystals.htm 2012.

134
Stine, C. B., R. Reimschuessel, C. M. Gieseker, E. R. Evans, T. D. Mayer, N. R. Hasbrouck, E. Tall, J. Boehmer, G. Gamboa da Costa, and J. L. Ward. 2011. A No Observable Adverse Effects Level (NOAEL) for pigs fed melamine and cyanuric acid. Regul Toxicol Pharmacol 60: 363-372.
Tolleson, W. H. 2009. Renal toxicity of pet foods contaminated with melamine and related compounds. http://pubs.acs.org/doi/pdf/10.1021/bk-2009-1020.ch005 2011.
Turnipseed, S. B., C. Casey, C. Nochetto, and D. N. Heller. 2008. Determination of Melamine and Cyanuric Acid Residues in Infant Formula Using LC-MS/MS. U.S. Food and Drug Administration., Laboratory Information Bulletin (LIB) 4421
Tyan, Y. C., M. H. Yang, S. B. Jong, C. K. Wang, and J. Shiea. 2009. Melamine contamination. Anal Bioanal Chem 395: 729-735.
USDA. 2007a. United States Department of Agriculture (USDA). Food Safety and Inspection Service. Disposition of Hogs and Chickens From Farms Identified as Having Received Pet Food Scraps Contaminated With Melamine and Melamine-Related Compounds and Offered for Slaughter. No. 72. p 29945-29948, Docket No. FSIS 2007-0018.
USDA. 2007b. United States Department of Agricutlure (USDA). USDA Clears Swine for Processing. No. 0144.07. http://www.usda.gov/wps/portal/usda/usdahome?contentidonly=true&contentid=2007/05/0144.xml.
Vroon, D. H., and Z. Israili. 1990. Alkaline Phosphatase and Gamma Glutamyltransferase. 3rd ed. Butterworths.
Wackett, L. P., M. J. Sadowsky, B. Martinez, and N. Shapir. 2002. Biodegradation of atrazine and related s -triazine compounds: from enzymes to field studies. Applied Microbiology and Biotechnology 58: 39-45.
WHO. 2007. World Health Organization (WHO). Sodium Dichloroisocyanurate in Drinking-Water. http://www.who.int/water_sanitation_health/dwq/chemicals/second_addendum_sodium_dichloroisocyanurate.pdf 2011.
135
WHO. 2008a. World Health Organization (WHO). Toxicological and Health Aspects of Melamine and Cyanuric Acid. http://www.who.int/foodsafety/publications/chem/Melamine_report09.pdf 2011.
WHO. 2008b. World Health Organization (WHO). Melamine and Cyanuric Acid: Toxicity, Preliminary Risk Assessment and Guidance on Levels in Food. http://www.who.int/foodsafety/fs_management/Melamine.pdf Accessed 2011.
Wu, X., H. C. Lee, D. M. Muzny, and C. T. Caskey. 1989. Urate oxidase: Primary structure and evolutionary implications. Proceedings of the National Academy of Science of the United Sates of America 86: 9412-9416.
Yan, L., J. Guo, Z. Sun, S. Zhu, J. Rong, L. Sui, and M. Lu. 2009. Melamine residues in tissues of ducks fed diets containing graded levels of melamine. http://en.cnki.com.cn/Article_en/CJFDTOTAL-ZGJQ200913007.htm 2011.
Yang, S., J. Ding, J. Zheng, B. Hu, J. LI, and J. Chen. 2009. Detection of melamine in milk products by surface desorption atmospheric pressure chemical ionization mass spectrometry. Analytical Chemsitry 81: 2426-2436.
Zhang, L., J. Zhang, Z. Li, J. Cheng, P. Yin, and Y. Yao. 2007. New coordination motifs of melamine directed by N-H•••X (X=Cl or Br) hydrogen bonds. Inorganic Chemistry Communication 46: 5838-5840.