effects of curing methods and supplementary … dot f 1700.7 (8-72) 1 report no. k-tran: ksu-11-2 2...
TRANSCRIPT

A cooperative transportation research program betweenKansas Department of Transportation,Kansas State University Transportation Center, andThe University of Kansas
Report No. K-TRAN: KSU-11-2 ▪ FINAL REPORT▪ December 2013
Effects of Curing Methods and Supplementary Cementitious Material Use on Freeze Thaw Durability of Concrete Containing D-Cracking Aggregates
Kyle A. Riding, Ph.D., P.E.Brett BlackwellAmir Farid MomeniKansas State University Transportation Center
Heather McLeod, Ph.D., P.E.Kansas Department of Transportation

This page intentionally left blank.
i

Form DOT F 1700.7 (8-72)
1 Report No. K-TRAN: KSU-11-2
2 Government Accession No.
3 Recipient Catalog No.
4 Title and Subtitle Effects of Curing Methods and Supplementary Cementitious Material Use on Freeze Thaw Durability of Concrete Containing D-Cracking Aggregates
5 Report Date December 2013
6 Performing Organization Code
7 Author(s) Kyle A. Riding, Ph.D., P.E.; Brett Blackwell; Amir Farid Momeni; Heather McLeod, Ph.D., P.E.
8 Performing Organization Report No.
9 Performing Organization Name and Address Department of Civil Engineering Kansas State University Transportation Center 2118 Fiedler Hall Manhattan, Kansas 66506
10 Work Unit No. (TRAIS)
11 Contract or Grant No. C1876
12 Sponsoring Agency Name and Address Kansas Department of Transportation Bureau of Research 2300 SW Van Buren Topeka, Kansas 66611-1195
13 Type of Report and Period Covered Final Report September 2010–May 2013
14 Sponsoring Agency Code RE-0545-01
15 Supplementary Notes For more information write to address in block 9.
For concrete pavements in Kansas, the most effective method of increasing their sustainability is to increase the service life. One of the principle mechanisms of concrete pavement deterioration in Kansas is freezing and thawing damage. Some Kansas limestone aggregates are known to be very susceptible to D-cracking and have resulted in millions of dollars in maintenance costs. The Kansas Department of Transportation (KDOT) has developed rigorous testing procedures for limestone aggregate use in concrete. In this study, the role of concrete curing, mixture proportioning, and aggregate type on the freeze thaw durability of concrete beams tested using ASTM C 666 method B were investigated. This study found that long periods of soaking in lime water produced more damage during freezing and thawing than standard KDOT curing methods. Curing for shorter period of time in a lime water bath at 100°F however gave comparable freeze thaw results to that seen with the longer standard KDOT curing regime. Increasing the concretes resistance to water penetration can greatly increase the freeze thaw durability of concrete containing D-cracking susceptible aggregates. It was seen that the concrete volume of permeable voids and water absorption rate correlated well with the freeze thaw durability of concrete made with a poor quality aggregates. It is recommended that KDOT continue to enforce concrete permeability and volume of permeable voids specifications to improve the service life of Kansas concrete pavements.
17 Key Words Cement, D-Cracking, Freeze Thaw, Aggregate, Cementitious Materials, Curing
18 Distribution Statement No restrictions. This document is available to the public through the National Technical Information Service www.ntis.gov.
19 Security Classification (of this report)
Unclassified
20 Security Classification (of this page) Unclassified
21 No. of pages 75
22 Price
ii

Effects of Curing Methods and Supplementary Cementitious Material Use on Freeze Thaw Durability of Concrete Containing
D-Cracking Aggregates
Final Report
Prepared by
Kyle A. Riding, Ph.D., P.E. Brett Blackwell
Amir Farid Momeni Kansas State University Transportation Center
Heather McLeod, Ph.D., P.E. Kansas Department of Transportation
A Report on Research Sponsored by
THE KANSAS DEPARTMENT OF TRANSPORTATION TOPEKA, KANSAS
and
KANSAS STATE UNIVERSITY TRANSPORTATION CENTER
MANHATTAN, KANSAS
December 2013
© Copyright 2013, Kansas Department of Transportation
iii

PREFACE The Kansas Department of Transportation’s (KDOT) Kansas Transportation Research and New-Developments (K-TRAN) Research Program funded this research project. It is an ongoing, cooperative and comprehensive research program addressing transportation needs of the state of Kansas utilizing academic and research resources from KDOT, Kansas State University and the University of Kansas. Transportation professionals in KDOT and the universities jointly develop the projects included in the research program.
NOTICE The authors and the state of Kansas do not endorse products or manufacturers. Trade and manufacturers names appear herein solely because they are considered essential to the object of this report. This information is available in alternative accessible formats. To obtain an alternative format, contact the Office of Transportation Information, Kansas Department of Transportation, 700 SW Harrison, Topeka, Kansas 66603-3754 or phone (785) 296-3585 (Voice) (TDD).
DISCLAIMER The contents of this report reflect the views of the authors who are responsible for the facts and accuracy of the data presented herein. The contents do not necessarily reflect the views or the policies of the state of Kansas. This report does not constitute a standard, specification or regulation.
iv

Abstract
For concrete pavements in Kansas, the most effective method of increasing their
sustainability is to increase the service life. One of the principle mechanism of concrete
pavement deterioration in Kansas is freezing and thawing damage. Some Kansas limestone
aggregates are known to be very susceptible to D-cracking and have resulted in millions of
dollars in maintenance costs. The Kansas Department of Transportation (KDOT) has developed
rigorous testing procedures for limestone aggregate use in concrete. In this study, the role of
concrete curing, mixture proportioning, and aggregate type on the freeze thaw durability of
concrete beams tested using ASTM C 666 method B were investigated. This study found that
long periods of soaking in lime water produced more damage during freezing and thawing than
standard KDOT curing methods. Curing for shorter period of time in a lime water bath at 100°F
however gave comparable freeze thaw results to that seen with the longer standard KDOT curing
regime. Increasing the concretes resistance to water penetration can greatly increase the freeze
thaw durability of concrete containing D-cracking susceptible aggregates. It was seen that the
concrete volume of permeable voids and water absorption rate correlated well with the freeze
thaw durability of concrete made with a poor quality aggregates. It is recommended that KDOT
continue to enforce concrete permeability and volume of permeable voids specifications to
improve the service life of Kansas concrete pavements.
1

Acknowledgements
The authors wish to acknowledge the financial support of the Kansas Department of
Transportation (KDOT) for this research. KDOT also collected the coarse aggregates for use in
this study. Ms. Heather McLeod was the project monitor from KDOT for this project. The advice
and assistance of Jennifer Distlehorst, Joshua Welge, Rodney Montney, Tabitha Taylor, and Dave
Meggers is also gratefully acknowledged.
2
Table of Contents
Abstract ........................................................................................................................................... 1
Acknowledgements ......................................................................................................................... 2
Table of Contents ............................................................................................................................ 3
List of Tables .................................................................................................................................. 5
List of Figures ................................................................................................................................. 6
Chapter 1: Introduction ................................................................................................................... 8
1.1 Research Background ............................................................................................................ 8
1.2 Problem Statement ................................................................................................................ 8
1.3 Research Objectives .............................................................................................................. 9
1.4 Scope of Research ................................................................................................................. 9
Chapter 2: Literature Review ........................................................................................................ 11
2.1 D-Cracking .......................................................................................................................... 11
2.2 Freeze Thaw Durability ....................................................................................................... 12
2.2.1 Concrete Properties ....................................................................................................... 12
2.2.2 Saturation ...................................................................................................................... 15
2.3 Scaling ................................................................................................................................. 16
2.4 External Freeze Thaw Resistance ....................................................................................... 16
2.4.1 Rate of Freezing ............................................................................................................ 17
2.4.2 Duration of Freezing Period ......................................................................................... 18
2.4.3 Freezing Temperature ................................................................................................... 18
2.4.4 Damage Measurement .................................................................................................. 19
2.5 Preventative Measures......................................................................................................... 20
2.5.1 Saturation Reduction Options ....................................................................................... 20
2.5.2 Aggregate Blending ...................................................................................................... 20
2.5.3 Surface Treatments ....................................................................................................... 21
2.6 Supplementary Cementitious Materials .............................................................................. 21
2.7 Summary ............................................................................................................................. 22
Chapter 3: Concrete Batching, Curing, and Testing Procedures .................................................. 23
3.1 Aggregate Characterization ................................................................................................. 23
3.2 Batching Procedures ............................................................................................................ 25
3

3.3 Slump and Air Content Procedures ..................................................................................... 26
3.4 Specimen Preparation .......................................................................................................... 28
3.4.1 Specimen Fabrication ................................................................................................... 28
3.4.2 Curing Process .............................................................................................................. 28
3.5 Laboratory Testing .............................................................................................................. 29
3.5.1 Concrete Rapid Freezing and Thawing Testing ........................................................... 29
3.5.2 ASTM C 1585: Standard Test Method for Measurement of Rate of Absorption of Water by Hydraulic-Cement Concretes ....................................................................... 34
3.5.3 ASTM C 1202: Standard Test Method for Electrical Indication of Concrete’s Ability to Resist Chloride Ion Penetration ................................................................................ 35
3.5.4 ASTM C 642: Standard Test Method for Density, Absorption, and Voids in Hardened Concrete ........................................................................................................................ 38
Chapter 4: Materials ...................................................................................................................... 39
4.1 Coarse Aggregate ................................................................................................................ 39
4.2 Fine Aggregate .................................................................................................................... 40
4.3 Cement ................................................................................................................................ 40
4.4 Supplementary Cementitious Materials .............................................................................. 41
4.5 Admixture............................................................................................................................ 41
4.6 Mixture Proportions ............................................................................................................ 41
Chapter 5: Results ......................................................................................................................... 43
5.1 Task 1 .................................................................................................................................. 43
5.2 Task 2 .................................................................................................................................. 45
5.3 Task 3 .................................................................................................................................. 53
5.3.1 Concrete Rapid Freezing and Thawing Testing ........................................................... 54
5.3.2 Concrete Resistance to Water Ingress .......................................................................... 58
Chapter 6: Conclusions and Recommendations ........................................................................... 64
6.1 Conclusions ......................................................................................................................... 64
6.2 Implementation Recommendations ..................................................................................... 65
6.3 Future Research ................................................................................................................... 66
References ..................................................................................................................................... 67
4

List of Tables
TABLE 3.1 Charge Classification Table (ASTM C 1202 2012).................................................. 37
TABLE 4.1 Specific Gravity and Absorption Capacities of the Coarse Aggregates ................... 39
TABLE 4.2 Specific Gravity and Absorption Capacity of the Fine Aggregate ........................... 40
TABLE 4.3 Cement Composition................................................................................................. 40
TABLE 4.4 Supplementary Cementitious Material Composition and Properties ........................ 41
TABLE 4.5 Theoretical Mixture Proportions ............................................................................... 42
TABLE 5.1 Theoretical Mixture Proportions ............................................................................... 53
5

List of Figures
FIGURE 3.1 Concrete Mixer Used in This Study ........................................................................ 26
FIGURE 3.2 Concrete Slump Test ............................................................................................... 27
FIGURE 3.3 Concrete Air Pressure Meter Used in Testing ......................................................... 27
FIGURE 3.4 20 Block Concrete Freeze Thaw Machine Used ..................................................... 32
FIGURE 3.5 Interior of Concrete Freeze Thaw Chamber ............................................................ 33
FIGURE 3.6 Transverse Frequency Setup Used in the Study ...................................................... 34
FIGURE 3.7 Rapid Chloride Permeability Test Setup ................................................................. 37
FIGURE 5.1 Relative Modulus During Freeze Thaw Testing for Concrete Specimens Made from Concrete Sampled from the K-18 Ogden to Manhattan Improvement Project ................ 44
FIGURE 5.2 Task 1 Freeze Thaw Results for Beams Made by KDOT ....................................... 44
FIGURE 5.3 Aggregate a Relative Modulus with Different Curing Methods ............................. 45
FIGURE 5.4 Aggregate B Relative Modulus with Different Curing Methods ............................ 46
FIGURE 5.5 Aggregate C Relative Modulus with Different Curing Methods ............................ 46
FIGURE 5.6 Aggregate A Length Change with Different Curing Methods ................................ 47
FIGURE 5.7 Aggregate B Length Change with Different Curing Methods ................................ 47
FIGURE 5.8 Aggregate C Length Change with Different Curing Methods ................................ 48
FIGURE 5.9 7 Day Lime Water Cured Relative Modulus with Different Aggregates ................ 48
FIGURE 5.10 14 Day Lime Water Cured Relative Modulus with Different Aggregates ............ 49
FIGURE 5.11 21 Day Lime Water Cured Relative Modulus with Different Aggregates ............ 49
FIGURE 5.12 28 Day Moist Cured Relative Modulus with Different Aggregates ...................... 50
FIGURE 5.13 Standard Cured Relative Modulus with Different Aggregates.............................. 50
FIGURE 5.14 Change in Mass for Concrete Samples Exposed to Different Curing Methods .... 53
FIGURE 5.15 Aggregate A Relative Modulus ............................................................................. 55
FIGURE 5.16 Aggregate C Relative Modulus ............................................................................. 55
FIGURE 5.17 Aggregate D Relative Modulus ............................................................................. 56
6
FIGURE 5.18 Aggregate A Length Change Measurements ......................................................... 56
FIGURE 5.19 Aggregate C Length Change Measurements ......................................................... 57
FIGURE 5.20 Aggregate D Length Change Measurements ......................................................... 57
FIGURE 5.21 Concrete Mixture Initial Absorption ..................................................................... 58
FIGURE 5.22 Concrete Mixture Secondary Absorption .............................................................. 59
FIGURE 5.23 Concrete Mixture Rapid Chloride Permeability (ASTM C 1202) Results............ 59
FIGURE 5.24 Concrete Mixture Volume of Permeable Voids (%) ............................................. 60
FIGURE 5.25 Comparison of Concrete Durability Factor versus Volume of Permeable Voids for Concrete Made with Aggregate C..................................................................................... 61
FIGURE 5.26 Comparison of Concrete Durability Factor versus Rapid Chloride Permeability for Concrete Made with Aggregate C..................................................................................... 61
FIGURE 5.27 Comparison of Concrete Durability Factor versus Absorption Coefficients for Concrete Made with Aggregate C..................................................................................... 62
7
Chapter 1: Introduction
1.1 Research Background
Sustainable roads provide safe, uninterrupted travel for the public on networks of roads
and bridges that are economical and sensitive to the environment. For concrete pavements in
Kansas, the most effective method of increasing their sustainability is to increase the service life.
One of the principle mechanisms of concrete pavement deterioration in Kansas is freezing and
thawing damage. Some Kansas limestone aggregates are known to be very susceptible to D-
cracking and have resulted in millions of dollars in maintenance costs. The Kansas Department
of Transportation (KDOT) has developed rigorous testing procedures for limestone aggregate use
in concrete. For final qualification, the aggregate must pass KT-MR-22, Resistance of Concrete
to Rapid Freezing and Thawing. The standard ASTM C 666 procedure B was modified by
KDOT following a study in 1980 to require a 90-day cure period before the 300 freezing and
thawing cycles, making the minimum time needed to perform the modified freezing and thawing
test 5 months (Clowers 1999). Recently, KDOT has increased the number of cycles required to
660 cycles.
Besides a more rapid detection of deleterious aggregates, concrete pavement
sustainability can be improved by changing mixture proportions. A recent study performed at
Iowa State University showed that the concrete resistance to freeze thaw damage could be
increased by reducing the concrete permeability (Wang, Lomboy, and Steffes 2009). Another
study found that a small reduction in the water-cementitious material ratio (w/cm) from 0.44 to
0.4 increased the durability factor of four different Minnesota aggregates by an average of 14
(Snyder and Janssen 1999). It is unknown however how much of an increase in the freeze-thaw
resistance of Kansas pavements can be gained by decreasing the porosity and permeability.
1.2 Problem Statement
KDOT has developed rigorous standards for limestone aggregates for use in pavements,
including that they pass the KT-MR-22 concrete prism freezing and thawing test, which can take
up to 6 months to complete. This project aimed to 1) shorten significantly the total time needed
to perform the KT-MR-22 test method by changing the curing methods used and 2) determine
8

any change in concrete freeze-thaw resistance as a result of a change in the concrete permeability
from the use of supplementary cementitious materials (SCMs).
1.3 Research Objectives
The research objectives of this study were as follows:
• Freeze thaw testing was conducted on concrete made from the same aggregate
source but with different amounts of wet curing at elevated temperatures to
determine if accelerated curing with no drying period would give comparable
durability to beams tested using the standard KDOT curing method of 67 days in
the 100% moisture room, 21 days in a 50% relative humidity room, 2 days in a
tempering tank, and finally 24 hours at 40°F.
• To determine any increase in freeze-thaw durability of concrete containing poor
quality aggregates through a decrease in concrete water absorption and
permeability by the use of supplementary cementitious materials (SCMs).
1.4 Scope of Research
This research project is composed of three tasks. Task1 focused on comparing the freeze
thaw testing procedures and laboratory equipment between KDOT and KSU’s laboratories.
Three sets of beams were fabricated during Task 1. Of these three sets, concrete beams were cast
in the field, cast at KSU, and cast at KDOT. Each casting included six beams, three for KDOT
and three for KSU. The beams cast by KSU used the same aggregate as the beams cast in the
field. Beams cast by KDOT contained aggregates with a history of poor performance in freezing
and thawing conditions. Both the beams tested by KSU and KDOT were tested using KT-MR-22
for 300 cycles of freezing and thawing.
In task 2 the effect of accelerating curing procedures in the KT-MR-22 test on freeze
thaw durability was examined. Three different batches containing different aggregates were used
to test whether or not the curing procedures could be reduced. Five different curing methods
were used in this study using different amounts of time in lime water at 100°F, curing for 28 days
9

in the 100% moisture room, and the standard KTMR-22 curing methods for comparison. After
curing, each specimen was tested in rapid freezing and thawing.
The third task focused on testing whether SCMs could improve freeze-thaw resistance by
lowering water absorption rates. Three different aggregates were tested using different
combinations of supplementary cementitious materials. With 7 different mixture proportions and
3 different aggregate sources, a total of 21 different mixtures were tested in this task. The seven
different mixture proportions used are as follows:
• Batch 1: 100% Portland Cement, 0.39 w/cm
• Batch 2: 100% Portland Cement, 0.45 w/cm
• Batch 3: 25% Oklahoma Class C Fly Ash, 0.39 w/cm
• Batch 4: 25% Slag, 0.39 w/cm
• Batch 5: Ternary Blend (12.5% Oklahoma Class C Fly Ash, 12.5% Slag), 0.39
w/cm
• Batch 6: 25% Class F Fly Ash, 0.39 w/cm
• Batch 7: 25% Jeffery Energy Class C Fly Ash, 0.39 w/cm
Each SCM and aggregate source was selected in consultation with KDOT. Three beams
for each mixture were tested under 600 freezing and thawing cycles in this task. In addition to
the beams, nine cylinders were made to measure the concrete’s ability to resist water penetration.
10

Chapter 2: Literature Review
Concrete is the most widely used construction material around the world. It can be
measured both by strength and durability. Present day concrete failures are not typically due to a
lack of strength, but are caused by concrete lacking in durability. Deterioration that happens
gradually over time and reduces the service life of concrete can become expensive if concrete is
repaired or replaced prior to the end of the anticipated service life. Durability of concrete is a
major concern in regions of the world that are exposed to harsh climates where freezing and
thawing occurs. This is the case for much of the Midwest, including Kansas. The Kansas
Department of Transportation (KDOT) has spent much of its resources working on durability
issues with concrete due to freezing and thawing conditions.
2.1 D-Cracking
The durability of concrete refers to its ability to withstand deterioration due to harsh
environmental conditions. These conditions can act alone or together and include heating and
cooling, freezing and thawing, wetting and drying, chemical attacks, and abrasion. Of these
conditions, freezing and thawing is a major concern for KDOT. Deterioration due to freezing and
thawing causes D-cracking to occur in Kansas (Koubaa and Snyder 2001).
D-cracking is a type of freeze-thaw damage in concrete pavements that occurs because of
poor quality coarse aggregates. After the aggregates become saturated, the coarse aggregate is
vulnerable to deterioration during freezing and thawing cycles. When the water inside the course
aggregates is frozen, pressure builds up inside of the coarse aggregate. If the internal strength of
the coarse aggregate is lower than the pressure applied by the expansion of the water inside the
coarse aggregate, the coarse aggregate will crack. After cracks form, the deterioration process
accelerates because of wedging action in cracks and the increase in potential water availability
(Snyder and Janssen 1999). Concrete exposed to freezing and thawing cycles also can have
damage that starts at the interfacial transition zone (Koubaa and Snyder 2001). Poor air-
entrainment can also contribute to freeze-thaw damage near the joints or increase the rate of D-
cracking development.
11

D-cracking displays a particular cracking pattern in concrete. The cracks tend to be
closely spaced and run parallel to the concrete joints and edges. Before the cracks are visible at
the surface, they usually develop below the surface in a horizontal plane. The first visible cracks
usually start at intersections of two joints or at the corners of the slab. Cracking will work its way
from the joints to the interior of the slab as time passes (Snyder and Janssen 1999). Though D-
cracking is typically associated with concrete pavements, it is also possible to have D-cracking in
concrete structures (Koubaa and Snyder 2001). Typical structures affected by D-cracking include
structures such as bridge piers and dams. These structures are vulnerable to cracking near the
water line. The concrete a few feet above the water line can be saturated and experience freezing
and thawing (Pigeon and Pleau 1995).
D-cracking typically occurs first at the concrete joint because water is likely to stay at
joints longer, causing them to saturate first. Since the bottom layer of the pavement is typically
the most saturated layer, D-cracking is likely to initially occur in this layer first. However, it is
possible for deterioration to occur first in both the middle and top layers of the pavement
depending on the local saturation conditions (Snyder and Janssen 1999). This can occur when the
concrete does not crack at the joint location, allowing water to pond in the joint or if water
cannot drain through the crack. Proper drainage is important to keep water away from the
concrete and prevent saturation (Li, Pour-Ghaz, Castro, and Weiss 2011).
2.2 Freeze Thaw Durability
2.2.1 Concrete Properties
There are several variables within the concrete mixture design that affect concrete
resistance to bulk deterioration in freezing and thawing conditions. These factors include: the
water to cement ratio, aggregate characteristics, additives, the air void spacing factor, and the
curing period (Pigeon, Pleau, and Aitcin 1986).
2.2.1.1 Air Entrainment
Air voids are known to help reduce the damage of concrete that occurs due to cycles of
freezing and thawing. As the percentage of air voids is important to the durability of concrete,
the size and distribution of these air voids are equally important. A well-structured air void
12
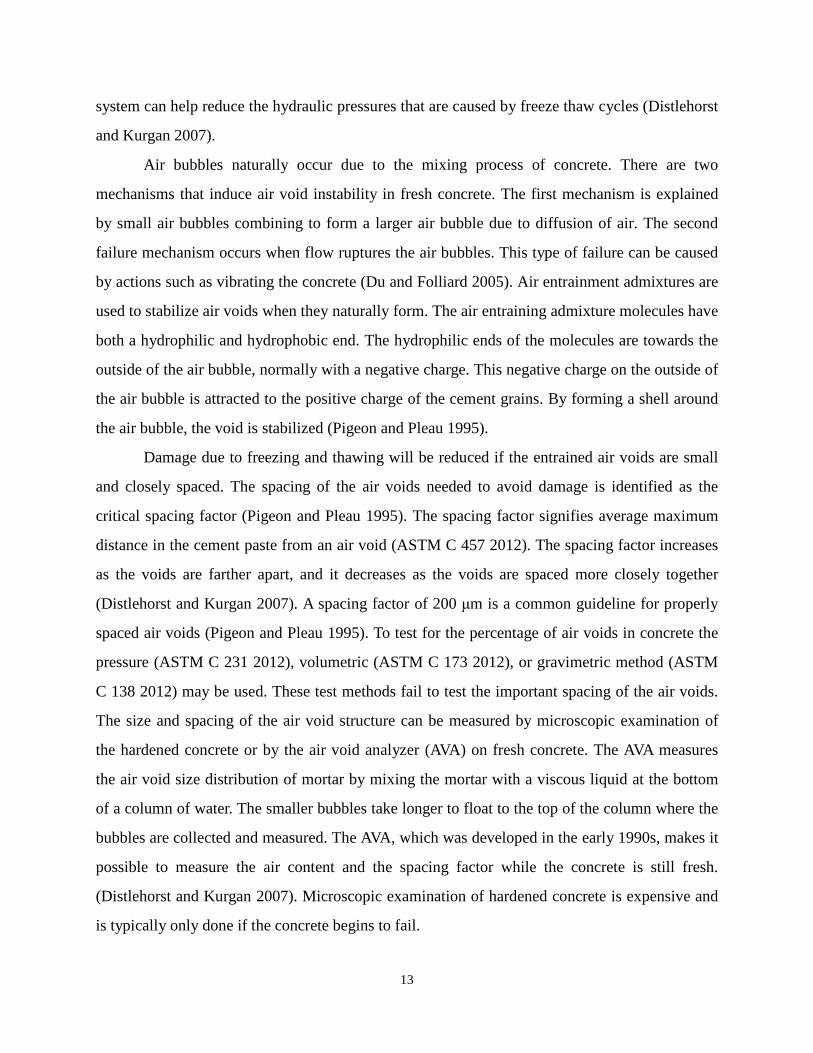
system can help reduce the hydraulic pressures that are caused by freeze thaw cycles (Distlehorst
and Kurgan 2007).
Air bubbles naturally occur due to the mixing process of concrete. There are two
mechanisms that induce air void instability in fresh concrete. The first mechanism is explained
by small air bubbles combining to form a larger air bubble due to diffusion of air. The second
failure mechanism occurs when flow ruptures the air bubbles. This type of failure can be caused
by actions such as vibrating the concrete (Du and Folliard 2005). Air entrainment admixtures are
used to stabilize air voids when they naturally form. The air entraining admixture molecules have
both a hydrophilic and hydrophobic end. The hydrophilic ends of the molecules are towards the
outside of the air bubble, normally with a negative charge. This negative charge on the outside of
the air bubble is attracted to the positive charge of the cement grains. By forming a shell around
the air bubble, the void is stabilized (Pigeon and Pleau 1995).
Damage due to freezing and thawing will be reduced if the entrained air voids are small
and closely spaced. The spacing of the air voids needed to avoid damage is identified as the
critical spacing factor (Pigeon and Pleau 1995). The spacing factor signifies average maximum
distance in the cement paste from an air void (ASTM C 457 2012). The spacing factor increases
as the voids are farther apart, and it decreases as the voids are spaced more closely together
(Distlehorst and Kurgan 2007). A spacing factor of 200 μm is a common guideline for properly
spaced air voids (Pigeon and Pleau 1995). To test for the percentage of air voids in concrete the
pressure (ASTM C 231 2012), volumetric (ASTM C 173 2012), or gravimetric method (ASTM
C 138 2012) may be used. These test methods fail to test the important spacing of the air voids.
The size and spacing of the air void structure can be measured by microscopic examination of
the hardened concrete or by the air void analyzer (AVA) on fresh concrete. The AVA measures
the air void size distribution of mortar by mixing the mortar with a viscous liquid at the bottom
of a column of water. The smaller bubbles take longer to float to the top of the column where the
bubbles are collected and measured. The AVA, which was developed in the early 1990s, makes it
possible to measure the air content and the spacing factor while the concrete is still fresh.
(Distlehorst and Kurgan 2007). Microscopic examination of hardened concrete is expensive and
is typically only done if the concrete begins to fail.
13
2.2.1.2 Water to Cement Ratio
Lower water-to-cement (w/cm) ratios have been shown to produce higher strength and
freeze-thaw durability in laboratory tests. An increase in the concrete tensile strength will
increase the stresses required to induce cracking during freezing. Lower w/cm also reduces the
amount of water remaining after hydration which reduces the degree of saturation. Concrete with
a lower w/cm will have a smaller pore size distribution and lower water permeability. This
decrease in permeability slows down water absorption which will increase the time it takes to
saturate the concrete and increase the durability of the concrete (Snyder and Janssen 1999). This
benefit is limited to concrete that is intermittently exposed to moisture since concrete that is
sufficiently saturated will show damage even with low w/cm.
2.2.1.3 Aggregate Quality
Coarse aggregates differ in physical and chemical properties based on the geology of
where they are quarried. Argillaceous carbonate aggregates are limestone and dolomites that are
made of at least 10 percent silt and clay particles. Since there is a larger volume of small pores in
clayey argillaceous material than silty argillaceous material, clayey argillaceous material is
generally thought to be less durable than silty argillaceous material. The clayey material in
limestone aggregates absorbs extra water causing the aggregate to become saturated more rapidly
and expand more. Argillaceous aggregates in Indiana were found to be nondurable if they
contain more than 20 percent clayey or silty material (Shakoor, West, and Scholer 1982).
Argillaceous aggregates differ from non-argillaceous aggregates in a few important ways.
Argillaceous material can be distributed throughout aggregates three different ways. It can be
present via uniformly distributed fine particles. Argillaceous material can also take the form of
thin irregular streaks or small elongated flakes. It is believed that argillaceous limestone
aggregates have a higher tendency for durability issues when they are subjected to cycles of
freezing and thawing. A previous study showed that poor quality argillaceous aggregates in
Indiana tend to have a bulk specific gravity under 2.5 and an absorption capacity of more than 4
percent (Shakoor, West, and Scholer 1982). These durability trends are not universal and have
14
not found to necessarily be predictive of performance in Kansas, making it difficult to develop
aggregate qualification tests across geologic regions.
2.2.1.4 Size of Aggregates
Reducing the size of marginal quality coarse aggregates has shown to increase the life of
concrete on-grade subject to freezing and thawing. The smaller aggregates allow water to escape
faster which reduces the dilation of the aggregate during freezing from water freezing in the
pores and the resultant stresses on the paste near the aggregate. Reducing the size of the
aggregates will not make the concrete last forever, but the longer concrete remains durable the
more money will be saved by state agencies (Chapin and Dryden 2001).
2.2.1.5 Curing
Typically concrete will become stronger as the hydration process is allowed to progress.
The durability of the concrete due to freezing and thawing will likewise increase with increased
levels of hydration. Concrete that is frozen before reaching 500 psi or experiences multiple
freeze-thaw cycles before reaching 3500 psi will experience significant strength loss which is
irrecoverable. This is because in low strength concrete large ice crystals will form causing large
amounts of porosity and damage in the concrete microstructure (ACI 306 2010).
2.2.2 Saturation
For freeze thaw damage to occur the saturation of the concrete must reach a certain level,
termed the critical degree of saturation. If the degree of saturation is below this critical degree of
saturation, freeze-thaw damage may not occur. Conversely, even with air entrainment damage
can occur after just one freeze-thaw cycle if the concrete is fully saturated (Li, Pour-Ghaz,
Castro, and Weiss 2011). The critical degree of saturation is not a precise number and depends on
many factors such as porosity, pore size distribution, and permeability. For three different
mortars prepared with between 6 and 14% air by volume, the critical degree of saturation was
found to be 86 to 88% (Li, Pour-Ghaz, Castro, and Weiss 2011).
Concrete that has been allowed to dry will usually have higher durability under freeze-
thaw conditions because of a lower amount of freezable water in the pores. If the concrete is
15
allowed access to moisture again however the concrete can re-saturate and experience freeze-
thaw damage. Drying causes the pores in the concrete to become enlarged and to become more
interconnected which increases permeability. This increased water permeability will allow water
to reenter the concrete faster than before the drying period. This means that if the concrete is
exposed to water for a long period of time after the drying period the benefits of the drying will
disappear (Pigeon and Pleau 1995).
2.3 Scaling
Cycles of freezing and thawing can cause damage to concrete. This damage comes in
both the form of scaling and internal cracking. Scaling and internal cracking do not always occur
simultaneously. One form of deterioration can occur without the other (Pigeon, Pleau, and Aitcin
1986). Unlike internal cracking, which is clearly defined by its' name, scaling only appears on
the surface of the concrete. Scaling can occur when concrete freezes in water. Scaling is made
worse by the application of deicer salts (Pigeon, Pleau, and Aitcin 1986). Other factors can cause
scaling to take place:
“Excessive bleeding, bad finishing procedures, plastic shrinkage cracking, overworking of the surface during the finishing operations, lack of curing, and early exposure to relatively high temperatures can all weaken the concrete surface and be an indirect cause of rapid scaling when concrete is exposed to freezing in water with or without de-icer salts being present (Pigeon and Pleau 1995).”
Concrete with an effective air void system can reduce the occurrence of scaling (Pigeon and
Pleau 1995). Proper air entrainment will improve the concrete performance in deicer salt scaling,
but will not prevent scaling in concrete with a high w/cm. Scaling can be signified by a loss of
mass to the concrete specimen during freeze-thaw cycles. (Pigeon, Pleau, and Aitcin 1986).
2.4 External Freeze Thaw Resistance
The concrete mixture proportions affect the freeze thaw durability of concrete. External
factors, in addition to the concrete’s properties, also play a role in the rate at which deterioration
16

occurs. The rate of freezing and thawing, the duration of the freezing period, and the freezing
temperature all have an external effect on the durability (Basheer and Cleland 2006).
2.4.1 Rate of Freezing
The rate of freezing affects the durability of the concrete. Typical freezing rates that occur
naturally are much lower than the freezing rates that are allowed in ASTM C 666. As the
freezing rate increases the concrete deteriorates more rapidly. This increase in the freezing rate
causes the critical air void spacing to decrease, meaning the air voids must be closer together as
the freezing rate increases to prevent damage from occurring. The higher freezing rate increases
the hydraulic pressures within the pores. These increased hydraulic pressures cause more
deterioration to occur with each cycle (Nokken, Hooton, and Rogers 2004). This has led to the
criticism that the ASTM test is harsher than actual conditions. Even if ASTM C 666 is harsher
than actual conditions, it is still useful for comparing concrete mixtures to one another (Nokken,
Hooton, and Rogers 2004).
It is believed that ice formation causes deterioration due to cycles of freezing and
thawing. The formed ice applies pressure which acts as the mechanism that cracks the concrete
(Basheer and Cleland 2006). Ice will begin to form as temperatures drop below freezing and
moisture is present in the concrete. If air voids are available, ice will form in the air voids.
However, if there are not sufficient air voids available the ice formation will begin to cause
damage to the concrete. Frost damage can occur in either the paste or the aggregates. Paste frost
damage occurs when water in the saturated paste is not able to make its way to the air voids fast
enough or with low enough hydraulic pressure to avoid damage. As the capillary pores are filled
with water and the temperature drops below freezing, the water tries to travel through the porous
body towards the air voids. If the hydraulic pressure exceeds the tensile strength of the paste
cracking will occur. According to Darcy’s law of water flow through porous bodies, this
hydraulic pressure is given as a required pressure for water to travel a certain distance in a
certain amount of time. Thus, due to Darcy’s law of water through porous bodies, to prevent
damage and reduce the pressure on the paste one of two things must happen. Either a decrease in
the freezing rate or a decrease in the space between air voids must occur. As the freezing rate is
17

reduced ice forms slower giving water more time to move towards air voids. Of the two solutions
provided to reduce the possibility of damage occurring in the paste, only one solution can be
controlled. The freezing rate is up to the weather; whereas, the air void spacing can be controlled
using proper air entraining admixtures (Pigeon and Pleau 1995).
2.4.2 Duration of Freezing Period
Freezing periods generally last for longer time periods under actual freezing and thawing
conditions than in the ASTM C 666 test. It would be hard to reproduce actual freezing and
thawing cycles in a test, and would take too long to be practical. ASTM C 666 tests the concrete
prisms at a shorter duration of freezing than actually occurs to speed up the test. The decrease in
the freezing duration will decrease the amount of deterioration seen. These longer durations
cause ice to continue to form gradually in layers during a freeze cycle (Nokken, Hooton, and
Rogers 2004).
2.4.3 Freezing Temperature
The temperature that water freezes and the temperature that water freezes in the pores of
concrete are different. The temperature that water freezes in concrete pores depends on the
temperature, the pore size, and the pore distribution. As the size of the pores decrease, the
temperature needs to be lower to freeze the water (Nokken, Hooton, and Rogers 2004). The
Gibbs-Thomson equation used to predict this is shown as Equation 2.1:
𝛾𝛾𝐶𝐶𝐶𝐶𝑘𝑘𝐶𝐶𝐶𝐶 = �(𝑆𝑆𝐶𝐶 − 𝑆𝑆𝐶𝐶)
𝑉𝑉𝐶𝐶
𝑇𝑀(∞)
𝑇𝑎𝑎
Equation 2.1
where 𝛾𝛾𝐶𝐶𝐶𝐶 is the crystal/liquid interfacial energy, 𝑘𝑘𝐶𝐶𝐶𝐶 is the curvature of the crystal/liquid
interface, 𝑆𝑆𝐶𝐶 𝑎𝑎𝑎𝑎𝑎𝑎 𝑆𝑆𝐶𝐶 are the entropies of the liquid and crystal, respectively, 𝑇𝑇𝑀𝑀(∞) is the melting
point of a macroscopic crystal, and 𝑉𝑉𝐶𝐶 is the molar volume of the liquid (Sun and Scherer 2010).
Freezing of all pores, including capillary pores, generally occurs by -10 degrees Celsius
(Nokken, Hooton, and Rogers 2004). For all of the water to freeze during each cycle it is
important that the temperature drops low enough so that ice forms in the small pores during
testing. Small laboratory samples can behave differently from large pavements however. Having
18
a greater probability for a nucleation to occur on a large scale field pavement, it should be
expected to have some ice formation occurring at slightly higher temperatures than the lab data
suggests (Sun and Scherer 2010).
2.4.4 Damage Measurement
2.4.4.1 Length Change
The length of the concrete specimen is optionally measured in the ASTM C 666 test
(ASTM C 666 2008). This length change is a good measure for the internal damage that occurs
in the concrete specimen and correlates well with dynamic modulus values (Pigeon, Pleau, and
Aitcin 1986). Minor length changes in concrete specimens can be expected due to the difference
in the coefficient of thermal expansion for the cement paste and the aggregates. These small
length changes due to discrepancies in coefficients of thermal expansion will occur even in
durable concretes. Neither the air void structure nor the quality of the course aggregate has
bearing on this small expansion. Larger expansions indicate that cracking from freeze-thaw
damage has occurred within the specimen. These cracks cause voids that expand the concrete
(Pigeon, Pleau, and Aitcin 1986).
2.4.4.2 Dynamic Modulus
The measurement of dynamic modulus of elasticity is specified as part of ASTM C 666 to
measure the concrete freeze-thaw deterioration. The dynamic modulus can be tested either by
forced resonance or impact resonance. Both methods measure the concrete fundamental
longitudinal resonant frequencies. The frequency will decrease as the concrete begins to crack
internally because waves travel slower through a damaged medium. As the length of the concrete
specimen increases, the measured frequency decreases. (Pigeon, Pleau, and Aitcin 1986).
The relative dynamic modulus sometimes has trouble indicating only internal cracking.
As surface scaling occurs, the resonant frequency also decreases. The pulse velocity is affected
differently by surface scaling and internal cracking. Surface scaling tends to deteriorate linearly;
however, length change and internal cracking cause deterioration to proceed in an exponential
manner (Pigeon, Pleau, and Aitcin 1986).
19

2.5 Preventative Measures
Several methods have been studied to lengthen the life of the concrete exposed to
freezing and thawing conditions. Most of these studies have focused on reducing the saturation
levels of the concrete and reducing the size of the aggregates.
2.5.1 Saturation Reduction Options
To prevent D-cracking from happening in regions that undergo freeze thaw cycles, one of
the factors leading to D-cracking deterioration must be minimized or eliminated. Either good
coarse aggregates should be used or if good coarse aggregates are not available, the concrete
should not be allowed to become saturated with moisture. Good positive drainage of pavements
will help reduce D-cracking in concrete by not allowing the concrete to become saturated with
water. One study looked at the impact of the subbase layer beneath the concrete pavement in
Ohio (Dryden and Chapin 2009). In this study subbase systems were prepared three different
ways. One pavement was placed on granular material with longitudinal drains, another was
placed on granular material without drains, and the final pavement was placed directly onto the
clay subgrade. The pavement on the clay subgrade deteriorated quickly and the longitudinal pipe
and the plain granular subbase showed similar results. In the past vapor barriers have been used
with the hope of preventing moisture from penetrating up into the concrete slab. These vapor
barriers were located between the subbase and the concrete. It was determined however that the
vapor barrier does not increase the durability of the concrete pavement (Dryden and Chapin
2009). Just as the vapor barrier doesn’t allow water to enter the concrete, the barriers prevent
water from leaving through the bottom of the pavement, keeping the concrete saturated.
2.5.2 Aggregate Blending
Coarse aggregates with good durability are not always readily available in regions
susceptible to freeze thaw damage, as is the case in Kansas. There are a number of solutions that
have been tried to increase the durability of specific aggregates. There are strong economic and
political incentives to make coarse aggregates of poor durability suitable for use in concrete. By
reducing the size of the coarse aggregate, freeze thaw damage is somewhat delayed. A study
conducted by Snyder and Janssen (1999) showed that durability can be increased by blending
20

good aggregates and poor aggregates. The blend of fifty percent poor and fifty percent good
coarse aggregate is the highest percentage of poor coarse aggregate that has shown an
improvement in the durability (Snyder and Janssen 1999). As this study was laboratory based,
there are still questions about the economic viability and long term field durability of aggregate
blending using different aggregate sources however.
2.5.3 Surface Treatments
Availability of good aggregates is sometimes scarce and costly. Many treatments have
been tried in order to make poor aggregates perform better under freeze testing and allow their
use in concrete. Surface treatments composed of silanes and siloxanes have been applied to
highway structures to attempt to prevent the concrete from becoming saturated with water
(Basheer and Cleland 2006). It is thought that the hydrophobic treatments line the concrete pores,
repeling water away from the pores. Although this treatment does decrease the amount of water
that saturates the concrete, it does not prevent water vapor from entering concrete. Since this
treatment allows the passage of water vapor, the concrete is allowed to dry naturally. This
treatment did show positive results. The surface treated concrete did not become critically
saturated as soon as the concrete without the surface treatment (Basheer and Cleland 2006).
Concrete pavements in the field however could still become saturated from the bottom up.
2.6 Supplementary Cementitious Materials
Supplementary cementitious materials (SCM) provide an environmentally friendly
alternative to replace part of the cement used in concrete. Fly ash, slag, and silica fume are
examples of commonly used SCMs that are industrial byproducts (Wang K. 2003).
There are some advantages to using SCM’s other than their low cost and positive
environmental impact. SCM’s can improve the workability, durability, and long term strength of
concrete. Heat of hydration is also typically lower for concretes using SCM’s. This lower heat of
hydration can be a benefit in reducing the risk for thermal cracking to occur in the concrete. To
combat the low heat of hydration, accelerators or slab coverings may have to be used in cold
weather situations (Wang K. 2003). Since SCM’s have a slow heat of hydration, longer curing
21
times may delay construction that is on a tight schedule needing concrete to meet early strength
requirements (Ge and Wang 2005).
SCMs are thought to impact the freeze thaw durability of concrete by reducing the
permeability to reduce water ingress and saturation and increase the long term concrete strength.
Some SCMs such as fly ash can contain unburnt carbon. This unburnt carbon can absorb air
entraining admixtures, increasing the dosage of air entraining admixture required to provide
adequate protection against freezing and thawing conditions (Ley, Harris, Folliard, and Hover
2008). More research is needed to determine how SCM use can affect aggregate freeze thaw
durability when used in concrete.
2.7 Summary
The durability of concrete is affected by many different factors. These factors include the
concrete permeability, pavement subbase drainage, air void structure, aggregate quality, freezing
rate and amount, and salt level. The extent to which the freeze-thaw durability of concrete
containing D-cracking aggregates can be improved by reducing the concrete permeability is
unknown and is the subject of this study.
22

Chapter 3: Concrete Batching, Curing, and Testing Procedures
3.1 Aggregate Characterization
The coarse aggregate specific gravity and absorption capacity was measured according to
ASTM C 127 (ASTM C 127 2012). The coarse aggregate specific gravity and absorption was
measured as follows:
1. The sample was soaked in water for 24 ± 4 hours.
2. The sample was surface dried by shaking the coarse aggregates in a large towel.
Care was taken to avoid evaporation of water from within the pores.
3. This sample surface dry mass was recorded as B.
4. The sample was submerged in water at a temperature of 23 ± 2 ºC.
5. The submerged sample mass was recorded as C.
6. The sample was oven dried at a temperature of 110 ± 5 ºC.
7. The oven dried mass was recorded as A.
Equations 3.1 and 3.2 were used to calculate coarse aggregate specific gravity and the
absorption capacity:
𝑆𝑆𝑝𝑒𝑐𝑖𝑓𝑖𝑐 𝐺𝑟𝑎𝑎𝑣𝑖𝑡𝑦 (𝑆𝑆𝑆𝑆𝐷𝐷) = 𝐵
𝐵 − 𝐶
Equation 3.1
𝐴𝑏𝑠𝑜𝑟𝑝𝑡𝑖𝑜𝑎𝑎 (%) = 𝐵 − 𝐴𝐴
× 100 Equation 3.2
Where:
A = mass of oven dried sample (g)
B = mass of saturated- surface- dry sample in air (g)
C = mass of saturated sample submerged in water (g)
The fine aggregate specific gravity and absorption capacity were measured as follows
(ASTM C 128 2012):
1. The fine aggregate was soaked in water for 24 ± 4 hours.
23
2. Excess water was drained and the fine aggregate was emptied on a nonabsorbent
surface.
3. The fine aggregate was allowed to dry naturally and was continuously mixed to avoid
unequal drying. Drying was complete when the fine aggregate reached saturated
surface dry conditions. Saturated surface dry conditions were determined by the cone
test:
a. The cone was filled with fine aggregate.
b. The fine aggregate in the cone was lightly tamped 25 times by dropping the
tamper approximately 5 mm. This was done to consolidate the fine aggregate.
c. The cone was removed.
d. If the fine aggregate took the shape of the cone then drying was continued.
The cone test was repeated until the fine aggregate started to slump as the
cone was removed.
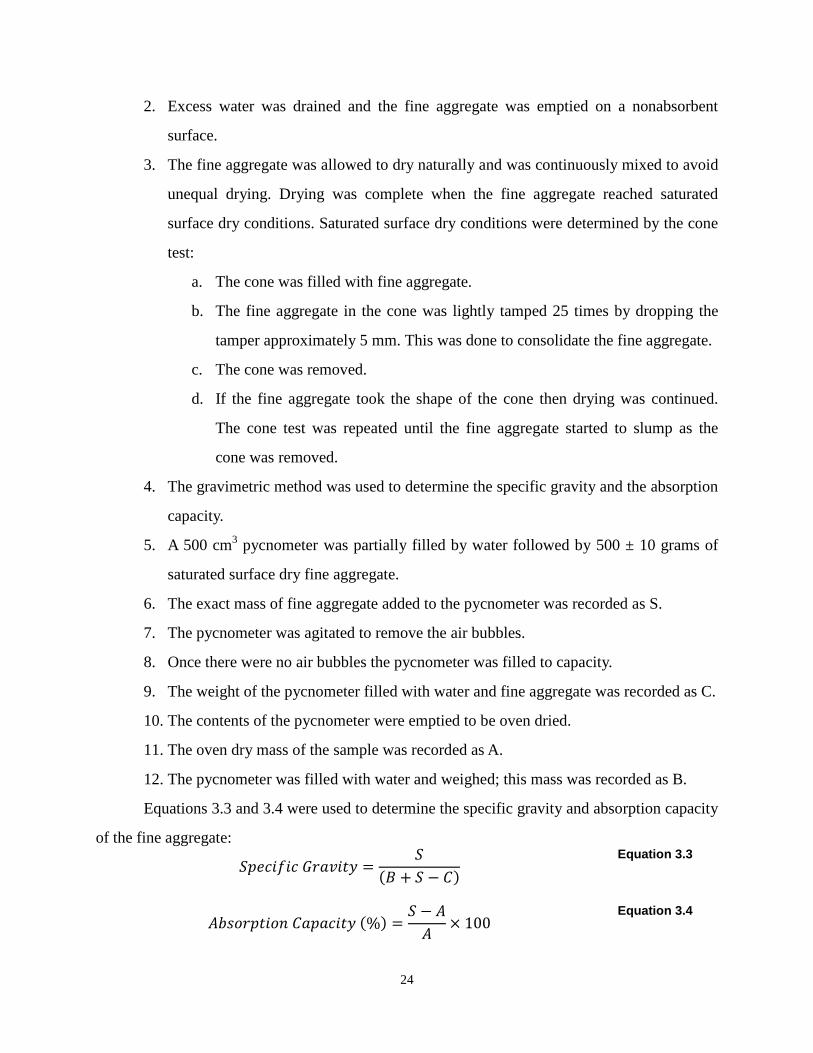
4. The gravimetric method was used to determine the specific gravity and the absorption
capacity.
5. A 500 cm3 pycnometer was partially filled by water followed by 500 ± 10 grams of
saturated surface dry fine aggregate.
6. The exact mass of fine aggregate added to the pycnometer was recorded as S.
7. The pycnometer was agitated to remove the air bubbles.
8. Once there were no air bubbles the pycnometer was filled to capacity.
9. The weight of the pycnometer filled with water and fine aggregate was recorded as C.
10. The contents of the pycnometer were emptied to be oven dried.
11. The oven dry mass of the sample was recorded as A.
12. The pycnometer was filled with water and weighed; this mass was recorded as B.
Equations 3.3 and 3.4 were used to determine the specific gravity and absorption capacity
of the fine aggregate:
𝑆𝑆𝑝𝑒𝑐𝑖𝑓𝑖𝑐 𝐺𝑟𝑎𝑎𝑣𝑖𝑡𝑦 =𝑆𝑆
(𝐵 + 𝑆𝑆 − 𝐶) Equation 3.3
𝐴𝑏𝑠𝑜𝑟𝑝𝑡𝑖𝑜𝑎𝑎 𝐶𝑎𝑎𝑝𝑎𝑎𝑐𝑖𝑡𝑦 (%) =𝑆𝑆 − 𝐴𝐴
× 100 Equation 3.4
24
Where:
A = mass of the oven dried sample.
B = mass of the pycnometer filled with water.
C = mass of the pycnometer filled with water and the sample.
S = mass of the saturated surface dried sample added to the pycnometer.
3.2 Batching Procedures
Concrete batching was done in general accordance with ASTM C 192/ C 192M (ASTM
C 192 2006). The following procedures were used:
1. The coarse and fine aggregate were stored at room temperature overnight to
ensure consistent temperature.
2. The coarse aggregate moisture content was measured.
3. The required weight of the coarse aggregate and mix water were adjusted to
account for the coarse aggregate moisture content.
4. The air entraining admixture was added to the mix water.
5. The base of the mixing pan was wiped with a damp towel.
6. The coarse aggregate was added to the mixer shown in Figure 3.1.
7. The mixer was started and the fine aggregate, cement/SCM, and water were
added.
8. The mixer was run for three minutes after the concrete materials were added.
9. The mixer was stopped and allowed at rest for three minutes. The mixer was
covered during the rest stage.
10. The mixer was finally uncovered, and the concrete was mixed for two
additional minutes.
25

FIGURE 3.1 Concrete Mixer Used in This Study
3.3 Slump and Air Content Procedures
The concrete slump was measured according to ASTM C 143 (2010). Concrete used for
the freeze-thaw test KTMR-22 is required to have a slump between 1.5 and 2.5 inches. An
example of this is shown in Figure 3.2. The concrete air content was measured using the pressure
method according to ASTM C 231 (2010). If the air content was not between 5 and 7 percent, the
air entraining dosage was adjusted and the mixture remade. Figure 3.3 shows the air content
being measured.
26

FIGURE 3.2 Concrete Slump Test
FIGURE 3.3 Concrete Air Pressure Meter Used in Testing
27
3.4 Specimen Preparation 3.4.1 Specimen Fabrication
The research team visited the KDOT materials and research facility to observe concrete
mixture proportioning, specimen preparation, and testing procedures to ensure that procedures
used mirrored those use by KDOT.
4 x 8 inch concrete cylinders were made for testing the concrete’s resistance to fluid
movement through the concrete. The cylinders were filled using the rodding procedure described
in ASTM C 192/ C 192M (ASTM C 192 2006). Concrete was placed in the cylinder in 2 lifts.
Each lift was rodded 25 times followed by tapping 10–15 times with an open palm for each lift. 4
x 3 x 16 inch concrete prisms were made for freeze-thaw testing. Pins were embedded in the
prism ends to facilitate prism length change measurements. The molds were completely filled
with concrete and consolidated. The concrete prisms were finished with a wooden trowel.
3.4.2 Curing Process
For tasks I and III of this study, the concrete freeze-thaw specimens were cured using the
standard KTMR-22 procedure. The standard KTMR-22 procedure calls for concrete to be placed
in a moist room for 67 days followed by 21 days in a chamber at 50% relative humidity at 73°F.
The beams were then placed in a water bath at approximately 70°F for 24 hours. The prisms
were then cured in a water bath at 40°F. In this procedure, the concrete beams are cured for the
extended period in the moist room to allow the paste to harden sufficiently. This is meant to
ensure that the concrete did not incur damage during freezing and thawing cycles because of a
weak paste system and only because of the aggregates. The drying period is intended to better
simulate field concrete conditions where the concrete is typically allowed to dry naturally before
water reabsorption during a precipitation event, although concrete pavement moisture level
measurements in-situ are needed to verify if this intention matches pavement moisture conditions
in Kansas. The concrete is finally soaked in water to resaturate the concrete and bring the
concrete to the thaw temperature used to eliminate thermal effects on the length change
measurements.
28
Different curing procedures were used in task II to test the effects of curing on the freeze-
thaw resistance of concrete containing porous limestone aggregates. After batching the concrete
all of the specimens were placed in the 100% moisture room. It was hypothesized that the paste
hydration could be accelerated to have similar strength as to that for concrete cured using the
standard KTMR-22 method. Curing procedures 1 to 3 used heat curing to accelerate the curing
process. For these procedures, the concrete specimens remained in the moist room for 7 days.
Concrete specimens for these three procedures were then transferred to a lime water bath at
100°F. Concrete cured using procedure 1 remained in the lime water bath for 7 days, using
curing condition 2 for 14 days, and curing condition 3 for 21 days. Following the lime bath
curing, these specimens were placed in a 40°F water bath for 24 hours prior to being placed in
the freeze thaw machine for testing. Concrete specimens cured using method 4 remained in the
moist room for 28 days prior to being placed in the 40°F water bath for 24 hours. This procedure
without any drying period was performed and compared to the standard KTMR-22 curing
method to determine if the extended moist curing and drying process affected the durability.
Concrete cured according to method 5 was cured using the standard KTMR-22 curing process
for comparison.
3.5 Laboratory Testing
Freezing and thawing cycles were performed according to ASTM C 666/C 666M
procedure B (2008). Concrete specimens made as part of task three were tested using the water
absorption test ASTM C 1585 (2013), rapid chloride permeability test ASTM C 1202 (2012), and
the volume of permeable voids test ASTM C 642 (2013). These test methods are indicators of the
concrete’s ability to resist water ingress which is required to saturate the concrete and cause
damage to the concrete during freezing and thawing cycles. All of these test methods use 2 inch
thick concrete disks cut from 4 x 8 inch concrete cylinders.
3.5.1 Concrete Rapid Freezing and Thawing Testing
The 4 x 3 x 16 inch concrete prisms were subjected to cycles of freezing and thawing.
Concrete prisms tested in task I and II were tested using 300 freeze-thaw cycles, while prisms
29
tested in task III were tested for 600 cycles. Six hundred cycles were chosen for testing while it
was still being considered to increase the number of cycles used in KTMR-22. Freeze-thaw
testing was performed according to ASTM C 666 Procedure B using a computer controlled
automatic temperature cycling chamber. Under this procedure, the concrete prisms were frozen
while they are completely surrounded by air. After the specimens reach 0°F, water was
introduced into the chamber to heat the specimens during the thawing cycle. One freeze thaw
cycle consists of the chamber lowering the temperature from 40 to 0 ºF and then increasing the
temperature from 0 to 40 ºF. At least 20% of the cycle time must be spent for thawing. At the
end of the freeze-thaw segments the temperature at the center of the beams must be within 3 ºF
of the 0 and 40 ºF respective freeze and thaw baselines (ASTM C 666 2008). The center
temperature of the beams was monitored by the use of two dummy concrete beams with
thermocouples embedded in the center of the beam. Specimen location in the freezer was rotated
in order to prevent possible sample bias from location in the freezer.
The prisms were placed in the freeze thaw chamber following the curing period. They
were measured for deterioration at least every 36 cycles until completion of the required 300 or
600 cycles. Figure 3.4 and 3.5 show the freeze thaw machine and inside its chamber. To quantify
the concrete degradation, the concrete mass, length change, and fundamental transverse
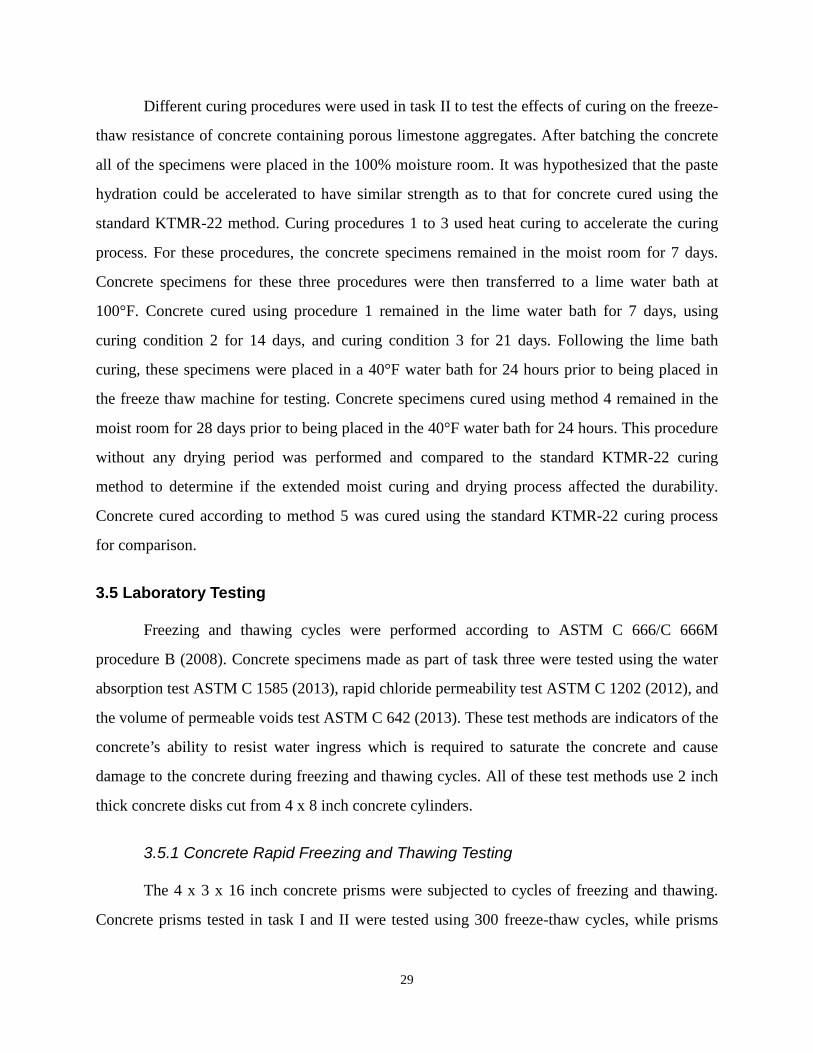
frequency were measured. The fundamental transverse frequency reading was measured using
the impact resonance method as shown in Figure 3.6. The prisms absorb water and absorbed
water will freeze during the freezing segment of cycles. Freezing of water causes significant
expansion in concrete prisms which leads to cracking. Water absorption and expansion are the
reason for mass change and length change in concrete prism. As micro-cracks grow in the
concrete prisms during expansion the transverse frequency will also decrease. The foam pad used
in the study to place the concrete prisms on during testing was chosen to match that used by
KDOT. The foam was approximately 50 mm thick as called out by KT-MR-22. Prisms were
marked 25 mm from each end as shown in Figure 3.6. A circle was marked on the end that the
accelerometer was placed and the x on the other side struck by the impactor. When the impactor
struck the concrete a wave was sent through the concrete prism that was read by the
accelerometer. The durability factor was calculated using Equation 3.5 and 3.6:
30

𝑃𝑃𝑐𝑐 = (𝑎𝑎12
𝑎𝑎2) × 100
Equation 3.5
Where:
𝑃𝑃𝑐𝑐 = relative dynamic modulus of elasticity, after c cycles of freezing and thawing,
(%)
𝑎𝑎 = fundamental transverse frequency at 0 cycles
𝑎𝑎1 = fundamental transverse frequency after c cycles
𝐷𝐷𝐷𝐷 =𝑃𝑃𝑁𝑁𝑀𝑀
Equation 3.6
Where:
𝐷𝐷𝐷𝐷 = durability factor
𝑃𝑃 = relative dynamic modulus of elasticity, at N cycles, (%)
𝑁𝑁 = number of cycles for which the test is discontinued or number of cycles that the
test is to be terminated, whichever is less
𝑀𝑀 = number of cycles that the test is to be terminated
The concrete prism length change was calculated using Equation 3.7:
𝐿𝐿𝑐𝑐 =(𝑙𝑙2 − 𝑙𝑙1)
𝐿𝐿𝑔𝑔× 100
Equation 3.7
Where:
𝐿𝐿𝑐𝑐 = length change after c cycles of freezing and thawing, (%)
𝑙𝑙1 = length reading at 0 cycles
𝑙𝑙2 = length reading after c cycles
𝐿𝐿𝑔𝑔 = effective gage length
31

FIGURE 3.4 20 Block Concrete Freeze Thaw Machine Used
32

FIGURE 3.5 Interior of Concrete Freeze Thaw Chamber
33
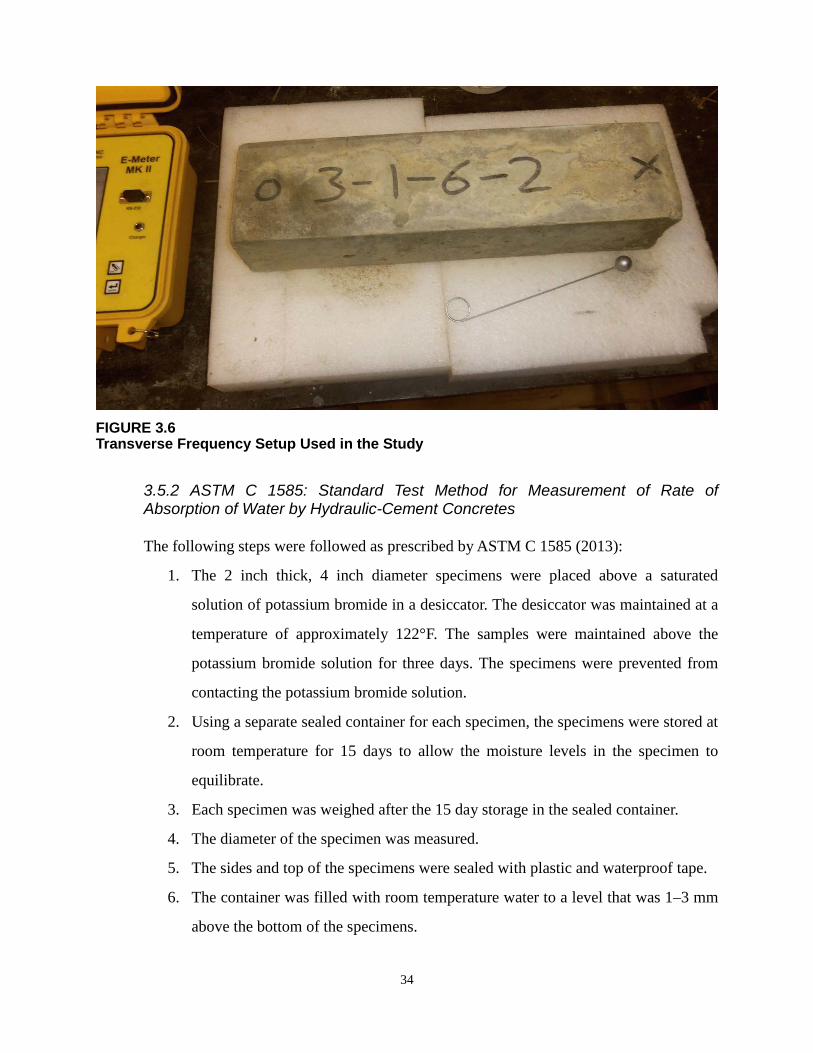
FIGURE 3.6 Transverse Frequency Setup Used in the Study
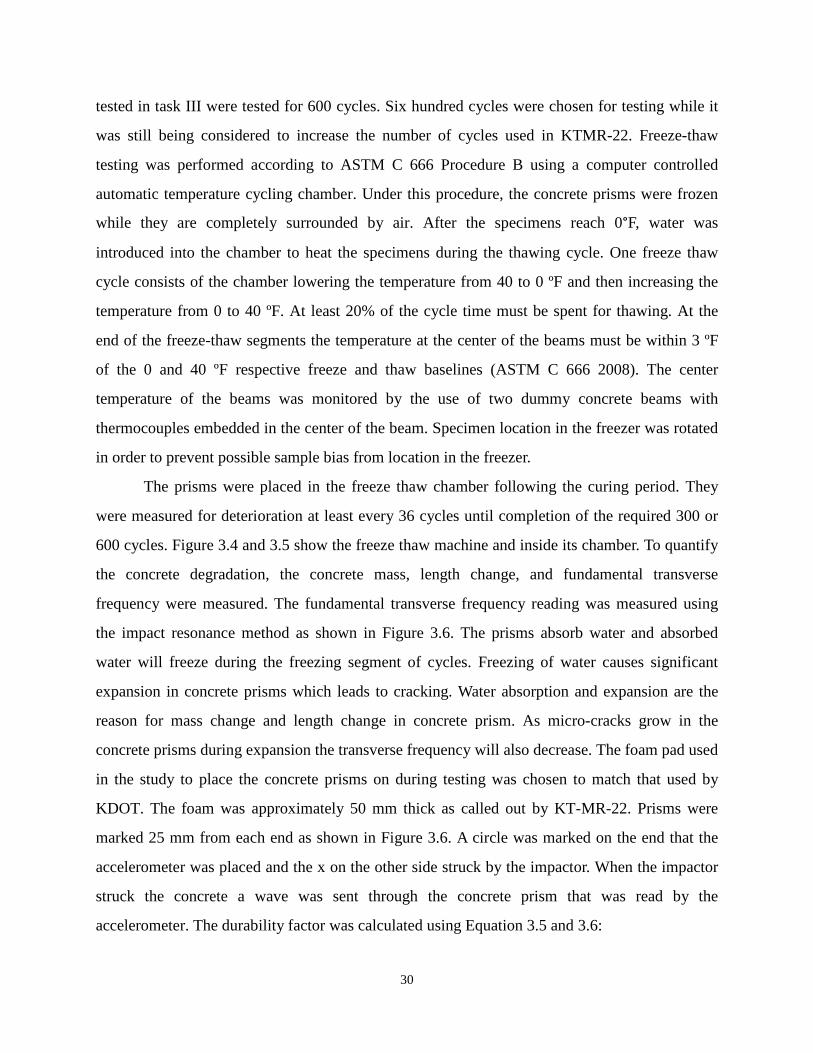
3.5.2 ASTM C 1585: Standard Test Method for Measurement of Rate of Absorption of Water by Hydraulic-Cement Concretes
The following steps were followed as prescribed by ASTM C 1585 (2013):
1. The 2 inch thick, 4 inch diameter specimens were placed above a saturated
solution of potassium bromide in a desiccator. The desiccator was maintained at a
temperature of approximately 122°F. The samples were maintained above the
potassium bromide solution for three days. The specimens were prevented from
contacting the potassium bromide solution.
2. Using a separate sealed container for each specimen, the specimens were stored at
room temperature for 15 days to allow the moisture levels in the specimen to
equilibrate.
3. Each specimen was weighed after the 15 day storage in the sealed container.
4. The diameter of the specimen was measured.
5. The sides and top of the specimens were sealed with plastic and waterproof tape.
6. The container was filled with room temperature water to a level that was 1–3 mm
above the bottom of the specimens.
34

7. The mass of the sealed specimens was recorded at the following times:
a. Initial weight
b. 60 ± 2 seconds
c. 5 minutes ± 10 seconds
d. 10 ± 2 minutes
e. 20 ± 2 minutes
f. 30 ± 2 minutes
g. 60 ± 2 minutes
h. Every hour up to 6 hours ± 5 minutes
i. Once a day for 8 days ± 2 hours
8. The initial absorption was calculated as the slope of a best fit line to the
absorption data between 1 min and 6 hours. The secondary rate of absorption was
calculated as the slope of a best fit line to the absorption data between 1 and 7
days.
3.5.3 ASTM C 1202: Standard Test Method for Electrical Indication of Concrete’s Ability to Resist Chloride Ion Penetration
The concrete rapid chloride permeability was tested according to ASTM C 1202 (2012).
The concrete electrical conductivity is dependent on the pore structure of the concrete. Electricity
is conducted in concrete primarily through the pore solution. Larger, more connected and more
numerous pores means more interconnected pore solution and a higher electrical charge that will
be conducted in the test. Concrete pore structure can be affected by multiple factors including:
the mix design, the degree of hydration, curing conditions, the use of SCMs, and construction
practices (Joshi and Chan 2002). The following procedure was used to measure the charge
passed through concrete according to ASTM C 1202 (2012):
1. Specimens were placed in a vacuum below 50 mm Hg. The vacuum was maintained for 3
hours.
2. The vacuum dessicator was filled with water that was boiled and allowed to cool to room
temperature. The vacuum of the water/specimen filled container was maintained at a
pressure below 50 mm Hg for 1 hour.
35
3. The vacuum was released, after which the specimens were left in the water-filled
container for 18 ± 2 additional hours.
4. The specimens were sealed in the voltage cell using rubber gaskets and pvc pipe as
shown in Figure 3.7.
5. 3.0 % NaCl solution was added to one cell while a 0.3 N NaOH solution was added to the
other cell.
6. The wires were attached to the terminals. The NaOH was connected to the positive power
supply and the NaCl was connected to the negative power supply.
7. The current was read initially when the power supply was turned on, and reading
continued every 30 minutes for the duration of 6 hours.
Equation 3.8 was used to determine the charge passed through the concrete:
𝑄 = 900(𝐼0 + 2𝐼30 + 2𝐼60+. . . . 2𝐼300 + 2𝐼330 + 𝐼360) Equation 3.8
Where:
Q = charge passed (coulombs)
Io = current immediately after voltage is applied (amperes)
It = current at t min after voltage is applied (amperes)
36

FIGURE 3.7 Rapid Chloride Permeability Test Setup
The chloride ion penetrability of the concrete can be classified based on the charge
passed according to Table 3.1.
TABLE 3.1
Charge Classification Table (ASTM C 1202 2012) Charge Passed (Coulombs) Chloride Ion Penetrability
>4,000 High 2,000-4,000 Moderate 1,000-2,000 Low 100-1,000 Very Low
<100 Negligible
37
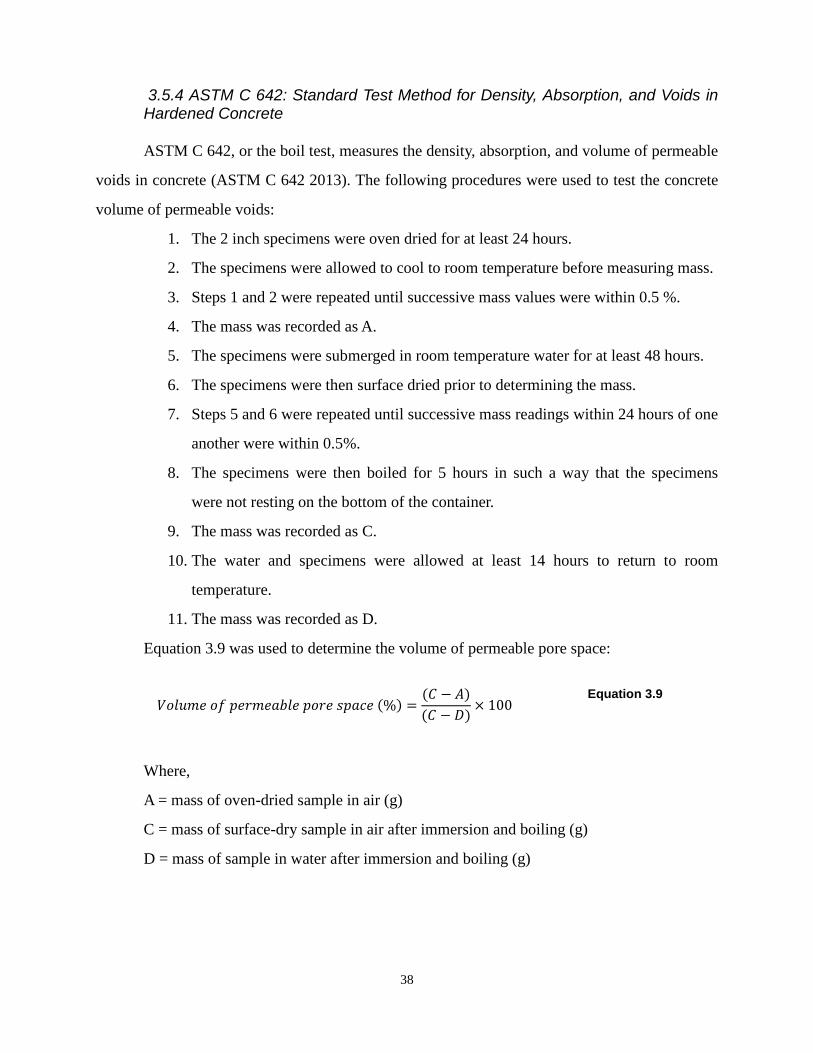
3.5.4 ASTM C 642: Standard Test Method for Density, Absorption, and Voids in Hardened Concrete
ASTM C 642, or the boil test, measures the density, absorption, and volume of permeable
voids in concrete (ASTM C 642 2013). The following procedures were used to test the concrete
volume of permeable voids:
1. The 2 inch specimens were oven dried for at least 24 hours.
2. The specimens were allowed to cool to room temperature before measuring mass.
3. Steps 1 and 2 were repeated until successive mass values were within 0.5 %.
4. The mass was recorded as A.
5. The specimens were submerged in room temperature water for at least 48 hours.
6. The specimens were then surface dried prior to determining the mass.
7. Steps 5 and 6 were repeated until successive mass readings within 24 hours of one
another were within 0.5%.
8. The specimens were then boiled for 5 hours in such a way that the specimens
were not resting on the bottom of the container.
9. The mass was recorded as C.
10. The water and specimens were allowed at least 14 hours to return to room
temperature.
11. The mass was recorded as D.
Equation 3.9 was used to determine the volume of permeable pore space:
𝑉𝑉𝑜𝑙𝑙𝑢𝑚𝑒 𝑜𝑓 𝑝𝑒𝑟𝑚𝑒𝑎𝑎𝑏𝑙𝑙𝑒 𝑝𝑜𝑟𝑒 𝑠𝑝𝑎𝑎𝑐𝑒 (%) =(𝐶 − 𝐴)(𝐶 − 𝐷𝐷)
× 100 Equation 3.9
Where,
A = mass of oven-dried sample in air (g)
C = mass of surface-dry sample in air after immersion and boiling (g)
D = mass of sample in water after immersion and boiling (g)
38

Chapter 4: Materials
4.1 Coarse Aggregate
Concrete used in task 1 contained aggregate used in concrete for construction of the K-18
Ogden to Manhattan Improvement Project. Concrete samples were made on-site with fresh
concrete during construction.
Four different limestone coarse aggregates were used for task II and III of this project.
The aggregates are labeled for organizational purposes as A, B, C and D. Aggregates A, B, and C
were used in task II, whereas aggregates A, C, and D were used in task III. Aggregate A was
collected from the Moline Quarry, aggregates B and C were collected from different beds from
the Ottawa Quarry, and aggregate D was collected from a concrete batch plant in Topeka. These
aggregates were selected by KDOT using past test results and field experience as a guideline.
Aggregate A passed both KDOT’s laboratory testing. Additionally, aggregates from that quarry
had a good field history. Both aggregate C and D have shown failures in previous lab testing,
whereas aggregate B was considered to be a marginal aggregate.
The gradation of the coarse aggregate used was specified by the KT-MR-22 test. Fifty
percent of the coarse aggregates used were retained on the 3/8 inch sieve and passing the ½ inch
sieve. The remaining coarse aggregates used were retained on the ½ inch sieve and passing the ¾
inch sieve. The coarse aggregates were sieved to achieve proper gradation prior to mixing the
concrete. The coarse aggregate specific gravity and absorption capacity testing are shown in
Table 4.1.
TABLE 4.1 Specific Gravity and Absorption Capacities of
the Coarse Aggregates
A B C D
Specific Gravity 2.76 2.60 2.61 2.61 Absorption Capacity % 2.58 2.72 3.00 3.32
39

4.2 Fine Aggregate
The fine aggregate used was Kaw River sand as specified by the KT-MR-22 test. The
specific gravity and absorption capacity of the fine aggregate were determined following ASTM
C 128 (2012). Results from this test are shown in Table 4.2.
TABLE 4.2
Specific Gravity and Absorption Capacity of the Fine Aggregate
Fine Aggregate
Specific Gravity 2.5 Absorption Capacity 0.65
4.3 Cement
The task I beams were cast with concrete sampled from the K-18 Ogden to Manhattan
Improvement Project. All of the remaining concrete used in this project was made with a Type
I/II cement produced by Monarch Cement. The cement was chosen as specified by the KT-MR-
22 test which requires the cement to meet Type II classification and be produced by Monarch
Cement. The composition of the cement used is given in Table 4.3.
TABLE 4.3
Cement Composition
Content
SiO2 (%) 21.9 Al2O3 (%) 4.3 Fe2O3 (%) 3.4 CaO (%) 63.7 MgO (%) 2.0 Na2O (%) 0.2 K2O (%) 0.5 Na2Oeq (%) 0.5 SO3 (%) 2.6 LOI (%) 0.5 Free CaO (%) 0.9 C3S (%) 51.7 C2S (%) 23.8 C3A (%) 5.5 C4AF (%) 10.4
40
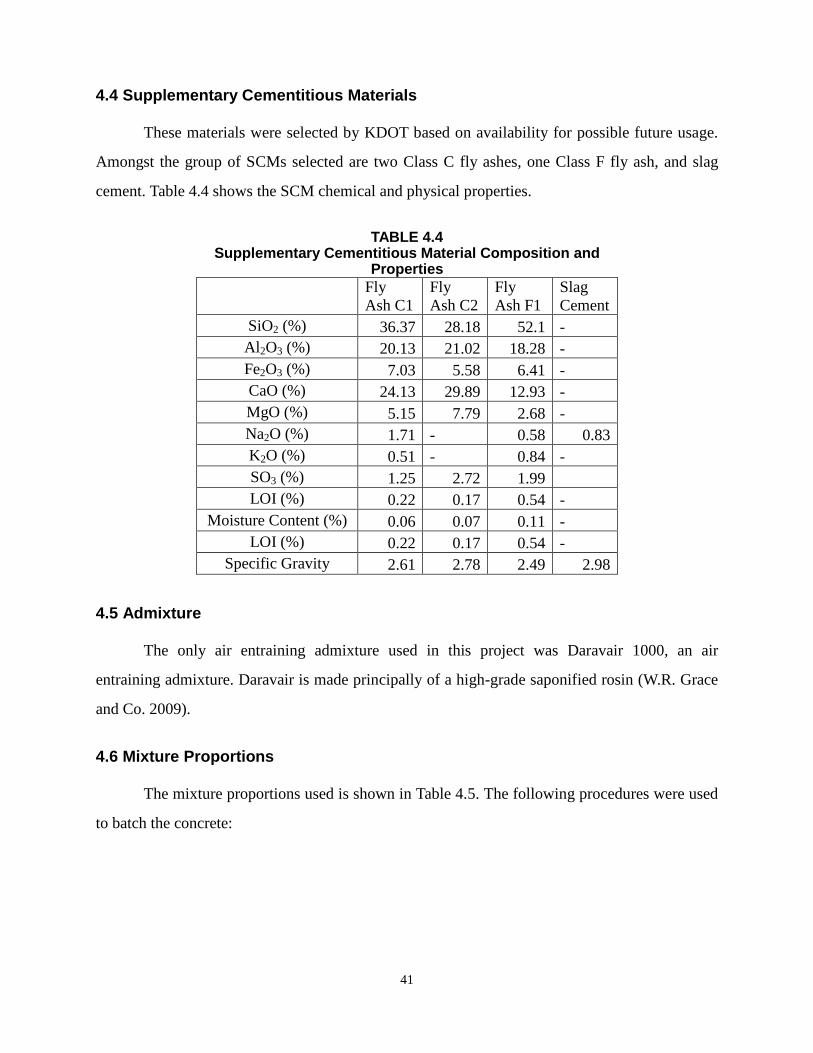
4.4 Supplementary Cementitious Materials
These materials were selected by KDOT based on availability for possible future usage.
Amongst the group of SCMs selected are two Class C fly ashes, one Class F fly ash, and slag
cement. Table 4.4 shows the SCM chemical and physical properties.
TABLE 4.4
Supplementary Cementitious Material Composition and Properties
Fly Ash C1
Fly Ash C2
Fly Ash F1
Slag Cement
SiO2 (%) 36.37 28.18 52.1 - Al2O3 (%) 20.13 21.02 18.28 - Fe2O3 (%) 7.03 5.58 6.41 - CaO (%) 24.13 29.89 12.93 - MgO (%) 5.15 7.79 2.68 - Na2O (%) 1.71 - 0.58 0.83 K2O (%) 0.51 - 0.84 - SO3 (%) 1.25 2.72 1.99
LOI (%) 0.22 0.17 0.54 - Moisture Content (%) 0.06 0.07 0.11 -
LOI (%) 0.22 0.17 0.54 - Specific Gravity 2.61 2.78 2.49 2.98
4.5 Admixture
The only air entraining admixture used in this project was Daravair 1000, an air
entraining admixture. Daravair is made principally of a high-grade saponified rosin (W.R. Grace
and Co. 2009).
4.6 Mixture Proportions
The mixture proportions used is shown in Table 4.5. The following procedures were used
to batch the concrete:
41
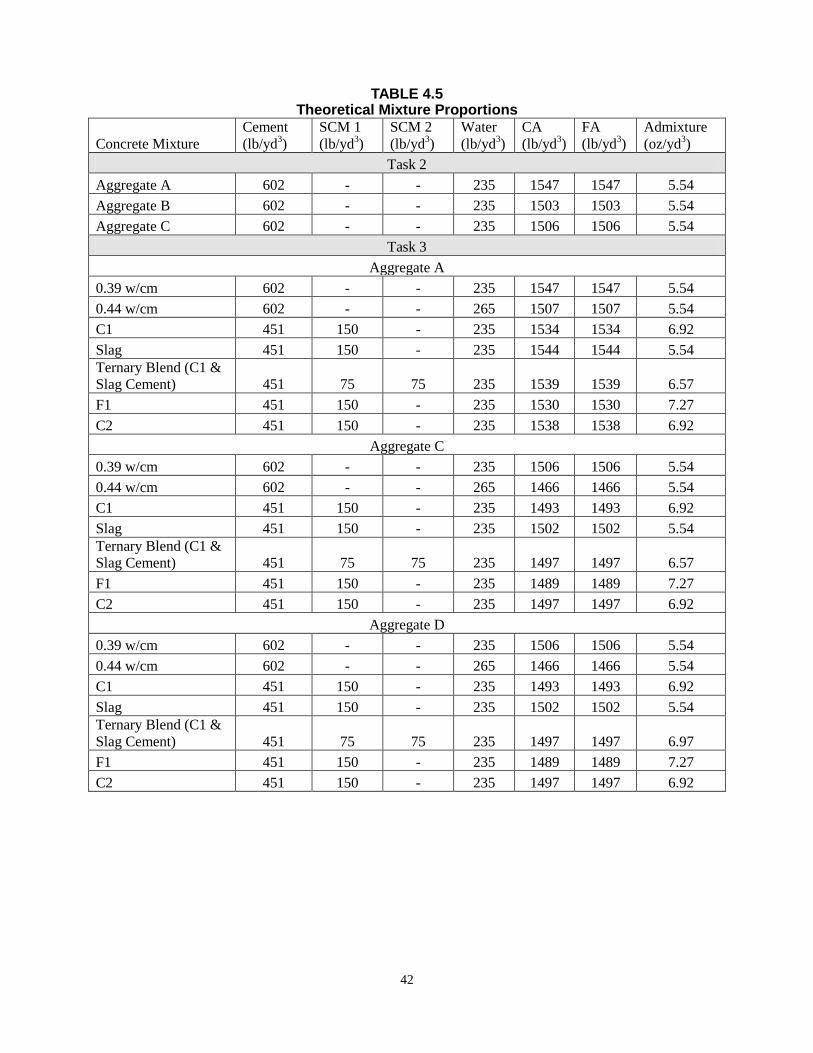
TABLE 4.5 Theoretical Mixture Proportions
Concrete Mixture Cement (lb/yd3)
SCM 1 (lb/yd3)
SCM 2 (lb/yd3)
Water (lb/yd3)
CA (lb/yd3)
FA (lb/yd3)
Admixture (oz/yd3)
Task 2 Aggregate A 602 - - 235 1547 1547 5.54 Aggregate B 602 - - 235 1503 1503 5.54 Aggregate C 602 - - 235 1506 1506 5.54
Task 3 Aggregate A
0.39 w/cm 602 - - 235 1547 1547 5.54 0.44 w/cm 602 - - 265 1507 1507 5.54 C1 451 150 - 235 1534 1534 6.92 Slag 451 150 - 235 1544 1544 5.54 Ternary Blend (C1 & Slag Cement) 451 75 75 235 1539 1539 6.57 F1 451 150 - 235 1530 1530 7.27 C2 451 150 - 235 1538 1538 6.92
Aggregate C 0.39 w/cm 602 - - 235 1506 1506 5.54 0.44 w/cm 602 - - 265 1466 1466 5.54 C1 451 150 - 235 1493 1493 6.92 Slag 451 150 - 235 1502 1502 5.54 Ternary Blend (C1 & Slag Cement) 451 75 75 235 1497 1497 6.57 F1 451 150 - 235 1489 1489 7.27 C2 451 150 - 235 1497 1497 6.92
Aggregate D 0.39 w/cm 602 - - 235 1506 1506 5.54 0.44 w/cm 602 - - 265 1466 1466 5.54 C1 451 150 - 235 1493 1493 6.92 Slag 451 150 - 235 1502 1502 5.54 Ternary Blend (C1 & Slag Cement) 451 75 75 235 1497 1497 6.97 F1 451 150 - 235 1489 1489 7.27 C2 451 150 - 235 1497 1497 6.92
42
Chapter 5: Results
5.1 Task 1
The aggregates tested from concrete specimens made from concrete containing the
aggregate used on the K-18 Ogden to Manhattan Improvement Project showed no damage during
the freeze thaw testing. The concrete tested by KSU and KDOT showed very similar relative
modulus during testing for these beams as shown in Figure 5.1. Figure 5.2 shows the relative
modulus of the beams that were cast by KDOT and sent to KSU using an aggregate of poor
quality. There was a difference in the rate of deterioration of concrete beams tested between
KDOT and KSU tested beams. ASTM C 666 (2008) contains the following statement about
comparing freeze-thaw results from different laboratories: “No data are available for
mulitlaboratory precision. It is believed that a multilaboratory statement of precision is not
appropriate because of the limited possibility that two or more laboratories will be performing
freezing-and thawing tests on the same concretes.” ASTM C 666 states that the acceptable range
of concrete durability factors from tests conducted at the same laboratory with average values
between 50 and 70 is 32.9. At 312 cycles, the difference in average durability factors for tests
conducted at KSU and KDOT was 34.4, only slightly higher than that expected for tests
conducted at the same laboratory. Since multi-laboratory precision values are almost always
larger than single-labortory precision statements, the results found between the two laboratories
should not be considered unacceptable. To help confirm that the equipment being used was
functioning properly, KSU researchers traveled to KDOT to verify that the impact resonance
equipment being used by KSU gave similar results to that being used by KDOT. It was found
that the equipment being used by KSU gave nearly identical resonant frequencies as measured by
KDOT.
43

FIGURE 5.1 Relative Modulus During Freeze Thaw Testing for Concrete Specimens Made from Concrete Sampled from the K-18 Ogden to Manhattan Improvement Project
FIGURE 5.2 Task 1 Freeze Thaw Results for Beams Made by KDOT
98
99
100
101
102
103
0 100 200 300 400
Rela
tive
Mod
ulus
# Cycles
KSU
KDOT
0
20
40
60
80
100
0 100 200 300 400 500 600
Rela
tive
Mod
ulus
# Cycles
KSU Beam 1
KSU Beam 2
KSU Beam 3
KSU Average
KDOT Tested Beams
44
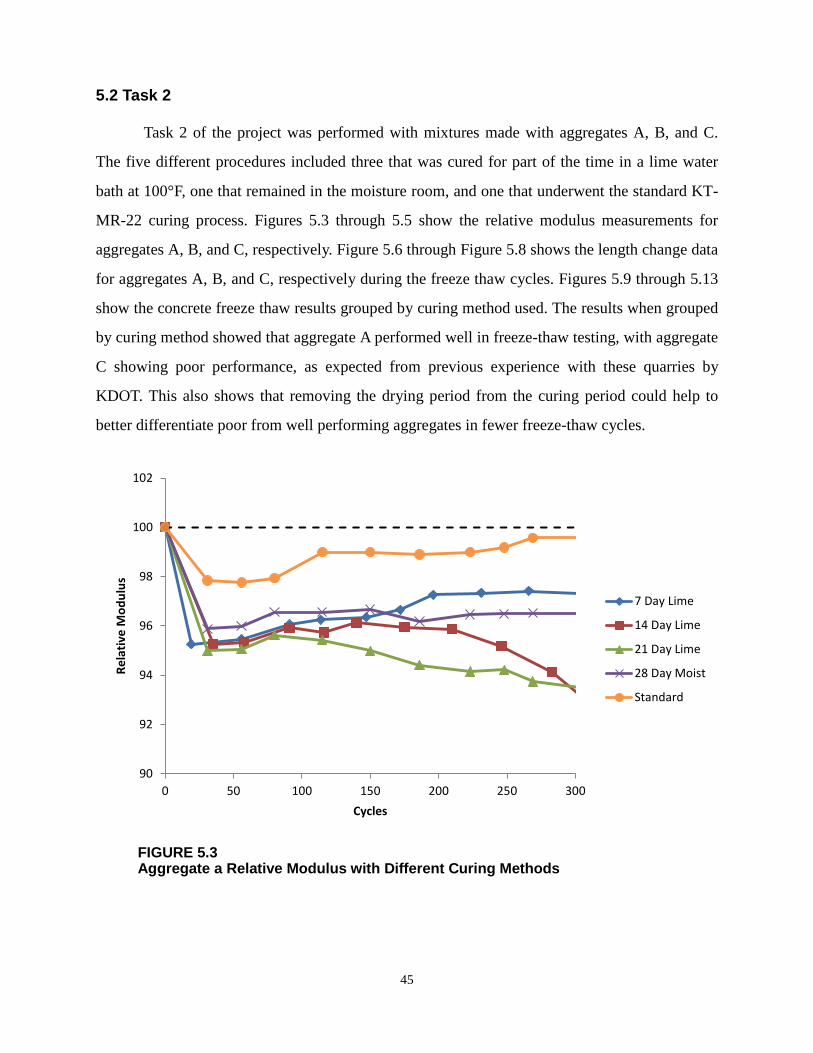
5.2 Task 2
Task 2 of the project was performed with mixtures made with aggregates A, B, and C.
The five different procedures included three that was cured for part of the time in a lime water
bath at 100°F, one that remained in the moisture room, and one that underwent the standard KT-
MR-22 curing process. Figures 5.3 through 5.5 show the relative modulus measurements for
aggregates A, B, and C, respectively. Figure 5.6 through Figure 5.8 shows the length change data
for aggregates A, B, and C, respectively during the freeze thaw cycles. Figures 5.9 through 5.13
show the concrete freeze thaw results grouped by curing method used. The results when grouped
by curing method showed that aggregate A performed well in freeze-thaw testing, with aggregate
C showing poor performance, as expected from previous experience with these quarries by
KDOT. This also shows that removing the drying period from the curing period could help to
better differentiate poor from well performing aggregates in fewer freeze-thaw cycles.
FIGURE 5.3 Aggregate a Relative Modulus with Different Curing Methods
90
92
94
96
98
100
102
0 50 100 150 200 250 300
Rela
tive
Mod
ulus
Cycles
7 Day Lime
14 Day Lime
21 Day Lime
28 Day Moist
Standard
45
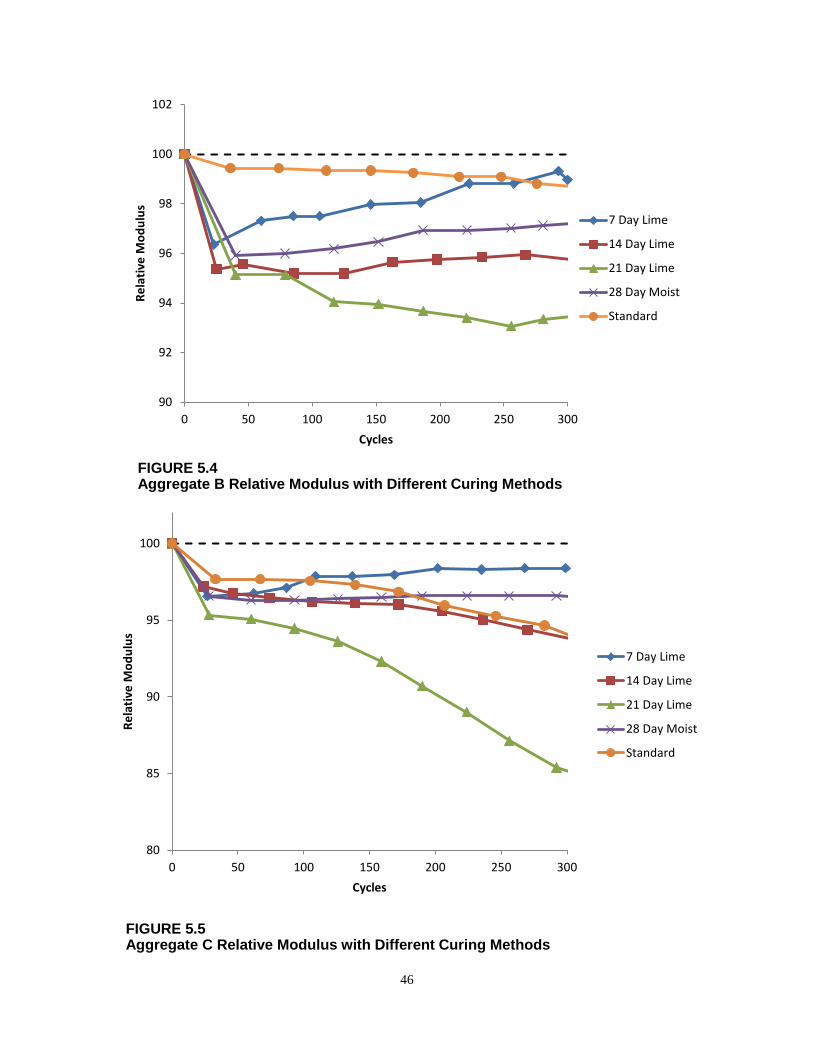
FIGURE 5.4 Aggregate B Relative Modulus with Different Curing Methods
FIGURE 5.5 Aggregate C Relative Modulus with Different Curing Methods
90
92
94
96
98
100
102
0 50 100 150 200 250 300
Rela
tive
Mod
ulus
Cycles
7 Day Lime
14 Day Lime
21 Day Lime
28 Day Moist
Standard
80
85
90
95
100
0 50 100 150 200 250 300
Rela
tive
Mod
ulus
Cycles
7 Day Lime
14 Day Lime
21 Day Lime
28 Day Moist
Standard
46

FIGURE 5.6 Aggregate A Length Change with Different Curing Methods
FIGURE 5.7 Aggregate B Length Change with Different Curing Methods
-0.02
0
0.02
0.04
0.06
0.08
0.1
0 50 100 150 200 250 300
Leng
th C
hang
e (%
)
Cycles
7 Day Lime
14 Day Lime
21 Day Lime
28 Day Moist
Standard
-0.02
0
0.02
0.04
0.06
0.08
0.1
0 50 100 150 200 250 300
Leng
th C
hang
e (%
)
Cycles
7 Day Lime
14 Day Lime
21 Day Lime
28 Day Moist
Standard
47

FIGURE 5.8 Aggregate C Length Change with Different Curing Methods
FIGURE 5.9 7 Day Lime Water Cured Relative Modulus with Different Aggregates
-0.02
0
0.02
0.04
0.06
0.08
0.1
0 50 100 150 200 250 300
Leng
th C
hang
e (%
)
Cycles
7 Day Lime
14 Day Lime
21 Day Lime
28 Day Moist
Standard
90
92
94
96
98
100
102
0 50 100 150 200 250 300
Rela
tive
Mod
ulus
Cycles
A
B
C
48

FIGURE 5.10 14 Day Lime Water Cured Relative Modulus with Different Aggregates
FIGURE 5.11 21 Day Lime Water Cured Relative Modulus with Different Aggregates
90
92
94
96
98
100
102
0 50 100 150 200 250 300
Rela
tive
Mod
ulus
Cycles
A
B
C
80
85
90
95
100
0 50 100 150 200 250 300
Rela
tive
Mod
ulus
Cycles
A
B
C
49

FIGURE 5.12 28 Day Moist Cured Relative Modulus with Different Aggregates
FIGURE 5.13 Standard Cured Relative Modulus with Different Aggregates
90
92
94
96
98
100
102
0 50 100 150 200 250 300
Rela
tive
Mod
ulus
Cycles
A
B
C
90
92
94
96
98
100
102
0 50 100 150 200 250 300
Leng
th C
hang
e (%
)
Cycles
A
B
C
50
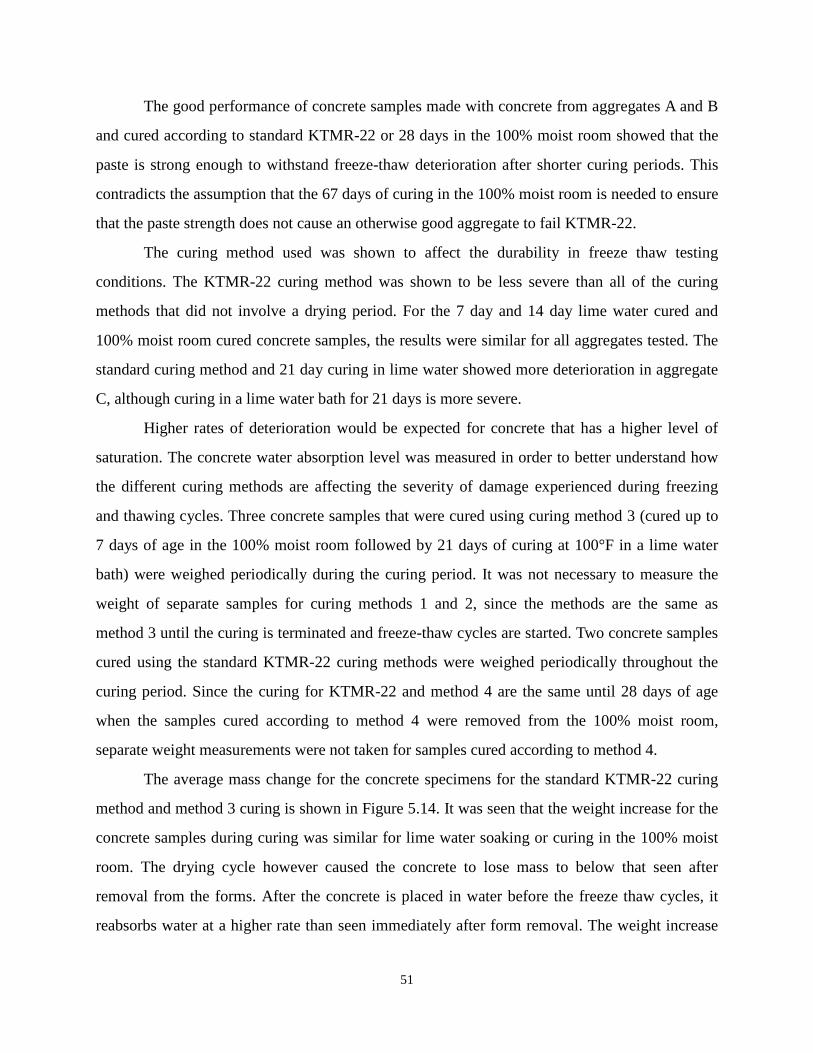
The good performance of concrete samples made with concrete from aggregates A and B
and cured according to standard KTMR-22 or 28 days in the 100% moist room showed that the
paste is strong enough to withstand freeze-thaw deterioration after shorter curing periods. This
contradicts the assumption that the 67 days of curing in the 100% moist room is needed to ensure
that the paste strength does not cause an otherwise good aggregate to fail KTMR-22.
The curing method used was shown to affect the durability in freeze thaw testing
conditions. The KTMR-22 curing method was shown to be less severe than all of the curing
methods that did not involve a drying period. For the 7 day and 14 day lime water cured and
100% moist room cured concrete samples, the results were similar for all aggregates tested. The
standard curing method and 21 day curing in lime water showed more deterioration in aggregate
C, although curing in a lime water bath for 21 days is more severe.
Higher rates of deterioration would be expected for concrete that has a higher level of
saturation. The concrete water absorption level was measured in order to better understand how
the different curing methods are affecting the severity of damage experienced during freezing
and thawing cycles. Three concrete samples that were cured using curing method 3 (cured up to
7 days of age in the 100% moist room followed by 21 days of curing at 100°F in a lime water
bath) were weighed periodically during the curing period. It was not necessary to measure the
weight of separate samples for curing methods 1 and 2, since the methods are the same as
method 3 until the curing is terminated and freeze-thaw cycles are started. Two concrete samples
cured using the standard KTMR-22 curing methods were weighed periodically throughout the
curing period. Since the curing for KTMR-22 and method 4 are the same until 28 days of age
when the samples cured according to method 4 were removed from the 100% moist room,
separate weight measurements were not taken for samples cured according to method 4.
The average mass change for the concrete specimens for the standard KTMR-22 curing
method and method 3 curing is shown in Figure 5.14. It was seen that the weight increase for the
concrete samples during curing was similar for lime water soaking or curing in the 100% moist
room. The drying cycle however caused the concrete to lose mass to below that seen after
removal from the forms. After the concrete is placed in water before the freeze thaw cycles, it
reabsorbs water at a higher rate than seen immediately after form removal. The weight increase
51
at the end of curing for method 1 (7 days in the 100% moist room, 7 days in the lime water bath)
would be the same as the weight increase for method 3 after 7 days in the 100% moist room and
7 days in the lime water bath. The weight increase at the end of curing for method 2 (7 days in
the 100% moist room, 14 days in the lime water bath) would be the same as the weight increase
for method 3 after 7 days in the 100% moist room and 14 days in the lime water bath. The
weight increase for concrete cured according to method 4 (28 days in the 100% moist room)
would be the same for concrete cured according to KTMR-22 after 28 days of curing.
Table 5.1 shows the weight gain at the end of the curing period for each of the 5 curing
methods. For the concrete cured in the lime water bath at 100°F, the longer the curing period and
higher degree of saturation resulted in higher amounts of damage. The samples cured at 100°F in
the lime water bath for 21 days showed a higher rate of deterioration than the samples cured at
28 days in the 100% moist room, even though their water absorbed should be similar. This may
be because the higher temperature changed the paste pore structure, reducing the concrete
resistance to freeze-thaw. The lower damage seen in the standard KTMR-22 testing can be
explained by the lower concrete degree of saturation seen in KTMR-22 compared to the other 4
curing methods used. This supports the theory that the drying period used during curing
according to KTMR-22 lengthens the number of freeze-thaw cycles needed to differentiate poor
from good performing aggregates by reducing the concrete degree of saturation at the beginning
of the test.
52

FIGURE 5.14 Change in Mass for Concrete Samples Exposed to Different Curing Methods
TABLE 5.1
Theoretical Mixture Proportions Curing Method
Curing Method Description Weight Gain at End of Curing
Period (%) 1 7 days 100% moist room, 7 days in 100°F lime water bath 0.81 2 7 days 100% moist room, 14 days in 100°F lime water bath 0.91 3 7 days 100% moist room, 21 days in 100°F lime water bath 1.0 4 28 days in 100% moist room 1.0
KTMR-22
67 days in 100% moist room, 21 days in 50% relative humidity chamber at 73°F
0.71
5.3 Task 3
Task 3 investigated the ability to increase the freeze-thaw durability of concrete
containing nondurable aggregates by varying the paste permeability. The experiments performed
changed the w/cm and SCMs used to vary the paste permeability. Three different aggregates
were used to make concrete specimens for this task: aggregate A, aggregate C, and aggregate D.
These mixtures used concrete with different w/cm and SCMs to see if reducing the water ingress
could reduce the deterioration rate of concrete. Testing for this task included freeze-thaw
-0.6%
-0.4%
-0.2%
0.0%
0.2%
0.4%
0.6%
0.8%
1.0%
1.2%
1.4%
0 20 40 60 80 100
Chan
ge in
Mas
s
Time from Mixing (Days)
Standard Curing
Lime Water Bath
53

durability, rate of absorption, chloride resistivity, and measuring the permeable pore space of the
concrete. Concrete curing used in this task was as specified by KTMR-22.
5.3.1 Concrete Rapid Freezing and Thawing Testing
The relative modulus results for the freeze-thaw testing conducted during Task 3 are
shown in Figure 5.15 through 5.17. Figures 5.18 through 5.20 show the percent length change
during the freeze-thaw cycles. The specimens made with aggregate A were only tested to 300
cycles as these tests were completed before the research team learned that the number of freeze-
thaw cycles specified by KTMR-22 might increase.
The relative modulus of elasticity shows that the beams for aggregates A and D
performed well with none of the mix designs testing below 90% of the initial modulus. The
mixtures containing aggregate A and the ternary blend mixture or fly ash C2 fell below the
KDOT durability factor threshold of 95. The cause of this is unknown, however it is possible that
some specimen or mixture variability was the cause. Aggregate C showed significantly more
deterioration than aggregates A and D. For aggregate C, three mixture designs that had a
durability factor at or below 70. These were the 0.39 w/cm mix, the 0.45 w/cm mix, and the mix
with C2 as the SCM. The C2 mix failed before the 600 cycles were up. It failed with a durability
factor of 56 after only 600 cycles. Both the 0.39 w/cm and 0.45 w/cm mixes survived the 600
cycles. At 600 cycles, the 0.39 w/cm mix had a durability factor of 43 and the 0.45 w/cm mix
had a durability factor of 70. All other mixes were in the low to mid 80s range with the exception
of the ternary blend mix, which had a durability factor of 91 after 600 cycles. Like the modulus
of elasticity testing results, both the aggregate A and D specimens performed well. Aggregate C
showed very large expansions near 1%, matching the damage seen in the relative modulus
measurements.
54

FIGURE 5.15 Aggregate A Relative Modulus
FIGURE 5.16 Aggregate C Relative Modulus
90
92
94
96
98
100
102
0 100 200 300 400 500 600 700
Rela
tive
Mod
ulus
Cycles
0.39 w/cm
0.44 w/cm
C1
Slag
Ternary Blend
F1
C2
40
50
60
70
80
90
100
0 200 400 600 800
Rela
tive
Mod
ulus
Number of Cycles
0.39 w/cm
0.44 w/cm
C1
Slag
Ternary Blend
F1
C2
55
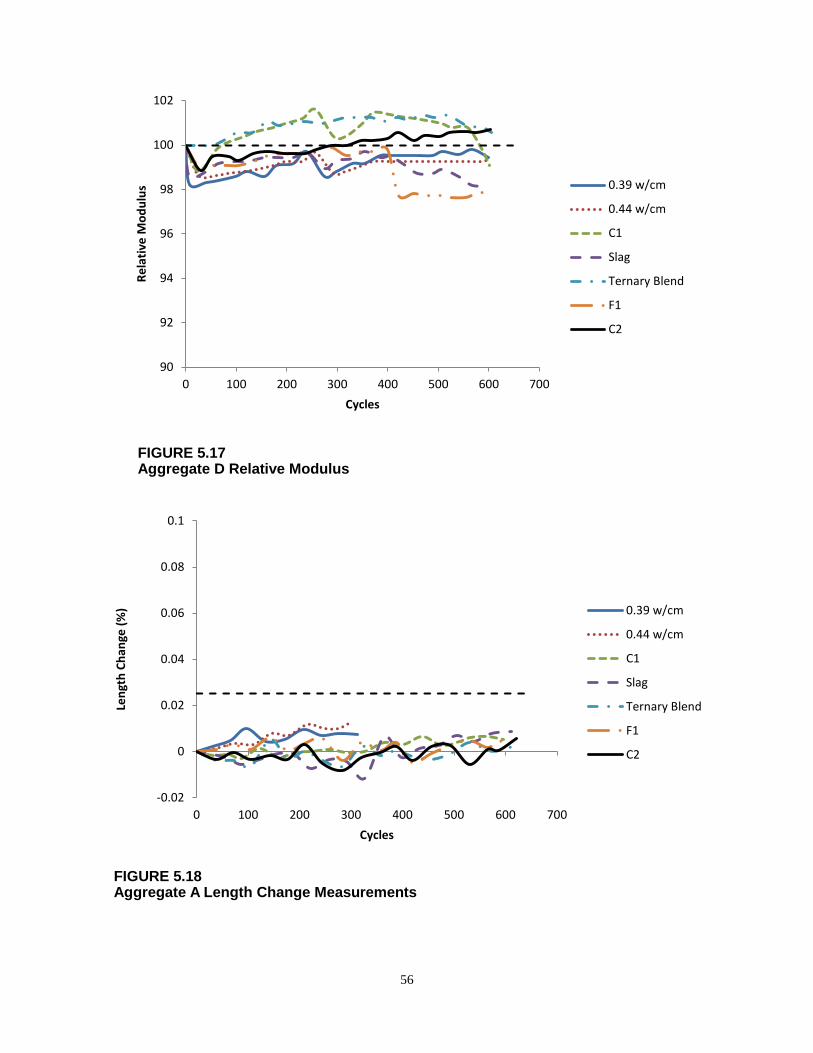
FIGURE 5.17 Aggregate D Relative Modulus
FIGURE 5.18 Aggregate A Length Change Measurements
90
92
94
96
98
100
102
0 100 200 300 400 500 600 700
Rela
tive
Mod
ulus
Cycles
0.39 w/cm
0.44 w/cm
C1
Slag
Ternary Blend
F1
C2
-0.02
0
0.02
0.04
0.06
0.08
0.1
0 100 200 300 400 500 600 700
Leng
th C
hang
e (%
)
Cycles
0.39 w/cm
0.44 w/cm
C1
Slag
Ternary Blend
F1
C2
56
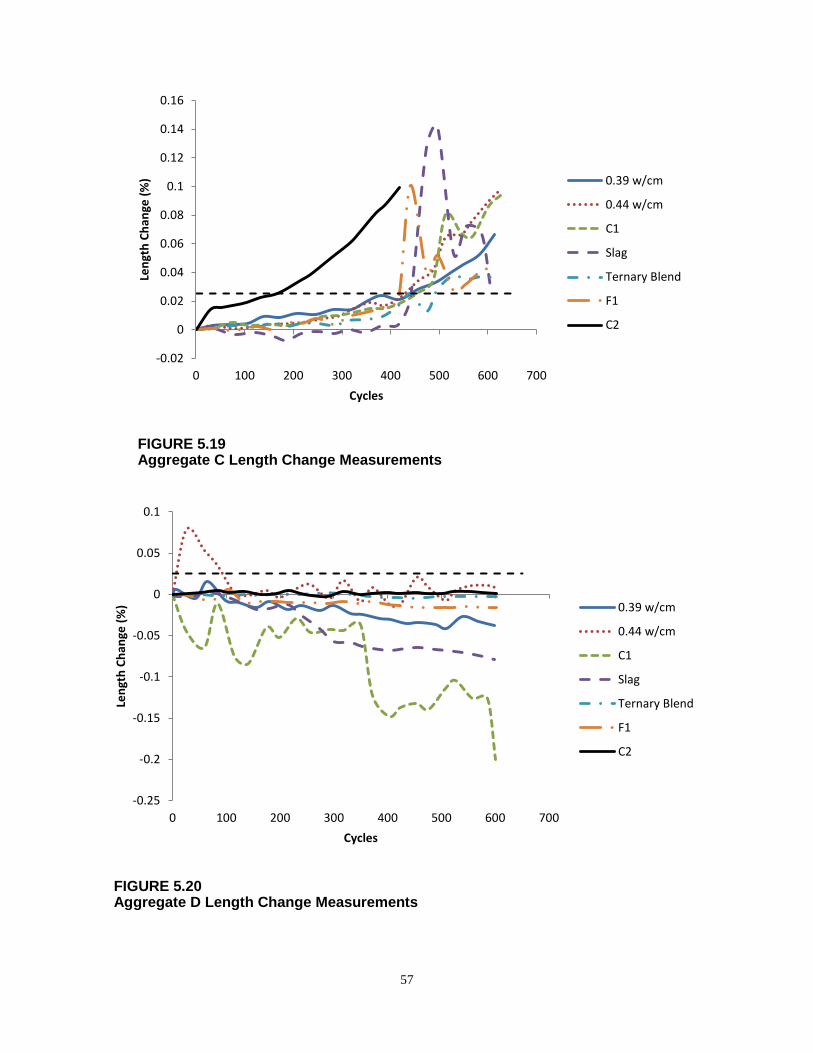
FIGURE 5.19 Aggregate C Length Change Measurements
FIGURE 5.20 Aggregate D Length Change Measurements
-0.02
0
0.02
0.04
0.06
0.08
0.1
0.12
0.14
0.16
0 100 200 300 400 500 600 700
Leng
th C
hang
e (%
)
Cycles
0.39 w/cm
0.44 w/cm
C1
Slag
Ternary Blend
F1
C2
-0.25
-0.2
-0.15
-0.1
-0.05
0
0.05
0.1
0 100 200 300 400 500 600 700
Leng
th C
hang
e (%
)
Cycles
0.39 w/cm
0.44 w/cm
C1
Slag
Ternary Blend
F1
C2
57
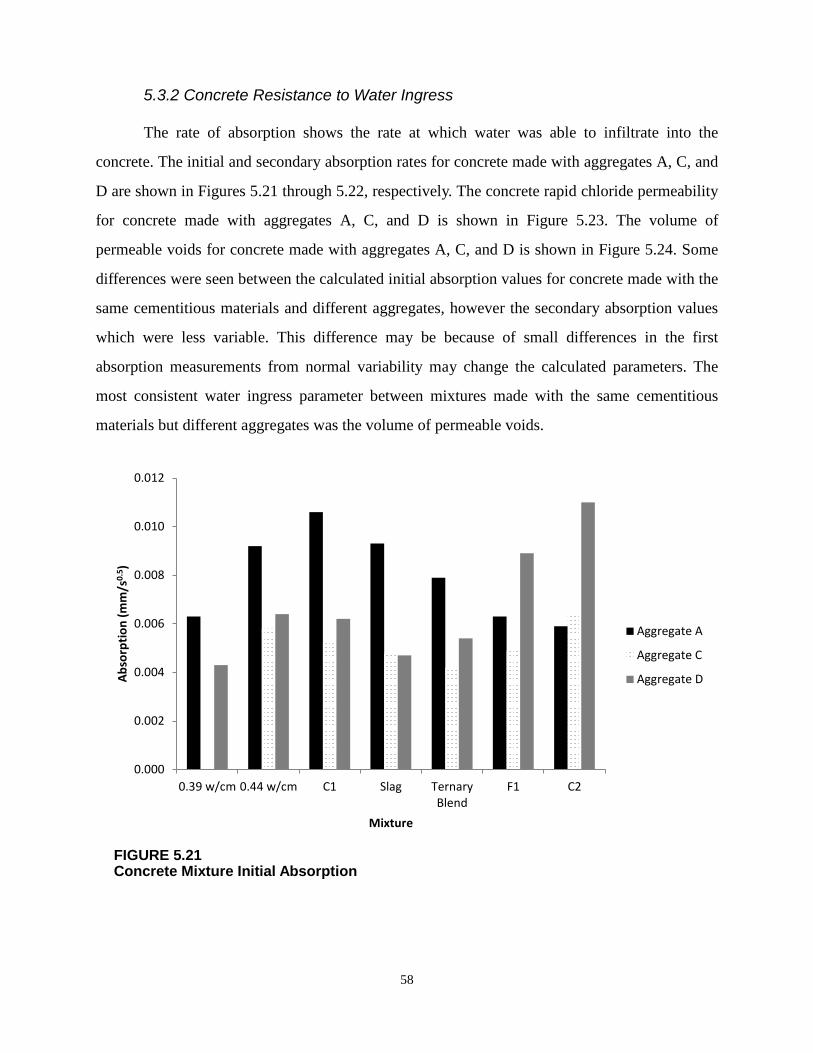
5.3.2 Concrete Resistance to Water Ingress
The rate of absorption shows the rate at which water was able to infiltrate into the
concrete. The initial and secondary absorption rates for concrete made with aggregates A, C, and
D are shown in Figures 5.21 through 5.22, respectively. The concrete rapid chloride permeability
for concrete made with aggregates A, C, and D is shown in Figure 5.23. The volume of
permeable voids for concrete made with aggregates A, C, and D is shown in Figure 5.24. Some
differences were seen between the calculated initial absorption values for concrete made with the
same cementitious materials and different aggregates, however the secondary absorption values
which were less variable. This difference may be because of small differences in the first
absorption measurements from normal variability may change the calculated parameters. The
most consistent water ingress parameter between mixtures made with the same cementitious
materials but different aggregates was the volume of permeable voids.
FIGURE 5.21 Concrete Mixture Initial Absorption
0.000
0.002
0.004
0.006
0.008
0.010
0.012
0.39 w/cm 0.44 w/cm C1 Slag TernaryBlend
F1 C2
Abso
rptio
n (m
m/s
0.5 )
Mixture
Aggregate A
Aggregate C
Aggregate D
58
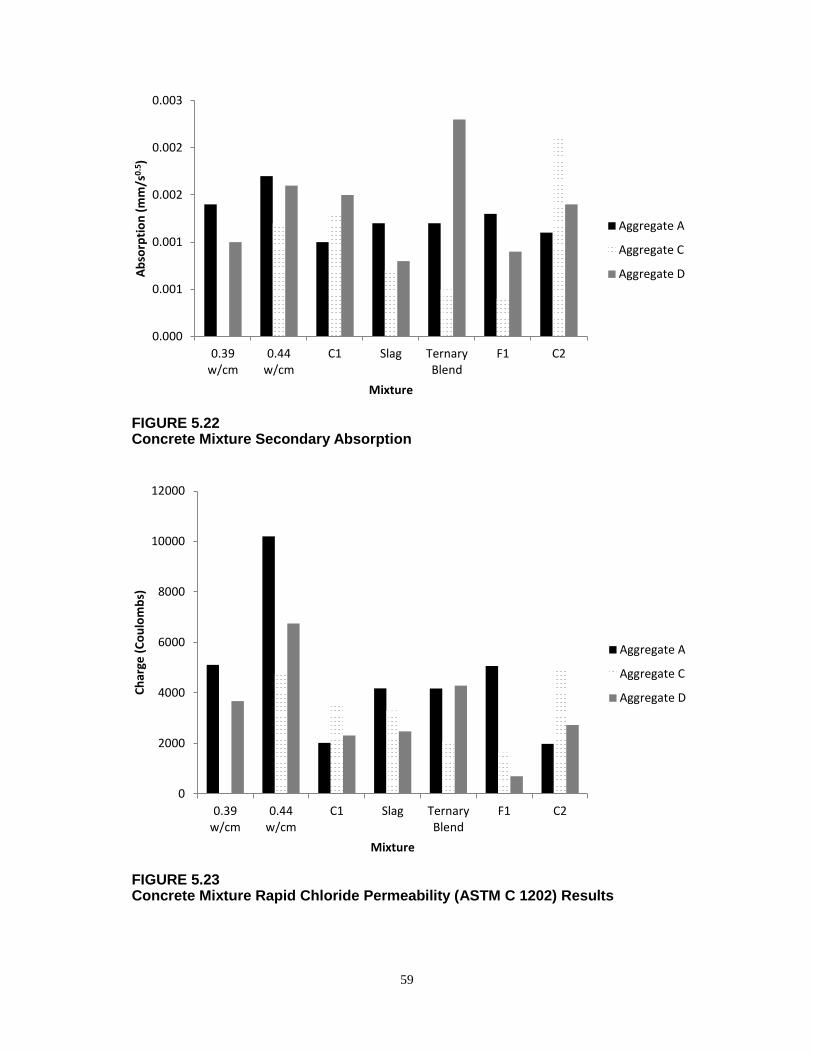
FIGURE 5.22 Concrete Mixture Secondary Absorption
FIGURE 5.23 Concrete Mixture Rapid Chloride Permeability (ASTM C 1202) Results
0.000
0.001
0.001
0.002
0.002
0.003
0.39w/cm
0.44w/cm
C1 Slag TernaryBlend
F1 C2
Abso
rptio
n (m
m/s
0.5 )
Mixture
Aggregate A
Aggregate C
Aggregate D
0
2000
4000
6000
8000
10000
12000
0.39w/cm
0.44w/cm
C1 Slag TernaryBlend
F1 C2
Char
ge (C
oulo
mbs
)
Mixture
Aggregate A
Aggregate C
Aggregate D
59

FIGURE 5.24 Concrete Mixture Volume of Permeable Voids (%)
A comparison was made between the concrete durability in freeze thaw seen with the
measures of water penetration resistance used for Aggregate C. Figure 5.25 shows a comparison
of the durability factor at 600 cycles versus the volume of permeable voids. Figure 5.26 shows a
comparison of the durability factor at 600 cycles versus the rapid chloride permeability. Figure
5.27 shows the durability factor at 600 cycles versus the absorption coefficients.
0
2
4
6
8
10
12
14
16
18
0.39 w/cm0.44 w/cm C1 Slag TernaryBlend
F1 C2
Volu
me
of P
erm
eabl
e Vo
ids (
%)
Mixture
Aggregate A
Aggregate C
Aggregate D
60

FIGURE 5.25 Comparison of Concrete Durability Factor versus Volume of Permeable Voids for Concrete Made with Aggregate C
FIGURE 5.26 Comparison of Concrete Durability Factor versus Rapid Chloride Permeability for Concrete Made with Aggregate C
R² = 0.92
0
2
4
6
8
10
12
14
16
18
0 20 40 60 80 100
Volu
me
of P
erm
eabl
e Vo
ids (
%)
Durability Factor at 600 Cycles
R² = 0.59
0
1000
2000
3000
4000
5000
6000
0 20 40 60 80 100Rapi
d Ch
lorid
e Pe
rmea
bilit
y (C
oulo
mbs
)
Durability Factor at 600 Cycles
61
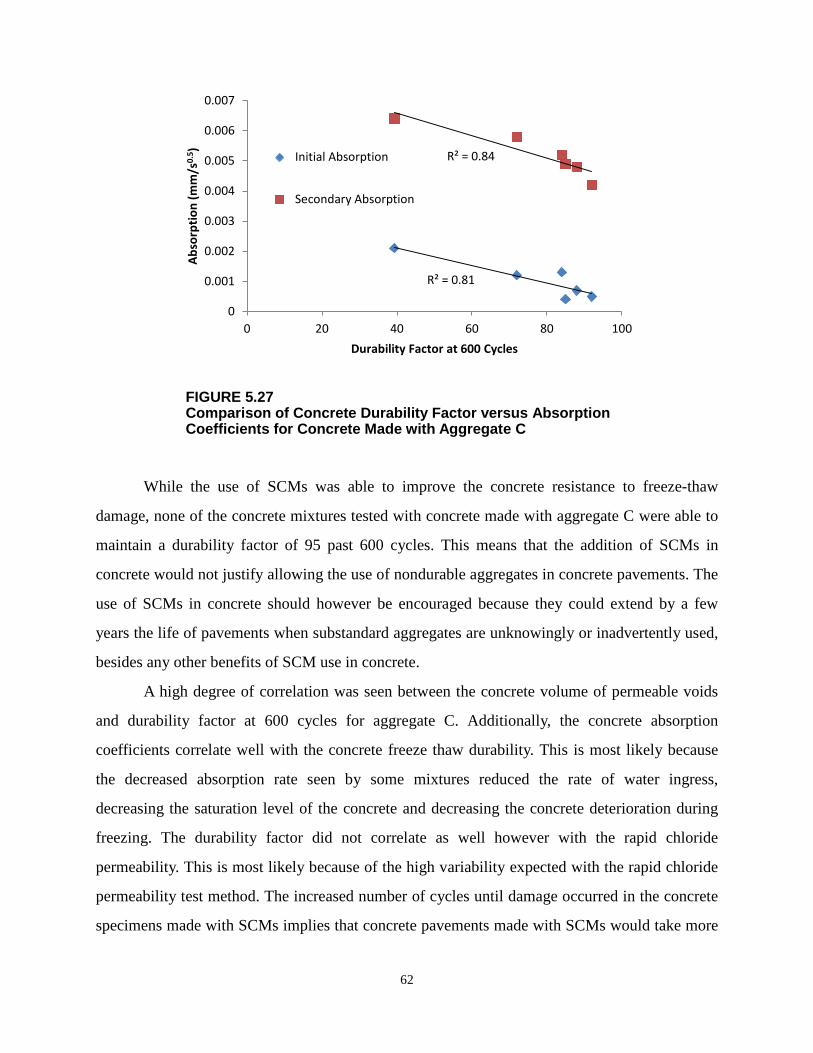
FIGURE 5.27 Comparison of Concrete Durability Factor versus Absorption Coefficients for Concrete Made with Aggregate C
While the use of SCMs was able to improve the concrete resistance to freeze-thaw
damage, none of the concrete mixtures tested with concrete made with aggregate C were able to
maintain a durability factor of 95 past 600 cycles. This means that the addition of SCMs in
concrete would not justify allowing the use of nondurable aggregates in concrete pavements. The
use of SCMs in concrete should however be encouraged because they could extend by a few
years the life of pavements when substandard aggregates are unknowingly or inadvertently used,
besides any other benefits of SCM use in concrete.
A high degree of correlation was seen between the concrete volume of permeable voids
and durability factor at 600 cycles for aggregate C. Additionally, the concrete absorption
coefficients correlate well with the concrete freeze thaw durability. This is most likely because
the decreased absorption rate seen by some mixtures reduced the rate of water ingress,
decreasing the saturation level of the concrete and decreasing the concrete deterioration during
freezing. The durability factor did not correlate as well however with the rapid chloride
permeability. This is most likely because of the high variability expected with the rapid chloride
permeability test method. The increased number of cycles until damage occurred in the concrete
specimens made with SCMs implies that concrete pavements made with SCMs would take more
R² = 0.81
R² = 0.84
0
0.001
0.002
0.003
0.004
0.005
0.006
0.007
0 20 40 60 80 100
Abso
rptio
n (m
m/s
0.5 )
Durability Factor at 600 Cycles
Initial Absorption
Secondary Absorption
62
freezing and thawing exposure cycles in the field for damage to appear than concrete made
without SCMs. The freeze thaw results however also imply that the use of SCMs will not delay
freeze-thaw damage in concrete pavements made with poor quality aggregates enough to meet
KDOT service life requirements. The enforcement of current KDOT specifications used to limit
the concrete volume of permeable voids is likely to help extend the life of concrete pavements,
especially when SCMs that reduce permeability are used. The use of high quality SCMs may
also be beneficial to the concrete in preventing alkali-silica reaction, reduce the heat of
hydration, and increase long term strength and is recommended.
If a durability of 95 after 660 cycles is assumed to correspond to a 20 year service life in
the field, and a linear damage model was assumed, every 33 cycles of freezing and thawing
would correspond to 1 year of pavement service life. Using this service life assumption, the use
of a 0.39 w/cm with concrete made using aggregate C would correspond to a service life of 7.5
years of pavement service life. The use of a ternary blend at 0.39 w/cm with aggregate C would
then correspond to a service life of 15 years. This increase in potential service life could help
justify the use of SCMs in concrete pavements and continued enforcement of concrete
permeability specifications as a secondary level of safeguarding against premature failure in the
case that nondurable aggregates are used inadvertently because of unanticipated changes in a
quarry bed, but not as a primary d-cracking mitigation measure. Quarry monitoring and
aggregate quality control testing to ensure that only freeze-thaw durable aggregates are approved
for and used in Kansas concrete pavements are needed to ensure that Kansas concrete pavements
meet the expected 20 year service life.
63
Chapter 6: Conclusions and Recommendations
6.1 Conclusions
In this study, the role of concrete curing, mixture proportioning and presence of SCMs in
the mixture, and aggregate type on the freeze thaw durability of concrete beams tested using
ASTM C 666 method B were investigated. The methods used by the researchers were validated
through comparisons of equipment measurements on the same samples and companion beams
tested at KSU and KDOT. The experimental results obtained have led to the following
conclusions:
1. The equipment and methods used by KSU follow KDOT specifications. KSU
researchers found that the impact resonance measurements could match those
made by KDOT, giving confidence in the equipment and methods used by KDOT.
ASTM C 666 does not contain multi-laboratory precision information, however
results obtained by KSU and KDOT were just outside of the range expected for
acceptable within-laboratory tests.
2. The good performance of concrete samples made with concrete from aggregates A
and B and cured according to standard KTMR-22 or 28 days in the 100% moist
room showed that the paste is strong enough to withstand freeze-thaw
deterioration after shorter curing periods. This contradicts the assumption that the
67 days of curing in the 100% moist room is needed to ensure that the paste
strength does not cause an otherwise good aggregate to fail KTMR-22.
3. Curing methods used on concrete beams can greatly affect the freeze thaw
durability. The drying period used by KTMR-22 was shown to decrease the
severity of the test during the freezing and thawing cycles. The drying period used
by KDOT during curing increases the water reabsorption rate during concrete
soaking and tempering prior to beginning freeze thaw cycles. This concrete
degree of saturation after the drying period and subsequent retempering in water
baths for 48 hours prior to beginning freeze-thaw cycles was still lower however,
than the shorter curing periods that did not involve drying periods. The increased
degree of saturation seen by longer periods of curing in lime water showed
64

increased levels of damage in concrete containing non-durable aggregates than
seen by standard KTMR-22 curing. The results show that if the KTMR-22 curing
methods were replaced with a shorter curing period using either the accelerated
curing methods used in this study in lime water or 28 day curing in a 100% moist
room, the test would be made slightly more severe and would decrease the total
time needed to perform KTMR-22 by at least 2 months.
4. It was seen that the concrete volume of permeable voids and water absorption rate
correlated well with the freeze thaw durability of concrete made with a poor
quality aggregates. The use of SCMs was able to reduce the rate of freeze-thaw
deterioration through a reduction in the water ingress rate. This reduction in the
water ingress rate was not enough however, to transform a concrete containing
non-durable aggregates into a freeze-thaw durable concrete mixture as measured
by KTMR-22.
6.2 Implementation Recommendations
The following recommendations for implementation are made based on the experiments
conducted in this study:
1. Change the curing regime used in KTMR-22 to 28 days of curing in a 100% moist
room. Curing in a 100% moist room for 28 days instead of the standard KTMR-
22 curing method consisting of 67 days in the 100% moist room followed by 21
days of drying at 50% relative humidity would reduce the total time needed to
determine the acceptability of an aggregate for use in concrete by 60 days and
make the test slightly more severe. Curing in a 100% moist room is also believed
to be simpler to implement at KDOT facilities than curing at 100°F in lime water.
2. Continue enforcement of KDOT permeability specifications. Although the use of
SCMs and lower concrete permeability cannot make concrete containing
nondurable aggregates acceptable for use in pavement applications, it could serve
as a secondary safeguard to help limit the decrease in service life associated with
inadvertent use of nondurable aggregates.
65
3. Focus on quarry monitoring and aggregate quality control testing to ensure that
only freeze-thaw durable aggregates are approved for and used in Kansas concrete
pavements.
6.3 Future Research
Several potential areas of future research on aggregate freeze-thaw durability of concrete
pavements exist. Some of these areas are as follows:
1. Determine if the number of freeze-thaw cycles needed to determine adequate
performance in KTMR-22 can be reduced by the use of ASTM C 666 method A
instead of method B as currently used. In method A, the concrete is immersed in
water during the freezing and thawing cycles. In method B, the concrete is frozen
in air, allowing the concrete beams to dry. The higher concrete degree of
saturation from method A may reduce the number of cycles needed for damage to
appear.
2. Measure the air flow speed, relative humidity, and temperature rates for different
size concrete freeze-thaw chambers to determine how if at all the chamber size
and number of specimens in the chamber influences the freezing rate and drying
that occurs in ASTM C 666 method B during the freezing period.
66
References
ACI 306. 2010. Guide to Cold Weather Concreting. Farmington Hills, MI: American Concrete Institute.
ASTM C 1202. 2012. Standard Test Method for Electrical Indication of Concrete's Ability to Resist Chloride Ion Penetration. 8. West Conshohocken, PA: ASTM International.
ASTM C 127. 2012. Standard Test Method for Density, Relative Density (Specific Gravity), and Absorption of Coarse Aggregate. 6. West Conshohocken, PA: ASTM International.
ASTM C 128. 2012. Standard Test Method for Density, Relative Density (Specific Gravity), and Absorption of Fine Aggregate. 6. West Conshohocken, PA: ASTM International.
ASTM C 138. 2012. Standard Test Method for Density (Unit Weight), Yield, and Air Content (Gravimetric) of Concrete. 4. West Conshohocken, PA: ASTM International.
ASTM C 143. 2010. Standard Test Method for Slump of Hydraulic-Cement Concrete. 4 pp. West Conshohocken, PA: ASTM International.
ASTM C 1585. 2013. Standard Test Method for Measurement of Rate of Absorption of Water by Hydraulic-Cement Concrete. 6. West Conshohocken, PA: ASTM International.
ASTM C 173. 2012. Standard Test Method dor Air Content of Freshly Mixed Concrete by the Volumetric Method. 9. West Conshohocken, PA: ASTM International.
ASTM C 192. 2006. Standard Practice for Making and Curing Concrete Test Specimens in the Laboratory. 8 pp. West Conshohocken, PA: ASTM International.
ASTM C 231. 2010. Standard Test Method for Air Content of Freshly Mixed Concrete by the Pressure Method. 10. West Conshohocken, PA: ASTM International.
ASTM C 231. 2012. Standard Test Method for Air Content of Freshly Mixed Concrete by the Pressure Method. 10. West Conshohocken, PA: ASTM International.
ASTM C 457. 2012. Standard Test Method for Microscopical Determination of Parameters of the Air-Void System in Hardened Concrete. 15. West Conshohocken, PA: ASTM International.
ASTM C 642. 2013. Standard Test Method for Density, Absorption, and Voids in Hardened Concrete. 3. West Conshohocken, PA: ASTM International.
ASTM C 666. 2008. Standard Test Method for Resistance of Concrete to Rapid Freezing and Thawing. West Conshohocken, PA: ASTM International.
Basheer, L., and Cleland, D. 2006. "Freeze- Thaw Resistance of Concretes Treated with Pore Liners." Construction and Building Materials, 990-998.
67

Chapin, L. T., and Dryden, J. B. 2001. An Evaluation of the Cost Effectiveness of D-Cracking Preventive Measures. Ohio DOT.
Clowers, K. A. 1999. Seventy-Five Years of Aggregate Research in Kansas. Final Report, Kansas Department of Transportation.
Distlehorst, J. A., and Kurgan, G. J. 2007. Development of Precision Statement for Determining Air Void Characteristics of Fresh Concrete with Use of Air Void Analyzer. Transportation Research Record, 45–49.
Dryden, J. B., and Chapin, T. L. 2009. "Evaluation of D-Cracking Preventive Measures in Ohio Test Pavement." Transportation Research Record, 92–98.
Du, L., and Folliard, K. J. 2005. "Mechanisms of Air Entrainment in Concrete." Cement and Concrete Research, 1463–1471.
Ge, Z., and Wang, K. 2005. "Properties of Ternary Cement Concrete Under Various Curing Conditions." CBM-CE International Workshop, 433–446. Karachi, Pakistan.
Joshi, P., and Chan, C. 2002. "Rapid Chloride Permeability Testing: A Test That Can be Used for a Wide Range of Applications and Quality Control Purposes If the Inherent Limitations Are Understood." Concrete Construction.
Koubaa, A., and Snyder, M. B. 2001. December. "Assessing Frost Resistance of Concrete Aggregates in Minnesota." Journal of Cold Regions Engineering, 187–210.
Ley, T. M., Harris, N. J., Folliard, K. J., and Hover, K. C. 2008. September/October. "Investigation of Air-Entraining Admixture Dosage in Fly Ash Concrete." ACI Materials Journal 105 (5): 494–498.
Li, W., Pour-Ghaz, M., Castro, J., and Weiss, J. 2011. Water Absorbtion and Critical Degree of Saturation as it Relates to Freeze- Thaw Damage in Concrete Pavement Joints.
Nokken, M. R., Hooton, R. D., and Rogers, C. 2004. "Measured Internal Temperatures in Concrete Exposed to Outdoor Cyclic Freezing." Cement, Concrete, and Aggregates, 26–32.
Norris, A., Saafi, M., and Romine, P. 2008. "Temperature and Moisture Monitoring in Concrete Structures Using Embedded Nanotechnology/Microelectromechanical Systems (MEMS) Sensors." Construction and Building Materials, 111–120.
Pigeon, M., and Pleau, R. 1995. Durability of Concrete in Cold Climates. London and New York: Taylor and Francis.
Pigeon, M., Pleau, R., and Aitcin, P.-C. 1986. "Freeze-Thaw Durability of Concrete With and Without Silica Fume in ASTM C 666 (Procedure A) Rest Method: Internal Cracking Versus Scaling." Cement, Concrete, and Aggregates, 76–85.
68
Shakoor, A., West, T. R., and Scholer, C. F. 1982. "Physical Characteristics of Some Indiana Argillaceous Carbonates Regarding Their Freeze-Thaw Resistance in Concrete." Bulletin of the Association of Engineering Geologists, 371–384.
Snyder, M. B., and Janssen, D. J. 1999. "Development and Evaluation of D-Cracking Mitigation Techniques." In J. Janssen, M. J. Setzer, and M. B. Snyder (Ed.), Frost Damage in Concrete: Proceedings of the International RILEM Workshop, 265–288. Minneapolis, MN.
Sun, Z., and Scherer, G. W. 2010. "Effect of Air Voids on Salt Scaling and Internal Freezing." Cement and Concrete Research, 260–270.
W.R. Grace and Co. 2009. May. Daravair 1000 Air-Entraining Admixture. Retrieved April 6, 2013, from http://www.na.graceconstruction.com/concrete/download/AIR-7G.pdf
Wang, K. 2003. Evaluation of Blended Cements for Concrete Pavements.
Wang, K., Lomboy, G., and Steffes, R. 2009. Investigation of Low-Permeability Concrete with and without Air Entraining Agent. Final Report, National Concrete Pavement Technology Center, Ames, IA.
69
