effects of cost sharing on efficiency of public...
TRANSCRIPT

1
EFFECTS OF COST SHARING ON EFFICIENCY OF PUBLIC SECONDARY
SCHOOLS IN KILIMANJARO
A Case of Vunjo Sub-District
Baraka R. Mwelumbini
Master of Education (Administration Policy Planning studies) Dissertation
Open university of Tanzania (OUT)
November, 2014

2
EFFECTS OF COST SHARING ON EFFICIENCY OF PUBLIC SECONDARY
SCHOOLS IN KILIMANJARO
A Case of Vunjo Sub-District
By
Baraka R. Mwelumbini
A dissertation Submitted in Partial Fulfillment of the Requirements of Degree of Master of
Education Administration Policy planning studies. Open university of Tanzania
Open University of Tanzania
November 2014

3
CERTIFICATION
The undersigned certifies that she has read and hereby recommends for the acceptance by the
Open University of Tanzania a dissertation entitled: Impacts of cost sharing on efficiency of
public secondary schools; A Case of Vunjo Sub-district, in partial fulfillments for the
requirements for the degree of Masters of Education Administration Policy Planning Studies
(MED-APPS) of the Open University of Tanzania.
Dr. Elinami SWAI
(Supervisor)
Date…………………………….…
4
DECLARATION
AND
COPYRIGHT
I, Baraka R. Mwelumbini, declare that this dissertation is my own original work and that it has
not been presented and will not be presented to any other University for a similar or any other
degree award.
Signature-----------------------------------------
This dissertation is copyright material protected under the Berne Convention, the Copyright Act
1999 and other international and national enactments, in that behalf, on intellectual property. It
may not be reproduced by any means, in full or in part, except for short extracts in fair dealings,
for research or private study, critical scholarly review or discourse with an acknowledgement,
without the written permission of Directorate of Postgraduate Studies, on behalf of both author
and the Open University of Tanzania (OUT).

5
AKNOWLEDGEMENTS
This dissertation owes its existence in its present form to a number of people and institutions that
cannot all be mentioned here by names. However, the following are the most representative.
First of all, I would like to express my gratitude to my Father Maurice Mwelumbini, my mother
Mwalimu Rebecca M. Mwelumbini for their efforts out of their economic constraint to make me
at school in this cost sharing period, and also my beloved wife Rose Philipo who encouraged
me in many good ways to pursue my degree.
Many thanks are due to my supervisor, Dr. Elinami V. SWAI for her perseverance and tireless
efforts in guiding me despite of many social and academic responsibilities. Her detailed
comments and reactions on earlier drafts of this work helped to clarify some of the aspects
involved in analyzing issues in Cost sharing and school efficiency as a whole. I would like also
to thank her for the many stimulating discussions of the issues treated herein but whose errors;
however, I‟m totally responsible. I also thank her for being tolerant and supportive during the
whole period of developing this work.
In general, acknowledgements are due to a very supportive group of people, the entire MED
APPS class of 2011/2013. I would also like to thank Muungano Secondary School Staff, Mr.
Goodluck Mshana and Mrs Mmochi in particular, for both their moral and material support. To
all those mentioned above, I render my sincere gratitude. Had it not been them, this work would
have never come into existence. Of course, none of them is to be blamed for any mistake that this
work might reveal. I accept full responsibility. May God bless all those who participated in
producing this work.

6
DEDICATION
For
My Loving Mom
Rebecca M. Mwelumbini
Thank you for opening the doors of education for me which I am still struggling. You have
worked tirelessly to accomplish the mission of my education. This wasn‟t possible, however,
without your beloved Husband Maurice Mwelumbini. I love you all and may the almighty God
give both of you strength and health to rip what you saw in me.
AMEN

7
ABSTRACT
An efficient school include learning with all supportive actions, environment, physical and
psychological assistances to the learners that directly affect positively learners‟ choices,
decisions and actions which guide learners to reach the fruit goals of their schooling (good
performance and employment). The purpose of this study was to examine status efficiency of
public secondary schools in Vunjo sub-district, Kilimanjaro by three decades of cost sharing in
Tanzania. Specifically, the study intended to assess existence of individualized programs for
special needs and low performing students, assessing number and quality of teachers in public
schools and assessing the social services provided in the schools. The study was conducted in
five secondary schools using a sample of 113 where 87 were students and 26 teachers. The data
from the field were collected through questionnaires, observations, interviews and group
discussions. The results revealed that there were no individualized programs for special needs
and low performing students in public secondary schools; also there were insufficient teachers in
public secondary schools and there were poor social services provided at the schools. It was
concluded that public secondary schools were to some extent inefficient because of shortage of
teachers, social services at schools, absence of individualized programs for special needs and low
performed students. It is suggested that, future research can observe the roles of integrating
different government sectors with education sectors like health, social affairs, legal, sports and
games etc in provision of social services at schools so as to improve public secondary schools
efficiencies.

8
LIST OF ABREVIATIONS
AAC Augmentative Alternative Community
ACRWC African Charter on Rights and Welfare of Children
ANC African National Congress
ANTRIEP Asian Network of Training and Research Institution in Education
Planning
BEST Basic Education Statistics
BSF Board maker Software Family
CRC Convention on Right of Children
CREATE Consortium for Research on Educational Access, Transitions and
Equality
DEA Data Envelopment Analysis
FGD Focus Group Discussion
GDP Gross Domestic Product
IMF International Monetary Fund
KSS Kibaha Secondary School
PCS Picture Communication Symbol
ROK Republic of Kenya
SAPs Structural Adjusting Policy
SS Secondary School
SSR Socialism and Self Reliance
TCPE Tanzania Certificate of Primary Education
TKS Teachers Knowledge Stock

9
UK United Kingdom
UNESCO United Nation Education and Science Organization
UNICEF United Nations Children Education Fund
UNU Universal Nation University
URT United Republic of Tanzania
URT United Republic of Tanzania
USSR United Socialism Soviet of Russia
WB World Bank
MESS (Kiswahili words) Mpango wa Elimu Shule za Sekondari
BRN Big Results Now
NECTA National Examination Council of Tanzania
UMISETA Umoja wa Michezo Sekondari Tanzania
CSEE Certificate of Secondary school Education Examination
MDC Moshi District Council
NHC National Housing Corporation
10
TABLE OF CONTENTS
Certification ................................................................................................................................3
Declaration and copyright ...........................................................................................................4
Aknowledgements .......................................................................................................................5
Dedication ...................................................................................................................................6
Abstract ......................................................................................................................................7
List of abreviations......................................................................................................................8
Table of contents ....................................................................................................................... 10
List of tables ............................................................................................................................. 13
List of figures ....................................................................................................................... 14
List of pictures .......................................................................................................................... 15
CHAPTER ONE: BACKGROUND TO THE STUDY .............................................................. 16
1.1 Introduction ................................................................................................................................. 16
1.2 Background to the Research Problem ........................................................................................... 16
1.3 Statement of the Problem ............................................................................................................. 19
1.4 Research Objectives ..................................................................................................................... 20
1.5 Research Questions ...................................................................................................................... 20
1.6 Significances of the Study ............................................................................................................ 21
1.7 Limitation of the Study ................................................................................................................ 21
1.8 Definitions of Key Concepts ........................................................................................................ 23
1.9 Chapter Summary ........................................................................................................................ 23
CHAPTER TWO: THEORETICAL CONSIDERATION AND LITERATURE REVIEW ........ 24
2.1 Theoretical Considerations ........................................................................................................... 24
2.2 Empirical Literature Review ........................................................................................................ 25
2.3 Teachers Quality .......................................................................................................................... 25
2.3 Individualized Programs for Special Need Students ...................................................................... 33
2.4 Social Services in Schools............................................................................................................ 35
2.5 Summery and knowledge gap ...................................................................................................... 40
2.6 Conceptual Frame Work .............................................................................................................. 40
11
2.7 Concluding remarks ..................................................................................................................... 42
CHAPTER THREE: RESEARCH METHODOLOGY .............................................................. 43
3.1 Introduction ................................................................................................................................. 43
3.2 Research Design .......................................................................................................................... 44
3.3 Qualitative Approach ................................................................................................................... 44
3.4 Quantitative Approach ................................................................................................................. 45
3.5 Scope of Study ............................................................................................................................. 46
3.6 Target Population......................................................................................................................... 46
3.7 Population Sample and Sampling Techniques .............................................................................. 46
3.8 Sample Size ................................................................................................................................. 47
3.9 Sampling techniques .................................................................................................................... 47
3.10 Research tools/ Instruments ........................................................................................................ 49
3.10.1 Interview ................................................................................................................. 49
3.10.2 Questionnaire .......................................................................................................... 49
3.10.3 Focus Group Discussion .......................................................................................... 50
3.10.4 Observation ............................................................................................................. 50
3.10.5 Documentation ........................................................................................................ 50
3.11 Data Collection .......................................................................................................................... 51
3.11.1 Primary Data Collection Methods ............................................................................ 51
3.11.2 Secondary Data Collection ...................................................................................... 51
3.13 Validity and Reliability .............................................................................................................. 51
3.13 Data Analysis............................................................................................................................. 51
3.14 Ethical Issues Considerations ..................................................................................................... 52
CHAPTER FOUR: DATA PRESENTATION, ANALYSIS AND DISCUSSION OF STUDY
FINDINGS................................................................................................................................ 53
4.1. Introduction ................................................................................................................................ 53
4.2. Characteristic of Respondents ..................................................................................................... 53
4.2.1 Respondents Age and Sex........................................................................................ 54
4.2.2. Respondent‟s Level of Education ............................................................................. 56
4.3 Number and Quality of Teachers in Public Schools ...................................................................... 57
4.3.1 Number of teachers ................................................................................................... 57

12
4.3.2 Quality of teachers .................................................................................................... 58
4.3.3 Teacher Levels of Education ..................................................................................... 58
4.3.4 Teaching efficiency in Classrooms ............................................................................ 60
4.3.5 Summary of Findings ................................................................................................ 65
4.4 Individualized Programs, Special Need and Low Performing Students ......................................... 66
4.4.1 Special Need Students in the Schools ........................................................................ 66
4.4.2. Special Need Teachers in the Schools ....................................................................... 67
4.4.3 Individualized Program for Special Need Students .................................................... 68
4.4.4 Individualized Programs for Low Performing Students .............................................. 70
4.4.5 Summary of Finding .................................................................................................. 72
4.5 Social Services at the Schools ...................................................................................................... 73
4.5.1 Availability of Non-Teaching Stuffs to Provide Social Services at the School ........... 77
4.5.2 Other Social Services Provided at Schools ................................................................. 79
4.5.3 Chapter Summary ...................................................................................................... 85
CHAPTER FIVE: SUMMARY, CONCLUSION AND RECOMMENDATIONS FOR
FURTHER RESEARCH ........................................................................................................... 86
5.1 Introduction ................................................................................................................................. 86
5.2 Summary of the Study.................................................................................................................. 86
5.3 Discussion of the Findings ........................................................................................................... 87
5.4 Conclusion................................................................................................................................... 88
5.5 Implication of the Study Findings............................................................................................... 90
5.6 Recommendations ...................................................................................................................... 91
REFERENCES .................................................................................................................. 94
APPENDIX I: Questionnaires to teachers and heads of schools ....................................... 105.
Appendix II: Focus group discussion for students............................................................. 109
Appendix III: Classroom Observation checklist................................................................ 110
Appendix IV: School Observation checklist for Social Services ....................................... 112
APPENDIX IV: Interview Guide .................................................................................. 113

13
LIST OF TABLES
Table 1: Categories of respondents…………………………………………..……………........30
Table 2: Categories of respondents……………………………………………………………..31
Table 3: Categorizing respondents age and sex…………………………….…………………..32
Table 4: Respondents‟ level of education …................................................................................33
Table 5: Generalized teacher‟s education levels………………………………………………..34
Table 6: Number of teachers and students at studied school…………………………………...39
Table 7: Responses on existence of special need students…………………………..…………43
Table 8: Availability of services at schools…………………………………………………….48
Table 9: Existence of non teaching stuff to provide the social services at schools…………….52
Table 10: Observed quality of other social services…………………………………………....55
14
LIST OF FIGURES
Figure 1: Students teacher‟s ratio in developed countries…..………………………………14
Figure 2: Educational levels………………………………………………………………....35
Figure 3: Observed classroom teaching efficiency………………………..………….……..37
Figure 4: Teacher‟s students ratios……………………………………………….………....40
Figure 5: Responses on existence of special need students…………………………………42
Figure 6: Existence of special need teachers ………………………….………….…………43
Figure 7: Responses on presence of individualized programs for special needs students…..44
Figure 8: Responses on presence of individualized programs for low performing students..46
Figure 9: Observed available and quality of services……………………………..…………..49
Figure10: Existence non teaching stuffs ……………………………..….…….……………..53
Figure11: Summarized other social services provided in public schools ................................56
15
LIST OF PICTURES
Picture 1: Teachers and students helping a sick student………………………………………50
Picture 2: Classes built for pedestrians students ………………………..……………………....54

16
CHAPTER ONE
BACKGROUND TO THE STUDY
1.1 Introduction
The public outcry about inefficiency of education sector in Tanzania has increased concern
amongst researchers and educationists like Madan M. Laddunuri (2012), Komba C, Winledy T.
Y Jonathan. & E. Hizza (2013) had to look at this phenomenon. Despite several reforms to
improve school efficiency, measured through effective provision of education and other services,
school inefficiency remains low. This study aims to look at cost sharing as one of educational
reforms introduced in Tanzania in the 1980s and re-introduced in the 1990s.
1.2 Background to the Research Problem
Cost sharing as a shift in the burden of service costs from government to the parents and students
(Moses Okotch, 2000, Johnston 1986, 2003, 2004) has been introduce in educational sector
worldwide since the introduction of liberalization of economy in the 1980s. Kitogo (2010)
defined cost sharing in education as defines cost sharing as shifting part of the burden for
financing higher education away from the state and into student‟s families. Psacharopoulos and
Woodhall (1985) noted that the introduction of cost sharing in education sector was due to a
massive increase in spending in education all over the world due to rising costs of education
because of inflation, the need for more sophisticated equipment such as computers, laboratory
equipment, home science materials and projectors and the ever-growing demand for education
because of the recognition that education is a central element in social and economic
development which has resulted in expansion of educational system.

17
Many countries in developed and developing countries have adopted the policy of cost sharing.
In Africa, World Bank and IMF urged African countries to consider the idea of cost sharing
instead of fully relying on public expenditure in financing education with a goal o boost up the
„considered‟ sluggish economies. One of the most popular recommendation by the world Bank to
African countries (South of the Sahara) was to reduce their unit costs in education at all levels
and urge the student and the parent to pay for such items as books and school running
expenses.
In china for example, where the government used to offer free education for all her citizens aging
6 to 15 due to their socialist economy, with the introduction of cost sharing, the parents were
urged to pay small amount for books and uniforms from primary education to middle school. As
a result, many children ended their studies in age of 15 especially in rural areas
In Kenya, while the cost of education had been footed through “Harambee” (pulling together)
since independence in 1963, (Bray, 1992), cost sharing in education came to be officially
introduced in 1988, making individual parents to pay the fees for their children. The spirit of
harambee was demolished and the parents who could not afford the tuition fees had nowhere to
turn to, with the consequence of many school dropouts in Kenya.
In Tanzania, Cost sharing was officially introduced in 1988 on the basis of economic recovery
(Republic of Tanzania, 1986). The discourse of cost sharing has revolved around the concepts
such as private and social rates of returns, where education is seen, first as individual profit
before that of the society .In this discourse, beneficiaries of education are the students and their
parents and therefore, it is logical to bear the burden of education cost.
18
While cost sharing has been propounded over the whole world, the concept of efficiency in the
provision of education has also come to dominate in education. Scholars and policy makers
demand that schools should be efficient in the provision of education. According Oxford
advanced leaner Dictionary 8th edition efficiency is the quality of doing things without wasting
resources. Efficiency depends on how well inputs are turned into outputs by the behaviors or
processes of individuals and organizations. (Milanowski et al. (2005). In a school context,
efficiency can be measured by the level of educational productivity, in terms of how well
students are taught and perform given the available resources. Resources in this context include
monetary, time and human. From economic point of view, efficiency represents the ratio
between what is brought and invested into the system and the results coming from the system
however, this concept must be redefined in the area of education for more efficient redirection of
the existing sources, financing and the expectation of educational institutions to provide greater
value for money. An education system may be called efficient from what it attains measured with
comparison to the level of investment.
School efficiency is the ability of school to reach objectives and targets of education by
controlling dropout, assuring equal access and good performance. (Fiske, and Ladd. 2002).
Efficiency of school depends on values of education which is determined by the cost benefit of
education. This means, calculating the inputs, including the resources incurred, the process,
which in the education setting this means the teaching and learning process, and the end result,
which is normally termed as output – the school and students performance and lastly, the
outcome how people who graduates benefit from the education by being employed or being able
to employ others and raise social and economic status in their societies.

19
The most commonly used measuring technique of school efficiency is the examination of the
relationship between financial inputs and students‟ completion rate and academic performance
outputs. In order to measure this relationship, educational researchers utilize cost functions,
meta-analyses. Every nation has adopted differing accountability systems, but in many places,
scholars report inefficient system of education. Kavale (2001) proposes rigorous and systematic
accountability system to meet standards of objectivity, verifiability, and replicability. (p.183).
For example, efficiency in education has been measured through 1). Smaller classes, 2). Smaller
schools, and 3) more experiences and educated teachers (Finn & Achilles,1990). But in the
context of cost sharing, it is difficult to take to task the schools that cannot meet the standards of
efficiency. As Hedges, et al (1996) opine, financial inputs directly affect student educational
outputs.
Looking at the consequences of cost sharing to school efficiency, Gertler in Mexico argued that
cost sharing has resulted to negative impacts on school efficiency like increased repetition rate,
dropout and failure rates (Gertler at al 2006). Gropello and marshall (2005) had differing view
from Gertler and argued that cost sharing had positive impacts on school efficiency by reducing
repetitions rates, failure rates, and lessened the degree of dropout rates. Fiske , and Ladd. (2002)
argue that cost sharing in developing countries has affected the schools efficiency negatively
while in developed countries it has affected positively.
1.3 Statement of the Problem
There is a contradiction among the scholars on the effectiveness of cost sharing to school
efficiency. One side of the camp (see Hedges et a, 1996; Finn & Achilles, 1990; Hedges, et al,
20
1996 and others) believes that cost sharing is important in raising school efficiency. The other
side of the camp (see, for example Gertler, 2006) feels that cost sharing reduces school
efficiency. This study aims to bridge this contradiction by empirically researching on how these
two belief systems relate to Kilimanjaro Vunjo sub-district. This study seeks to solve this
paradox and contribute to the literature on whether cost sharing in secondary schools in Vunjo
Kilimanjaro contributes to school efficiency or not.
1.4 Research Objectives
Objectives of this study were to assess how well the cost sharing in secondary schools in
Kilimanjaro maximizes educational outputs (students‟ completion rate and academic
performance). And the study specifically aimed to;
1. Assess the quality of teachers in secondary schools within the cost sharing period
2. Examine the existence of individualized programs for special need and low performing
students; and
3. Assess the existence of social services such as hostels, teachers houses , sports and games
and health services in secondary Schools
1.5 Research Questions
This study seeks to get answer to the following questions;
1. To what extent has the quality teachers increased in secondary schools within the cost
sharing period?
2. What individualized programs are there for special need and low performing students?
and
3. What social services exits in secondary schools in Vunjo sub-district?

21
1.6 Significances of the Study
Measuring the relationship between cost sharing and school efficiency in terms of students‟
completion rate and academic performance is an important topic in the field of education due to
the ongoing battle for funding. Schwartz et al., (2005) argue that it is important to study school
efficiency measurement for the following three distinctive reasons:
1) Understanding the strengths and weaknesses or various measures can help policy makers to
develop fairer methods of measuring school performance by taking into account the uneven
distribution of resources, students, and other inputs across schools.2) Although simple test score
comparisons tell us little about the causes of high performance, efficiency measures may help to
shed light on the relationships between inputs, broadly defined, and test scores.3) Resource
constraints are a fact of life in education, and the constraints have been particularly severe in the
early part of the 21st century. (p. 3)
Thus, This study will;
(i) Creating an awareness to policy planners how parents/community incomes (poverty)
around school (community secondary schools) affects efficiency of these schools.
(ii) Encouraged further interest and inquiry into the application of cost sharing policies in
education that will not affect secondary schools efficiency.
(iii) Contributed to the development of appropriate mechanisms to assure attainments of
secondary school efficiency in Tanzania.
1.7 Limitation of the Study
During the research, there were several problems that occurred, one of them being limited
amount of time available for the informants because the research was carried out during class

22
hours where respondents were extremely busy so only break hours students were free. This
happened seriously at two schools where a researcher requested to collect data during religious
periods (Tuesday and Friday) of which a researcher had being informed that were un attended as
the result data were collected on Tuesday and Friday from these schools. This, to some extent
delayed the data collection. Secondly some informants had little knowledge concerning cost
sharing for this situation a researcher used to educate informants about cost sharing before
collecting data. Thirdly some respondents failed to collect questionnaires on time where a
researcher was forced to go several times at the same school to collect the questionnaires.
Other limitations, Some few informants were not honest to the extent that they did not return
questionnaires some reported to damage or lost questionnaires luckily the researcher had extra
questionnaire that were given to informants who reported to have lost, damaged and those did
not return, where they informants responded them the questionnaires as the result a researcher
was able to collect data from them. The same, some informants were asking for money (to be
paid) so that they can provide the information to the researcher, in order to collect data from
these respondents a researcher used to educate them how this study was non-profit activity
before collecting data from these informants.
However the researcher kept in constant consultations with informants until he got the
information needed for the study. Given situation, the data obtained was sufficient to act as a
basis for impacts of cost sharing on efficiency of secondary schools generalizations. That being
the case, the findings are expected to be reliable.

23
1.8 Definitions of Key Concepts
1. Drop out-Is the compounding noun derived from verb (Drop) and noun (out) which
means to leave. In education context it means the number of students who leaves school
2. Efficiency- The quality of doing things without wasting resources, School efficiency is
the ability of school to reach objectives and targets of education by controlling dropout,
assuring equal access and good performance
3. Cost sharing- Is the partial or full shift of education costs from government to parents
and students
4. Public secondary schools – These are schools owned by the government (In Tanzania
public schools refers to as the opposite of private school.)
5. Social services- Social services in schools context refers to all non academic activities,
services and environment which are provided in schools such as sports and games.
1.9 Chapter Summary
This chapter covered the background of problem of cost sharing policy which gives broad
information in Africa and specific to countries like Kenya, South Africa, china and Tanzania.
The problem is that there is a contradiction on the effectiveness of cost sharing in school
efficiency in terms of students‟ completion rate and academic performance. The chapter also
identifies the objectives of the study and significances of undertaking this study. Chapter 2 deals
with theoretical framework, conceptual frame work and related literature reviews on the topic in
hand while chapter three is confined into research methodology.

24
CHAPTER TWO
THEORETICAL CONSIDERATION AND LITERATURE REVIEW
2.1 Theoretical Considerations
Theory has a scientific value in any study as it helps to describe, interpret, understand, evaluate
and predict phenomenon (Fourie 2007: 25). This study had used classical liberal theory by Jean
Rousseau and Sen‟s Capability theory to examine the impact of cost sharing on efficiency of
public schools.
Classical liberal theory claim that „natural‟ state men were born equal and personal qualities
should not jeopardize social equality so long as society rewards people according to their merits.
Rousseau seeks to describe a system of education that would enable the natural man he identifies
in the Social Contract (Rousseau J, 1762) to survive corrupt society, according to him every
person is having the ability to become anybody if he is given chance and environment Boyd
William (1911). Thus education system should create equal chances and learning situations
which create equal efficiency that will enable achieving of good educational fruits Rousseau J.
(1712-1778)
On the other side Sen‟s Capability theory which defines its choice into focus on the significance
of individuals‟ capability of achieving the kind of lives they have reason to value. A person‟s
capability to live a good life is defined in terms of the set of valuable „beings and doings‟ like
being in good health or having help from people they have real access. Individuals can differ
greatly in their abilities to convert the same resources into valuable functionings („beings‟ and
„doings‟). For example, those with physical disabilities may need specific goods to achieve

25
mobility, like pregnant women have specific nutritional requirements to achieve good health.
(Amartya Sen 1985) Is the same to special needs students and low achieving students needs
specific services and help from schools to perform well.
This theoretical frame work which discuses inequalities among students success are caused by
differences of efficiencies of schools they are enrolled at out of equal higher students
expectations. It focus on existing cost sharing and decentralization policy situation where district
and school are responsible to collect direct fees and other costs from parents and plan for school
on uses of some funds, which led to differences among districts and schools in collection of
funds, allocation of funds, planning, monitoring and Evaluation of educational projects in
addition corruption power and embezzlement of different district and schools impacts on
inequality in secondary school efficiencies which results to inequalities in students achievements
it also shows how absence of services in school results in students failure which affects direct
students expectations and restricts learners to reach what Sen‟s call „ mobility‟ on the other side
it shows how efficient school support students to reach their mobility.
2.2 Empirical Literature Review
This section examines the literature related to this study. The literatures are in line with the
objectives of this study which looks on quality of teachers, individualized programs for special
need students and social services at schools.
2.3 Teachers Quality
Teachers are defined by UNESCO-UIS/OECD/Eurostat, (2005) as professional personnel
involved in direct student instruction, and who are also involved with planning, organizing and

26
conducting group activities with a goal to develop students‟ knowledge, skills and attitudes
develop as stipulated by educational programmes teacher quality.
Teacher quality is often identified from teachers‟ education and experience (Metzler and
Woessmann, 2010). Most often associated with student learning and academic performance,
teacher quality or teacher effectiveness has received little empirical attention, particularly in
Africa. Part of the problem may reside with lack of evidence on the impact of teachers‟
education and experience on school performance or student academic achievement (Hanushek
and Rivkin 2006). Even though there is the relationship, scholars have found it hard to estimate
causal effects of teacher characteristics and students performance,
…there is little evidence that those characteristics most often used in hiring and
salary decisions, namely teachers‟ education and experience, are crucial for
teacher quality. Virtually the only attribute that has been shown to be more
frequently significantly correlated with student achievement is teachers‟ academic
skills measured by scores on achievement tests (Metzler and Woessmann, 2010,
p. 1).
Similarly, the literature that has focused education production function also determines the
teacher quality by measuring teacher experience, teacher education, class size, per pupil
expenditures with student achievement. Greenwald et.al, (1996) for example, determined teacher
quality by measuring teacher experience by the number of years of service. They hypothesized
that there would be a nonlinear effect of teacher experience, with teachers becoming more skilled
after the first few years of their career. Greenwald, et al, found stronger relations between teacher
education and student achievement and suggest that teacher quality rise with experience in

27
classroom teaching. They however cautioned that teacher vary in their effectiveness even if they
have the same length of classroom experience and these variations can be attributed to their
social economic status, the schools they teach, the students, and their own inclination to teach
and disposition, including gender, age and other cultural differences.
The implications of teacher quality from education function model to understand the context of
education in Tanzania is that teacher education and experience have an on the whole school
functioning, educational outcomes, and education quality. More educated and experienced
teachers will tend to use resource efficiently to achieve school goals. Quality teachers also have
influence and social power and skills to win the support and resources from alumni, parents or
the community for the school.
Another body of literature on teacher quality focus on the process, in which teacher quality are
measured through an assessment of three domains (affective, behavioral, and cognitive domains)
and the three levels (Individual, group, and school levels) (Cheng & Tsui, 1996). According to
Cheng (1996) and Cheng & Tsui (1996), teacher quality can be determined by their work as
teams or groups. According to this framework, individual teacher may not only use their energy
effectively but also create new energy, where they have a better chance to influence and change
the constraints given by the external and internal teaching contexts.
Process model of teacher quality has implications in this study because it helps in understanding
that individual teacher will have more impact on students academic achievement and school
effectiveness if they work in groups. The recognition and exploration of teacher quality in

28
relation to their characteristics not only helps address their historical neglect in relation to other
professionals but offers much insight for other professions. Even though the education
production literature offers little insight into the everyday life of teachers and is limited to
developing countries, its reconceptualization offers tools that help make sense of different
characteristics that can be used to measure teacher quality.
Scheerens, (2004) did a research on poor performance of schools in India and he found that it
was caused by low quality of teachers, as he suggested qualified teacher lead to enhancing
conditions at school level improving all the contextual variables related with school such as
teaching, learning, administration, student motivations and community involvement. In the early
studies on school effectiveness the emphasis was on the enhancing conditions of schooling and
output measures in India and low concerns on qualities of teachers, in the report he explains on
the conditions for school performance like good administration, contextual variables relating
with teaching and learning which mostly he insists that can be achieved through quality
teachers.
Russell (2005 ) did a research on the number and quality of teachers Northern Carolina in
United states of America 18 schools were used as samples he used qualitative methodology to
interview 100 teacher as central debate about teaching quality centers on the relative
importance of pedagogical skills and number of teachers on school performance; about 76
supported quality of teachers on school performance , as Russell found that search for good
performance should involve quality teaching , and he suggested that occurrence of out-of-field

29
teaching that often results from how schools are organized and staffed rather than from
inadequate teacher supply but is by quality teachers.
Likewise the study by Lewin, (2007) focused on causes of failure in schools, Lewin has drawn
attention low quality of teachers and school environment to school performance, in his study he
interviewed 18 teachers and 56 students in India he found that lack of vision, unfocused
leadership, dysfunctional staff relationships, and ineffective classroom practices as mechanisms
through which the effectiveness of schools can deteriorate, he concluded on number of
characteristics for successful schools such as strong leadership, high expectations, and good
atmosphere which can be planned and achieved through quality teachers and school
administration.
Kalinga (2008) conducted a research on interactive learning and school performance two
schools Kibaha secondary school (KSS) and Wali-ul-Asr girls‟ seminary in Kibaha Tanzania
were used as sample in the study he correlates effective schools as the means of achieving high
and equitable levels of student learning which facilitated by qualified teachers to teach and use
technological means for good learning like computer and special need students devices. He
concluded that it is expected that all children regardless their socioeconomic and background
characteristics will get at least the essential knowledge and skills if are taught with quality
teachers who are having good and applicable examples to be understood by all students for long
memory. This means that quality teachers improves school performance and reduce failure rates.
Another view, derived from the studies done at High fields schools Mult-lock in England by
(Kirk and Jones 2004). On contribution of teachers to school efficiency, in their study they
30
interviewed 25 teachers 19 teacher said efficiency and effective schools are those schools
teachers are successfully progress the learning and personal development of all of their students.
As the result of this study they found that school effectiveness does not focus on mere academic
achievement but other factors such as classroom behavior, student participation rates, and
students attitudes towards learning determines school efficiency, As for Kirk and Jones an
efficient school is the school with qualified teacher to make progress learning , students personal
development , helps all students to participate fully in learning and equal class behavior as well
as enabling students to have positive attitudes towards school as the results school failure and
drop out is minimized, while access will be increasing which later improves school efficiency.
On other hand number of teachers compared to number of students was another indicator of
school efficiency and indicator of an efficient education system that many researchers had been
focusing on it as the factor for efficient schools. According to research done by Loxley and
Heyneman (2011), the pupil-teacher ratio in the world varies from 13:1 to 79:1. In the eight
most developed countries which schools are more efficient where highest is United Kingdom
student-teacher ratio is 23:1 and lowest is in Italy with 11:1 , The following oscillations exist in
developed country

31
Figure 1: Student- teacher ratio in developing countries
Source: (Fukuyama, 2009)
From the above 8 sample countries used in their study they found that the more the number of
student teacher ratio increases the low student achievement as well as low school efficiency
where Italy was the first and UK was the last on school efficiency according to their research
findings.
Statistics shows that student- teacher ratio in developing countries is very worse especially sub-
Saharan countries it is said that major reason is most developing countries enrolment expansion
took place at very rapid pace in the last decades. Enrollment at first level increased at an annual
rate of 4.2 percent between 1965, and 1875, 3.6 percent between 1970 and 1980. As more the
countries near to achieving universal primary education enrolment expansion slowed down at
primary level but continued at secondary and tertiary level. Second level enrollment increased at
annual average of 7.0 in primary and 9.4 in secondary until 1980s later 2000s the increase in
average reached to above 26.1 and above the situation which resulted to insufficient of teacher
32
in most of developing countries resulted to expansion of tertiary and secondary education
(quantitative expansion) which lowering quality of education Sixtus F.N Kiwia (1994).
According to study by Noah Murumba Kiveu and Julius Mayio (2009) of Masinde Muliro
University of Science and Technology- Kenya who conducted a study at Ndivisi Division,
Bungoma district in Kenya on efficiency of public secondary schools in Kenya, when focusing
on number and quality of teachers, they interviewed 11 heads of school at Ndivisi Division on
reasons behind for employing un qualified teachers 8 of them gave reason to be shortage of
teachers. At the end of the study it was found that low quality teacher were found mostly in rural
area schools. Also they revealed that where scarcity of teachers lead school to employment of
unqualified teachers like secondary school leavers to teach who knew nothing about teaching
profession. On the other side it was observes that teachers for special need learners were not
found in rural areas. When drawing their conclusion they showed that there were relation
between number of teachers and quality of teachers in their study, as they shows that in school
with no enough teachers there was an indicator of employing un qualified teachers to teach. As
they concluded that poor school efficiency among rural schools were contributed by uses of
unqualified teachers to teach.
Statistics shows that teachers for special need students are not enough in most of African
countries especially in rural areas this lead to needy students sometimes not be taught example
Eric Mcheka (2010), conducted a research in Malawi Zingwangwa Primary School during an
interview with Margaret Chimutu she revealed that learners with learning difficulties are left
unattended to whenever their teachers is sick or is away attending a funeral as it affected their

33
syllabus coverage and performance in general. This shows that number of specialist teacher for
special need students is not enough especially in rural areas. In their study they found that most
of poor performance in most of schools in Malawi was also caused by shortage of professional
teacher for special need learners which caused them to fail in their examination and lowering the
schools efficiency. This thought had also supported by Chavuta, (2008)
2.3 Individualized Programs for Special Need Students
Among the most commonly cited weaknesses of previous Educational reforms was educational
policies focused more on changes at the system level than on improvements at the institutional
level. It was almost assumed that public policy and provision would automatically lead to an
improved performance at the institutional level and hence reform measures placed very little
importance on issues related to the functioning of the school in the classes and student
differences. However, this expectation was believed as most schools failed to control failure
rates.
According to research done by ANTRIEP under (UNESCO 2000) in Asia it was found that low
performed student enrolled at secondary school most of them failed in their secondary education
because of their differences in achieving as the responses from findings the report proposed the
individualized programs for low achieving students in school level where the focus are in
teaching and learning process in classes across students differences. ANTRIEP report insists on
the schools to have individualized programs for special need and low performing students.

34
Likewise a study by Barbara Glaeser &Barbara Millikan (2009) focused on students individuals
differences and school performance, in their study they interviewed 13 special need teachers and
30 special need students in Sri Lanka , they found that that classes for teaching low achieving
should be small and with few students as most of the teaching methods bases on table discussion
between teacher and learners, more time for covering concepts should be located compared to
other students. As for them they suggest that efficient schools should have special classes for low
achieving students so as to reach what they call “Leave no child behind” in schools.
Psychologist, and writers believe that differences in achieving among students are caused mostly
by physical impairments as for them they suggest an efficient school should qualified teachers
and have hearing and Visual tools to assist students in processing language, organizing their
thinking, remembering information, and many other skills necessary to participate effectively
(Hodgdon, n.d.). examples of such tools, Boardmaker by Mayer-Johnson, is a graphic database
of Picture Communication Symbols (PCS) that can be used to create a variety of printed
communication and educational materials (Boardmaker Software Family Handbook Copyright
1981-2008). Additionally, Boardmaker is commonly used in most augmentative and alternative
communication (AAC) devices that people with severe speech or language problems rely on to
supplement existing speech or replace speech that is not functional. An AAC device use
electronic technology to “speak” as the user types in words or pushes a PCS button. It is
important that Extension educators working with people using such devices learn to operate them
so that to improve special need communication. This may increase social interaction, learning
performance, and feelings of self-worth (American Speech-Language Hearing Association
Augmentative and Alternative Communication, n.d. 2009).
35
Frances Hunt (2008) under CREATE conducted a study on special need dropping out from
school in Ghana , On his report he found that absence of skilled teachers and special programs
for special need and low achieving lead to most of drop outs in Ghana among the students. On
other hand some writers tried to explain how school can enable low achieving students through
having special programs for low performing student and uses of qualified teachers, Brookover &
Lezotte, (1978) believes that an efficient school should have “equalizing agent” programs, where
all low performing student can be taught and re-taught to control failure rates. To them they
believed that not one teaching methodology can be useful for all kinds of learners in classes
while identifying student individual differences and backgrounds.
2.4 Social Services in Schools
Social services to students are provision of non educational services to children in a school
setting. Social services provided in schools these refers all non academic activities, services
and environments which are provided in schools which play great roles in retaining of both
teachers and students at schools Allen-Meares, P. Washington, R. O., & Welsh, B. L. (1996) it
has believed that social services provided in schools and educational institutions determines how
an education system attract both teachers and students to the institution, it thought that good
social services in school retains students and teachers in school which results to efficiency and
effectiveness of schools.
Hazarika and Bedi (2003) did a research in Pakistan from 1991 to 2002 on effects school social
services on school dropout they analyzed data from Pakistan Integrated Household Survey
(covering 4,800 households in 300 rural and urban communities) and specifically focused on a
36
sample of 1900, 10-14 year-olds. The aim was to look at the relationships between school social
services provision and school ability to control student dropout, performance and schooling
access. In the study 78% of household respondents when asked on the reason for the school
dropout they analyzed absence of hostel and dormitories, food services, transport to school,
security for their children as the major cause of truancy and school dropout of most of students.
On the side of students the 89% of student said the major reason for poor performance and
dropout they mentioned absence of services like guidance and counseling services, playing
grounds, health services, water services, transport, good teachers, security and religious services.
In their study they found that school social services were positively related to school efficiency
in Pakistan.
Mark Robinson and Gordon White (1997) conducted the same study on efficiency of schools in
Sweden under (UNU-WIDER). In their study they found that there was a great contribution of
civic organizations in provision of services in Sweden schools, They showed that the more
schools improving social services like meal, sports, health services, guidance and counseling the
more improved school attendance and positive attitudes among pupils in Sweden towards
schools. In their study they suggested that government and other educational stake holders to
consider the issues of social services in school and call for what they called „bring community at
school program‟ which aimed at bringing all services found in community to the schools so as to
improve school efficiency.
37
Likewise Charles Sabel and Reijo Meiettinen (2010) did a study on social services and efficiency
of special education schools in Finland. In their study what interesting in their report they cite
Peer Moen (disabled) when responding to them who said;
„..I‟m not pedestrian, to make me at school I need to get all services at school
when I don‟t get them I cannot stay here. If I stay I don‟t concentrate at al on
studies…‟.
In their study they observed that there was positive relation between schools access among
disabled learners and services provided in the schools. Charles Sabel, and Reijo Meiettinen
suggested that in order to improve special education access there should be special effort to
provide all social services needed by special need learner in school environments. They
suggested that schools should employ more non teaching stuff to help disables at school all
shores as they believed that those social service will enable learner to leave their family to school
hoping that service found at home can be found at school too.
Other writers had supporting social services at school Alderson J. J. (1972) did a study on social
services at schools in America, in his study he found that as health and social services became
embedded in the schools the services became more school-centered and less family-oriented,
focusing on improving school attendance for instance the number of non educational staff and
the ratio of these staff to pupils has increased markedly in the past 40 years. He showed that
more schools improving social services like meal, sports, health services, guidance and
counseling had lead to increased school attendance and positive attitudes among American
students towards school which improved school efficiency in America.
Alderson suggests schools should provide all social services like Health services, food services,
sports, games, Guidance and counseling services, an efficient school environment should contain

38
these for students, he showed as services became more school-centered and less family-oriented,
resulted on improving school attendance, for instance. The number of non educational staff and
the ratio of these staff to pupils have increased markedly in the past 40 years. Alderson cite
research done by Richmond which shows that more schools improving social services like meal,
sports, health services, guidance and counseling had contributed to increased school attendance
and positive attitudes among American students towards school which improved school
efficiency Richmond, M.E. (1922).
Tapologo Maundeni, (2009) of the university of Botswana did a study on School social services
and school access in Botswana, in his study he found that the 1995, Botswana ratified the
Convention on the Rights of the Child (CRC) and the African Charter on the Rights and Welfare
of Children (ACRWC) in 2001. However, neither the CRC nor the ACRWC have been
domesticated and improving school access. Tapologo says the failure implies that the
instruments had not much impact on the lives of children in schools over the country it as he says
„Is not possible take pastoralist son and daughter at day schools with no food, health care, social
practices like cultural arts, sports etc.‟ See also in (Botswana Human Development Report 2000).
Topoogo thought that caring of children/students should start with caring to teacher and school
environments, where teacher should be paid higher for teaching and caring children at schools.
Apart from salaries he suggested teachers have to get a transport and house loan. According to
him school environment should have services like sports, games, cultural practices, hostels,
transport and food in order to make a school like home to attract more students and teachers at
school environments as he said that for pastoralist societies like Botswana societies school

39
should take the role of family and community by providing all services found in families and
community to learners at schools.
In Tanzania, Nkuba Mabala (2012) conducted a study in Dar Es Salaam secondary schools on
impacts of social services provision in secondary schools, The purpose of this study was to
examine the status of career services provision and its role on career decision making among
high school students in Dar Es Salaam, Tanzania by comparing career services provision in
government and international schools. Specifically, the study intended to identify the career
programs available to students in schools, students‟ career knowledge and the contribution of
career programs and career knowledge to students‟ career decision making as social service
provided in school. The study was conducted in six secondary schools using a sample of 322
students from six secondary schools. The data from students were collected through a structured
questionnaire and focus group discussions. The results revealed that students in international
schools had access to many career programs and they have better knowledge on careers as
compared to students in government schools. It was therefore concluded that, career services
provision in international schools is to some degrees a reality as opposed to government schools
where career services provision is still a dream. This shows that how public schools failure is
related to absence of social services like guidance and counseling in public schools. He
suggested that in order to improve public schools, future research should observe the role of
guidance and counseling like career services provision in secondary schools to students‟ ability
to make relevant course choices in higher learning institutions

40
2.5 Summery and knowledge gap
In this chapter all important aspects that this study intended to examine are analyzed. From
literature review it was noted that number and quality of teachers, individualized programs for
special need and low achieving learners and social services contributes a lot to the school
efficiency. The review of empirical literature has shown that although there several studies
conducted on the topic at hand no studies had focused on impacts of cost sharing to the
efficiency of secondary school in Vunjo sub-district. It is in light of this study was conducted to
fill the existing knowledge and inform the practice.
.
.
2.6 Conceptual Frame Work
Public schools under cost sharing
High socio-economic expectations
Expanded enrollments
Students with different
needs
Inefficient school 1. No enough quality teachers 2. Poor/ No Special programs for special
need& low achieving students
3. Poor/ No teacher and student
motivations
4. No/ poor social services at school
Efficient school 1. Enough quality teachers
2. Special programs for special need
&low achieving students
3. Teacher and students motivations
4. Good social services at school

41
OUT PUT OUT PUT
Figure 1: Conceptual Framework
Source: Formulated by researcher
This conceptual frame work gives mental picture on the two sides of the effects of cost sharing
which expanded the enrollments in secondary school, but it shows that the expansion lead to
enrollments of students with different needs for learning. Later it shows how those with quality
teachers, special programs for special need and low achieving students and quality social
services at school result in higher academic performance. The second part of the model shows
the failure of planning / Manage costs in school end up having no enough quality teachers; poor
special programs for special need& low achieving students and poor social services at school,
leading to high average rate of failure.
In left hand side there is efficient school as the result of good social services a school is
characterized with enough quality teachers Special programs for special needs students,
Teachers and students motivations, Good social services at school and which results to low
Coping Strategies
Assessing the impacts of cost sharing on efficiency of
public secondary schools
Students low performance;
school inefficient
o
Students academic performance;
school effectiveness

42
average rate of failures in their Output of these secondary schools because they had performed
well their students reaches their expectations like joining higher learning, Getting good
employment, To become economically well off, Legal earning and to get good standards of
living.
On right hand side there non efficiency school which is poorly planned school as the result of
insufficient services at school the school is characterized with no enough quality teachers, Poor
or no Special programs for special need and low achieving students, Poor or no teacher and
student motivations, No or poor social services at school as the result of it is high average rate of
failures, Output of these schools are students characterized with Un employments, Poor
economically, Poor standard of living, Illegal earnings, Poor social status and when evaluating
students expectations are not achieved at all.
Copying strategies was basing on Sen‟s capability theory and Rousseau Natural stateman theory
which call for assessing the impact of cost sharing on schools whether it enables schools to make
their roles of enabling students as natural man to reach what they expected to get in life apart
from their individual differences.
2.7 Concluding remarks
In this chapter, all important aspects that the study intended to examine are analyzed. This
empirical literature review cover main three bodies quality teachers, individualized programs for
special need students in schools and social services. In literature review it is noted that cot
sharing in public schools aimed to improve school efficiency and on other hand school efficiency

43
determined by number and quality of teachers, school programs for low performing students and
social services provided at school. The next Chapter deals with the methods used to collect data
for the study at hand.
.
CHAPTER THREE
RESEARCH METHODOLOGY
3.1 Introduction
Research methodology is the science of understanding how research is done systematically and
logically. Research methodology it does not only need to understand the uses of methods but also
the logic behind the uses of the method (Kothari 2005:7). It aims to describe and analyze
methods, throw light on their limitations and resources, clarify their presuppositions and
consequences, relating their potentials to the twilight zone at the frontiers of knowledge. This
chapter intends to describe research methods and procedures employed in this study careful and
clearly. It is an essential chapter which comprise of the research design, population of the study,
sample and sampling procedures, data collection, data analysis and presentation.

44
3.2 Research Design
Research design is a comprehensive master plan of research study to be undertaken, giving a
general statement of the methods to be used. The function of research design is to ensure that
requisite data in accordance with the problem at hand is collected accurately and economically.
Simply stated it is the framework or a blueprint for the research study which guides the
collection and analysis of data (Earl Babbie 2007) the “research design”. Decisions regarding
what, where, when, how much, by what means concerning an inquiry or a research study
constitute a research design. “A research design is the arrangement of conditions for collection
and analysis of data in a manner that aims to combine relevance to the research purpose with
economy in procedure.” Claire Selltiz. Et. al (1962) p.1962.
In fact, the research design is the conceptual structure within which research is conducted; it
constitutes the blueprint for the collection, measurement and analysis of data. As such the design
includes an outline of what the researcher will do from writing the hypothesis and its operational
implications to the final analysis of data ( C. R. Kothari. 2004 p.31)This study is designed in
quantitative approach and qualitative approaches will be used as follows;
3.3 Qualitative Approach
This refers to the method which offers a better understanding of the phenomenon as perceived by
the respondent‟s point of view and how they experience, feel and explain things around them. A
small number of data in this study aims to provide in-depth qualitative and context-specific
accounts of educational access, dropout, social services at schools plays its part (e.g. Chi & Rao,
2003; Dunne & Leach, 2005; Liu, 2004). Few studies will be carried out interviews with parents
45
who sometimes may not know to read and write, and often school-based questionnaires will be
for teachers and students who have some literacy skills. Some studies focus on one geographical
area (e.g. Juneja, 2001; Liu, 2004) whilst others are more comparative in nature (Boyle et al,
2002; Brock & Cammish, 1997; Colclough et al, 2000; Dunne & Leach, 2005; and Ersado,
2005). As showed above writers had showed how the collection of household data is supported
to be done in large questionnaires interviews and survey as the data collection methodology
basing on qualitative approach.
3.4 Quantitative Approach
According to Mugenda (2003) quantitative method is the approach which includes designs,
techniques, techniques and measures that produce discreet numerical data. Many studies were
quantitative, derived from school survey/large scale questionnaires (e.g. Admassie, 2003; Brown
& Park, 2002; Ersado, 2005; Meekers & Ahmed, 1999; Shapiro & Tambashe, 2001; UIS &
UNICEF, 2005; Wils, 2004) others take a more statistical/econometric approach (e.g. Anderson,
2005; Connelly & Zheng, 2003; Zimmerman, 2003).
The study combined quantitative and qualitative elements (Boyle et al, 2002; Colclough et al,
2000; Dachi & Garrett, 2003; Nekatibeb, 2002; Porteus et al, 2000; the PROBE Team, 1999;
Rose & Al Samarrai, 2001; Vavrus, 2002). Descriptive survey design is the main study design
adopted in conducting this study. Descriptive survey design is appropriate because it involves
collecting data in order to test hypothesis or questions concerning the current status of subjects of
the study. It is used to test attitudes cost sharing and schools service delivery. Kothari (1995)
notes that descriptive survey design is concerned with describing, recording, analyzing and
reporting conditions that exist or existed.

46
Engelhart (1972) argues that descriptive methods are widely used to obtain data useful in
evaluating present practices and in providing the basis for decision- making. This study was
designed mainly as quantitative study and qualitative making use of descriptive survey design
and case study approach. In this approach some numerical data (information) about school
efficiency were collected from secondary schools pertaining to number and quality of teachers,
individualized programs for special need and low achieving students and social services provided
at school for teachers and students in public schools through cross-sectional survey. Young
(1956) cross-sectional survey targeted to get opinions, views, attitudes and values relating to
problem in hand. Therefore the study was conducted through the descriptive research design
3.5 Scope of Study
The study was conducted in Moshi Rural District in Vunjo Southern where by seven public
secondary schools were involved.
3.6 Target Population
Target population refers to the group of individuals object or in term from which a sample is
taken for measurement, Kombo and Tromp (2004). In this study the target population comprised
heads of schools, teachers, students and other non teaching from 7 selected schools in Moshi
rural.
3.7 Population Sample and Sampling Techniques
The main determining factor to get right sample size that is manageable in time and the financial
resources with quantitative research approach being the leading approach in data collection.

47
Selection of sample in this study was purposive sampling method as every member involved in
the study were for reason. Purposive sample relies on the concept of saturation or what (Michael
Patton) call a point of which no new information, patterns, themes are observed in data. This idea
of saturation provides little practical guidance for estimating sample size prior for data
collection. Therefore the sample in this study were judged in context which validity,
meaningfulness and insights generated from the information rich cases select purposefully from
observational and analytical capability of researcher than the sample size(patton,1990:184). Also
probability sampling especially simple random sampling was used to obtain the controlling
group sample of about 40 teachers who were found in schools by researcher. This is to insure
representation of different types of experiences.
3.8 Sample Size
Sample size was be obtained through using formula
n=N/1+N(e)² while
n= Sample size
N=population size
e=desired level of precision e.g. 0.05 this is the sampling error. Using this formula the sample
size was 40 each school.
3.9 Sampling techniques
The researcher used systematic sampling technique formula in order to get total number of 7
secondary schools out 34 public secondary school and number of teachers involved,

48
K=T/t, Where by
K=Constant
T=Total number of secondary schools
t=Total number of sampled schools in district
In order sample from the selected 7 secondary schools researcher arranged all schools
alphabetically but their number appear randomly without considering the first number or last
number of school. These schools for formula are Muungano with 824students, Mieresini 513,
Himo secondary 613 students, Ghona secondary 456 students, Iwa secondary 397, meli
secondary 578 and Kimochi 704 secondary school, the total number are 4082.
sample size was 126 students and 40 teachers.
S=R/Nxn. Where by
S= school
R=population of the sampled school
N= Total population of all 7 sampled schools
n= Sampled size.
From this formula In order to get a number of respondents for each school and students who
involved in a research by the use of above formula; sample for each school was Muungano ss
had respondent 26 students and 8 teachers, Mieresini students 15 and 5 teachers, Himo SS 18

49
students and 6 teachers, Ghona 14 students and 4 teachers, Iwa SS 12 students and 4 teachers,
Meli SS 17students and 7teachers and Kimochi secondary 22students and 7 teachers
3.10 Research tools/ Instruments
3.10.1 Interview
To collect data from respondents structured interview was prepared and administered as the
primary research data. This method was chosen because it enables flexibility as the researcher
restructured questions and repeated them since it was face to face. (C.R Kothari 2005: 97-99).
Furthermore the same questions were administered to every respondent of the same manner to
insure that results are comparable. The interview was conducted with key informants students on
the other hand they give community, and family data. A researcher interviewed heads of schools,
counselors when special issues rose to get more clarifications on the issues the same to special
needs students.
3.10.2 Questionnaire
This study was used because it is argued that questionnaire collects a large volume of
information from a large number of people on a limited budget and in short time
(Patton1990:14). Questionnaire was adopted because this study involved large number of people
of respondents who cannot be interviewed face to face. Furthermore it facilitated comparison and
statistical aggregation of data. The semi structured questionnaire used for both at schools head of
school and teachers. Questionnaires were tasted in small group (pilot study) to determine their
usefulness and reliability.

50
3.10.3 Focus Group Discussion
Focus group discussions method of data collection was employed in this study where mixed
group of participation (green, and Thorogood, 2009:93) it was used because as Patton,
(1990:335) argues it provides high quality data in a social context data, where participants
considers their views in the context of the others group members view this stimulates each group
to think and express opinion which in turn will lead more thought. In this study four focus group
discussion was held from each school where mixed groups of 3 students from form three, 3 from
form four and also two teachers were involved the aim was to capture different experiences. Also
special need students (disables) were purposively involved.
3.10.4 Observation
Direct observation method was used to capture some of the physical situations and realities
example existence of services like dispensary buildings at school, playing grounds, existence of
non teaching stuffs also guidance and counseling office at school compound. Also direct
observation was used because there are limitations on what people said in interview and
questionnaire so the reality was obtained by direct observation by researcher in schools.
3.10.5 Documentation
Documentation was used in the study which included published articles, un published articles,
magazine Various journals, published and unpublished articles, papers, theses, dissertations,
books and various reports also was hand and hand with electronic journals and books from
computer search and textual analysis based on media and written materials in the sampled
schools.

51
3.11 Data Collection
This study used both primary and secondary data collection methods. Primary data was collected
as helped in discovering the relation between costs and efficiency of schools to get realistic.
Secondary data on other hand was collected in order to find out what is known about the research
problem (Barbour,2008:16).
3.11.1 Primary Data Collection Methods
To collect reliable, representative and valid data triangulation research methods were used
because each method has its strength and weaknesses, these include observation, questionnaires,
interview, and group discussion.
3.11.2 Secondary Data Collection
Secondary data collection in this study was collected through conducting documentary review
where documentation tool used.
3.13 Validity and Reliability
Validity is the extent to which a test measure what actually wish to measure and Reliability
refers to the accuracy and precision of the measurement procedures Kothari (2004). To assure
validity and reliability the research tools were tested and retested to different people so as to see
whether they measure what intended to measure before the tools to used in the study so the data
collected in this study are valid and reliable.
3.13 Data Analysis
In the same way like the collection of data, triangulation was used in data analysis technique
analysis of data was done after editing, coding, and tabulation. Analysis was both descriptive and

52
inferential (statistical analysis) descriptive analysis based on information from the interviews and
FGDs while statistical analysis of results was from questionnaires and observational checklists.
The qualitative information were analyzed as what (Patton 1990:376) call cross-case analysis in
which answer were grouped together from different people using common questions from
interviews guide. These were augmented by relevant quotations from respondents wherever
possible and relevant. The quantitative data mainly from questionnaire were analyzed using
statistical package for social scientist. Triangulation of analysis helped qualitative and
quantitative analysis to yield simultaneous interpretation of results.
3.14 Ethical Issues Considerations
The researcher obtained a research permit from the Open University of Tanzania and Moshi
district council before conducting a study. However, as an ethnographic researcher was aware of
the following issues; the uses Kiswahili language in the field research during data collection
period since its main medium of communication especially for non-teaching stuff where question
was translated to Kiswahili by researcher and responses were filled by researcher in English. A
researcher also was aware of the importance of informed consent, confidentiality and anonymity.

53
CHAPTER FOUR
DATA PRESENTATION, ANALYSIS AND DISCUSSION OF STUDY FINDINGS
4.1. Introduction
This chapter presents the analysis and discussion of the study findings obtained from the field. It
further shows public secondary schools efficiencies under cost sharing period focusing on
teacher quality, individualized programmes and provision of social services in Vunjo sub district
public secondary schools (study area). The presentation and discussion under this Chapter bases
on three specific objectives stated earlier (see section 1.2.).
4.2. Characteristic of Respondents
Various respondents were consulted in order to get different opinions from different
stakeholders. The respondents who were selected were heads of schools who were selected
purposively, while other teachers snow ball used to select them and students were selected using
simple random sampling get population sample of the study as table 2 below illustrates
Status Category
of respondents
Schools Expected
Respondents
Who
responded
%Total
respondents
Heads of school All schools 07 05 4.4%
Teachers All schools 33 21 18.5%
Students All schools 126 87 76.9%
Total 166 113 100%
Table 1: Category of respondents (N=113)
Source: Survey data 2013

54
While the table below shows the total percentage compared to the expected respondents which
shows expected respondents percents;
Schools Expected
respondent
s
Who
responded
Total % of
respondents
over expected
Himo ss 24 24 14.4
Mieresini ss 20 20 12
Iwa ss 16 16 9.6
Ghona ss 18 18 10.8
Muungano ss 34 34 20.4
Meli ss 24 - -
Kimochi ss 29 - -
Total 166 113 68%
Table 2: Category of respondents (N=116)
Source: Survey data 2013
From the table above expected respondents were 166 from seven (7) schools but the table shows
total number of respondents who responded are 113 which makes (68%) of the expected
respondents. This was caused by two schools Meli ss and Kimochi ss went for holidays during
this study.
4.2.1 Respondents Age and Sex
The total number of respondents was 113 Out of those forty nine (49.6 %) were males while
(50.4%) were females. Statistics shows that in Vunjo Sub district female students are enrolled
more at secondary school compared to males. One reason for this gender imbalance could be
men‟s responsibilities as heads of families searching for family income (daily bread) as their

55
major role this lead most of male children after finishing their class seven they engage in small
businesses. The situation was different to the teachers where males were more compared to
female teachers. (See the table below);
Category Age Sex Total
Males Females
Teacher s 1-20 - 02 03
21-60 16 08 23
Students 1- 20 40 47 87
21-60 - - -
Total 56 57 113
Table 3: Categorizing Respondents‟ age and sex (N=113)
Source: Field data 2013
Table above shows that age of 1-20 males were ( 35.3%) of the total population while females
were (43%) of the total population on the other hand the age of 21-60 males were (14.1%) of the
studied population, While females were ( 7%) only of the total studied population. Field data
shows most of the respondents were aged 1-20 years and with total (78%) which most of it were
students while the age of 21-60 makes (22%) who are teachers. The obtained data shows that
female respondents were more in age of 1-20 compared to males while the age of 21-60 male
respondents were more compared to females (the age with teachers). Statistics indicates that
female student dropout is very high with increase in classes mostly in public schools. Several
factors like marriage, early pregnancy, sex preferences among parents, and failure caused by
family chores being mentioned as the reason for the dropouts. This study revealed that majority
of school dropout are female students and the situation shows that in higher classes they were
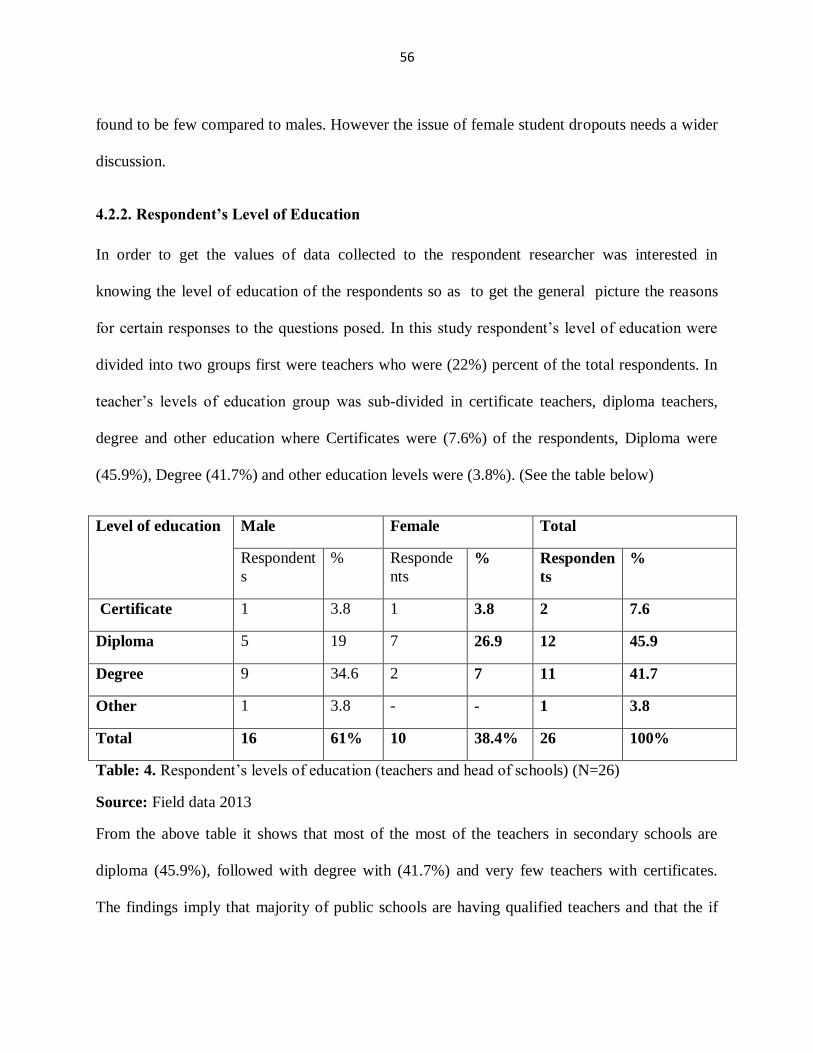
56
found to be few compared to males. However the issue of female student dropouts needs a wider
discussion.
4.2.2. Respondent’s Level of Education
In order to get the values of data collected to the respondent researcher was interested in
knowing the level of education of the respondents so as to get the general picture the reasons
for certain responses to the questions posed. In this study respondent‟s level of education were
divided into two groups first were teachers who were (22%) percent of the total respondents. In
teacher‟s levels of education group was sub-divided in certificate teachers, diploma teachers,
degree and other education where Certificates were (7.6%) of the respondents, Diploma were
(45.9%), Degree (41.7%) and other education levels were (3.8%). (See the table below)
Level of education Male Female Total
Respondent
s
% Responde
nts
% Responden
ts
%
Certificate 1 3.8 1 3.8 2 7.6
Diploma 5 19 7 26.9 12 45.9
Degree 9 34.6 2 7 11 41.7
Other 1 3.8 - - 1 3.8
Total 16 61% 10 38.4% 26 100%
Table: 4. Respondent‟s levels of education (teachers and head of schools) (N=26)
Source: Field data 2013
From the above table it shows that most of the most of the teachers in secondary schools are
diploma (45.9%), followed with degree with (41.7%) and very few teachers with certificates.
The findings imply that majority of public schools are having qualified teachers and that the if

57
there low performance of these schools in Kilimanjaro (Vunjo sub district) was not relating to
the quality of the teachers in the schools.
4.3 Number and Quality of Teachers in Public Schools
4.3.1 Number of teachers
The researcher sought to know the quality and number of teacher in secondary schools in this
study. The over roll idea of questing this was to cross-check why government or public
secondary schools had being experiencing that low performance compared to private schools, a
researcher thought to know whether the reason of this was relating to shortage of teachers in
public secondary schools. Questionnaires were used to solicit information (how many?) from
heads of schools, followed by cross checking the information from the list of the names of
teachers on the school notice boards. This information gave the actual number of teachers in each
selected schools according to their gender and level of education (below diploma and above
diploma). The table 6 below summarizes the obtained findings:
School name Diploma and above Below diploma Total
Male Female Male Female
Muungano s.s. 17 10 03 - 30
Himo s.s. 10 16 03 01 30
Mieresini s.s. 10 17 02 O2 31
Iwa s.s. 05 02 03 - 10
Ghona s.s. 10 05 04 - 19
Total 53 50 15 03 121
Table:5. Generalized teacher education level ( teachers)
Source: Field data 2013

58
From the table above it was found that most of the teachers in public secondary schools were
qualified teachers with diploma and degree which gives the picture that sometimes the low
efficiency of public schools was not related to the number of teachers the table above gives a
picture of the number and level of education of teachers in the selected secondary schools.
4.3.2 Quality of teachers
The researcher sought to know the quality of public secondary schools teacher‟s in Vunjo sub-
strict (the study area). A researcher used levels of education and actual classroom teaching
performance to analyze the quality of teachers. Questionnaires were used to get the level of
education and actual classroom observation used to see actual teaching efficiency in classes.
4.3.3 Teacher Levels of Education
A researcher used questionnaires to make analysis of teacher levels of education in Vunjo sub-
district (Study area) where general teacher‟s levels of education were obtained from heads of
schools questionnaire responses. The following information was obtained on the teacher‟s levels
of education the study; Certificates teachers were 12, Diploma teachers were 66, Degree were
42, while other education were only 4. The following figure summarizes the levels of education
in percentage;

59
Figure 2: Education levels
Source: Field data
The above figure data shows that certificate teachers were (9.6%) percent of the all teachers,
Diploma teachers were (54.8%) percent of all teachers, Degree teachers were (35.4%) percent
while other education levels covered (3.2%). However from the field it was found that teachers
on education levels quality of teachers were sufficient, though most of certificate teachers were
employed by schools to cover scarcity of science teachers like Basic mathematics, Chemistry and
Physics
From the table above it was found that most of the teachers in public secondary schools are
highly qualified with diploma (54.8%) and degrees (35.4%). This gives the picture that
sometimes the low efficiency of public schools was not related to the number of teachers and
quality of teachers in relation to academic credentials.

60
4.3.4 Teaching efficiency in Classrooms
Another attribute that a study used to analyze quality of teacher was through classroom teaching
efficiency where classroom observation method was used. A researcher specifically used non
participatory observation technique where the following were analyzed through researcher
observational checklist:
1. Classroom climate,
2. Individualized education programs,
3. The teaching that encourages self-regulated learning,
4. The teaching that provides different strategies to cater special needs,
5. The teaching that employs co-operative group teaching,
6. The teaching that employs peer tutoring,
7. The teaching that use reciprocal teaching,
8. The teaching that involves providing of teaching and learning materials, Researcher expressed
the findings in percentage where; very often stood for 100%, often-50%, occasionally-25% and
rarely/never stood for 0% percent. The following figure shows the findings,

61
Figure:3. Observed classroom teaching efficiency
Source: Field data
The figure it was above shows that Teaching that Creates friendly classroom climate;
Muungano(100%), Ghona(0%), Himo(50%), Mieresin(50%), Iwa(50%). The teaching that
employs individualized educational programs: Muungano ss (0%), Ghona ss (0%), Himo ss
(0%), Mieresini ss(0%), Iwa ss (0%.) The teaching that encourages self-regulated learning;
Muungano ss (0%), Ghona ss (25%), Himo ss(25%), Mieresini ss 25%, Iwa ss25%. Teaching
that provides different strategies to cater special needs; Muungano ss (0%), Ghona ss (0%),
Himo ss (0%), Mieresini ss (0%), Iwa ss (0%.) The teaching that employs co-operative group
teaching Muungano ss (25%), Ghona ss (50%), Himo ss (25%), Mieresini ss(100%), Iwa ss
(0%). The teaching that employs peer tutoring Muungano(100%), (Ghona0%), Himo(25%),
Mieresini ss (25%), Iwa ss (0%), Teaching that uses reciprocal teaching; Muungano ss (50%),
Ghona ss (50%), Himo ss (25%), Mieresini ss (25%), Iwa ss 25%. The teaching that involves
providing of teaching and learning materials, Muungano ss (50%), Ghona ss (50%), Himo
62
ss(25%), Mieresini (0%), Iwa ss(0%) The adaptation of appropriate and flexible curriculum
Muungano ss(50%), Ghona ss(50%), Himo ss(50%), Mieresini (25%), Iwa ss(50%) and the
application of formative in classes during teaching Muungano ss(50%), Ghona ss (50%), Himo
ss (25%), Mieresini ss(50%), Iwa ss(25%).
Statics and evidences generated from the fields implies that teaching efficiency still in some
extent a problem despites existence qualified teachers in public secondary schools example at
Muungano and Himo secondary schools where there are students with special need but still there
was no individualized educational programs and the teaching strategies that cater special need
students. As Jafari Muhamed one of the special need student (difficult in hearing) who had this
to say;
...You see … I can say I don‟t understand many things in class during teaching
because I cannot hear properly and most of teachers use low voices, when I try
to look on their mouths to get what they are saying they sometimes move or turn
to write something on the blackboard.. 1
Also it was the same case at Muungano ss where Amiri Juma (A student with albinism and eyes
sighting problem) had also the following to say;
… I don‟t see well on the chalk board especially when the hand writing is small.
I sometimes read from my neighbor‟s exercise book. But I know even him,
there a lot of information that he does not write. 2
The field obtained statements above implied that there were absence of individualized programs
and teaching strategies that cater special need students. Also it was observed that teachers were
not caring about the different needs of students despite the fact that they were well qualified
academically.
1 Interviewed by the researcher on 02
nd September 2013 at Himo secondary school.
2 Interviewed by the researcher on 06th September 2013 at Muungano secondary school

63
These findings correlate with the literature. For example, (Cheng, 1996) suggested that academic
qualifications are not enough to suggest that teachers are of quality. Other attributes such as work
experience, interpersonal relationship and inclination to teaching are essential ingredients.
Though it was found that other some schools had more teachers while other were having very
few teachers still the general over roll number of teachers in the study were enough but the
problem was the allocation of teachers where remote schools were not having enough teachers
like Iwa ss (see table:6 above) which shows there was a problem of unbalance in allocating
newly employed teachers.
A second determinant of teacher quality was to assess their effectiveness in relation to student
teachers ratio in Kilimanjaro, Vunjo-sub district (the study area). A researcher investigated on
the number of teachers compared to the number of students (student teacher ratio). This
information was also solicited through questionnaires and interview. The following number of
teachers and student were obtained from the schools studied as showed in the table bellow;
C/N SCHOOL
NAME
NO.
TEACHERS
NO.
STUDENTS
RATIO
1. Muungano 30 827 1:26
2 Himo 30 510 1:17
3 Mieresini 31 490 1:16
4 Iwa 10 473 1:47
5 Ghona 19 364 1:19
Table 6: Number of teachers and students at studied schools
Source: Field data 2013
The above table shows that; Muungano secondary had 30 teachers and 827 students with ratio of
1:26, Himo secondary had 30 teachers and 510 students with the ratio of 1:17, Mieresini had 31
teachers 490 students with ratio of 1:16, Iwa secondary had 10 teachers and 473 students with
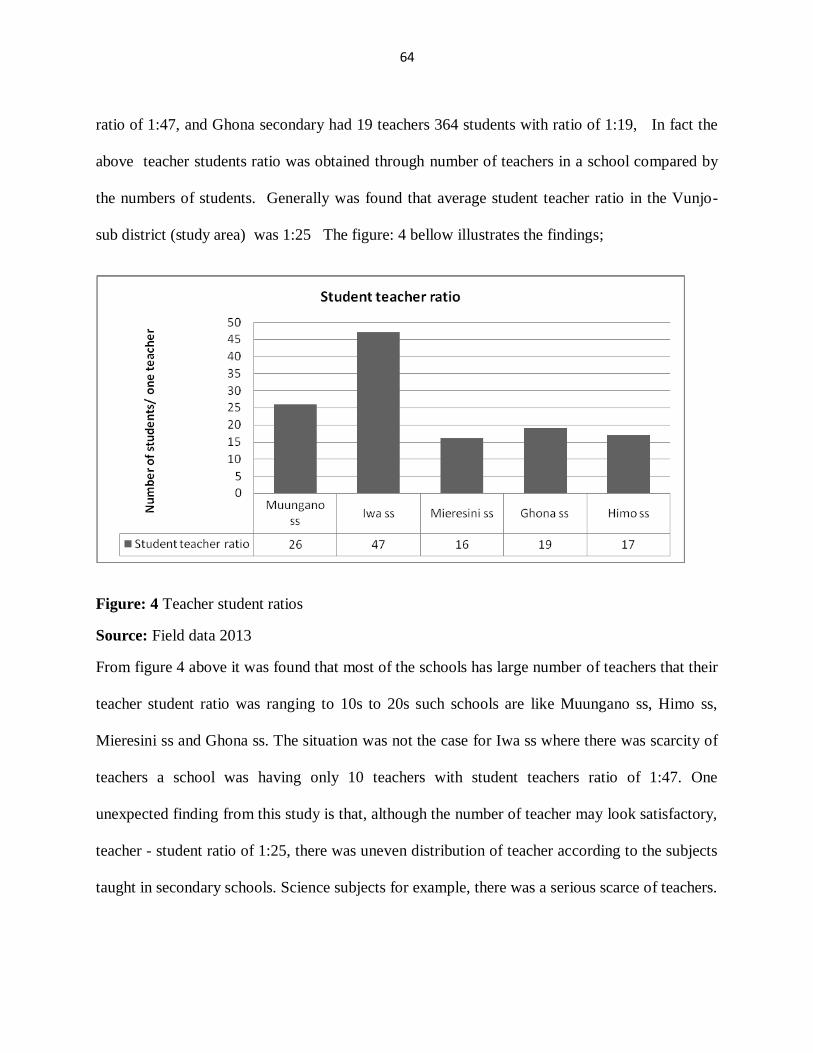
64
ratio of 1:47, and Ghona secondary had 19 teachers 364 students with ratio of 1:19, In fact the
above teacher students ratio was obtained through number of teachers in a school compared by
the numbers of students. Generally was found that average student teacher ratio in the Vunjo-
sub district (study area) was 1:25 The figure: 4 bellow illustrates the findings;
Figure: 4 Teacher student ratios
Source: Field data 2013
From figure 4 above it was found that most of the schools has large number of teachers that their
teacher student ratio was ranging to 10s to 20s such schools are like Muungano ss, Himo ss,
Mieresini ss and Ghona ss. The situation was not the case for Iwa ss where there was scarcity of
teachers a school was having only 10 teachers with student teachers ratio of 1:47. One
unexpected finding from this study is that, although the number of teacher may look satisfactory,
teacher - student ratio of 1:25, there was uneven distribution of teacher according to the subjects
taught in secondary schools. Science subjects for example, there was a serious scarce of teachers.
65
In some schools, the heads of schools employed unqualified teachers to fill the gap most of who
possessed form four and form six certificates, with no teacher training
These findings can explain the reasons why Tanzania is experiencing poor performance in
science subjects despite the fact that the ministry of Education is distributing teachers to
secondary schools
4.3.5 Summary of Findings
This section made an analysis of quality of teachers in secondary schools to the study area by
analyzing levels of education among teachers, teaching efficiency in classes and student teachers
ratio. The study findings showed that public schools are having qualified teacher basing on level
of education with diploma and degree for 87% which showed that the failure of students in
public schools does not relate to this quality. On teaching efficiency field data showed that
teacher did not teach by considering special need students for this to some extent it was found to
be among the causes of failure in public schools. And on teacher student ratio it was found that
there was very high disparity in student teacher ratios from 1:16 to1:47 among schools in the
study area also teachers were not distributed subject wise which resulted to employing un
qualified teachers to teach especially science subjects. This also to some extent is considered to
have contributed a lot to science subject failure in public secondary school in Kilimanjaro, Vunjo
sub- district.

66
4.4 Individualized Programs, Special Need and Low Performing Students
4.4.1 Special Need Students in the Schools
Among the benefit stipulated in the cost sharing was the institution of individualized education
programmes for special need students. The study investigated on existence of special need
students aim was to know whether there were special need students enrolled in the public
secondary schools and to investigate ability of these school to retain them. A researcher used the
questionnaires and interviews where questionnaires were admitted to the teachers who were
asked to state “Yes” if there were special need students or “No” if there were no special need
students. The study involved five secondary schools and the findings are summarized in the
figure below;
Figure 5: Responses on the existence of special need students
Source: Field data 2013
As the figure above illustrate among five (5) studied schools three of them which are Muungano
SS, Himo SS and Ghona SS were having special needs students which was (60%)percent of
studied schools and only two Mieresini SS and Iwa were not having special need students
which was (40%)percent of all studied schools.
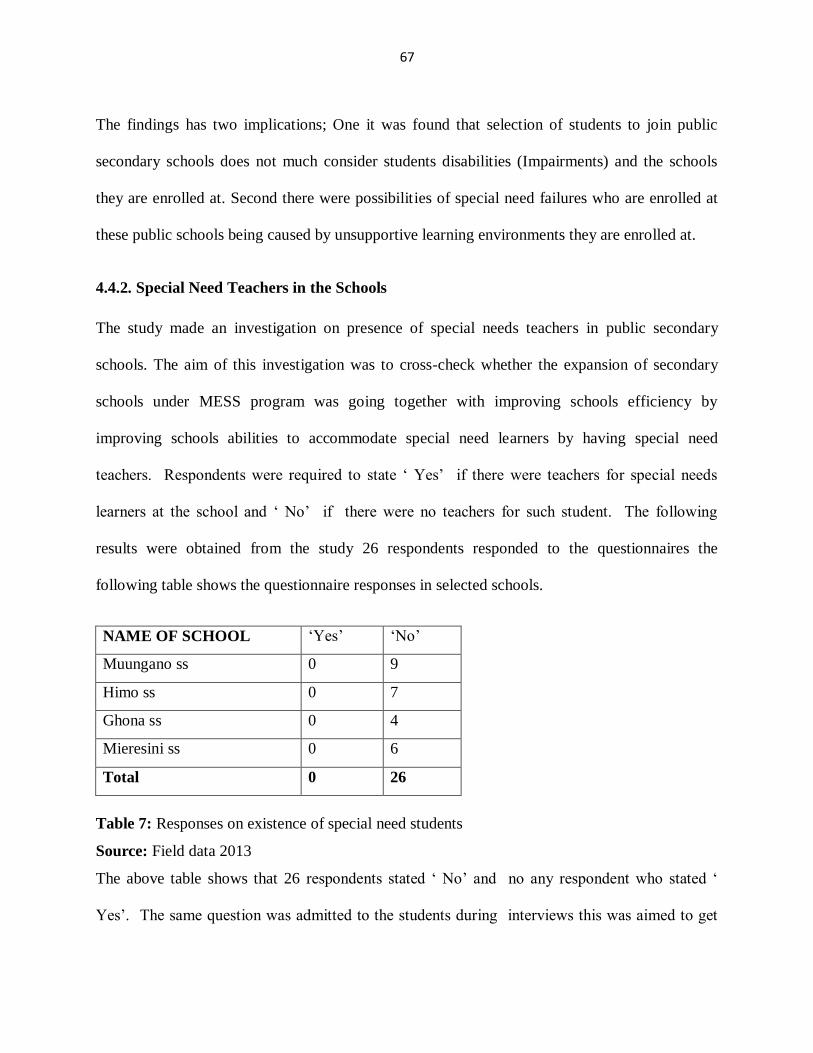
67
The findings has two implications; One it was found that selection of students to join public
secondary schools does not much consider students disabilities (Impairments) and the schools
they are enrolled at. Second there were possibilities of special need failures who are enrolled at
these public schools being caused by unsupportive learning environments they are enrolled at.
4.4.2. Special Need Teachers in the Schools
The study made an investigation on presence of special needs teachers in public secondary
schools. The aim of this investigation was to cross-check whether the expansion of secondary
schools under MESS program was going together with improving schools efficiency by
improving schools abilities to accommodate special need learners by having special need
teachers. Respondents were required to state „ Yes‟ if there were teachers for special needs
learners at the school and „ No‟ if there were no teachers for such student. The following
results were obtained from the study 26 respondents responded to the questionnaires the
following table shows the questionnaire responses in selected schools.
NAME OF SCHOOL „Yes‟ „No‟
Muungano ss 0 9
Himo ss 0 7
Ghona ss 0 4
Mieresini ss 0 6
Total 0 26
Table 7: Responses on existence of special need students
Source: Field data 2013
The above table shows that 26 respondents stated „ No‟ and no any respondent who stated „
Yes‟. The same question was admitted to the students during interviews this was aimed to get
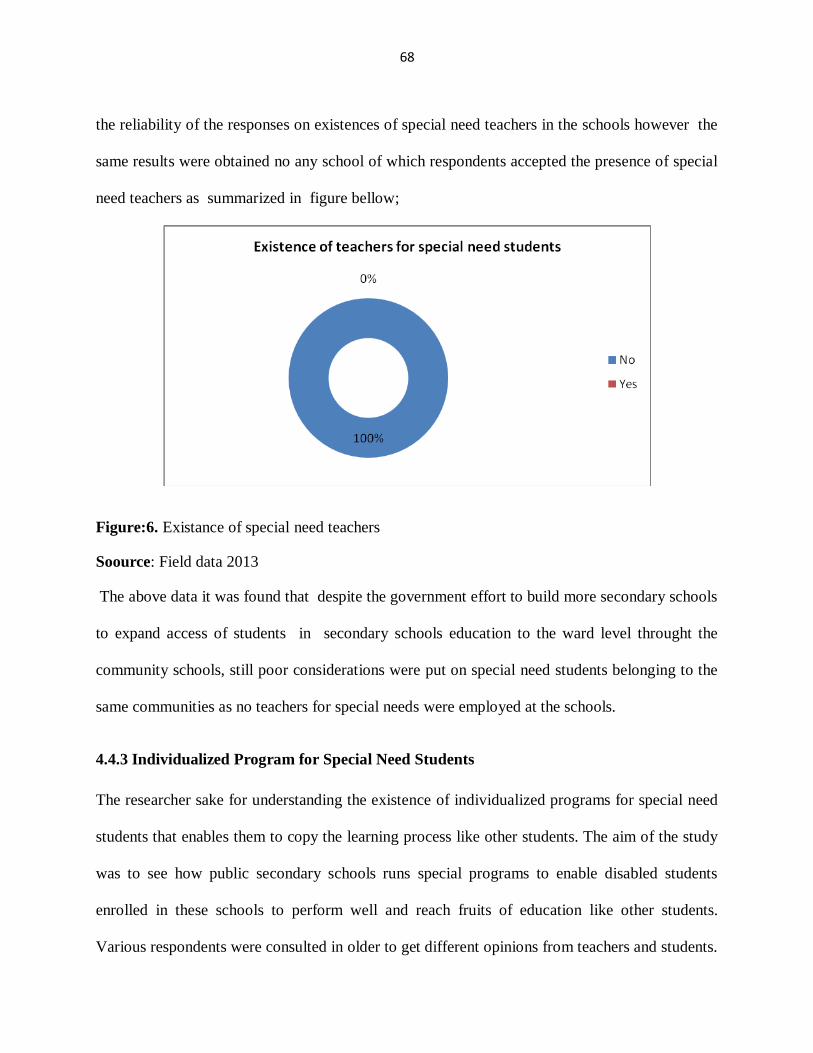
68
the reliability of the responses on existences of special need teachers in the schools however the
same results were obtained no any school of which respondents accepted the presence of special
need teachers as summarized in figure bellow;
Figure:6. Existance of special need teachers
Soource: Field data 2013
The above data it was found that despite the government effort to build more secondary schools
to expand access of students in secondary schools education to the ward level throught the
community schools, still poor considerations were put on special need students belonging to the
same communities as no teachers for special needs were employed at the schools.
4.4.3 Individualized Program for Special Need Students
The researcher sake for understanding the existence of individualized programs for special need
students that enables them to copy the learning process like other students. The aim of the study
was to see how public secondary schools runs special programs to enable disabled students
enrolled in these schools to perform well and reach fruits of education like other students.
Various respondents were consulted in older to get different opinions from teachers and students.
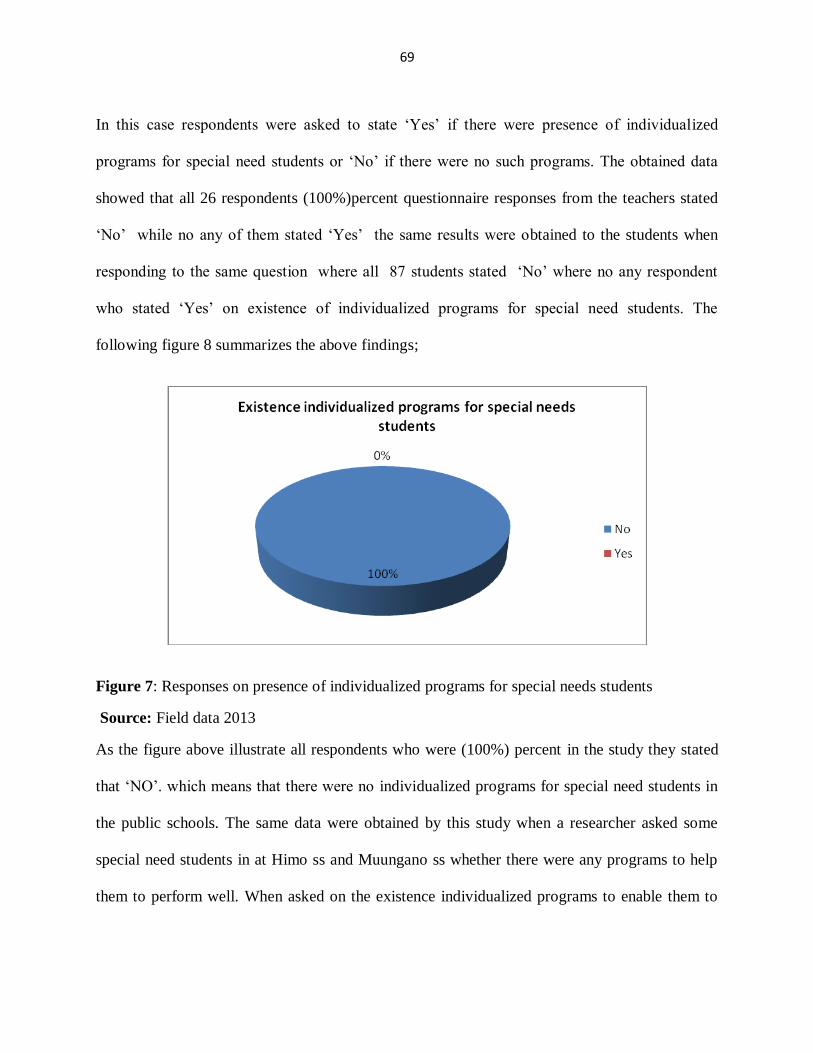
69
In this case respondents were asked to state „Yes‟ if there were presence of individualized
programs for special need students or „No‟ if there were no such programs. The obtained data
showed that all 26 respondents (100%)percent questionnaire responses from the teachers stated
„No‟ while no any of them stated „Yes‟ the same results were obtained to the students when
responding to the same question where all 87 students stated „No‟ where no any respondent
who stated „Yes‟ on existence of individualized programs for special need students. The
following figure 8 summarizes the above findings;
Figure 7: Responses on presence of individualized programs for special needs students
Source: Field data 2013
As the figure above illustrate all respondents who were (100%) percent in the study they stated
that „NO‟. which means that there were no individualized programs for special need students in
the public schools. The same data were obtained by this study when a researcher asked some
special need students in at Himo ss and Muungano ss whether there were any programs to help
them to perform well. When asked on the existence individualized programs to enable them to
70
perform well. Jafari Muhamed (Himo ss) one of the special need student (Difficult in hearing)
had this to say;
„There are no such program in our school, no one knows about them. .3
Another student, Amiri Juma (A student with albinism and eyes sighting problems) who had also
the following to say;
„No, there are no such programmes in this school. 4.
The above findings implies that there were absence of individualized programs and teaching
strategies that cater special need students and also the teacher had less considerations on schools
on special needs students. The finding gives the meaning that, public secondary schools in Vunjo
sub-district has no ability to enables students with special need to perform well and reach what
Jean Rousseau call “Fruits” of education.
4.4.4 Individualized Programs for Low Performing Students
Also a researcher sought to know if there were individualized programs for low achieving
students the a researcher was interested to see the ability of public schools to run programs to
help students with low achieving or learning difficulties to improve their performance. The aim
was to trace the ability of public secondary schools to run special programs to enable low
performing students enrolled in these schools to perform well so as to reach the fruits of
education like other students.
Different respondents were consulted in older to get different opinions from teachers and
students. In this case respondents were asked to state „Yes‟ if there were presence of
3 Interviewed by the researcher on 02
nd September 2013 at Himo secondary school
4 Interviewed by researcher on 06th September 2013 at Muungano secondary school

71
individualized programs for low performing students or „No‟ if there were no such programs.
The obtained data showed that all 26 (100%) percent of responses from the teachers they stated
„No‟ while no (0%)percent stated „Yes‟ the same results were obtained to the students when
responding to the same question where all 87 students stated „No‟ where no any respondent
who stated „Yes‟ on existence of individualized programs for special need students. The findings
are summarized in figure 8 below;
Figure 8: Responses on presence of individualized programs for low performing students
Source: Field data 2013
As the figure above illustrates all (100%) percent of respondents they stated that there was no
individualized program for low performing students. Therefore the findings have the implication
that there were no individualized programs for low performing students in public schools. It was
also found that low performing students enrolled at public secondary schools are likely to fail
their final examinations, which shows low efficiency of public secondary schools in Vunjo sub-
district.
However a researcher realized that there some programs designed by schools like remedial
classes and extending teaching hours which involved all students and giving the possibility of

72
students who are low achieving to remain back while fast achiever to perform more and
widening the gap between fast achiever and low achiever in the school. With support to this,
during interview with student one student (Princess Kessy) when explaining against remedial
classes. She has this to say; classes. She has this to say;
“Remedial and extended class hours does not help low achieving students because
what is taught in remedial classes is a continuations of what was taught in the
classroom.5”
The same were given by the students at Mieresini and Iwa secondary schools who has this to say;
“Actually we don‟t have individualized programs for special need students and low
performing students what we are having is just like tuition on Saturdays where
students come with two hundred each for studying and it being paid before to inter
the class.” 6
The respondents explanations showed that even the newly established enrichment classes by the
ministry of education and vocation training under “Big result Now”(BRN) program was not well
understood by all studied schools where all students are being involved in the program instead of
low performing students. It was found that still tuition activities are still done in schools where
students from poor families are segregated in extra studies like and special teaching and learning
programs when fail to for the program cost which shows that students from poor families
enrolled the schools there were possibilities to fail their examination at public schools compared
to students from well-off families
4.4.5 Summary of Finding
The findings in this section shows that despite of existence of special need students in public
secondary schools for 60% of all studied schools but there was no programs designed for special
5 Interviewed by the researcher on 06
th September 2013 at Muungano secondary school
6 Interviewed by the researcher on 03rd September 2013 at Mieresini secondary school

73
need and low achieving students in the schools, also it was found that still there was no teachers
for special need learner in the schools. However it was observed that even the remedial classes
were not designed for low achieving but it was for students who can pay for it where students
from poor family are segregated from the remedial classes. This shows the possibility of
students from poor family to fail in public secondary school by failing to pay for remedial costs
as it has explained above that what is taught in remedial classes are continuations of what taught
in classes.
4.5 Social Services at the Schools
To understand the effectiveness of cost sharing, one of the aspects is the availability of quality
social services provided in public schools Observational checklist and interview with students
were used to solicit information about social services. Observation was done by walking around
the schools environments and recording the availability and quality of various social services
found in the schools where services such as Water, Food, Electricity, Shop, Telephone,
stationary, transport and Health services were observed. On making analysis of social services a
researcher used 100% for available and adequate, 50% for available but inadequate and 0% for
Not available when making analysis of quality of social services and the obtained data are
summarized in the table following table :
SERVICES No. of school
with the service
No. Studied
schools
Percent %
Water 02 05 40%
Food 05 05 100%
Electricity 03 05 60%
Shop 01% 05 20%
Telephone 0 05 0%
Stationary 0 05 0%
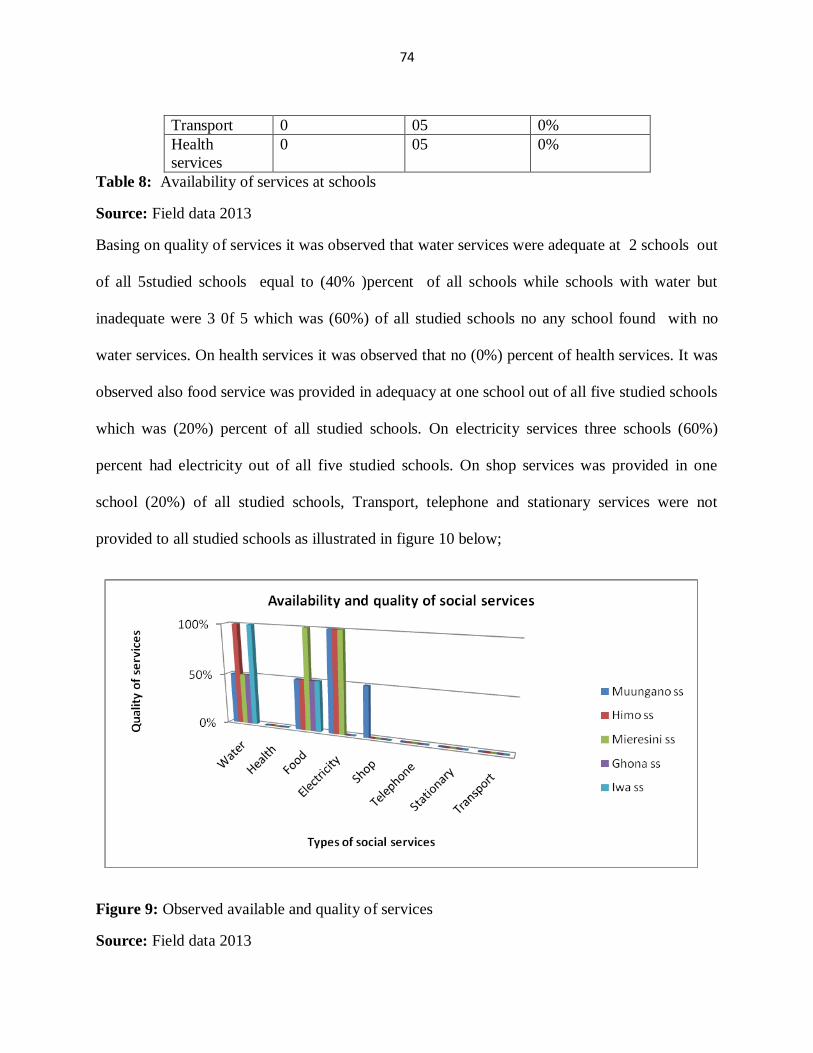
74
Transport 0 05 0%
Health
services
0 05 0%
Table 8: Availability of services at schools
Source: Field data 2013
Basing on quality of services it was observed that water services were adequate at 2 schools out
of all 5studied schools equal to (40% )percent of all schools while schools with water but
inadequate were 3 0f 5 which was (60%) of all studied schools no any school found with no
water services. On health services it was observed that no (0%) percent of health services. It was
observed also food service was provided in adequacy at one school out of all five studied schools
which was (20%) percent of all studied schools. On electricity services three schools (60%)
percent had electricity out of all five studied schools. On shop services was provided in one
school (20%) of all studied schools, Transport, telephone and stationary services were not
provided to all studied schools as illustrated in figure 10 below;
Figure 9: Observed available and quality of services
Source: Field data 2013
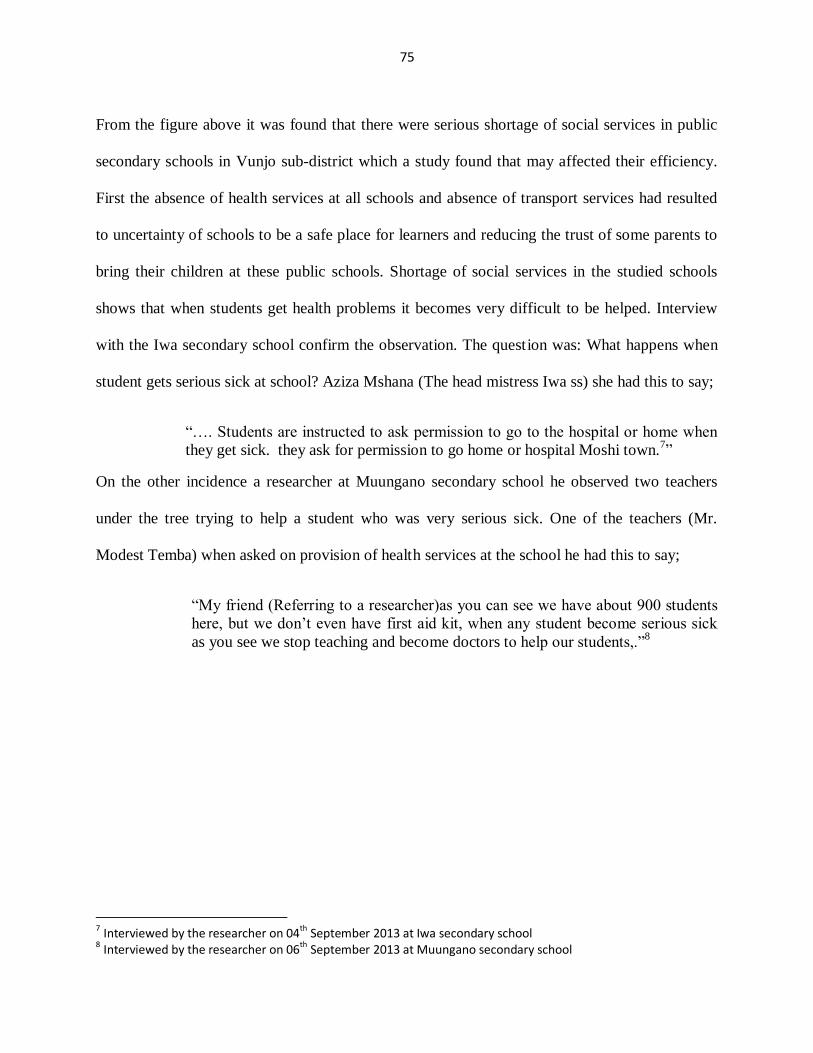
75
From the figure above it was found that there were serious shortage of social services in public
secondary schools in Vunjo sub-district which a study found that may affected their efficiency.
First the absence of health services at all schools and absence of transport services had resulted
to uncertainty of schools to be a safe place for learners and reducing the trust of some parents to
bring their children at these public schools. Shortage of social services in the studied schools
shows that when students get health problems it becomes very difficult to be helped. Interview
with the Iwa secondary school confirm the observation. The question was: What happens when
student gets serious sick at school? Aziza Mshana (The head mistress Iwa ss) she had this to say;
“…. Students are instructed to ask permission to go to the hospital or home when
they get sick. they ask for permission to go home or hospital Moshi town.7”
On the other incidence a researcher at Muungano secondary school he observed two teachers
under the tree trying to help a student who was very serious sick. One of the teachers (Mr.
Modest Temba) when asked on provision of health services at the school he had this to say;
“My friend (Referring to a researcher)as you can see we have about 900 students
here, but we don‟t even have first aid kit, when any student become serious sick
as you see we stop teaching and become doctors to help our students,.”8
7 Interviewed by the researcher on 04
th September 2013 at Iwa secondary school
8 Interviewed by the researcher on 06th September 2013 at Muungano secondary school
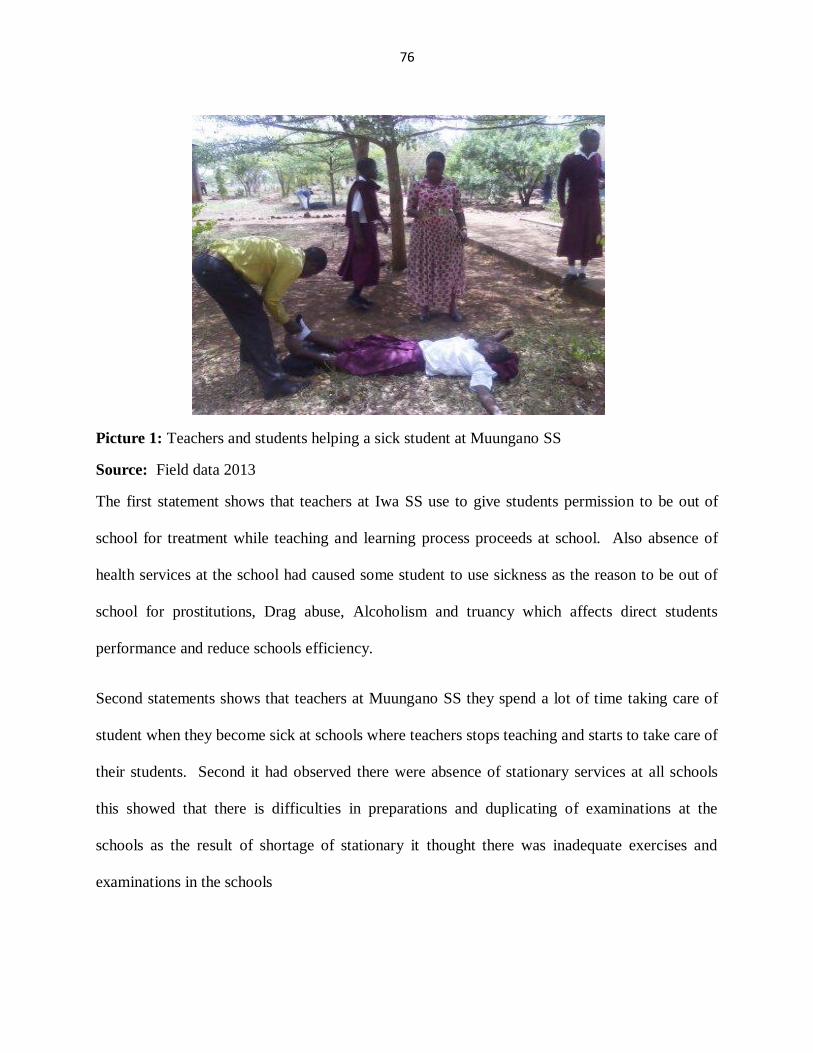
76
Picture 1: Teachers and students helping a sick student at Muungano SS
Source: Field data 2013
The first statement shows that teachers at Iwa SS use to give students permission to be out of
school for treatment while teaching and learning process proceeds at school. Also absence of
health services at the school had caused some student to use sickness as the reason to be out of
school for prostitutions, Drag abuse, Alcoholism and truancy which affects direct students
performance and reduce schools efficiency.
Second statements shows that teachers at Muungano SS they spend a lot of time taking care of
student when they become sick at schools where teachers stops teaching and starts to take care of
their students. Second it had observed there were absence of stationary services at all schools
this showed that there is difficulties in preparations and duplicating of examinations at the
schools as the result of shortage of stationary it thought there was inadequate exercises and
examinations in the schools

77
4.5.1 Availability of Non-Teaching Stuffs to Provide Social Services at the School
Among the reason for rapid growing of costs in public secondary schools was reported to aim at
improving schools efficiency by employing teaching and non-teaching stuff to provide various
social services at public schools. The study made an investigation on existence of non teaching
stuffs in public secondary schools in Vujo sub-district (study area). The study aimed to see
whether there were non-teaching stuffs who were employed to provide various services at public
schools. A researcher interviewed students on existence of non–non teaching stuffs who are
employed to provide social services at their schools. The study went further by interviewing
heads of schools and teachers the same question on existence of non teaching stuff to provide
various social services at the school.
Through questionnaires the study asked on existence of non-teaching stuff employed for the
provision of various services, guidance and counseling services and sports like football,
basketball and netball. The question required the respondents to put „No‟ or „Yes‟ to the service
if there was no such non-teaching stuffs or yes if there were non-teaching employed for the
service listed. The table below shows the results;
Schools Sports and games Guidance and counseling Health services
YES NO YES NO YES NO
Muungano 0 8 0 8 0 8
Himo 0 6 0 8 0 8
Mieresini 0 4 0 4 0 4
Iwa 0 4 0 4 0 4
Ghona 0 4 0 4 0 4
Total 0 26 0 26 0 26
Table 9: The existence of non teaching to provide the services at schools

78
Source: Field data 2013
The table above shows that Muungano ss „Yes‟ 0 (zero) „No‟ all 8 (eight) respondents, Himo ss
„Yes‟ 0 (zero) and „No‟ all 6 (six) respondents Ghona ss „Yes‟ 0 (zero) and „No‟ all 4 (four)
respondents Iwa ss „Yes‟ 0 (zero) and No all 4 four respondents and Mieresini ss „Yes‟ 0 (zero)
and „No‟ all respondents, On the other hand students were interviewed on the existence of non
teaching stuffs employed in their schools to provide such services all students responded that
there were no non-teaching stuff at their schools to provide guidance and counseling services,
Sports and games and health services social. The findings are illustrated in figure bellow;
Figure 10: Existence of non-teaching stuffs
Source: Field data 2013
The figure above shows that among all five (5) studied schools there were no any school with
non-teaching stuff for guidance and counseling, health services and guidance and health services.
Therefore these findings has three implications; Fist despite of many educationist insists on the
importance of social services at schools like health services, Guidance and counseling , and
physical exercise that has positive impacts to students performance as well as school efficiency
still there was no any effort done by the government to make it practical at public schools. This

79
had reveled in the study where no any non-teaching stuff who had being employed to prove such
services at the studied public schools.
Second it was found that despite of the fact that secondary students are mostly in the age body
physical changes like adolescence age and its challenges like early pregnancies, drugs abuse,
naught behaviors etc still there was absence of non-teaching stuffs for guidance and counseling
in public secondary schools. Third despite of recent reported of students miss behaving like drug
abuse, Fighting with teacher example in Bagamaoyo, Early Pregnancy, Early marriages,
Truancy and recent NECTA reported insults of some of CSEE candidates when attempting their
examinations but in fact still there were no government effort to employ counselor to rescue the
situation in public schools.
4.5.2 Other Social Services Provided at Schools
A researcher thought to know the availability of necessary services at schools that enables all the
students including those with special needs to feel comfortable at the school. A researcher
worked around the school environment and making observations on availability of toilets at the
schools and at the classes and hostels buildings he made an observation on wheel chair entrances
at the school buildings. The aim of researcher was to see if the public secondary schools
environments were positive to all the students including those with special needs. Unfortunate it
was found that among all schools which were studied no any school with accessible toilets to
those with physical impairments, and wheel chairs path to their classes and hostels as showed in
the picture bellow;

80
Picture 2: A class with no wheel chair path at Himo Secondary School
Source: Field data 2013
Therefore, adhering to the picture 1 above its obvious that Moshi district council engineers and
technicians doesn‟t recognize disables students when constructing the classes. It was observed all
building had steps for pedestrian only. The situation was worse at Himo ss where some classes
steps found at the school gave difficulties even the pedestrian‟s students to inter the classes it
was worse to disables. This showed that public secondary schools in vunjo sub-district were
unfriendly to disables.
A research thought to understand the quality and availability of other social services provided in
schools Kilimanjaro Vunjo – Sub district (Study area). A researcher used observations of
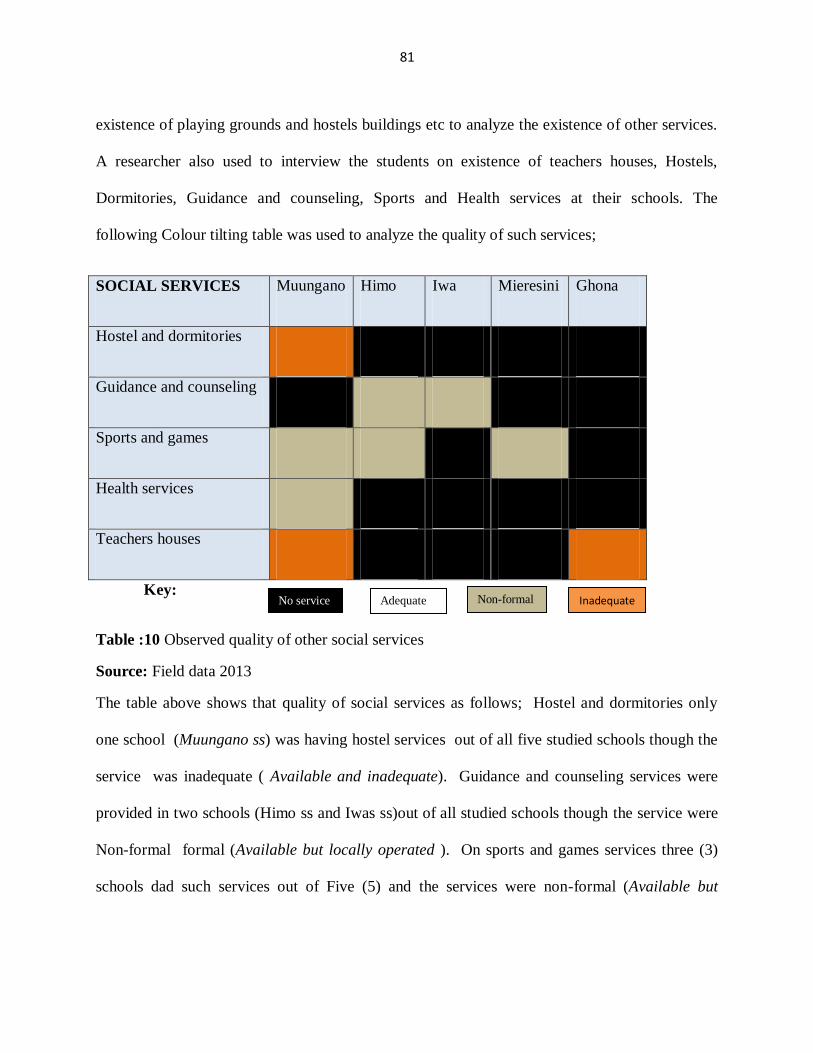
81
existence of playing grounds and hostels buildings etc to analyze the existence of other services.
A researcher also used to interview the students on existence of teachers houses, Hostels,
Dormitories, Guidance and counseling, Sports and Health services at their schools. The
following Colour tilting table was used to analyze the quality of such services;
SOCIAL SERVICES Muungano Himo Iwa Mieresini Ghona
Hostel and dormitories
Guidance and counseling
Sports and games
Health services
Teachers houses
Key:
Table :10 Observed quality of other social services
Source: Field data 2013
The table above shows that quality of social services as follows; Hostel and dormitories only
one school (Muungano ss) was having hostel services out of all five studied schools though the
service was inadequate ( Available and inadequate). Guidance and counseling services were
provided in two schools (Himo ss and Iwas ss)out of all studied schools though the service were
Non-formal formal (Available but locally operated ). On sports and games services three (3)
schools dad such services out of Five (5) and the services were non-formal (Available but
Non-formal Adequate No service Inadequate

82
occasionally operated). The obtained findings are summarized in the table bellow in
percentages;
Figure 11: Summarized other social services provied in public schools
Source: Field data 2013
The data summarized above shows that the availability of hostel services at public secondary
schools were for (20%) percent which shows that about (80%) percent of public secondary
schools had no hostels services. It was also found that though the hostels were available for just
20% of public schools but the services even in the schools where they were found the hostels
were inadequate. The absence of hostel services it had affected public secondary schools
efficiency as it has believed that there is great role of hostels and dormitories in retaining
students and controlling school dropouts, giving more time for private studies (especially girls)
who educationist suggests that no way to improve female performances in Africa is through
separating them from their family chores which can be attained through having hostels in
83
schools. The absences of hostel services in public secondary schools affect student‟s
performance by shortage of time for studying especially girls, as the result affects school
efficiency in general.
Through the interview, the researcher was able to corroborate the data from the observation. The
question was: As a counselor, where did you get the training? It was found that Guidance and
counseling services were available for 40% percent of schools in the study though services were
done locally and volunteered (Non formal). It was also found that the teachers who provided
guidance and counseling services they did not attend any training on guidance and counseling
activities, as one of the teachers (the guidance and counseling teacher) responds:
“I have been doing guidance and counseling services for over ten years now.
Although I was not trained as a counselor, I have provided wisdom to many
students, and some teachers without a need for training.9”
In another school, a teacher who was assuming the role of a counselor had this to say:
“All secondary school teachers are expected to counsel and guide students. I use
my own experience as a long time teacher, and I have not encountered any
problem. 10
”
From the above statement it was found guidance and counseling services that were provided in
many secondary schools were not done by professional counselors but teachers who were
selected at the schools. It was also found that even the services were not situational counseling
but experiential counseling which is discouraged to be used to the youth ages and scientific areas
like schools.
9 Interviewed by the researcher 04
th September 2013 at Iwa secondary school
10 Interviewed by the researcher 04th September 2013 at Ghona secondary school
84
It has being believed secondary schools students are found in early youth stage which need more
guidance and counseling services so as to control them from immoral behavior like drugs abuse,
alcoholism, truancy and early pregnancy. This shows that absence of guidance and counseling
services in the public secondary schools it thought to impact on immoral manners in public
secondary schools such as early pregnancy, school dropout, drugs abuse, alcoholism and truancy
which had lowered student‟s performance and reduced the schools efficiencies.
Sports and games were conducted in only in (60%) of all public schools studied, however it was
found that all schools sports were conducted in non formal ways, where there were no specified
time for sports and games. All sports were conducted occasionally especially in times of
UMISETA for one or two weeks only and types of sports done were only foot ball and netball
annually. It was also found that (20%) of the public schools in the study did not have even
playing ground which means that no any sport activities that done at the schools. On other hand
it was also found that (20%) of the schools had playing grounds but they did not have sports and
games activities at al. Such schools are like Ghona secondary had playing ground but no sport
activities was done at the school. The researcher overheard one of the teachers, Mr. Kileo(the
second master) saying:
“If it is about games, we had not materials for sport activities. Games were
encouraged when all the secondary schools were government schools, when
children used to compete. But with liberalization of economy and private schools
now coming up, schools are more concentrated in academic activities. The
competition now is in the academics, not in the games11
”
From statement above it was observed that sports and games are being given less priority among
heads of schools compared to other activities, it was also found that head of schools interpreted
11 Interviewed by the researcher on 05th September 2013 at Ghona secondary school

85
that sport and games are just wastage of time for learners. From the above statement it was found
that there was no policy legal system which governs the operations of social activities at schools
like sport and games. From the statement above it looks that operations of sports and games at
the schools depends on the interest of heads of schools not regarding role of sports and games to
students and school in general like physical health of students and sport and games power to
refresh, entertain, retain, control truancy and school dropouts.
On teachers houses services public schools were available in (40%) percents of all studied
schools though the houses were inadequate compared to needs of teachers at the schools where
they were found, (60%) of the public schools they did not have teachers houses. This implies
that the shortage of house services had great contributions to shortage of teachers in public
schools where teachers in public schools look for private schools in search of such services,
which results in shortage of teachers in public schools and lowering schools performance and
efficiency
4.5.3 Chapter Summary
This chapter had assessed the efficient of public school in Vunjo sub district (Study area) by
analyzing Quality of teachers, teaching efficiency, Availability of individualized programs for
special need and low performing students and availability of social services at schools. It was
observed that for quality, public schools have qualified teachers with diploma and degree also it
was observed that despites of these school to enroll special need students still there were neither
teacher for special needs nor individualized programs for special need and low performing
students in the schools, on social services it was

86
CHAPTER FIVE
SUMMARY, CONCLUSION AND RECOMMENDATIONS FOR FURTHER
RESEARCH
5.1 Introduction
The main purpose of this Chapter is to provide a summary of the study and the conclusion of
what was found in chapter 4.
5.2 Summary of the Study
Generally this study attempted to examine the efficiencies of public secondary schools under this
cost sharing period. Chapter 1 discusses about the background of studies, statement of problem at
hand its objective, research question significances of this study and limitation of the study.
Chapter 2 dwells on theoretical considerations, empirical literature review basing in quality of
teachers, individualized programs for special need and low achieving students, social services in
schools and lastly conceptual framework. Chapter 3 presents the methodology of data
collections, scope of study, study population, research tools and data analysis. Chapter 4 focused
on characteristics of study populations, and analysis and discussion of the study data in quality of
teachers, individualized programs for special need and low achieving students and social services
in Vunjo sub-district (study area).
Specifically, the study sought to examine quality of teachers and the existence of various social
services including individualized programs for special need and low performing students in the
selected public secondary schools at Vunjo sub-district Kilimanjaro region.

87
5.3 Discussion of the Findings
The Tanzania public secondary schools were experiencing the alarming low performance since
the late of 2000s this wave of low performance started to take place at the time on one hand
when secondary schools education stakeholders (parents students etc) were beginning to
experiencing severe education cost hardships resulting from Structural Adjustment Program s
(SAPs) adopted by the government since 1990s, and on the other hand, the predominance of
trade liberalization was promoting the growth of free trade which emphasis was on market
economy, privatization and private investment. It was thus, the time when more emphasis on
development of private secondary schools took place.
The government thought to put efforts to improve the public schools efficiency through cost
sharing, Decentralizations of public secondary schools (SBM) and community involvements. It
was out of the government‟s efforts several contributions were shouldered to parents for their
children secondary school education like food, school fees, chair and tables, papers contributions
etc in fact money and materials. Despite the government efforts recent CSEE results shows that
there was rapid fall in performance among public secondary schools compared to private
schools.
But more importantly, mostly of government efforts to improve public secondary performance
are basing on administrative structures and less concerns had being put on social services
provided at public secondary schools, teaching and learning processes at school, strategies to
help special need/low performing students and number and quality of teachers in public
secondary schools. This study with confidence, observed that poor social services at public
secondary schools, absence of individualized programs for special need and low performing
88
students and unbalance of teachers to have contributed to low efficiency of public secondary
schools.
These results suggest that cost sharing does not promote effectiveness in secondary schools in
Vunjo sub-region. However we would argue that, because of lack of focus in training teachers
alongside the subjects taught in secondary schools and giving priority to services needed in
secondary schools, the results of this study provide stronger evidence about what is really
happening in secondary schools in cost sharing era. The results of this study support the idea that
there are substantial differences between cost sharing and total government support in raising
school efficiency in secondary schools.
If enough and quality teachers were trained and equally distributed, these findings would suggest
that the efficiency or inefficiency in secondary schools were brought about by the number and
quality of teachers. Similarly, the difference in school effectiveness measured by the availability
of necessary services would be enough to have policy significance.
5.4 Conclusion
The notation of efficiency of public secondary schools draws upon a number of different issues
and institutions planners and district councils. Issues relating to provision of health services at
the schools, provision of guidance and counseling services, sports and games are all having
impacts on relative success of schools efficiency. No single institution has over roll
responsibility for efficiency of public secondary schools and progress needs to involve a wider
range of government sectors and private sectors organizations. This underlines the importance of
all key stakeholders working effectively in order to have well coordinated approach for
addressing educational challenges.

89
The government will be able to develop flourishing school efficiency if guidance and counseling
services, various sports and games services and health services will be provided at school.
Individualized programs for special need and low performing students, and assuring equal
distributions of teachers in rural and urban areas where public schools are found. For this to
occur, different government ministries and sectors have to be involved to reach that goal.
Example the provision of health services at public secondary schools will be attained if the
ministry of education and vocation training and Prime minister‟s office Regional administrations
and local governments will work together with the ministry of health to attain that goal. Is out of
the same truck other ministries will be involved like ministry of sports affairs, transport and
communication etc will be involved to reach the goal.
However the ministry of education and vocational training to maintain the quality of social
services provided at the schools the employment of teaching stuffs should go together with that
of non-teaching stuffs to work in the schools to provide various services at schools such as health
services and guidance and counseling services which are very potential at schools and needs non
teaching professions. On other hand in its known that learning needs and ability differs among
learner where learner possess individual learning differences and needs for learning, with regard
to this public secondary schools should establish individualized programs for special need and
low performing students so as to improve their efficiency.
Efficient schools is therefore as started earlier, a particular facet of learning environment which
pose both efficient classroom learning activities and efficient social services at school, where in
class conditions learning activities involves created friendly classroom climate for all learners,
Individualized learning programs, self regulated learning activities, learning that provides

90
different strategies to cater special needs, co-operat.ive group learning, Teaching employs peer
tutoring, teaching employ reciprocal teaching, providing of teaching and learning materials,
adapts appropriate and flexible curriculum and the school that employs formative assessment.
While on social services an efficient social have services like Teachers houses, health services,
sports, dormitories, food, water, guidance and counseling services, electricity, shop, stationary
and transport services at school. And therefore the efficient classroom learning activities help
learners despite of their differences in learning ability and needs to perform well and social
services at school help learner to develop physical and psychological health which help learners
to settle in their mind for teaching and learning activities.
5.5 Implication of the Study Findings
Measuring the relationship between cost sharing and school efficiency in terms of students‟
completion rate and academic performance is an important topic in the field of education due to
the ongoing battle for funding educational systems like schools. Schwartz et al., (2005) argue
that it is important to study school efficiency so as to understand strength and weaknesses of
policies and their implementations. This study after studying the efficiency of public secondary
schools in Vunjo sub-district specifically to number and quality of teachers, existence of
individualized program for special need and low achieving learners and existence of social
services the above discussed study findings in 5.3 has the following implications to the
implementation of cost sharing policy of Tanzania.
Cost sharing had contributed very little to the efficiency of public secondary schools as it has
found that there has been no expansion of social services in schools and though there is
increasing the number of teachers still distribution of them is not done equally rural and urban

91
schools and lastly the teaching in classes in these public secondary schools do not cater special
need and low achieving learners in Vunjo sub-district Kilimanjaro.
5.6 Recommendations
Based on presented results, discussion and conclusions several issues would need to be
addressed in order to enhance efficiency of public secondary schools. The following
recommendations are among the issues that can be addressed to improve sustainability of the
teaching and learning processes at public schools, provision of social services at the schools and
implementation of policy but further more importantly providing areas for further research;
The entire Moshi district council (MDC) should put first priorities to remoteness area secondary
schools when allocating new employed teachers so as they reduce the scarcity of teacher in
remoteness schools, this should be going together with restrictions of transferring teachers from
remoteness schools.
The government should now put emphasis to rural development programs like to ensure supplies
of social services such as electricity, tarmac roads, water and health services in rural and remote
areas so as to retain teachers and students at the working areas so as they wont transfer to urban
centers in search of the services.
Specific recommendations includes establishing of active sports and games programs in
secondary schools which go together employing non- teaching stuffs for sports and
games at public secondary schools so as help physical health of students and rise talents
of students in sport and games.
92
There should be integrations of different sectors like health, national housing, sports and
games sector with education sector so as to easier the provision of services like health
services and sport services at schools and assuring the quality of such services. This
should go together with stopping teachers to give tablets to the sick students.
The government should put strong considerations on employing non teaching stuffs to
provide social services like guidance and counseling at schools, this will help the students
in public secondary schools from immoral behaviors like drug abuse, prostitutes,
notorious behaviors which lowering their performance and their schools in general
Science taking students be further encouraged and the employment of science teacher be
further encouraged so as to promote science subjects in secondary schools in
Kilimanjaro, also MDC should put more emphasis in requesting science teachers to the
central government and assuring the distributions of the science teachers employed is
done equality and more consideration being put to the schools with shortage of the
teachers, this will reduce the existing problem of the schools to use unqualified teachers
(certificates, and form six leaver) to teach science subjects at public secondary schools.
Specifically teachers should be reminded on the use of teaching strategies that carter
special need and low achieving students during teaching and learning process. This will
reduce the perceived fear of failing among special need students and low performing
students enrolled at public secondary schools and encourage parents to take their children
at the schools.

93
The National housing corporation (NHC) should put considerations on constructing
hostels at public secondary schools so as to reduce shortage of hostels which is causing
high truancy, early pregnancy and immoral behavior among students in public secondary
schools. The constructions should going together with constructions of teacher‟s houses
so as to enables teachers to live with in schools environments.
MDC should pass the by-laws that protect disables that constructions of public buildings
like classes, hostels and dormitories that are accessible by disables that MDC engineers
and technicians should not certify the buildings with no wheel chairs paths for disables.
This should be going together with disabled toilets this will help to make these public
schools to be friendly to disabled students.
Ministry of education and vocational training should pass laws that governs operation of
sports and games at public schools so as to make sure that sports and games are done at
all schools this will help to retains, entertain, controlling dropout, truancy, creating
cooperation and friendship among student etc this should be going together with passing
the low that no any school should be registered without having sport and games pitches
so as to make schools environment friendly to learners.
.

94
REFERENCES
Abdallah S. Ndongu (2009) Drop out Tanzania alarming, the threat of internal efficiency,
Moevt, Tanzania & UNESCO
Admassie, A. (2003) Child labour and schooling in the context of a subsistence rural economy:
can they be compatible? International Journal of Educational Development, 23(2): 167-185
Al Samarrai, S. and Peasgood, T. (1998) Educational attainments and household characteristics
in Tanzania. Economics of Education Review, 17(4): 395-417.
Alderson, J. J. (1972). Models of school social work practice. (Eds.). The school in the
community. (pp. 57-74).Washington, D.C.: NASW.
Alene Russell (2005) The facts and fictions about teachers shortage, Policy matters ; American
association of colleges and universities Journal /Vol 2 No 5 nctq.org
Alene Russell(2005) National Council on Teacher Quality (NCTQ). Searching the Attic: How
States Are Responding to the Nation‟s Goal of Placing a Highly Qualified Teacher in Every
Classroom (2004) offers insight and recommendations pertaining to NCLB. nctq.org
Allen-Meares, P., Washington, R. O., & Welsh, B. L. (1996). Social work services in schools.
2nd ed. Boston: Allyn & Bacon.
http://www.counseling.org/cacrep/cacrep/2001standards700.htm
Amartya Sen (1985). Commodities and Capabilities. Nsoco,North-Holland
Amartya Sen.( 1999). Development as Freedom. Oxford University Press.
Anderson K.G (2005) Relatedness and investiment in children in south Africa Human nature,
Anderson, G, Rosengart, G(1987) Education in Tanzania. government expenditure SIDA
95
Banker, R.D., Charnes, A. and Cooper, W. (1984). „Some models for estimating technical and
scale inefficiencies in data envelopment analysis’, Management Science, 30 (9), pp. 1078-
1092.
Barbara Glaeser &Barbara Millikan (2009) Strategies for Teaching Content to Low Achieving
Students. University of Kansas Lawrence, USA
Botswana Human Development Report 2000: “Every one has right to education”, The EFA
2000 assessment country report UNDP,: Available
www.unesco.org/wet/countryreport/botswana/repport_1.html
Boyd William (1911) Rousseau JJ (1712-1778) Emile for Today. The Emile of Jean Jacques
Rousseau, Heinemann London.
Boyle,S , Brock A, Mace J, and Sibbons M. (2002) Reaching the poor: The „Cost‟ of sending
children to school. Synthesis report. London: DFID.
Bray M (1992) New Resources for Education; Community Management and Financing of
Schools in Less Developed Countries. London.Common Wealth Secretariat.
Brock, C. and Cammish, N. (1997) Factors Affecting Female Participation in Education in
Seven Developing Countries. Education Research Paper No 9. London: DFID
Brookover, Wilbur B.& Lawrence W. Lezotte(1979) „Changes in school characteristics
coincident with changes in student achievement‟ Michigan state University.
Brown, P. and Park, A. (2002) Education and poverty in rural China. Economics of Education
Review, 21(6): 523-541. UNESCO (n.d.) The Flagship on Education for All and the Right to
education for Persons with Disabilities: Towards Inclusion. Available
from:http://www.unesco.org/education/efa/know_sharing/flagship_initiatives/depliant_flagsh
ip.pdf [Accessed August 2007].

96
Cameron, L.A. (2000) An analysis of the role of social safety net scholarships in reducing
school drop-out during the Indonesian economic crisis. Florence, UNICEF Innocenti
Research Centre
Charles Sabel at al (2010) Individualized service provision in the new welfare state: Lesson
from special education in finland. Report prepared for SITRA, Helsinki.
Charnes, A., Cooper, W. and Rhodes, E. (1978). „Measuring the Efficiency of Decision Making
Units‟, European Journal of Operational Research. 2, pp. 429-444.
Chavuta, A. (2008) Special Needs Education Programme in Malawi, Learning Difficulties
Programme, Country Paper. (Unpublished policy paper). Montfort Special Needs College,
Malawi.
Chi, J. and Rao, N. (2003) Parental beliefs about school learning and children'seducational
attainment: evidence from rural China. Ethos, 31(3): 330-356.
Colclough, C., Rose, P. and Tembon, M. (2000) Gender inequalities in primary schooling: the
roles of poverty and adverse cultural practice. InternationalJournal of Educational
Development, 20: 5–27.
Connelly, R. and Zheng, Z. (2003) Determinants of school enrollment and completion of 10 to
18 year olds in China. Economics of Education Review, 22(4): 379-388.
David Tyack ( 1992), The Future of Children Vol. 2, No. 1, School Linked Services pp. 19-31
Princeton University press
Di Gropello, E and Marshall, J. (2005) Teacher effort and schooling outcomes in rural
Honduras. In Vegas, E. (Ed) Incentives to Improve teaching: Lessons from Latin America.
Washington D.C : World Bank.
97
Dodson C.K (Dodson, C. K. (2005), The Relationship Between School Effectiveness and
Teachers' Job Satisfaction in North Mississippi Schools, Unpublished Doctoral Dissertation,
Mississippi University, Oxford
Dunne, M. and Leach, F. (2005) Gendered School Experiences: The Impact on Retention and
Achievement. London: DFID.
E. Montin, "Introduction to J. Rousseau's Émile: or, Treatise on education by Jean-Jacques
Rousseau", William Harold Payne, transl. (D. Appleton & Co., 1908) p. 316.
Earl Babbie (2007) The practice of social research 11 Edition USA, Thomson Wadsworth,
Chapman university, RR Donnelly – crawfordsvilledra.
Ellen A Kalinga (2008) Development of an interactive e-learning management system (e-LMS)
for Tanzania secondary schools; Blekinge Institute of Technology Licentiate Dissertation
Series No. 2008:03 School of Technoculture, Humanities and Planning , Sweden.
Engelhart MD (1972) Methods of Educational Research. . Migori (M.ED Thesis). Kenyatta
University.
Eric Mcheka(2010) Challenges faced by specialist teachers for learners with learning
difficulties in Malawi. Available: www.afri-can.org/workshops/Ghana%20articles/Eric.doc
Ersado, L (2005) Child labour and schooling decision in urban areas: comparative evidences
from Nepal, Peru and Zimbabwe. World development report
Eurydice (2002).The teaching profession in Europe: Profile, trends, and concerns.Teacher
Supply and Demand at General Lower secondary Level. Key topics in education in Europe
Volume 3. Brussels: European Commission / EURYDICE

98
Farrel, M. (1957). „The Measurement of Productive Efficiency’, Journal of Royal Statistical
Society. A.120, pp. 253-281
Finn, J. D. & Achilles, C. M. (1990). Answers and questions about class size: A statewide
experiment. American Educational Research Journal, 27(3),
Fiske, E., and H. Ladd. (2002). Financing Schools in Post Apartheid South Africa: Initial Steps
Toward Fiscal Equity. Sanford Institute Working Paper Series. Durham, North Carolina:
Sanford Institute of Public Policy, Duke University.
Fourie R J(2007) Qualitative self-study of retinitis pegmentosa: Processing in individual
theoretical modals. University college cork
Frances Hunt (2008) Dropping out from school ; Consortium for Research on Education Access
transition and Equity (CREATE) Research monograph no 16May 2008. University of
Sussex CIE.
G. Burtless (Ed.), Does money matter? The effect of school resources on student achievement
and adult success . The Brookings Institution ,Washington, DC: (pp. 74–92).
Gertler, P., & Glewwe, P. (2006). The willingness to pay for education in developing countries:
Evidence from rural Peru. Journal of Public Economics,42(3), 251-275.
Greener(2008) Business research. Colorado USA Greener and venture publishing Co .
Haiying D.& Xueng wan (2012) Higher education and Fees in China: implications and impacts
on affordability and Educational Equity, Arizona state University.
Hazarika, G. and Bedi, A.S. (2003) Schooling costs and child work in rural Pakistan. The
Journal of Development Studies, Washington, DC: The Brookings Institution.39(5): 29-64.

99
Hedges, L. V., & Greenwald, R. (1996). Have times changed? The relation between school
resources and student performance. The Brookings Institution Washington, DC
Hunt, F. (2007) Schooling Citizens: A study of policy in practice in South Africa. Unpublished
DPhil thesis. Brighton: University of Sussex.
Johnstone, D. B. (1986). Sharing the costs of higher education: Student financial assistance and
accessibility
Johnstone, D. B. (2003). Cost-sharing in higher education: Tuition, financial assistance, and
accessibility.Czech Sociological Review, 39, 351–34
Juneja, N. (2001) Primary Education for All in the City of Mumbai, India: The Challenge Set by
Local Actors. School Mapping and Local-Level Planning. Paris: UNESCO.
Kavale, K. A. (2001) Decision making in special education: the function of the meta-analysis.
Exceptionality, New Jersey: Laurence Erlbaum.
Kirk and Jones(2004) Teacher and improvement of school efficiency: the impacts of efficient
teachers to school performance. London: DFID.
Komba C.K & E.L. Hiza (2013)Factors Influencing Academic Performance of Ward Secondary
Schools: A Case of Selected Schools in Moshi. Moshi University college of cooperative and
Business study. MUCCOBS
Kombo, D.K.& Tromp, DLA(2006) Proposal and thesis writing: An introduction, Pauline
Publications Africa, Nairobi Kenya.
Kothari CR (1985) Research Methodology. New Dheli. Willy Eastern Limited
Kothari CR (2005) Research methodology; Methods and techniques 2nd
edition. New age
international limited publishers.
100
Lewin, K.M. (2007) Improving Access, Equity and Transitions in Education:Creating a
Research Agenda. CREATE Pathways to Access Series, No 1.Brighton: University of
Sussex.
Liu C, Song G H (2004). The economies of scale and scope during the process of enrolling
enlarging of higher university. Economic Theory and Administration, (1): 48 (in Chinese)
Loxley W, Heyneman, S. (2011),The effect of primary school quality on academic
Achievements Across twenty-nine low income Countries” American journal of sociology
Vol. 88 NO:6.
Lwaitama A & Galabawa J (2008) Community Secondary Schools: How Long Is Their Journey
to Quality Education? University of Dar Es Salaam, Tanzania
Madan M. Laddunuri (2012) Status of School Education in Present Tanzania and Emerging
Issues,UniversityofDodomaTanzaniaAvailableathttp://soeagra.com/ijert/ijert_march2012/4.p
df.
Maharaj, P., Kaufman, C. and Richter, L. (2000) Children’s Schooling in South Africa:
Transitions and tensions in households and communities. CSDS Working Paper, no 30.
Durban: Durban University.
Mark Robinson and Gordon White (1997) The role of civic organization on provision of social
services , World institute for Development Economics Research (UNU –WIDER. United
Nation University.
Martim, E. (2008) „Inequalities in Education: Poor Still Marginalised. Daily Nation 8th May,
2008, 14: 5.
Meekers, D. and Ahmed, G. (1999) Pregnancy-related school dropouts in Botswana Population
Studies, 53(2): 195-209.
101
Milanoviski A.(2005) Measuring school effiency: implications for practice and research. The
Association for Education Finance and Policy New Orleans, LA
Miriam Mzomera (2012) „The extent to which the activities of early childhood development in
Malawi integrate child with special education needs: A case of Zomba district. Thesis
Unversity of Malawi.
MOEC (2000) Secondary schools master plan 2001-2005 DSM,The government printer
Mpesha, N. (2000) Curbing Drop Out: Re-entry Programme for Teenage Mothers: The Case of
Kenya. Forum for African Women Educationalists.
Mugenda O.M & Mugenda A.G. (2003) Research methods quantitative and qualitative
approaches, ACT Press, Nairobi Kenya
Mwampeta, A.D. 1987. The Impact of Decentralization on Primary Education Administration
in Tanzania. M.A. thesis, University of Dar es Salaam.
Nkuba Mabula (2012) Career provision to to secondary school students in Tanzania: is it
dream or reality? The University of Dar-es-salaam Tanzania. Also available; International
journal of Learning& Development
Noah Murumba Kiveu J mayio(2009) The impact of cost sharing on internal efficiency of public
secondary schools in Ndivisi division, Bungoma district Kenya. Masinde muliro university,
Kakamega Kenya
Oketch, M. O. (2000). Costing and financing higher education for development in sub-Saharan
Africa: Kenya’s case. International Education Journal.
Olembo J, Hanold R (1992) „Planning and Financing Rural Education in Afrca.’ University of
New England. CCEA.
Oxford, Advanced leaner Dictionary 8th edition

102
Patton, M.Q (1990), Quantitative Evaluation and research methods, Second edition, USA sage
publication, Inc.
Psacharopoulos G, Woodhall M (1985) Education for Development. An analysis of Investiment
Choices, Washington D. C Oxford University Press.
Republic of Kenya (1988) Report on the Development of Education for the Next Decade and
Beyord (Kamunge Report). Nairobi. Government Printer.
Richmond, M.E. (1922). What is social casework? An introductory description. NY: Russell
Sage Foundation
Rose, P. and Al Samarrai, S. (2001) Household Constraints on Schooling by Gender: Empirical
Evidence from Ethiopia. Comparative Education Review, UNESCO 45(1): 36-63.
Rousseau JJ (1712-1778) Emile for Today. The Emile of Jean Jacques Rousseau, Selected
Rousseau, Jean-Jacques (1953). The Confessions. Trans. J.M. Cohen. New York:
Penguin529-30
Scheerens, J. (2004). Review of school and instructional effectiveness research. “Paper
commissioned for the EFA. Global Monitoring Report 2005, The Quality Imperative
UNESCO.
Schwartz, D. L., & Martin, T. (2005) Inventing to prepare for learning: The hidden efficiency of
originalstudent production in statistics instruction. Cognition & Instruction CO, xx, xxx-
xxx.
Shapiro, D. and Tambashe, O.B. (2001) Gender, poverty, family structure, and investments in
children’s education in Kinshasa, Congo. Economics of Education Review, New York.
Oxford University Press. 20 (4): 359-375.

103
Sixtus F .N. Kiwia (19994) The operational efficiency of the administrative organization of
Tanzania Education system; Utafiti (new series ) vol. 1No2 71
Skoufias, E., and J. Shapiro.( 2006). “Evaluating the Impact of Mexico’s Quality Schools
Program: Th e Pitfalls of Using Nonexperimental Data” (World Bank Policy Research
Working Paper 4036). Washington, D.C.: Th e World Bank.
Spreen, C. A.& Vally S. 2006. “Education Rights, Education Policies and Inequality in South
Africa.” International Journal of Educational Development, 26:352-362.
Stoll, L. and Fink, D. (1996) Changing Our Schools. Buckingham and Bristol, PA: Open
University Press
The PROBE Team (1999) Public Report on Basic Education in India; The PROBE Team. New
Delhi: Oxford University Press
Topologo Maundeni (2009) “Care for children in Botwana,” Botswana University press.
UNESCO (2000) Improving school efficiency: The Asian experience An ANTRIEP Report
Meeting of the Asian Network of Training and Research Institutions in Educational Planning
(ANTRIEP),Colombo, Sri Lanka, 15-17 December 1998
UNESCO (2006) EFA Global Monitoring Report 2007: Strong Foundations. Early Childhood
Care and Education. Paris: UNESCO Publishing.
UNESCO (2009) The Education for All Global Monitoring Report. Paris. UNESCO Publishing
UNESCO (2013) A teacher for every child. Projecting a global teachers needs from 2015-
20130: Also available http://www.uis.unesco.org/Education/Documents/fs27-2013-teachers-
projections.pdf.
UNESCO(2012)Tanzaniaeducationsectoranalysis.Availablehttp//:www.unesdoc.unesco.org/im
ages/0021/002152/215247.e.pdf.

104
UNICEF (1994) Comprehensive Education Sector Analysis Report. Dar-es- Salaam. UNICEF
Country Office.
URT (1999), “ The Tanzania development Vision 2025” President‟s office, Planning
Commission. Dar-es-salaam; Government Printer.
Vavrus, F. (2002) Making distinctions: privatization and the (un)educated girl on Mount
Kilimanjaro, Tanzania. International Journal of Educational Development,
Walker R (1985) Doing Research: A Handbook for Teachers. London. The Varsity Press.
World Bank (2010) Education in Sub Sahara Africa: Policies for Adjustment Revitalization and
Expansion. Washington D.C. World Bank
Young PV (1956), Scientific social surveys and research: An introduction to the background,
Content, Methods, Principles, and analysis of social studies; New York: prentice Hall
publications.
Zimmerman, F.J. (2003) Cinderella goes to school: the effects of child fostering on school
enrollment in South Africa. Journal of Human Resources, 38(3): 557-590.
.
.

105
APPENDIX I: Questionnaires to teachers and heads of schools
Aim Baraka R. Mwelumbini a student of The Open University Of Tanzania Taking Masters of
Education Administration Policy Planning Studies (MED-APPS). With registration number
HD/D/E/113/T.12, aim doing a research to fulfill the requirement of my study with a topic
“Effects Cost Sharing on Efficiency of Public Secondary Schools, Case of Vunjo sub-district in
Kilimanjaro.” Please Kindly respond to my research questions.
Personal Information of the respondents
1. Age……………………………………..
2. Sex (Please tick the correct answer)
(a) Male
(b) Female
3. Education level of respondent (Please tick the correct answer)
(a) Certificate
(b). Diploma/Post Secondary
(d) Degree
(e) Others (specify)

106
4. Marital Status [Tick the codes below]
i/. Single
ii/. Married
iii/. Widowed
iv/. Divorced
Part A: Number of teachers
5. How many teachers do your school have gender wise and their level of education?
Male Female
Diploma and above
Below diploma
TOTAL
6. What is the total number of students at you school gender wise?
Male
Female
TOTAL
7. What is the student teacher ratio at your school?...............................
8. Does your school has children with special needs?..................................
9. If yes, what type of needs?
a. Deaf
b. Blind
107
c. Physical disabled
d. Albino
e. Other (please specify)………………………………………………….
10. Does your school have teachers for special needs education?.........................
11. if yes how many teachers with what type ef need?……………………………
Part B: Individualized programs special need and low performing students
12. Does your school have special programs for teaching special needs children?
(i). Yes (ii). No
13. Does it have special programs for low performing student?
14. If yes what are the programs……………………………………………………………
……………………………………………………………………..................................
Part C: Social services to teachers and students at the school.
Does your school have non teaching stuffs, employed to provide the following services to
the teachers and students.
SERVICES YES NO
16. Sport games like foot ball, basket ball, net ball,
17. Health services
18. Guidance and counseling
108
19. What are other services provided in your school……………….................................
…………………………………………………………………………....................
Thank you for your participation! MWELUMBINI Baraka +255767-144760
.

109
Appendix II: Focus group discussion for students
Place: …………………………………Date:…/……/…………
i) What do you know about quality education?
ii) Do you think every child gets quality education?
iii) What are the barriers do you face when in school?
iv) What are necessary resources needed for your learning?
iv) Do you have the necessary resources for your learning?
.
.

110
Appendix III: Classroom Observation checklist
Observation Scale
The researcher will use observation Scale for evaluating teaching efficiency in classrooms. The
criteria for awarding marks on the usage of observed teaching and learning activities will be:
Scores
1. Very often
2. Often
3. Occasionally
4. Rarely/Never
S/N Classroom activity 1 2 3 4
1 Created friendly classroom climate for all
learners
2 Employs Individualized Educational Program
3 Encourages self-regulated learning
4 Provides different strategies to cater special
needs
5 Employs co-operative group teaching
6 Employs Peer Tutoring
7 Employs reciprocal teaching
8 Provides appropriate teaching and learning
materials

111
9 Adapts appropriate and flexible curriculum
10 Employs formative assessment
1. Has there an expansion of social services to teachers and students in public secondary
schools?
.
.
.
.
.
.
.
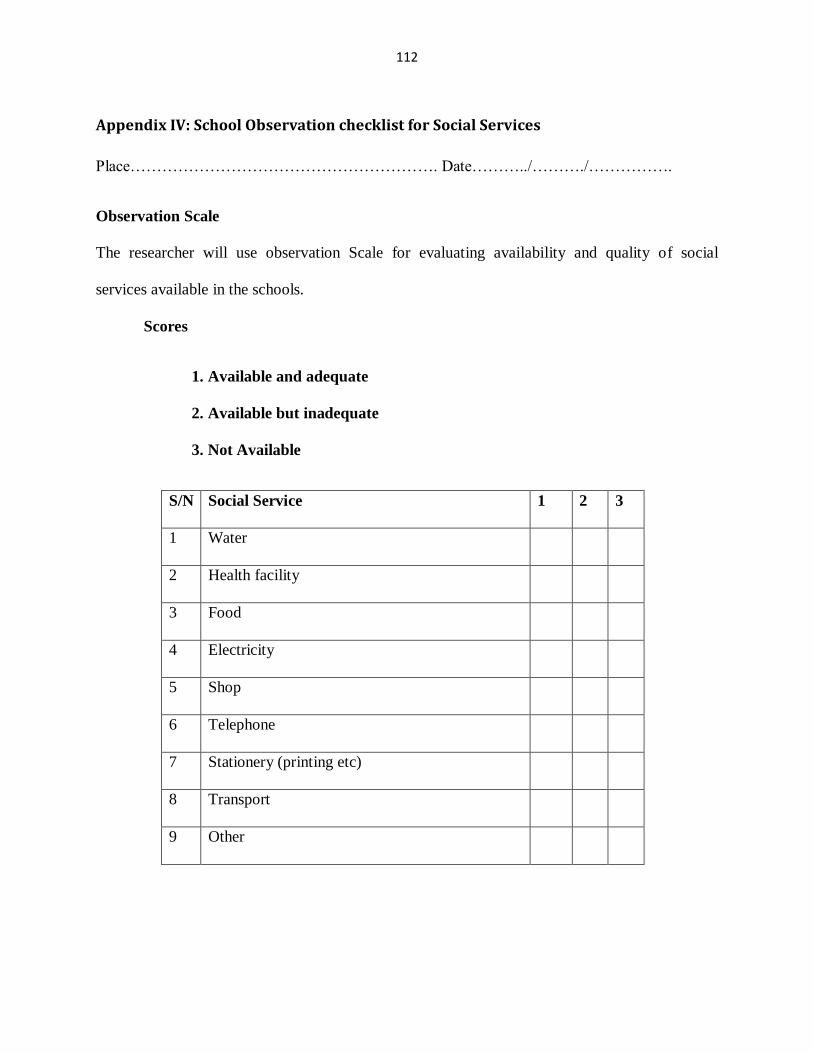
112
Appendix IV: School Observation checklist for Social Services
Place…………………………………………………. Date………../………./…………….
Observation Scale
The researcher will use observation Scale for evaluating availability and quality of social
services available in the schools.
Scores
1. Available and adequate
2. Available but inadequate
3. Not Available
S/N Social Service 1 2 3
1 Water
2 Health facility
3 Food
4 Electricity
5 Shop
6 Telephone
7 Stationery (printing etc)
8 Transport
9 Other

113
APPENDIX IV: Interview Guide
(For students)
1. Name
2. class level
3. Where is you residence/ home
4. Approximately how many students are in your school?
5. And how many teachers are here in your school?
6. Do you think the number of teachers is enough?
7. In our view what do you think is the reasons?
8. Does your school provide all necessary conditions to enable all students to perform well?
9. In your view what are the necessary conditions and services should be provided at your
school to enable you to perform well in your studies?
10. Does your school have students with special needs like physical disabilities deaf, albino,
hearing impairments etc?
11. If yes are there teachers for above special needs students in your school?
12. Are there special programs for special needs students in your school?
13. What are the programs and how does they be conducted?
14. Are there any individualized programs for low performing students in your school?
15. What are impacts do you associate with in individualized programs for special need and
low performing students in public secondary schools? Discussion
114
16. Have you hared special need students and disables demanding or blaming about services
provided to them at school?
17. Have you hared students demanding for social services like teacher houses, students
hostels, dormitories, guidance and counseling services, sports, health, food and water at
school?
18. In your view what are the impacts of the above services at the school in general?
Thank you for your participation! MWELUMBINI Baraka R. +255717-144760