effects of copper on marine invertebrate larvae in surface water from san diego bay, ca gunther...
TRANSCRIPT

Effects of copper on marine invertebrate larvae in surface
water from San Diego Bay, CA
Gunther Rosen1, Ignacio Rivera-Duarte1, Lora Kear-Padilla2, and Bart Chadwick1
1SPAWAR Systems Center San Diego53475 Strothe Rd., San Diego, CA 92152-6325
2Computer Sciences Corporation, San Diego, CA 92110

Background
Copper sources in San Diego Bay
Industrial discharges Storm water Non-point source runoff Ship discharges (e.g. cooling water) Flux from sediment
Antifouling hull coatings (67% of total load) Navy, commercial, and civilian hull leaching Navy and civilian hull cleaning
Effect in the bay
Copper concentrations approach or exceed chronic water quality criterion (WQC) in some parts of the bay

Background
Exceedance of current national chronic Cu WQC (3.1 µg/L dissolved) not necessarily indicative of bioavailability or toxicity to biota
WQC derived from toxicity studies with laboratory water (e.g. Narragansett Bay, RI) with lower ability to complex Cu
EPA acknowledges that site-specific water quality characteristics can dramatically affect metal speciation and exposure
WER procedure current acceptable method for deriving site-specific criteria (U.S. EPA 1994)

Study Site: San Diego Bay
Six surveys over two-year period
Samples collected from 27 “boxes” along the axis of the bay.
Samples were composites of research vessel’s track within each box (~ 1 km)
Clean sampling techniques
Boxes 1-17 = North BayBoxes 18-27 = South Bay
MOUTH
HEAD
Commercial Basin
N
Coronado Bridge
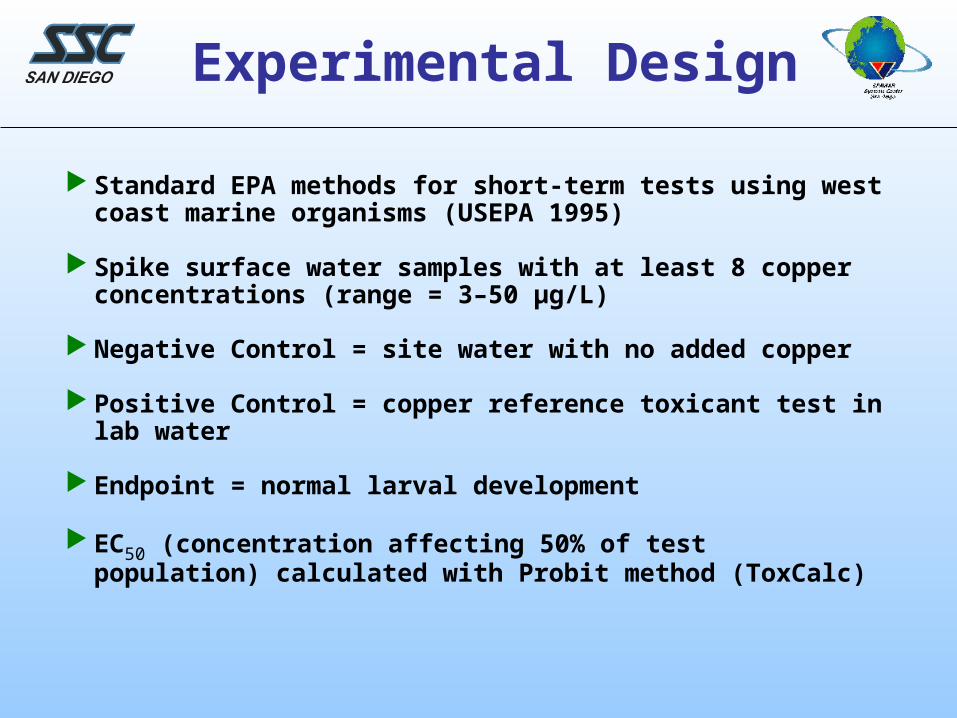
Experimental Design
Standard EPA methods for short-term tests using west coast marine organisms (USEPA 1995)
Spike surface water samples with at least 8 copper concentrations (range = 3–50 µg/L)
Negative Control = site water with no added copper
Positive Control = copper reference toxicant test in lab water
Endpoint = normal larval development
EC50 (concentration affecting 50% of test population) calculated with Probit method (ToxCalc)

Mytilus galloprovincialisMediterranean mussel
StrongylocentrotuspurpuratusPurple sea urchin
Dendraster excentricusSand dollar
Species tested

Polychaete wormFlorida pompano
Common rangiaMummichogGreen crab
Copepod
Sheep headSpot
Top smeltCopepodPolychaete worm
MysidPolychaete worm
Tidewater silversideCopepod
MysidAtlantic silversideInland silverside
Winter flounderRed abalone
American lobsterCopepodBlack abaloneDungeness crab
Soft- shell clamCopepod
Eastern oyster
Sea urchinPacific oysterCoot clam
Summer flounder
Blue mussel0
10
20
30
40
50
60
70
80
90
100
1 10 100 1,000
Dissolved copper concentration (µg L-1)
Cu
mu
lati
ve p
rob
abili
ty (
%)
Acute toxicity data
Cumulative probability fit
Lower 95% confidence limit
Upper 95% confidence limit
3.1 4.8
EPA dissolved copper acute WQC
EPA dissolved copper chronic WQC
Appropriate Test Species
•Test species sensitivity should be close to criterion concentration

Water Effect Ratio Procedure
Lab Water (SIO)Site Water
Simultaneous Toxicity Tests with Copper
WER = EC50 in Site Water EC50 in Lab Water
Site-specific Criterion = WER X WQC
Purpose: Account for differences in bioavailability between siteand laboratory water for site-specific criterion development

Control Development
20 sites in the bay tested 1-4 times
93 ± 5% normal larval development in controls across all test sites and sampling events
Indicative of no ambient toxicity in the bay
Box #
Lab 1 2 3 4 5 6 7 9 11 12 13 14 15 16 18 21 23 25 26 27
No
rma
l Co
ntr
ol D
eve
lop
me
nt
(%)
0
20
40
60
80
100
120

Copper Additions
Selected mussel data from survey on February 27, 2002
Higher Cu concentrations required for samples towards head of bay before toxicity observed
Indicates less bioavailability of Cu towards South bay
Copper Concentration (μg/L)0 5 10 15 20 25 30
Nor
mal
Lar
val D
evel
opm
ent (
%)
0
20
40
60
80
100
120
Box 1 Box 18
February 27, 2002
Box 27
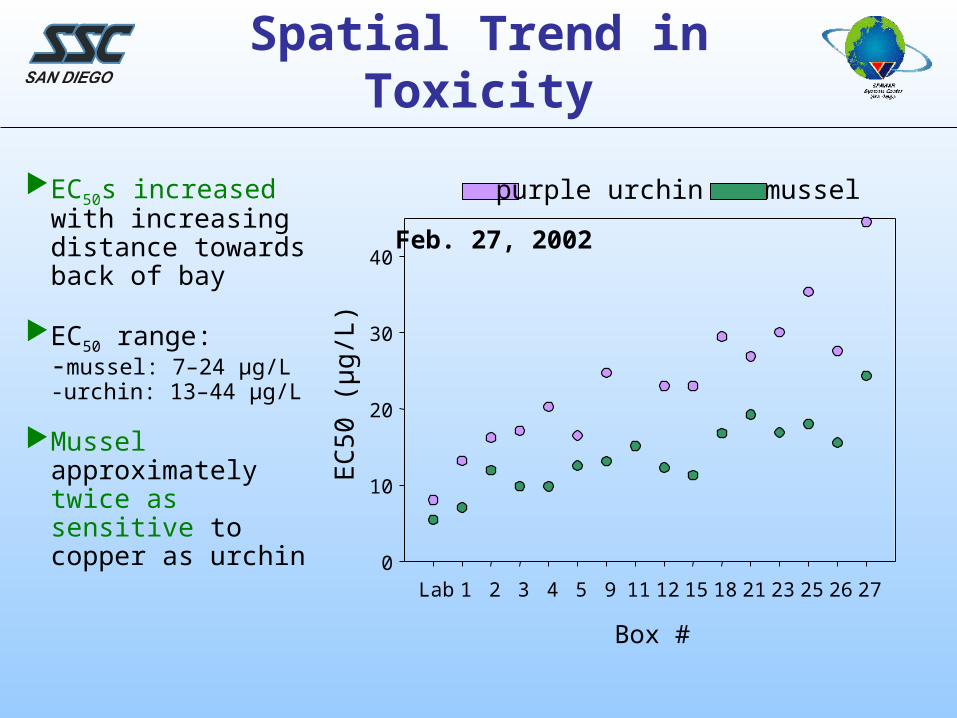
EC50s increased with increasing distance towards back of bay
EC50 range:-mussel: 7–24 µg/L-urchin: 13–44 µg/L
Mussel approximately twice as sensitive to copper as urchin
Spatial Trend in Toxicity
Feb. 27, 2002
Box #
Lab 1 2 3 4 5 9 11 12 15 18 21 23 25 26 270
10
20
30
40
EC
50
(µ
g/L
)
purple urchin mussel

Spatial Trends in Toxicity
Spatial trend consistent over course of four surveys
EC50 values within surveys differ by factors of 1.7 (May 2002) to 3.4 (Feb 2002)
On average, South Bay (Boxes >18) EC50 values 65% higher than North Bay
May 14, 2002
Box #
Lab 1 3 12 15 18 21 23 25 26 274
6
8
10
12
14
16
18
Sept. 19, 2001
Box #
Lab 1 3 4 5 7 9 11 12 13 15 16 21 23 25 26 2710
15
20
25
30
35
40Aug. 30, 2001
Box #Lab 1 5 6 13 26
EC
50 (
µg/
L)
5
10
15
20
25
30
35
sand dollar purple urchin mussel
EC
50 (
µg/
L)
Feb. 27, 2002
Box #
Lab 1 2 3 4 5 9 11 12 15 18 21 23 25 26 270
10
20
30
40
EC
50 (
µg/
L)
EC
50 (
µg/
L)

Dissolved Organic Carbon (DOC)
DOC known to play large role in complexation of cationic metals
DOC ranged from <1 to about 4 mg/L
DOC concentration generally increased with increasing distance towards head of bay
Upward trend in DOC not as clear for samples tested from May 2002 survey
May 14, 2002
Box
0 5 10 15 20 25 301.8
2.0
2.2
2.4
2.6
2.8
3.0
3.2
3.4
3.6
3.8Feb 27, 2002
Box
0 5 10 15 20 25 300.6
0.8
1.0
1.2
1.4
1.6
1.8
2.0
Sep 19, 2001
Box0 5 10 15 20 25 30
2.0
2.5
3.0
3.5
4.0
Aug 30, 2000
Box0 5 10 15 20 25 30
DO
C (
mg
/L)
1.6
1.8
2.0
2.2
2.4
2.6
2.8
3.0
DO
C (
mg
/L)
DO
C (
mg
/L)
DO
C (
mg
/L)
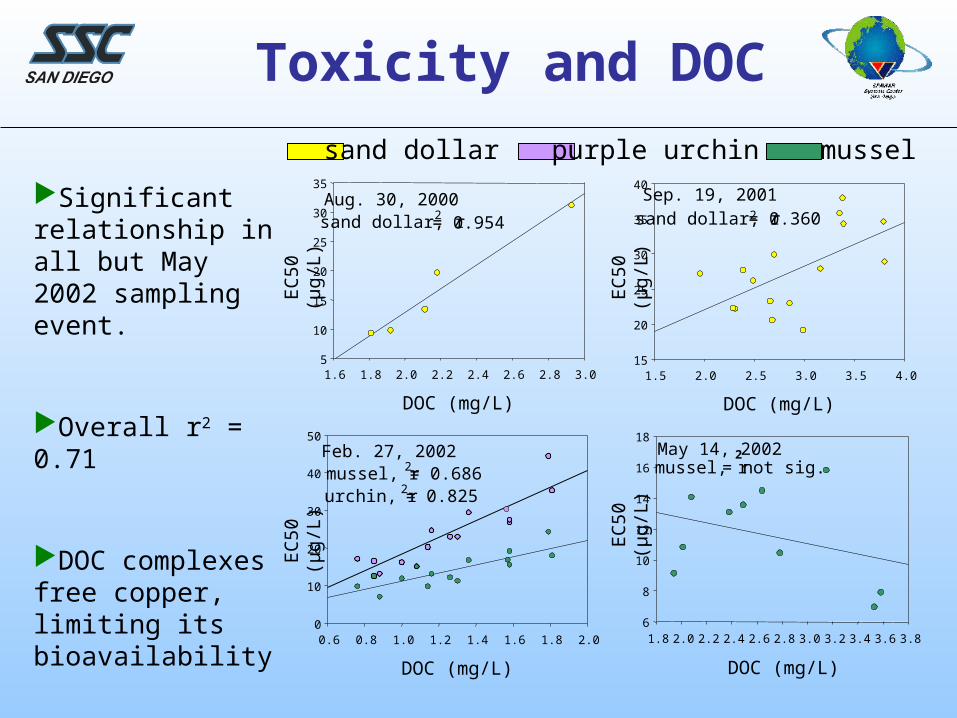
Toxicity and DOC
Significant relationship in all but May 2002 sampling event.
Overall r2 = 0.71
DOC complexes free copper, limiting its bioavailability
Feb. 27, 2002mussel, r2 = 0.686urchin, r2 = 0.825
DOC (mg/L)
0.6 0.8 1.0 1.2 1.4 1.6 1.8 2.00
10
20
30
40
50
Sep. 19, 2001sand dollar, r2 = 0.360
DOC (mg/L)
1.5 2.0 2.5 3.0 3.5 4.015
20
25
30
35
40Aug. 30, 2000
2 sand dollar, r = 0.954
DOC (mg/L)
1.6 1.8 2.0 2.2 2.4 2.6 2.8 3.05
10
15
20
25
30
35
May 14, 2002mussel, r
2= not sig.
DOC (mg/L)
1.8 2.0 2.2 2.4 2.6 2.8 3.0 3.2 3.4 3.6 3.86
8
10
12
14
16
18
sand dollar purple urchin mussel
EC
50 (
µg/
L)
EC
50 (
µg/
L)
EC
50 (
µg/
L)
EC
50 (
µg/
L)

WER Classification
North Bay Boxes 1-17
South Bay Boxes 18-27
Bay-wide
MOUTH
HEAD
Commercial Basin
N
Coronado Bridge

WER Estimates
Total Recoverable WER
All datasets
North Bay 1.80 South Bay 2.72 Bay-wide 2.20
Dissolved WER All datasets
North Bay 1.43 South Bay 2.15 Bay-wide 1.73
Sampling Date
May 2002 Feb 2002 Feb 2002 Sept 20010
1
2
3North Bay South Bay Bay-wide
Four datasets from three surveys used for final WERAll WERs greater than 1Mussel WERs higher than echinoderm WERs
WE R
Mussels only
2.093.092.57
Mussels only
1.652.442.03
Mussel Mussel Urchin Sand dollar
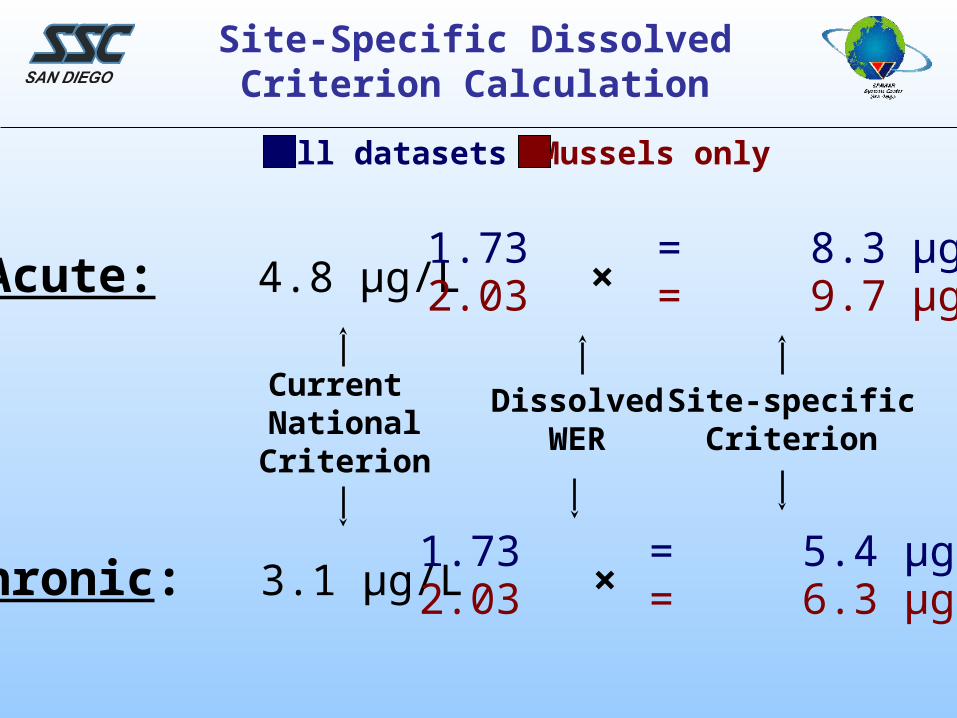
Site-Specific Dissolved Criterion Calculation
Current NationalCriterion
DissolvedWER
Site-specificCriterion
Acute: 4.8 µg/L ×
Chronic: 3.1 µg/L ×
1.73 = 8.3 µg/L
1.73 = 5.4 µg/L
All datasets Mussels only
2.03 = 9.7 µg/L
2.03 = 6.3 µg/L

Study Site WER Species Reference Hampton Roads, VA
2.30 (TR) 1.76 (D)
Acartia tonsa CH2M Hill, 1999
New York/New Jersey Harbor
1.5 (D) Mytilus edulis Arbacia punctulata
Mulinia lateralis
U.S. EPA 1994
San Francisco Bay 1.7 (TR) Crassostrea gigas S.R. Hansen & Associates, 1992
South San Francisco Bay
3.66 (TR) 2.77 (D)
M. galloprovincialis City of San Jose, 1998
San Diego Bay 2.20-2.57 (TR) 1.73–2.03 (D)
M. galloprovincialis S. purpuratus D. excentricus
This study
TR = total recoverable D = dissolved
WER Studies From Other Estuaries

Summary
Ambient conditions in San Diego Bay do not appear to be toxic to bivalve or echinoderm embryos
Bioavailability of copper consistently decreases (up to 3.4 times) with increasing distance from mouth of the bay
Higher EC50s (lower toxicity) generally strongly correlated with higher DOC concentrations.
Current national WQC for copper appears overprotective by a factor between 1.7 and 2 for San Diego Bay