effects of chemical variation on competition and insect
TRANSCRIPT

Eastern Illinois University Eastern Illinois University
The Keep The Keep
Masters Theses Student Theses & Publications
Summer 2020
Effects of Chemical Variation on Competition and Insect Effects of Chemical Variation on Competition and Insect
Communities Across Solidago altissima Genotypes Communities Across Solidago altissima Genotypes
Bryan Scott Foster II Eastern Illinois University
Follow this and additional works at: https://thekeep.eiu.edu/theses
Part of the Entomology Commons, and the Plant Biology Commons
Recommended Citation Recommended Citation Foster, Bryan Scott II, "Effects of Chemical Variation on Competition and Insect Communities Across Solidago altissima Genotypes" (2020). Masters Theses. 4818. https://thekeep.eiu.edu/theses/4818
This Dissertation/Thesis is brought to you for free and open access by the Student Theses & Publications at The Keep. It has been accepted for inclusion in Masters Theses by an authorized administrator of The Keep. For more information, please contact [email protected].
EFFECTS OF CHEMICAL VARIATION ON COMPETITION AND INSECT
COMMUNITIES ACROSS SOLIDAGO ALTISSIMA GENOTYPES
by
BRYAN SCOTT FOSTER II
THESIS
SUBMITTED IN PARTIAL FULFILLMENT OF THE REQUIREMENTS
FOR THE DEGREE OF
MASTER OF SCIENCE – BIOLOGICAL SCIENCES
IN THE GRADUATE SCHOOL, EASTERN ILLINOIS UNIVERSITY
CHARLESTON, ILLINOIS
2020
I HEREBY RECOMMEND THAT THIS THESIS BE ACCEPTED AS
FULFILLING THIS PART OF THE GRADUATE DEGREE CITED ABOVE
___________________________________ ________________________________ THESIS COMMITTEE CHAIR DATE DEPARTMENT CHAIR DATE
______________________________________ ___________________________________
THESIS COMMITTEE MEMBER DATE THESIS COMMITTEE MEMBER DATE
i
ABSTRACT
Individuals within a plant species can differ greatly from one another, especially
regarding the range of chemical compounds produced. However, the functions of many
of these chemicals are unknown, but likely include defenses against herbivores,
attractants for pollinators and seed dispersers, as well as mechanisms for resource
competition. For allelopathic plants, the costs of chemical production may create
tradeoffs with investment in competition versus other ecological functions. To assess the
effects of foliar chemical composition on interspecific plant competition and insect
communities, I conducted a common garden and greenhouse experiment using 24
genotypes of the allelopathic species Solidago altissima for which the foliar chemistry
had been characterized. Within the common garden, I measured a variety of above-
ground plant performance measurements on each genotype of Solidago altissima as a
measure of competitive ability, as well as assessed the foliar and floral insect
communities. Using these data and chemical profiles of S. altissima, I linked foliar
chemistry to plant performance and the foliar/floral insect communities. To assess the
effects of chemical variation on interspecific plant competition, I conducted competitive
trials in a greenhouse setting using the same 24 genotypes of S. altissima with the known
chemical profiles. Clones of each genotype competed with four common target species:
Schizachyrium scoparium, Melilotus officinalis, Silphium integrifolium, and Abutilon
theophrasti.
The common garden experiment showed there was great variation in foliar
chemistry between the genotypes. Ecological patterns existed between foliar chemistry
and plant performance, as foliar chemistry was strongly related to most measures of plant

ii
performance across genotypes. Pollinator communities were found to relate with total
aboveground biomass, proportion of flower mass, and % light transmittance as well as
plant chemistry. In contrast, foliar insect composition was independent of foliar chemical
composition. The greenhouse experiment showed marked variation in both rhizome and
above-ground biomass growth for S. altissima. The above-ground biomass of Abutilon
theophrasti, S. scoparium, and S. integrifolium had their biomass significantly reduced
via competition with S. altissima. Chemistry significantly affected the biomass of both A.
theophrasti and S. scoparium, suggesting that chemistry is a critical driver of competition
for S. altissima. Foliar chemistry of S. altissima also affected its own biomass, where
different axes of chemistry affected different aspects of biomass growth.
These results from both experiments illustrate the multidimensionality and
variation of the S. altissima chemical landscape. Chemistry affected the pollinator
community, various plant performance measures, and the biomass of other competitors.
Among genotypes, variation in chemical composition seems to be facilitating many of the
ecological functions, with independent axes of foliar chemistry affecting different
components of the system, creating various tradeoffs between competitive ability,
biomass, insect associations, and other plant performance measures.

iii
ACKNOWLEDGEMENTS
This thesis could not have been accomplished without the help and guidance from
family, friends, and faculty. My biggest appreciation goes to my advisor, Dr. Scott
Meiners and his wife Missy Meiners, who has done nothing but help me grow as a
person, student and scientist. Thank you for the countless hours of teachings, edits,
wisdom, patients, great food, and witty jokes. I have gained so much over these few years
and I have a lot of it thanks to you. Coming to EIU I didn’t expect our lab and the people
in it to feel like family, but you do, so thank you all for that.
I would also like to thank my committee members, Drs. Zhiwei Liu and Thomas
Canam. Thank you Dr. Canam for your tremendous help in building up my project with
the HPLC analyses and providing your unique perspectives and input on my work. Thank
you Dr. Liu, for not only providing your expertise and input, but for also helping me
become a better TA and a better educator.
I would also like to thank all the other faculty in the Bio program, specifically
Sandy, Marschelle, and Drs. Colombo and Britto. Thank you Sandy and Marschelle for
helping me with endless paperwork and procuring supplies as there was a ton I needed
help with over the years. Thank you Drs. Colombo and Britto for challenging me to take
on more responsibility to not only be a better student, but also a better educator and
leader.
I would also like to give a big shout out to the rest of Meiners Lab, especially
Jenny Trafford and Bella Lopez for all the countless hours of data collections, bug
counts, and seedling plantings. I would also like to thank all the undergrads who helped

iv
with tedious lab and greenhouse work. The countless hours of plantings have finally paid
off and I have you guys to thank for it.
To all of my friends near and far, thank you for being there to hangout, crack
jokes, and drink cold ones. Without you I would have gone insane long ago so it’s very
much appreciated.
To my loving family, thank you for 25 years of uninterrupted love, support, and
belief in me. Without you all I would not have the opportunity to be who I am or where
I’m at today.
v
TABLE OF CONTENTS
ABSTRACT ........................................................................................................................... i
ACKNOWLEDGEMENTS .................................................................................................... iii
LIST OF TABLES ............................................................................................................... vi
LIST OF FIGURES ............................................................................................................. vii
INTRODUCTION ...................................................................................................................1
CHAPTER 1: EFFECTS OF CHEMICAL VARIATION ON PLANT PERFROMANCE AND INSECT
COMMUNITIES
ABSTRACT ...............................................................................................................3
INTRODUCTION .......................................................................................................4
METHODS ................................................................................................................7
RESULTS ................................................................................................................16
DISCUSSION ...........................................................................................................26
CHAPTER 2: EFFECTS OF CHEMICAL VARIATION ON INTERSPECIFIC PLANT
COMPETITION
ABSTRACT .............................................................................................................30
INTRODUCTION .....................................................................................................31
METHODS ..............................................................................................................33
RESULTS ................................................................................................................39
DISCUSSION ...........................................................................................................47
CONCLUDING REMARKS .................................................................................................51
LITERATURE CITED .........................................................................................................53

vi
LIST OF TABLES
CHAPTER 1
TABLE 1.1: FOLIAR INSECT TOTALS POOLED ACROSS ALL ASSESMENTS ............................ 14
TABLE 1.2: POLLINATOR AND FLORAL VISITOR INSECT TOTALS POOLED ACROSS ALL
ASSESMENTS ............................................................................................................................................ 15
TABLE 1.3: RESULTS FROM MULTIPLE REGRESSION ANALYSES RELATING NMDS AXES
OF PLANT CHEMISTRY TO PLANT PERFORMANCE MEASURES .................................................. 18
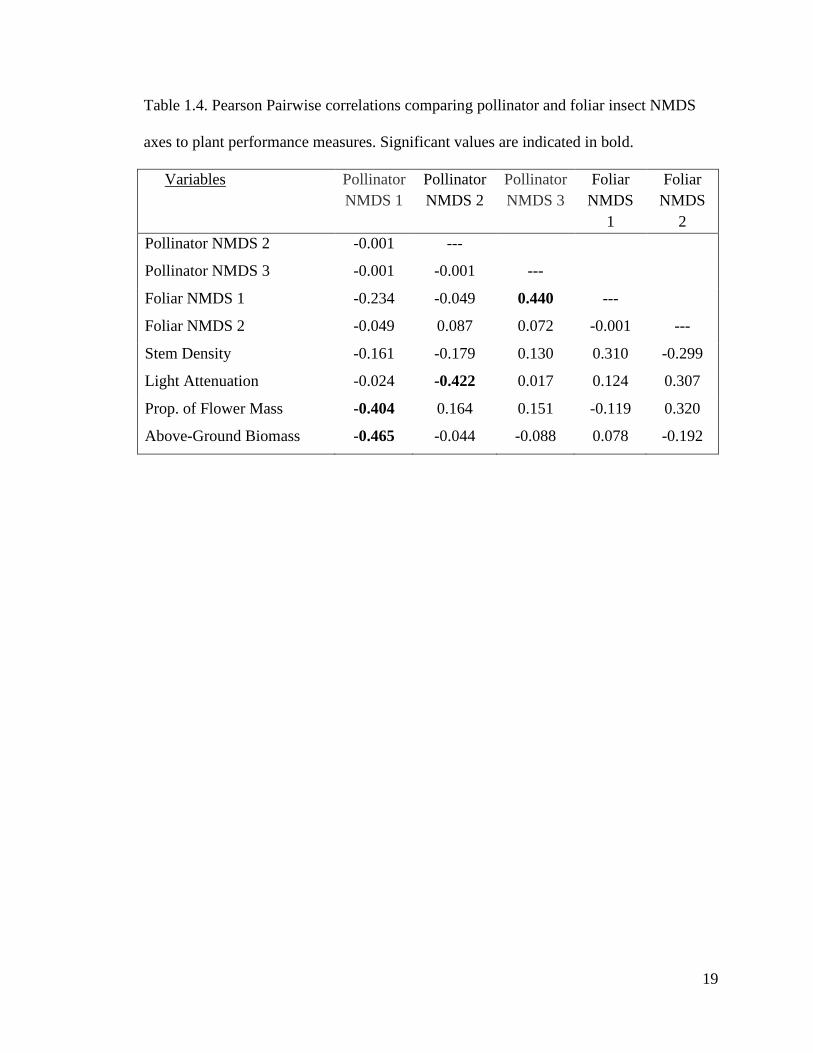
TABLE 1.4: PEARSON PAIRWISE CORRELATIONS COMPARING POLLINATOR AND FOLIAR
INSECT NMDS AXES TO PLANT PERFROMANCE MEASURES ....................................................... 19
TABLE 1.5: RESULTS FROM MULTIPLE REGRESSION ANALYSES RELATING NMDS AXES
OF PLANT CHEMISTRY TO NMDS AXES OF POLLINATOR AND FOLIAR INSECTS ................... 20
CHAPTER 2
TABLE 2.1: RESULTS FROM MULTIPLE REGRESSION ANALYSES RELATING NMDS AXES
OF PLANT CHEMISTRY AND S. ALTISSIMA PLANT PERFORMANCE TO TARGET SPECIES
PLANT PERFORMANCE ........................................................................................................................... 41
TABLE 2.2: RESULTS FROM MULTIPLE REGRESSION ANALYSES RELATING NMDS AXES
OF PLANT CHEMISTRY TO S. ALTISSIMA ABOVE AND BELOW-GROUND BIOMASS ................ 42

vii
LIST OF FIGURES
CHAPTER 1
FIGURE 1.1: VARIATION IN LIGHT TRANSMITTANCE ACROSS ALL GENOTYPES ................ 21
FIGURE 1.2: VARIATION IN FOLIAR CHEMISTRY ACROSS ALL GENOTYPES ........................ 22
FIGURE 1.3: RELATIONSHIP BETWEEN LIGHT TRANSMITTANCE AND NMDS CHEMICAL
AXIS 3 ......................................................................................................................................................... 23
FIGURE 1.4: RELATIONSHIP BETWEEN STEM DENSITY AND NMDS CHEMICAL AXIS 3 ..... 24
FIGURE 1.5: RELATIONSHIP BETWEEN NMDS CHEMICAL AXIS 1 AND POLLINATOR NMDS
AXIS 1 ......................................................................................................................................................... 25
CHAPTER 2
FIGURE 2.1: ARRANGEMENT OF FOCAL S. ALTISSIMA AND TARGET SPECIES SEEDLINGS IN
EXPERIMENTAL POTS............................................................................................................................. 38
FIGURE 2.2: VARIATION IN ABOVE-GROUND BIOMASS GROWTH ACROSS ALL
GENOTYPES OF S. ALTISSIMA ................................................................................................................ 43
FIGURE 2.3: VARIATION IN ABOVE-GROUND BIOMASS GROWTH OF TARGET SPECIES
WHEN GROWN IN CONTROL POTS VS. COMPETITION WITH S. ALTISSIMA ................................ 44
FIGURE 2.4: RELATIONSHIP BETWEEN NMDS CHEMICAL AXIS 1 AND A. THEOPHRASTI
BIOMASS GROWTH .................................................................................................................................... 45
FIGURE 2.5: RELATIONSHIP BETWEEN NMDS CHEMICAL AXIS 1 AND S. SCOPARIUM
BIOMASS GROWTH .................................................................................................................................. 46
1
INTRODUCTION
Solidago altissima is a clonal perennial that is common in old fields and other
open habitats across its native range of Eastern North America (Yip et al. 2019). Solidago
altissima is very diverse in its allelochemical composition, allowing it to be a successful
invader across Europe, Japan, and Australia (Abhilashaet al. 2019; Webber, 1999; Uesugi
et al. 2019). The chemical properties of this species allows these plants to compete for
space and resources via allelopathy, by reducing germination and/or the growth of
neighboring species, increasing access to resources by directly suppressing neighbor
growth or indirectly by affecting microbial mutualists or nutrient availability (Meiners et
al. 2012; Uesugi et al. 2019). This sort of chemical production can also affect the
associated insect communities, generating strong influences on multitrophic plant-insect
interactions (Zytynska et al. 2019; Wetzel and Whitehead, 2020). Thus, intraspecific
variation in chemical composition could impact plant performance and insect
communities through anti-herbivore defenses and altered allocation to reproduction (Hale
and Kalisz, 2012). Chemistry plays a very vital role in this species ecological functioning,
however, the direct effects of these plant chemicals are unknown, as these chemical affect
a variety of plant functions ranging from biomass growth to defense against herbivory
(Uesugi and Kessler, 2013).
Here, I relate the chemical compositions of 24 genotypes of Solidago altissima to
their foliar and pollinator insect communities and competitive abilities. The following
chapters document the results of multiple studies done in both a field and greenhouse
setting. In the first chapter I focus on the chemical composition of 24 genotypes of S.
altissima and how it affects the natural insect communities and factors indicative of plant

2
performance to assess patterns between chemistry, competitive ability, and insects in a
common garden site located in Clark County, IL. In the second chapter I focus on
chemistry and direct competition with other plant species experimentally, to assess
patterns between interspecific competition and chemistry in a greenhouse setting.
Together, this work will form a more holistic view of intraspecific chemical variation in
the ecology of this dominant plant species.

3
CHAPTER 1
EFFECTS OF CHEMICAL VARIATION ON PLANT PERFROMANCE AND INSECT
COMMUNITIES
ABSTRACT
Individuals within a plant species can differ greatly from one another, leading to
variation in the outcome of interactions with other species, with one of the more diverse
characteristics of plant species being the range of chemical compounds produced.
However, the functions of many of these chemicals are unknown, but likely include
defenses against herbivores, attractants for pollinators and seed dispersers, as well as
mechanisms for resource competition at both the inter- and intraspecific scales.
To assess the effects of intraspecific chemical variation on plant competition and
insect communities, I used a common garden of 24 genotypes of the allelopathic species
Solidago altissima. I measured a variety of above-ground plant performance
measurements on each genotype of Solidago altissima as a measure of competitive
ability, as well as the foliar and pollinator insect communities. By using the chemical
profiles of each S. altissima genotype, I explicitly link foliar chemistry to plant
performance and the foliar/floral insect communities.
Although there was great variation in foliar chemistry between the 24 genotypes
of S. altissima, not much variation was observed among the genotypes in terms of
performance measures. Ecological patterns existed between foliar chemistry and plant
performance, as foliar chemistry was strongly related to most measures of plant
performance across genotypes. Pollinator communities were associated with total
aboveground biomass, proportion of flower mass, and % light transmittance as well as

4
plant chemistry. In contrast, foliar insect composition was independent of foliar chemical
composition.
These results demonstrate the multidimensionality and variation of the S.
altissima chemical landscape. Chemistry not only affected the pollinator community
directly, but also indirectly via plant performance and physiology. Among genotypes,
variation in chemical composition seems to be facilitating many of the ecological
functions, with independent axes of foliar chemistry affecting different components of the
system, either directly or indirectly.
INTRODUCTION
Individuals within a plant species can differ greatly from one another, leading to
variation in the outcome of interactions with other species (Siefert et al. 2015), with one
of the more diverse characteristics of plant species being the range of chemical
compounds produced (Wetzel and Whitehead, 2020; Zytynska et al. 2019). While some
plant species produce a few major phytochemicals, many more have the ability to
produce thousands of unique compounds (Tasin et al. 2007). Thus, functional variation in
plant chemistry may range from the abundance of a single chemical to a complex mixture
of chemical compounds (Zytynska et al. 2019).
Plant species produce and release chemical compounds in response to changing
biotic and abiotic factors in their environment, such as herbivory, pathogens,
photodamage, or drought stress (Uesugi et al. 2019; Holopainen, 2004). Plant responses
to local conditions may increase chemical variation as many species exhibit plasticity
(Kong et al. 2018). However, the functions of many of these chemicals are unknown,
5
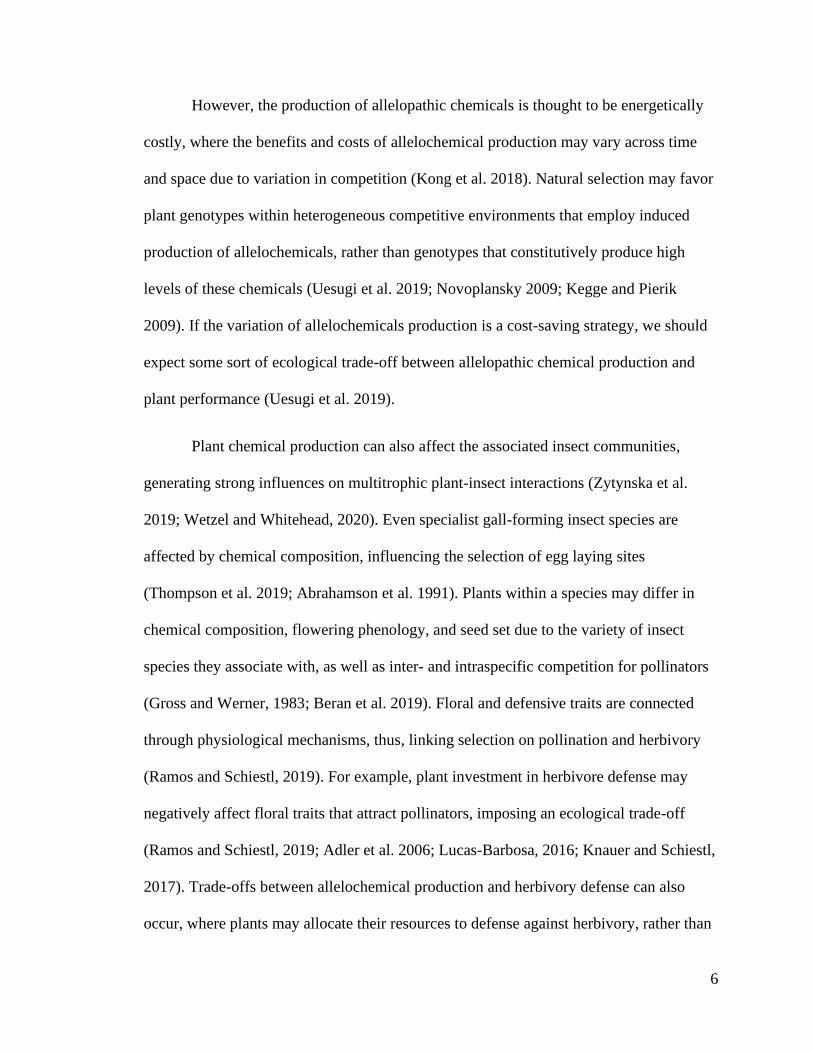
since plants produce a variety of secondary compounds for many different functions
(Holopainen, 2004; Bardgett et al. 1998). Many of these chemicals mediate interactions
with herbivores and competitors at both the inter- and intraspecific scales (Lankau, 2008;
Beran et al. 2019). Many plant species exhibit chemical multifunctionality, where these
chemical compounds are used as defenses against herbivores, attractants for pollinators
and seed dispersers, as well as mechanisms for resource competition (Beran et al. 2019;
Inderjit et al. 2011).
Allelopathic plant species alter resource competition by releasing chemical
compounds into their environment (Rice, 1979; Duke 2010; Meiners et al. 2012).
Allelopathic chemicals reduce germination and/or the growth of neighboring species,
increasing access to resources by directly suppressing neighbor growth or indirectly by
affecting microbial mutualists or nutrient availability (Meiners et al. 2012; Uesugi et al.
2019). Allelopathic compounds are released as either root exudates, volatile organic
compounds, leaf leachate, or leaf litter (Uesugi et al. 2019, Inderjit et al 2011). However,
it is still unclear whether allelochemicals are released as an adaptation or in response to
direct competition (plant-specific chemical cues) or to changes in environmental
conditions such as shading, drought, or nutrient stress (Uesugi et al. 2019; Inderjit and
Del Moral, 1997; Kong et al. 2018). Allelopathic interactions between plant species may
play a large role in determining species distribution, abundance, and community
composition, especially in species invasions where resident species have not evolved any
tolerances to these allelochemicals (Uesugi et al. 2019; Hierro, 2005; Abhilasha et al.
2008; Halligan, 1973; Hunter and Menges 2002).
6
However, the production of allelopathic chemicals is thought to be energetically
costly, where the benefits and costs of allelochemical production may vary across time
and space due to variation in competition (Kong et al. 2018). Natural selection may favor
plant genotypes within heterogeneous competitive environments that employ induced
production of allelochemicals, rather than genotypes that constitutively produce high
levels of these chemicals (Uesugi et al. 2019; Novoplansky 2009; Kegge and Pierik
2009). If the variation of allelochemicals production is a cost-saving strategy, we should
expect some sort of ecological trade-off between allelopathic chemical production and
plant performance (Uesugi et al. 2019).
Plant chemical production can also affect the associated insect communities,
generating strong influences on multitrophic plant-insect interactions (Zytynska et al.
2019; Wetzel and Whitehead, 2020). Even specialist gall-forming insect species are
affected by chemical composition, influencing the selection of egg laying sites
(Thompson et al. 2019; Abrahamson et al. 1991). Plants within a species may differ in
chemical composition, flowering phenology, and seed set due to the variety of insect
species they associate with, as well as inter- and intraspecific competition for pollinators
(Gross and Werner, 1983; Beran et al. 2019). Floral and defensive traits are connected
through physiological mechanisms, thus, linking selection on pollination and herbivory
(Ramos and Schiestl, 2019). For example, plant investment in herbivore defense may
negatively affect floral traits that attract pollinators, imposing an ecological trade-off
(Ramos and Schiestl, 2019; Adler et al. 2006; Lucas-Barbosa, 2016; Knauer and Schiestl,
2017). Trade-offs between allelochemical production and herbivory defense can also
occur, where plants may allocate their resources to defense against herbivory, rather than

7
resistance to competition (Strauss and Agrawal 1999; Stamp 2003). Thus, intraspecific
variation in chemical composition could impact associated insect communities through
anti-herbivore defenses and altered allocation to reproduction (Hale and Kalisz, 2012).
To assess the effects of intraspecific chemical variation on plant competition and
insect communities, I used a common garden of 24 genotypes of the allelopathic species
Solidago altissima. I measured a variety of above-ground plant performance
measurements on each genotype of Solidago altissima as a measure of competitive
ability, as well as assessed the foliar and pollinator insect communities associated with
each genotype. Using these data, I addressed the following two questions: 1). Does
genotype chemical composition alter plant performance, and if so, what sort of patterns
arise? And 2). What patterns do we see between chemical composition and the associated
foliar and floral insect communities?
METHODS
Background and study species
Solidago altissima is a model system for studying allelopathy in response to
competition under experimental and natural environments (Uesugi et al. 2019). Solidago
altissima is a clonal perennial that is common in old fields and other open habitats across
its native range of Eastern North America (Yip et al. 2019). Solidago altissima is very
diverse in its allelochemical composition, allowing it to be a successful invader across
Europe, Japan, and Australia (Abhilashaet al. 2019; Webber, 1999; Uesugi et al. 2019).
Newly established populations of S. altissima have a large number of genetic individuals.
However, as S. altissima densities increase via clonal expansion, inferior genotypes are
8
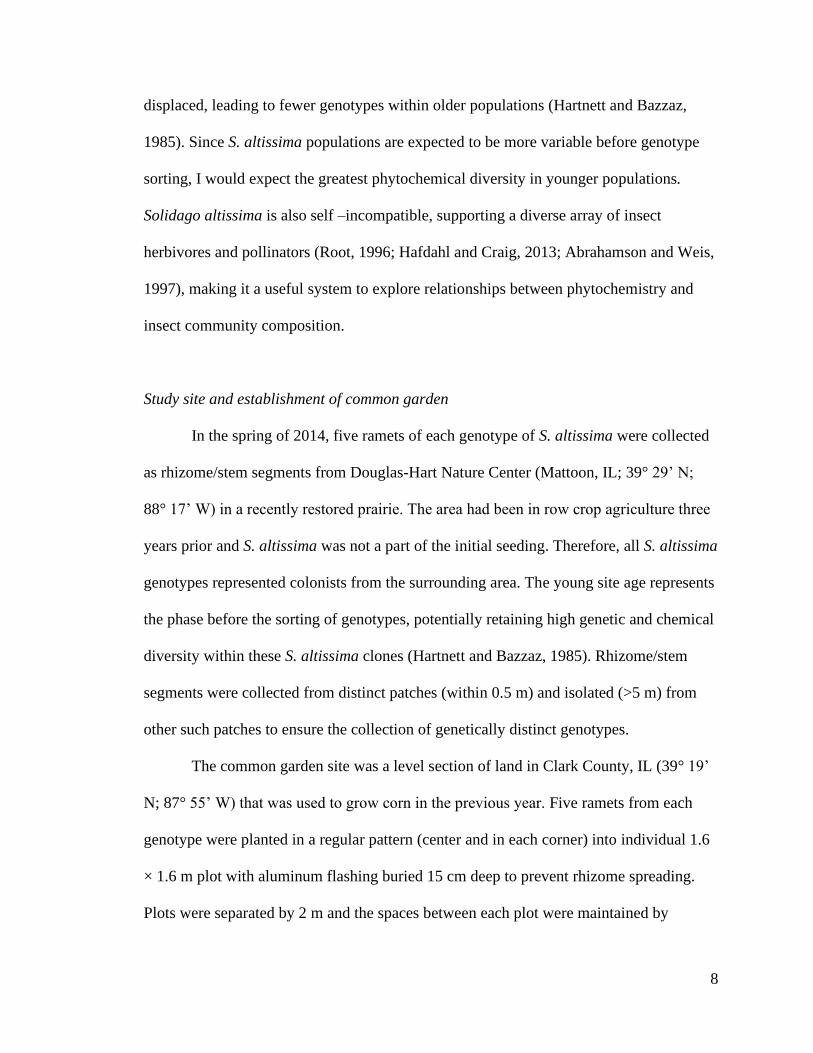
displaced, leading to fewer genotypes within older populations (Hartnett and Bazzaz,
1985). Since S. altissima populations are expected to be more variable before genotype
sorting, I would expect the greatest phytochemical diversity in younger populations.
Solidago altissima is also self –incompatible, supporting a diverse array of insect
herbivores and pollinators (Root, 1996; Hafdahl and Craig, 2013; Abrahamson and Weis,
1997), making it a useful system to explore relationships between phytochemistry and
insect community composition.
Study site and establishment of common garden
In the spring of 2014, five ramets of each genotype of S. altissima were collected
as rhizome/stem segments from Douglas-Hart Nature Center (Mattoon, IL; 39° 29’ N;
88° 17’ W) in a recently restored prairie. The area had been in row crop agriculture three
years prior and S. altissima was not a part of the initial seeding. Therefore, all S. altissima
genotypes represented colonists from the surrounding area. The young site age represents
the phase before the sorting of genotypes, potentially retaining high genetic and chemical
diversity within these S. altissima clones (Hartnett and Bazzaz, 1985). Rhizome/stem
segments were collected from distinct patches (within 0.5 m) and isolated (>5 m) from
other such patches to ensure the collection of genetically distinct genotypes.
The common garden site was a level section of land in Clark County, IL (39° 19’
N; 87° 55’ W) that was used to grow corn in the previous year. Five ramets from each
genotype were planted in a regular pattern (center and in each corner) into individual 1.6
× 1.6 m plot with aluminum flashing buried 15 cm deep to prevent rhizome spreading.
Plots were separated by 2 m and the spaces between each plot were maintained by

9
mowing. After the initial planting of S. altissima, other plant species were allowed to
colonize the plots naturally. During the first two years of growth, all S. altissima
flowering heads were removed prior to seed set in order to prevent the colonization of the
plots by new S. altissima genotypes.
Chemical analysis
HPLC analysis was done to characterize leaf chemistry across S. altissima
genotypes following the protocol of Meiners et al. (2017). Briefly, in the summer of
2016, fully expanded leaves were collected from several stems of each genotype of S.
altissima. Metabolites were extracted using 1 mL of HPLC-grade methanol from 100 mg
of dried leaf tissue that was ground after freezing with liquid nitrogen. After
centrifugation, the supernatant was filtered through a 0.22 µm filter and analyzed using a
Hitachi Chromaster HPLC with a 5430 Diode Array detector. The mobile phase was a
mixture of acetonitrile:water (v/v) at 20:80 from 0-5 minutes, a linear gradient of 20:80 to
95:5 from 5-45 minutes, 95:5 from 45-55 minutes, a linear gradient of 95:5 to 20:80 for
55-60 minutes, and 20:80 for 60-70 minutes. The flow rate was held constant at 0.7
mL/min and the sample loading volume was 10 µL. Chemical constituents were
separated by time of emergence and the area of the peak used an estimate of the amount
present. Only peaks that were discernable from the baseline (>75 µV * s) were retained
for analysis.
Chemical variation for all genotypes was described with non-metric
multidimensional scaling (NMDS) to generate independent axes of chemical variation.
Peaks that occurred in 5 or fewer genotypes were omitted from the analysis as

10
uninformative. The optimum number of dimensions for the NMDS was determined by
comparison to randomized data in PC-ord (McCune and Grace, 2002). The three axes
resulting from this analysis were used to relate chemical composition to plant competition
as well as foliar and pollinator insect communities.
Plant performance measures
As a measure of competitive ability, stem density was recorded for each genotype
of S. altissima. In July of 2018, five 0.25 × 0.25 m quadrats (center and 15 cm from each
corner) were placed into each plot of S. altissima. The number of stems within each
quadrat were counted and averaged for each S. altissima genotype. Similarly, light
transmittance was recorded as measure of resource uptake ability. A Line Quantum
Sensor (Li-Cor®, model LI-250A) was inserted 30 cm above the ground of each plot in
September of 2018. Two measurements were taken diagonally across the plot and
standardized to a measurement above each plot to calculate light transmittance and
averaged.
The final measurements of plant performance came from a biomass harvest. In
early October of 2018, before the S. altissima started to shed seed, a single 0.5 × 0.5 m
quadrat was placed in the center of each plot, approximately 0.55 m from each side. All
plant vegetation within the quadrat was cut 0.5 cm from the ground for each genotype.
For each plot, flowers, stems, and leaves of S. altissima were separated (flower heads cut
0.5 cm below from the lowest point of flowering) and dried. For all non-S. altissima
species, their biomass was pooled for each plot, regardless of species, and dried at 60 C◦

11
for 48 h. Proportion of flower mass was calculated for each genotype by dividing the
biomass of the flowers by the total biomass harvested.
Foliar insects
To relate foliar insect communities to S. altissima genotypes, I used yellow insect
sticky cards (Alpha Scents, Inc., Linn, OR, USA). Three times, between late August to
mid-September of 2018, with a week between each sampling, sticky cards were placed in
the center of each plot on a metal rod. One side of each sticky card was exposed for 24 h,
wrapped in plastic film, and stored frozen to preserve the specimens. Insects that fell
within the grid lines on the cards were identified down to their taxonomic order and
pooled across all 3 foliar insect assessments. Data from these foliar insect assessments
resulted in 3,831 individuals spanning 9 insect orders (Table 1.1).This foliar insect data
was then analyzed with NMDS ordinations as described above. The optimum number of
dimensions for these data was two, which were then used to relate to plant performance
and chemistry.
Pollinator insects
From early September to late-September of 2018, I conducted three rounds of
floral visitor observations, with each census occurring approximately a week apart on a
clear day. Each census was done by placing a 0.5 × 0.5 m quadrat into the center of each
plot. All S. altissima flower heads within this quadrat were observed for 4 minutes during
solar noon (10:00 a.m. – 12:00 p.m.) All insects within this area that made physical

12
contact with an open S. altissima flower was recorded. All insects that were observed
were then identified down to their taxonomic order and pooled across censuses.
These pollinator data were divided into two segments: potential pollinators and floral
visitors. Insect predator species such as ambush bugs and arachnids were identified as
floral visitors and would not serve as pollinators, and were omitted from the analyses.
Data from these pollinator insect assessments resulted in 887 individuals spanning 8
insect orders (Table 1.2). Potential pollinator data was then analyzed with NMDS
ordination as above. The three resulting axes were then used to relate pollinator insects to
plant competition as well as plant chemistry.
Data analysis: Variation among Genotypes
Variation in plant performance measures of proportion of flower mass, light
transmittance, and stem density were compared across genotypes of S. altissima with a
series of one-way ANOVAs. A scatterplot was then made comparing NMDS chemical
axis 1 and NMDS chemical axis 3 to help visualize plant chemical variation across the
two most significant chemical NMDS axes.
Data analysis: Plant performance vs. Chemistry
Using the plant performance measurements of light transmittance, stem density,
and proportion of flower mass, a series of multiple regression analyses were conducted to
relate plant performance to plant chemistry using the three chemical NMDS axes as
predictors.

13
Data analysis: Insect communities
A series of Pearson correlations were conducted in order to relate plant
performance measures to the foliar and pollinator insect communities. These correlation
analyses were conducted in order to determine any correlation between all five insect
NMDS axes (2 foliar and 3 pollinator) and the performance measurements of total S.
altissima aboveground biomass, light transmittance, flower proportion, and stem density.
A series of Multiple Regression analyses were also conducted in order to relate the
pollinator and foliar insect communities to plant chemistry. These multiple regression
analyses were conducted in order to predict the influence of chemistry on all five insect
axes (2 foliar and 3 pollinator). All statistical analyses were done using R version 3.1.2
(R Foundation for Statistical Computing).

14
Table 1.1. Foliar insect totals pooled across all three sticky card assessments. All insects
are organized by taxonomic order.
Pooled Insect Totals
Genotype Coleoptera Lepidoptera Diptera Hymenoptera Hemiptera Aranea Orthoptera Thysanoptera Ioxida
1 44 18 195 10 26 0 0 3 2
2 62 10 216 6 36 0 0 5 0
3 18 8 156 2 19 2 1 4 2
4 46 16 250 20 37 5 0 4 0
5 14 13 133 10 13 9 0 5 0
6 16 9 98 6 27 2 0 2 0
7 71 4 97 8 15 4 0 11 0
8 114 4 360 17 41 1 0 6 0
9 20 6 247 22 27 2 0 2 1
10 36 5 131 10 16 4 2 0 0
11 102 7 250 10 27 5 0 8 0
12 14 2 147 7 26 8 6 3 0
13 111 18 306 47 42 0 2 7 0
14 6 5 179 11 14 7 2 6 4
15 20 4 172 14 26 8 2 5 0
16 14 4 260 16 18 2 0 7 0
17 24 12 185 16 33 4 0 5 0
18 10 7 240 16 34 3 0 3 0
19 12 6 203 16 21 0 0 11 2
20 7 7 150 17 22 2 2 5 3
21 33 9 162 16 18 0 0 14 0
22 9 3 130 8 36 2 0 9 0
23 18 10 240 11 21 5 0 5 0
24 14 19 221 11 33 5 0 9 0

15
Table 1.2. Pollinator insect totals pooled across all three floral observations. All insects
are organized by visitor type and taxonomic order.
Pollination Visitation: Pooled total Floral visitors: Pooled total
Genotype Coleoptera Lepidoptera Diptera Hymenoptera Hemiptera Thysanoptera Coleoptera Aranea Hemiptera Orthoptera
1 20 0 7 1 0 0 1 0 0 0
2 25 2 2 12 1 0 0 0 0 0
3 15 3 9 5 1 0 0 0 0 0
4 18 1 17 4 0 1 0 0 0 0
5 6 0 7 6 3 4 1 3 0 0
6 13 2 3 0 3 0 1 2 0 0
7 22 3 5 10 1 2 0 1 0 0
8 34 2 7 15 2 0 0 2 0 1
9 4 0 5 18 1 0 1 3 0 0
10 16 2 2 9 5 0 0 4 0 0
11 5 2 4 11 4 1 0 4 1 0
12 25 3 3 2 2 2 1 1 0 1
13 14 2 7 7 2 3 0 2 1 0
14 9 1 4 14 4 4 0 4 0 0
15 16 3 4 15 2 1 0 1 0 0
16 4 1 2 14 6 2 0 2 1 0
17 25 1 6 6 1 1 0 0 0 0
18 20 2 7 2 2 1 0 1 1 0
19 14 0 4 7 2 3 2 5 0 0
20 26 0 2 2 3 1 0 0 2 0
21 14 5 1 13 2 0 0 7 0 0
22 27 0 3 2 2 0 0 6 1 0
23 7 2 3 11 1 0 0 3 0 0
24 15 2 5 3 1 0 0 1 1 0

16
RESULTS
Variation among Genotypes
Of the plant performance measures, proportion of flower mass, and stem density
did not vary across genotypes. Only light transmittance was found to vary significantly
across genotypes (ANOVA: F1, 22 = 10.314, P = 0.004, R2 = 0.2882; Fig. 1.1). Despite the
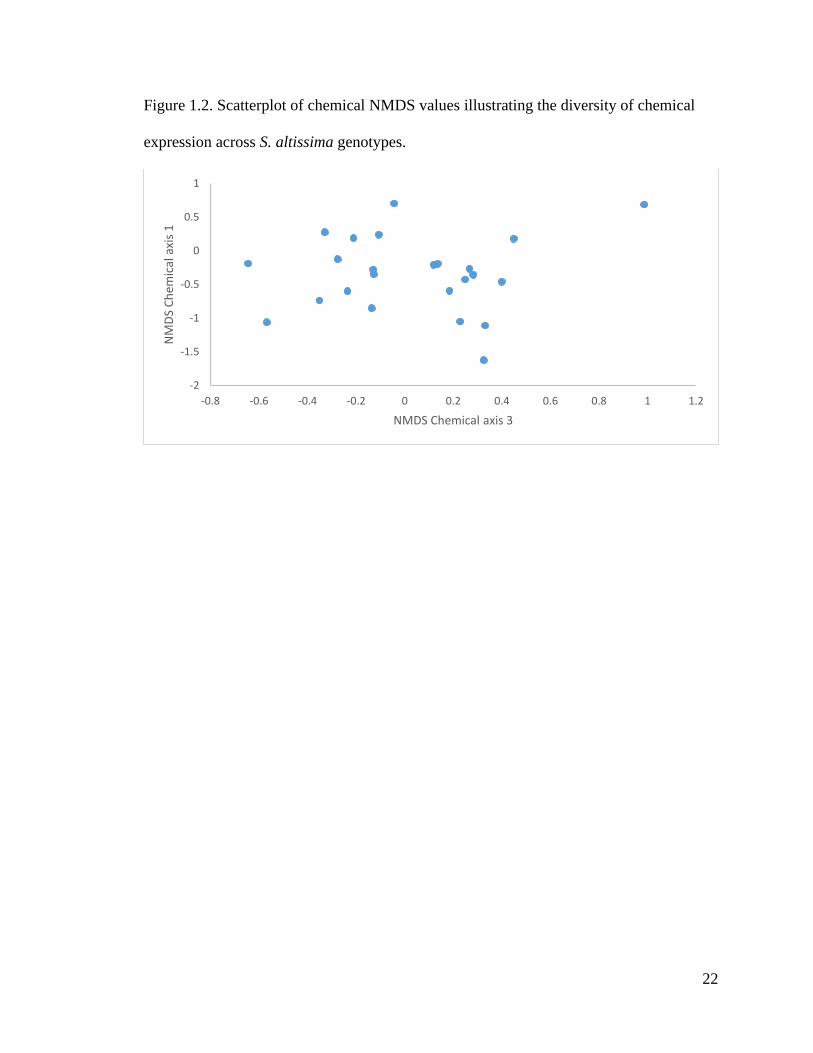
limited variation in physical traits among genotypes, there was marked variation in their
chemical composition as visualized with NMDS chemical axis 1 and axis 3 (Fig 1.2).
Plant performance vs. Chemistry
Of the three plant performance measures, only the proportion of flower mass was
unrelated to any of the chemical NMDS axes (Table 1.3). Of these, only NMDS chemical
axis 3 had any relationship to plant performance. Both stem density (Regression analysis:
F3,20 = 2.087, p = 0.0329, R2 = 0.1242) and % light transmittance (Regression analysis:
F3,20 = 8.306, p = <0.0001, R2 = 0.4879) were significantly influenced by NMDS
chemical axis 3, resulting in an overall significant model for % light transmittance.
NMDS chemical axis 3 was positively associated with light transmittance (Fig. 1.3) and
negatively associated with stem density (Fig. 1.4), reflecting the inverse relationship
between these two variables.
Insect communities
To relate plant performance to foliar and pollinator insect communities, a series of
Pearson pairwise correlations were conducted. The plant performance measures included
in these analyses were: stem density, % light transmittance, flower proportion, and total

17
S. altissima aboveground biomass. Though none of the foliar insect axes correlated with
any of the plant performance measures, the foliar insect NMDS axis 1 correlated with
pollinator NMDS axis 3 (Table 1.4). Aspects of the pollinator community also lined up
with a few of the plant performance measures. Pollinator NMDS axis 1 correlated heavily
with both proportion of flower mass and total S. altissima above-ground biomass, while
pollinator NMDS axis 2 correlated with % light transmittance, all with negative
associations. Though stem density did not correlate with any of the insect axis, we were
still able to relate multiple performance measures to multiple axes of the pollinator insect
community.
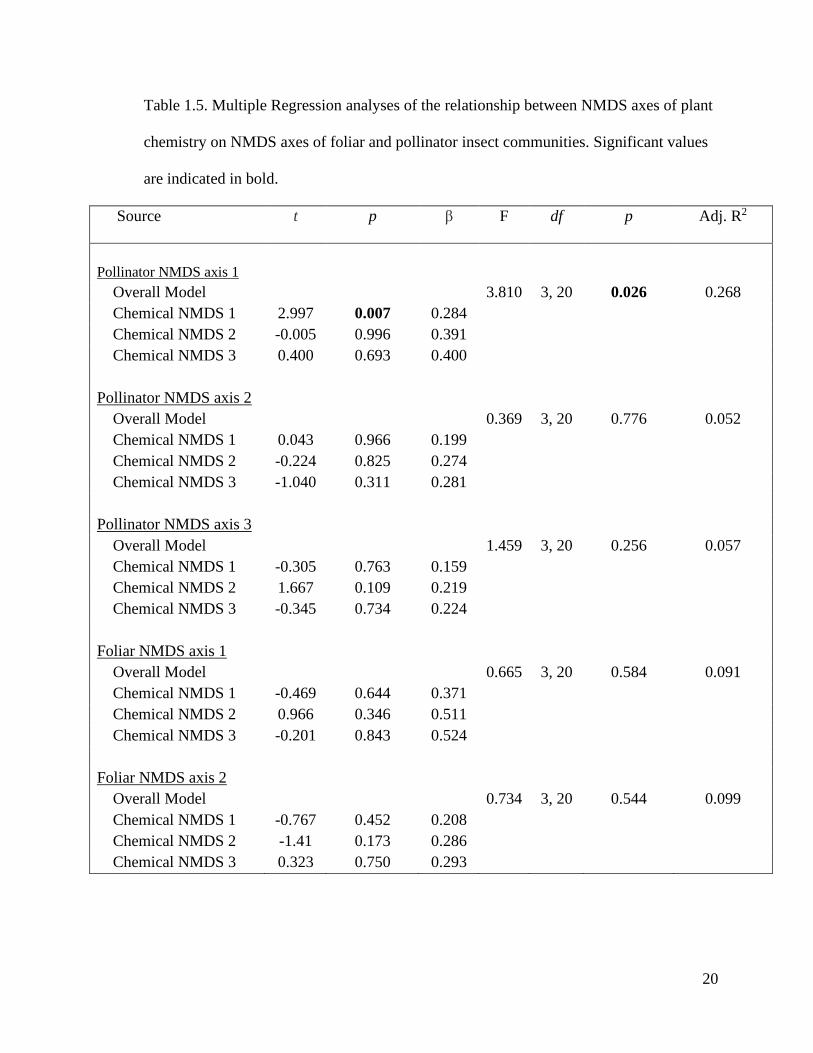
To determine the influence of NMDS chemical axes on the foliar and pollinator
insect communities, I conducted a series of multiple regression analyses. For the foliar
insect communities, neither of the two NMDS axes lined up with any of the three
chemical NMDS axes, indicating no influence of chemistry on this insect community
(Table 1.5). However, for pollinator insects, NMDS axis 1 correlated significantly with
chemical NMDS axis 1 (r = 3.5066, p = 0.001992; Fig. 1.5). This indicates that some of
the pollinator insects in the community are responding positively to some of the plant
chemistry exuded by S. altissima genotypes.

18
Table 1.3. Multiple Regression analyses of the relationship between NMDS axes of plant
chemistry on plant performance measures. Significant values are indicated in bold.
Source t p β F df p Adj. R2
Stem Density
Overall Model 2.087 3, 20 0.134 0.1242
NMDS 1 -0.191 0.8508 0.723
NMDS 2 0.561 0.5811 0.9950
NMDS 3 -2.292 0.0329 1.0193
% light transmittance
Overall Model 8.306 3, 20 0.0009 0.4879
NMDS 1 -1.144 0.266 5.467
NMDS 2 -0.325 0.748 7.524
NMDS 3
4.901 <0.0001 7.708
Proportion of flower
mass
Overall Model 1.401 3, 20 0.2718 0.04967
NMDS 1 -1.148 0.2647 0.0104
NMDS 2 -0.507 0.6176 0.0144
NMDS 3 1.745 0.0963 0.0147
19
Table 1.4. Pearson Pairwise correlations comparing pollinator and foliar insect NMDS
axes to plant performance measures. Significant values are indicated in bold.
Variables Pollinator
NMDS 1
Pollinator
NMDS 2
Pollinator
NMDS 3
Foliar
NMDS
1
Foliar
NMDS
2
Pollinator NMDS 2 -0.001 ---
Pollinator NMDS 3 -0.001 -0.001 ---
Foliar NMDS 1 -0.234 -0.049 0.440 ---
Foliar NMDS 2 -0.049 0.087 0.072 -0.001 ---
Stem Density -0.161 -0.179 0.130 0.310 -0.299
Light Attenuation -0.024 -0.422 0.017 0.124 0.307
Prop. of Flower Mass -0.404 0.164 0.151 -0.119 0.320
Above-Ground Biomass -0.465 -0.044 -0.088 0.078 -0.192
20
Table 1.5. Multiple Regression analyses of the relationship between NMDS axes of plant
chemistry on NMDS axes of foliar and pollinator insect communities. Significant values
are indicated in bold.
Source t p β F df p Adj. R2
Pollinator NMDS axis 1
Overall Model 3.810 3, 20 0.026 0.268
Chemical NMDS 1 2.997 0.007 0.284
Chemical NMDS 2 -0.005 0.996 0.391
Chemical NMDS 3 0.400 0.693 0.400
Pollinator NMDS axis 2
Overall Model 0.369 3, 20 0.776 0.052
Chemical NMDS 1 0.043 0.966 0.199
Chemical NMDS 2 -0.224 0.825 0.274
Chemical NMDS 3 -1.040 0.311 0.281
Pollinator NMDS axis 3
Overall Model 1.459 3, 20 0.256 0.057
Chemical NMDS 1 -0.305 0.763 0.159
Chemical NMDS 2 1.667 0.109 0.219
Chemical NMDS 3 -0.345 0.734 0.224
Foliar NMDS axis 1
Overall Model 0.665 3, 20 0.584 0.091
Chemical NMDS 1 -0.469 0.644 0.371
Chemical NMDS 2 0.966 0.346 0.511
Chemical NMDS 3 -0.201 0.843 0.524
Foliar NMDS axis 2
Overall Model 0.734 3, 20 0.544 0.099
Chemical NMDS 1 -0.767 0.452 0.208
Chemical NMDS 2 -1.41 0.173 0.286
Chemical NMDS 3 0.323 0.750 0.293

21
Figure 1.1. Variation in light transmittance for field plots of 24 genotypes of S. altissima.
Data plotted are means with SE
0
10
20
30
40
50
60
70
80
90
100
1 2 3 4 5 6 7 8 9 10 11 12 13 14 15 16 17 18 19 20 21 22 23 24
% L
igh
t tr
ansm
itta
nce
S. altissima genotype
22
Figure 1.2. Scatterplot of chemical NMDS values illustrating the diversity of chemical
expression across S. altissima genotypes.
-2
-1.5
-1
-0.5
0
0.5
1
-0.8 -0.6 -0.4 -0.2 0 0.2 0.4 0.6 0.8 1 1.2
NM
DS
Ch
emic
al a
xis
1
NMDS Chemical axis 3

23
Figure 1.3. Relationship between % light transmittance and NMDS chemical axis 3. Data
plotted are means for light transmittance for each genotype with trend line.
0
10
20
30
40
50
60
70
80
90
100
-0.8 -0.6 -0.4 -0.2 0 0.2 0.4 0.6 0.8 1 1.2
% L
igh
t Tr
ansm
itta
nce
NMDS Chemical axis 3

24
Figure 1.4. Relationship between stem density and NMDS chemical axis 3. Data plotted
are mean stem densities for each genotype with trend line.
0
1
2
3
4
5
6
7
8
9
-0.8 -0.6 -0.4 -0.2 0 0.2 0.4 0.6 0.8 1 1.2
Stem
den
sity
NMDS Chemical axis 3

25
Figure 1.5. Relationship between NMDS chemical axis 1 and pollinator NMDS axis 1
with trend line.
26
DISCUSSION
Genotypes of S. altissima did not show much variation across plant performance
measures. Measures of stem density and proportion of flower mass varied little across all
genotypes, indicating these genotypes have overall similar stem, leaf, and flower growth.
However, % light transmittance did vary significantly (Fig. 1.1), suggesting that certain
genotypes are better able to capture sunlight. As light attenuation would also be a
combination of stem density and the amount/arrangement of leaf tissue, it is interesting
that only light interception varied. Light competition is strong in the early successional
environments often occupied by S. altissima (Banta et al. 2008), suggesting that these
genotypes may vary in their light competitive ability. This variation may then allow for
resource-allocation trade-offs between competitive ability and other life history strategies
such as plant defense, stem architecture, and leaf density (Hakes and Cronin, 2012; Banta
et al. 2008). However, some of this variation in light interception may be due to natural
disturbances that create gaps in the canopy that allow for more space and resources
within the community (Carson and Pickett, 1990). Though the 24 genotypes of S.
altissima did not vary much in the plant performance measures, there was great variation
in foliar chemistry between the genotypes (Fig. 1.2), which may lead to potential
intraspecific variation in ecological function of each genotype as some suggested (Heath
et al. 2014; Bosio et al. 1990).
Ecological patterns existed between foliar chemistry and plant performance, as
foliar chemistry was strongly related to most measures of plant performance across
genotypes. Of the three plant performance measures in the analyses, only the proportion
of flower mass was not related to any chemical NMDS axes (Table 1.3). Both stem
27
density and % light transmittance were significantly influenced by chemical NMDS axis
3. Stem density was negatively related to NMDS axis 3 (Fig. 1.4), while light
transmittance was positively related (Fig. 1.3), reflecting their inverse relationship.
Mechanistically, lower stem densities would allow for greater light transmittance to the
ground, thus, these chemicals related to axis 3 are associated with plant competitiveness.
Though chemicals associated with axis 3 may not directly contribute to larger overall
biomass growth of stems and leaf tissues, other aspects of chemistry can still contribute
to the success of these genotypes via allocation of resources to chemical defense and
attractants for pollinators (Heath et al. 2014; Szymura and Szymura, 2015).
Foliar insect composition was not aligned with any of the plant performance
measures (Table 1.4). Though foliar insects were independent from plant performance,
there was some association between the foliar and floral insects, suggesting that these
insects share a common pattern in response to some aspect of the S. altissima genotypes.
Patterns also arose between plant performance and pollinator insects as pollinator
communities were associated with total S. altissima aboveground biomass, proportion of
flower mass, and % light transmittance (Table 1.4). Pollinator NMDS axis 1 was
correlated with total S. altissima aboveground biomass and proportion of flower mass,
while pollinator NMDS axis 2 was correlated with % light transmittance. The pollinator
insects related to pollinator NMDS axis 1 were related to plant growth, where these
pollinator insects decrease when there are higher proportions of flowers and above-
ground biomass growth. Pollinator insects related to NMDS axis 2, however, are
positively linked with plant growth as these insects associate with genotypes that have
less light transmittance and more vegetative growth. Vegetative biomass was
28
significantly correlated with floral biomass (Pearson correlation: r = 0.828, p <0.0001),
indicating that these better performing genotypes disproportionally have more flowers,
which may contribute to the attraction of these floral insects. This variation in insect
community response may be a reflection of the multi-functionality of plant chemicals;
these chemicals may affect the pollinators directly, as well as indirectly via plant
performance (Hale and Kalisz, 2012, Abhilasha et al. 2008).
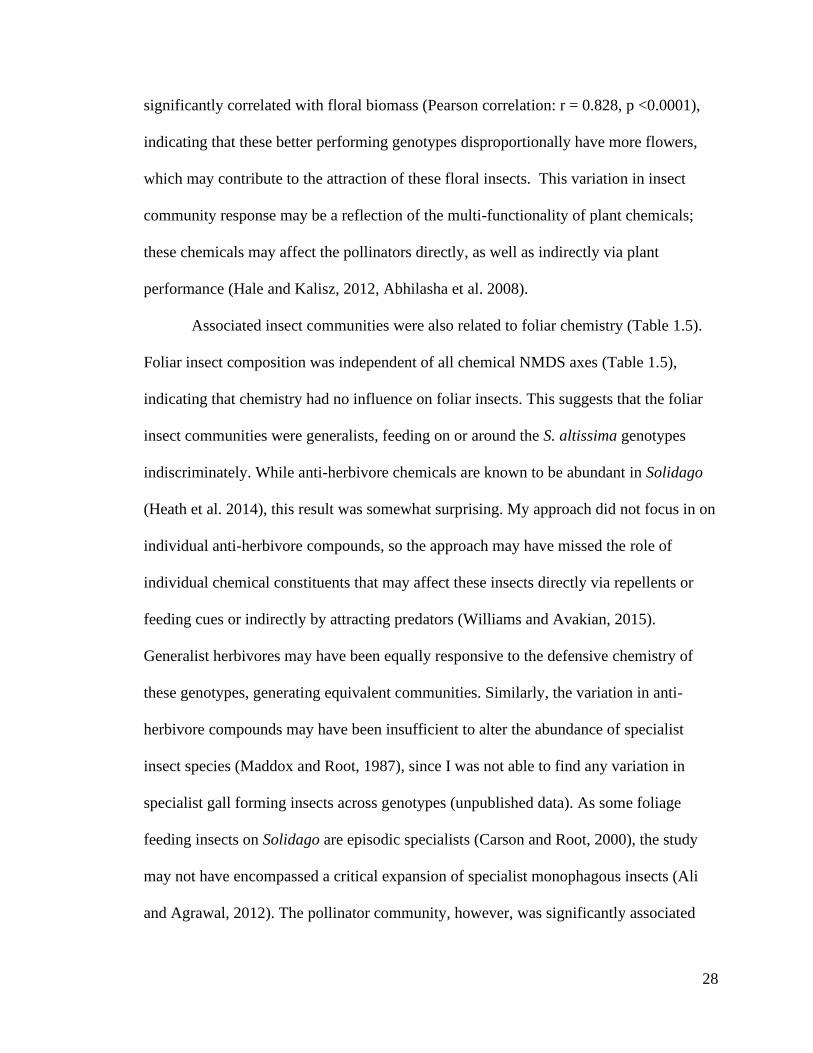
Associated insect communities were also related to foliar chemistry (Table 1.5).
Foliar insect composition was independent of all chemical NMDS axes (Table 1.5),
indicating that chemistry had no influence on foliar insects. This suggests that the foliar
insect communities were generalists, feeding on or around the S. altissima genotypes
indiscriminately. While anti-herbivore chemicals are known to be abundant in Solidago
(Heath et al. 2014), this result was somewhat surprising. My approach did not focus in on
individual anti-herbivore compounds, so the approach may have missed the role of
individual chemical constituents that may affect these insects directly via repellents or
feeding cues or indirectly by attracting predators (Williams and Avakian, 2015).
Generalist herbivores may have been equally responsive to the defensive chemistry of
these genotypes, generating equivalent communities. Similarly, the variation in anti-
herbivore compounds may have been insufficient to alter the abundance of specialist
insect species (Maddox and Root, 1987), since I was not able to find any variation in
specialist gall forming insects across genotypes (unpublished data). As some foliage
feeding insects on Solidago are episodic specialists (Carson and Root, 2000), the study
may not have encompassed a critical expansion of specialist monophagous insects (Ali
and Agrawal, 2012). The pollinator community, however, was significantly associated
29
with foliar chemical composition as pollinator NMDS axis 1 was positively correlated
with chemical NMDS axis 1 (Fig. 1.5). This demonstrates that the pollinator community
is responding positively to some of the chemicals in these S. altissima populations,
generating patterns between the pollinator insect communities and chemistry. Here,
chemistry may be facilitating these interactions, positively altering floral attractiveness
but also adversely affecting other traits such as net photosynthesis and/or overall vigor
(Hale and Kalisz, 2012).
These data outlined here demonstrates the multidimensionality and variation of
the S. altissima chemical landscape. Foliar chemical composition varied across genotypes
and aligned with both plant performance measures as well as composition of the insect
communities; showing that phytochemical composition has multiple functions within S.
altissima. Independent axes of chemistry were correlated to different functions, those
functions being performance and plant-insect associations. Here, chemistry is not only
affecting the pollinator community directly (Fig. 1.5), but they are also affecting them
indirectly via plant performance and physiology, which then affects the pollinator
community. Among genotypes, chemical composition seems to be facilitating many of
the ecological functions, generating patterns between chemistry, plant performance, and
insect communities; with independent axes of foliar chemistry affecting different
components of the system, either directly or indirectly. The results reported here
represent an important framework linking chemical composition to both plant
performance and insect communities. These chemicals not only vary greatly and serve
multiple ecological functions, but they are also very essential in the establishment and
success of the Solidago altissima plant species.
30
CHAPTER 2
EFFECTS OF CHEMICAL VARIATION ON INTERSPECIFIC PLANT COMPETITION
ABSTRACT
In clonal plant species, both inter- and intraspecific competition can affect fitness
via changes in growth and reproductive allocation. Competing demands for resources
inevitably lead to trade-offs in investment between defense against herbivory,
reproductive efficiency, and competition against other plant species. For allelopathic
plants, the optimal balance of investment in competition versus other ecological functions
may ultimately depend on chemical production and their associated costs.
To assess the effects of foliar chemical variation on interspecific plant
competition, I conducted competitive trials in a greenhouse setting using 24 genotypes of
Solidago altissima with known chemical profiles. Clones of each genotype competed
with four common target species: Schizachyrium scoparium, Melilotus officinalis,
Silphium integrifolium, and Abutilon theophrasti. After 60 days (37 for Abutilon),
aboveground biomass was harvested, along with S. altissima biomass and the rhizome
biomass.
Genotypes of S. altissima showed marked variation in both rhizome and above-
ground biomass growth, demonstrating diverse resource allocation among genotypes. The
above-ground biomass of target species varied drastically when compared to the non-
competition pots. Abutilon theophrasti, S. scoparium, and S. integrifolium all had their
biomass significantly reduced via competition with S. altissima. Regression analyses
revealed that chemistry significantly affected the biomass of both A. theophrasti and S.

31
scoparium, suggesting chemistry is a critical driver of competition for S. altissima in at
least some situations. Foliar chemistry of S. altissima also affected its own biomass,
where chemical NMDS axis 2 was negatively associated with rhizome biomass and axis
3 is positively associated with aboveground biomass. This pattern may be due to possible
tradeoffs between expensive classes of compounds and growth, which then may be offset
by the benefits of the chemical production.
The results reported here illustrate the strong and diverse competitive ability of S.
altissima and how its chemistry may be a critical component to its competitive success.
These results are also consistent with my findings in the previous chapter, highlighting
the importance of chemistry as the main driver for many S. altissima interactions, both at
the intra- and interspecific scale; where chemical production is may create various
tradeoffs between competitive ability, biomass, insect associations, and other plant
performance measures, suggesting alternative strategies across genotypes.
INTRODUCTION
In clonal plant species, both inter- and intraspecific competition can affect fitness
via changes in growth and reproductive allocation (Van Kleunen et al. 2001). Competing
demands for resources inevitably lead to trade-offs in investment between defense against
herbivory, reproductive efficiency, and competition against other plant species (Uesugi et
al. 2017; Van Kleunen et al. 2001). However, the optimal balance of investment in
competition versus other ecological functions will ultimately depend on ecological
conditions such as local density, diversity of herbivores, plant chemical composition, and

32
competitor plant communities, which are all likely to vary over time and space (Uesugi et
al. 2017; Adomako et al. 2019).
One mechanism that allows for colonial plants to rapidly dominate large
landscapes and compete for resources is allelopathy. Allelopathic compounds are
released into the environment as root exudates, volatile organic compounds, leaf leachate,
or leaf litter (Uesugi et al. 2019; Inderjit et al. 2011). Allelochemicals may reduce the
germination and/or growth of neighboring species, increasing access to resources by
directly suppressing neighbor growth or indirectly by affecting microbial mutualists or
nutrient availability (Meiners et al. 2012; Uesugi et al. 2019). These allelochemicals may
also exhibit multi-functionality, where they may simultaneously function to defend
against herbivory, attract pollinators, and/or enhance competitive ability (Beran et al.
2019; Inderjit et al. 2011).
However, the production of allelopathic chemicals is thought to be energetically
costly, where the benefits and costs of allelochemical production vary across time and
space with variation in competition (Kong et al. 2018). Natural selection may favor plant
genotypes within heterogeneous competitive environments that employ induced
production of allelochemicals, rather than genotypes that constitutively produce high
levels of these chemicals (Uesugi et al. 2019; Novoplansky 2009; Kegge and Pierik
2009). If the variation of allelochemical production is a cost-saving strategy, we should
expect some sort of ecological trade-off between allelopathic chemical production and
plant performance/competitive ability (Uesugi et al. 2019).
To assess the effects of foliar chemical variation on interspecific plant
competition, I conducted competitive trials in a greenhouse setting using 24 genotypes of

33
Solidago altissima with known chemical profiles. Clones of each genotype, competed
with four common target species: Schizachyrium scoparium, Melilotus officinalis,
Silphium integrifolium, and Abutilon theophrasti. Using these data, I attempt to explicitly
link foliar chemical composition of S. altissima genotypes to interspecific plant-plant
competition.
METHODS
Background and study/target species
Solidago altissima is a model system for studying allelopathy in response to
competition under experimental and natural environments (Uesugi et al. 2019). Solidago
altissima is a clonal perennial that is common in old fields and other open habitats across
its native range of Eastern North America (Yip et al. 2019). Solidago altissima has a
diverse allelochemical composition, allowing it to be a successful invader across Europe,
Japan, and Australia (Abhilashaet al. 2019; Webber, 1999; Uesugi et al. 2019). Within its
native range, newly established populations of S. altissima are composed of a large
number of genetic individuals. However, as S. altissima densities increase via clonal
expansion, inferior genotypes are displaced, leading to fewer genotypes within older
populations (Hartnett and Bazzaz, 1985). Since S. altissima populations are expected to
be more genetically variable before genotype sorting, I would expect the greatest
phytochemical diversity to also occur in younger populations.
Schizachyrium scoparium (Little bluestem) is a C4 grass which is a major
component in mesic habitats across its native habitat of central North America (Van
Auken and Bush, 1988). Schizachyrium scoparium is a very competitive species,

34
especially in less productive, nitrogen-poor soils; where its efficient nutrient consumption
allows it to dominate (Tilman, 1989). Melilotus officinalis (Yellow sweet clover) is a
biennial legume that is native to Eurasia (Klebesadel, 1992). Due to this species nitrogen
fixing ability, it has been introduced and become naturalized throughout the world and
has become a conservation problem across North America (Van Riper and Larson, 2009;
Wolf et al. 2003). Silphium integrifolium (Rosinweed) is a deep-rooted, perennial forb
endemic to tallgrass prairies of the Midwestern United Sates (Tooker and Hanks, 2006;
Fay et al. 1993). Silphium integrifolium consists of a few to about 100 shoots which form
tightly packed clumps, suggesting below-ground processes are critical to this plants
survival (Fay et al. 1993). Abutilon theophrasti (Velvetleaf) is an introduced annual weed
found across the Midwestern United States (Lee and Bazzaz, 1980). Abutilon theophrasti
is a specialist within early successional communities, dominating areas with low
competition where it grows rapidly (Sattin et al. 1992).
Rhizome collection and transplanting
In early May of 2019, 5 rhizomes from each genotype of S. altissima were
collected from a common garden, a level section of land in Clark County, IL (39° 19’ N;
87° 55’ W). Rhizomes 6-10 cm in length were collected to standardize among the
rhizomes. All rhizomes were washed with water and individually planted in 15.0 cm
diameter x 14.5 cm tall standard round pots filled with all-purpose professional growing
mix (Pro-Mix, Premier Tech., QC). Rhizomes were planted approximately 1.5 cm. deep
and 2.5 cm. from the edge of the pots and watered consistently. Any rhizomes that died
were replaced within the first two weeks of transplanting.
35
Target species transplanting
Seeds of Schizachyrium scoparium and Silphium integrifolium were procured
from Prairie moon nursery (Winona, MN), Melilotus officinalis from Seed world USA
(Tampa, FL) and Abutilon theophrasti were collected from our common garden site. In
early May 2019, seeds of Abutilon theophrasti were treated with hot water (60◦ C) for 1
hour. Once dormancy was broken, seeds of all four target species were germinated in
their own flats in the greenhouse for one week. Individual seedlings of each target species
were then transplanted into the pots containing S. altissima rhizomes, with one seedling
per species in each pot. All seedlings and rhizomes were planted in a circular fashion
with even spacing, in the same exact order for every pot (Fig. 2.1). An additional 10
control pots that only contained the four target species were intermingled with the
competition pots. Once all seedling were transplanted, pots were put into a randomized
order on the greenhouse bench. During the first week after transplanting, any dead target
species were replaced. All experimental pots were watered and weeded consistently and
were allowed to grow for 60 days except for Abutilon theophrasti (37 days), because of
its rapid growth. The growing time was set at 60 days due to the sizes of the pots; after 60
days, target species and S. altissima would grow too large and possibly become
entangled.
Biomass harvest
After the growing period, all seedlings were harvested. For each pot, the above-
ground biomass for the four target species and S. altissima were harvested by cutting all

36
stems 0.5 cm from the soil surface. The below-ground biomass of the S. altissima
rhizomes were also collected from each pot. Tissues were dried at 60◦ C for 48 hours and
weighed. For S. altissima rhizomes, all dirt and root hairs were removed after drying and
prior to it being weighed. The biomass data for all 5 replicates per S. altissima genotype
were then pooled to form a single average value per genotype to avoid issues of pseudo
replication.
Data analysis: Variation among Genotypes & Target species
Variation in the above and below-ground biomass was compared across all
genotypes of S. altissima using a series of one-way ANOVA’s. Separate one-way
ANOVA’s were also conducted on the average biomass in each of the 24 competition and
control pots to test whether direct competition with S. altissima significantly affected the
biomass of all four target species. Separate bar graphs were then made to help illustrate
the variation in biomass growth of both target species and S. altissima.
Data analysis: Target species performance vs. S. altissima performance & chemistry
A series of multiple regression analyses were conducted to relate performance of
the target species to the above/belowground biomass as well as the foliar chemistry of S.
altissima. Initially, S. altissima rhizome biomass was included as a predictor in these
models, however, it was removed due to non-significance. These multiple regression
analyses were used to predict the influence of S. altissima biomass and chemistry on the
growth of all four target species. Separate scatterplots were then made to help visualize
some of these significant associations.

37
Data analysis: S. altissima above- and belowground biomass vs. chemistry
To detect any effects of chemistry on the above- and belowground biomass of S.
altissima genotypes a series of multiple regression analyses were conducted. The three
chemical NMDS axis were used as predictors in these analyses. All statistical analyses
were done using R version 3.1.2 (R Foundation for Statistical Computing).

38
Figure 2.1. Arrangement of focal S. altissima and target species seedlings in experimental
pots.
39
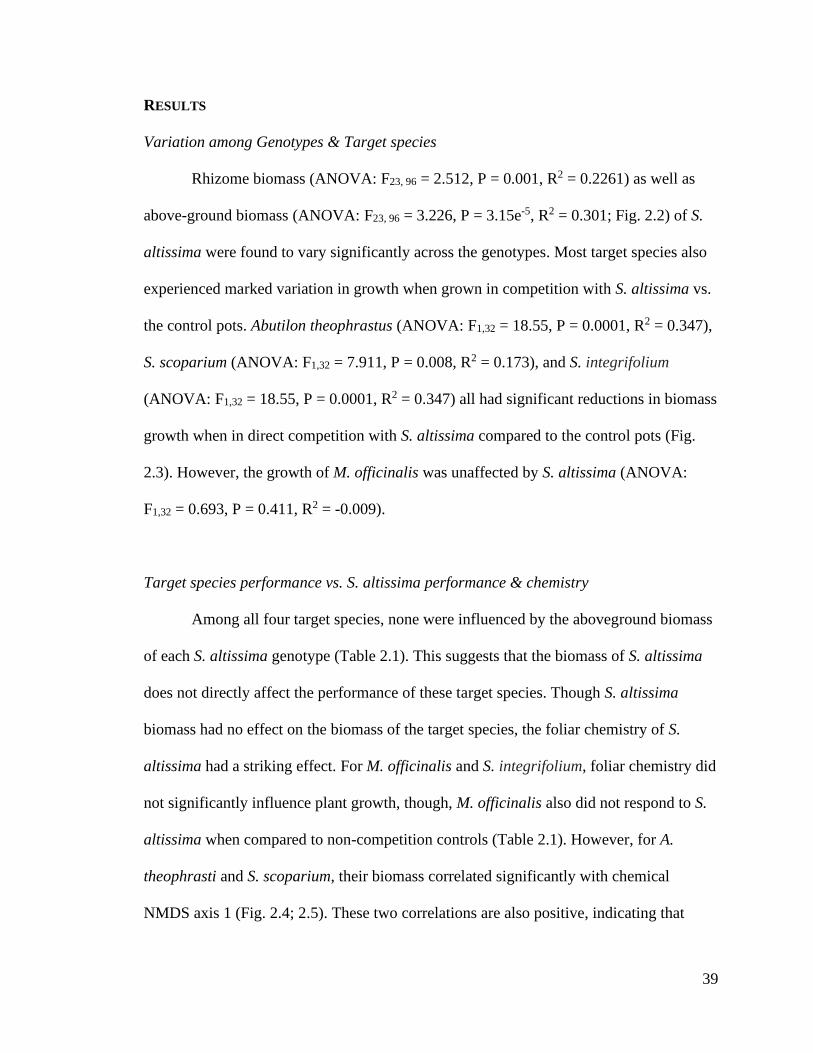
RESULTS
Variation among Genotypes & Target species
Rhizome biomass (ANOVA: F23, 96 = 2.512, P = 0.001, R2 = 0.2261) as well as
above-ground biomass (ANOVA: F23, 96 = 3.226, P = 3.15e-5, R2 = 0.301; Fig. 2.2) of S.
altissima were found to vary significantly across the genotypes. Most target species also
experienced marked variation in growth when grown in competition with S. altissima vs.
the control pots. Abutilon theophrastus (ANOVA: F1,32 = 18.55, P = 0.0001, R2 = 0.347),
S. scoparium (ANOVA: F1,32 = 7.911, P = 0.008, R2 = 0.173), and S. integrifolium
(ANOVA: F1,32 = 18.55, P = 0.0001, R2 = 0.347) all had significant reductions in biomass
growth when in direct competition with S. altissima compared to the control pots (Fig.
2.3). However, the growth of M. officinalis was unaffected by S. altissima (ANOVA:
F1,32 = 0.693, P = 0.411, R2 = -0.009).
Target species performance vs. S. altissima performance & chemistry
Among all four target species, none were influenced by the aboveground biomass
of each S. altissima genotype (Table 2.1). This suggests that the biomass of S. altissima
does not directly affect the performance of these target species. Though S. altissima
biomass had no effect on the biomass of the target species, the foliar chemistry of S.
altissima had a striking effect. For M. officinalis and S. integrifolium, foliar chemistry did
not significantly influence plant growth, though, M. officinalis also did not respond to S.
altissima when compared to non-competition controls (Table 2.1). However, for A.
theophrasti and S. scoparium, their biomass correlated significantly with chemical
NMDS axis 1 (Fig. 2.4; 2.5). These two correlations are also positive, indicating that

40
these two species’ biomass growth are positively influenced by chemicals positively
related to axis 1.
S. altissima above- and belowground biomass vs. chemistry
Plant chemistry was also found to significantly affect both the above- and
belowground biomass of S. altissima genotypes (Table 2.2). NMDS axis 3 was positively
correlated with aboveground biomass while NMDS axis 2 was negatively correlated with
belowground biomass, suggesting tradeoffs within the chemical landscape in biomass
resource allocation.
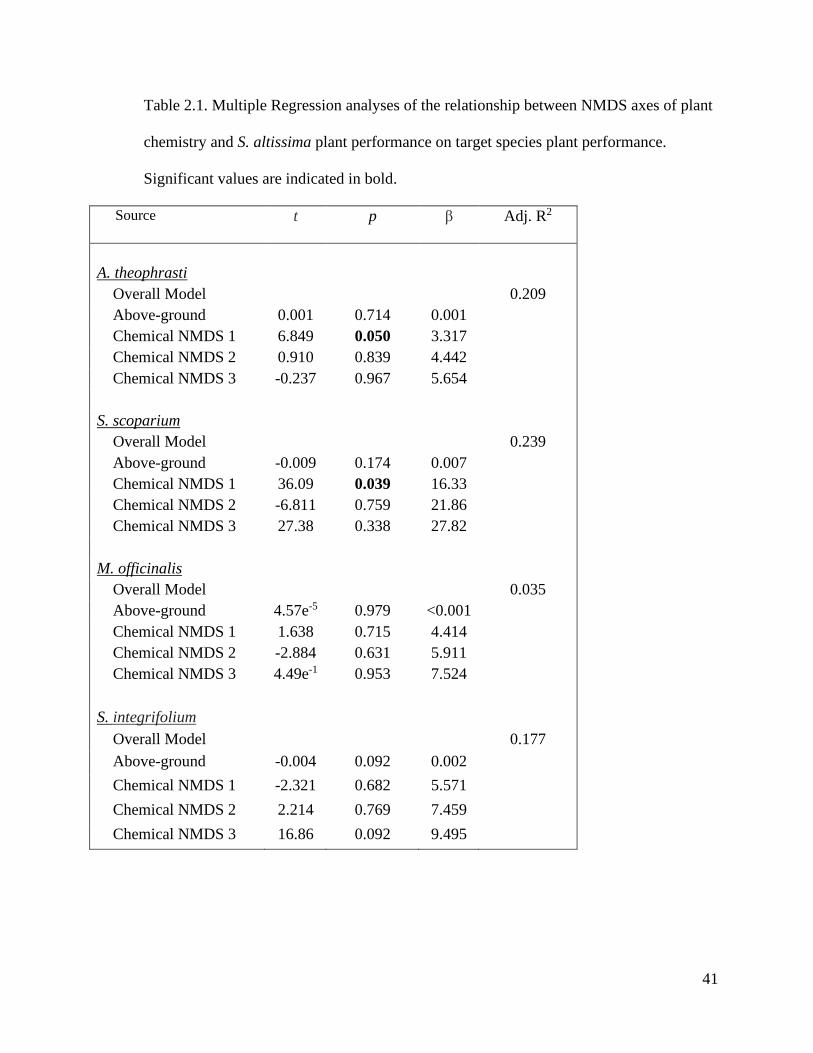
41
Table 2.1. Multiple Regression analyses of the relationship between NMDS axes of plant
chemistry and S. altissima plant performance on target species plant performance.
Significant values are indicated in bold.
Source t p β Adj. R2
A. theophrasti
Overall Model 0.209
Above-ground 0.001 0.714 0.001
Chemical NMDS 1 6.849 0.050 3.317
Chemical NMDS 2 0.910 0.839 4.442
Chemical NMDS 3 -0.237 0.967 5.654
S. scoparium
Overall Model 0.239
Above-ground -0.009 0.174 0.007
Chemical NMDS 1 36.09 0.039 16.33
Chemical NMDS 2 -6.811 0.759 21.86
Chemical NMDS 3 27.38 0.338 27.82
M. officinalis
Overall Model 0.035
Above-ground 4.57e-5 0.979 <0.001
Chemical NMDS 1 1.638 0.715 4.414
Chemical NMDS 2 -2.884 0.631 5.911
Chemical NMDS 3 4.49e-1 0.953 7.524
S. integrifolium
Overall Model 0.177
Above-ground -0.004 0.092 0.002
Chemical NMDS 1 -2.321 0.682 5.571
Chemical NMDS 2 2.214 0.769 7.459
Chemical NMDS 3 16.86 0.092 9.495

42
Table 2.2. Multiple Regression analyses of the relationship between NMDS axes of plant
chemistry on S. altissima above- and belowground biomass. Significant values are
indicated in bold.
Source t p β Adj. R2
Above-ground biomass
Overall Model 0.279
Chemical NMDS 1 -594.6 0.280 535.9
Chemical NMDS 2 -230.4 0.758 737.5
Chemical NMDS 3 2509 0.003 755.5
Below-ground biomass
Overall Model 0.105
Chemical NMDS 1 -110.8 0.221 87.72
Chemical NMDS 2 -262.6 0.042 120.7
Chemical NMDS 3 96.69 0.444 123.7
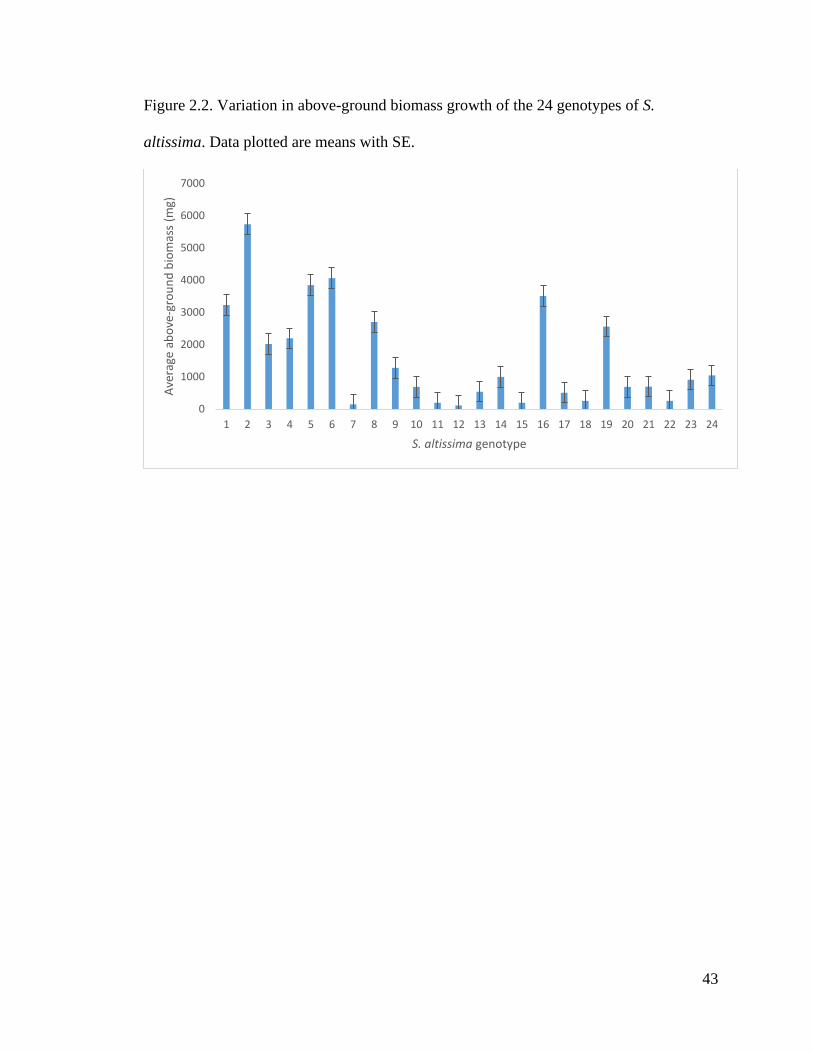
43
Figure 2.2. Variation in above-ground biomass growth of the 24 genotypes of S.
altissima. Data plotted are means with SE.
0
1000
2000
3000
4000
5000
6000
7000
1 2 3 4 5 6 7 8 9 10 11 12 13 14 15 16 17 18 19 20 21 22 23 24
Ave
rage
ab
ove
-gro
un
d b
iom
ass
(mg)
S. altissima genotype

44
Figure 2.3. Biomass of target species when grown in control pots vs. competition with S.
altissima. Data plotted are means with SE.
-50
0
50
100
150
200
250
300
A. theophrasti S. scoparium M. officianalis S. integrifolium
Bio
mas
s gr
ow
th (
mg)
Target species
Competition Control

45
Figure 2.4. Relationship between A. theophrasti biomass growth and NMDS chemical axis
1. Data plotted are mean biomass of A. theophrasti with each clone with trend line.
0
5
10
15
20
25
30
35
40
45
50
-2 -1.5 -1 -0.5 0 0.5 1
A. t
heo
ph
rast
i bio
mas
s gr
ow
th (
mg)
NMDS Chemical axis 1

46
Figure 2.5. Relationship between S. scoparium biomass growth and NMDS chemical axis
1. Data plotted are means for S. scoparium biomass growth with trend line.
0
50
100
150
200
250
-2 -1.5 -1 -0.5 0 0.5 1
S. s
cop
ari
um
bio
mas
s gr
ow
th (
mg)
NMDS Chemical axis 1
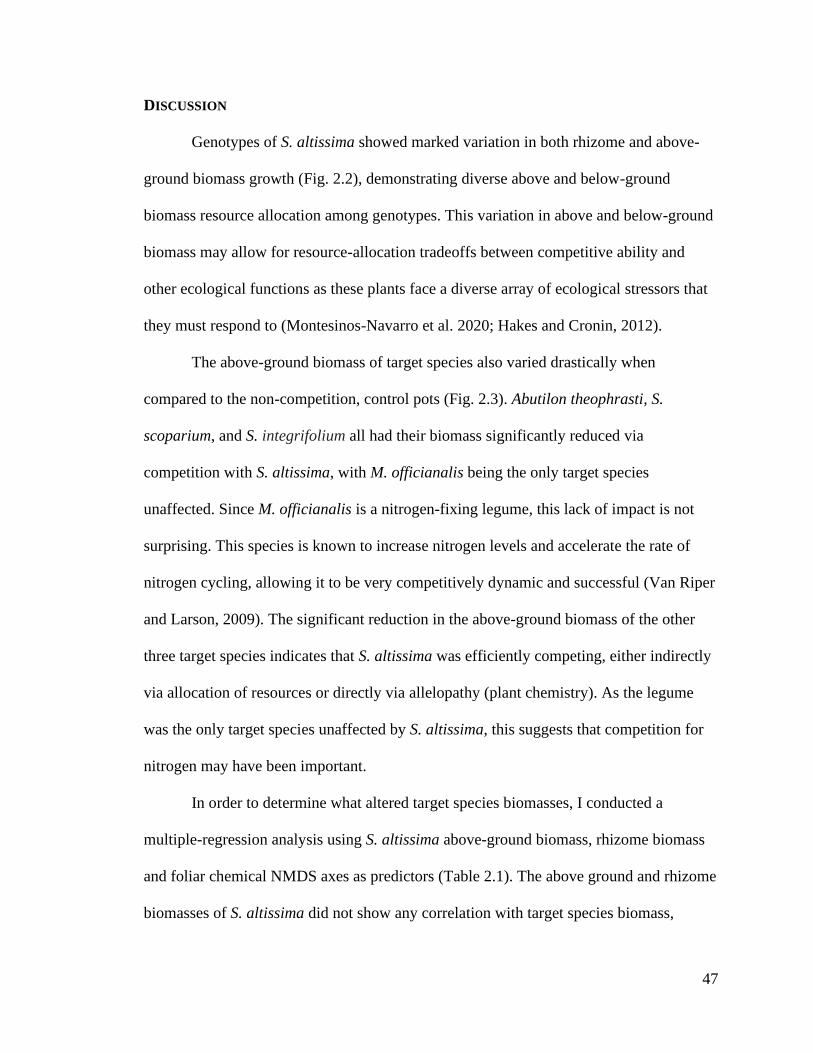
47
DISCUSSION
Genotypes of S. altissima showed marked variation in both rhizome and above-
ground biomass growth (Fig. 2.2), demonstrating diverse above and below-ground
biomass resource allocation among genotypes. This variation in above and below-ground
biomass may allow for resource-allocation tradeoffs between competitive ability and
other ecological functions as these plants face a diverse array of ecological stressors that
they must respond to (Montesinos-Navarro et al. 2020; Hakes and Cronin, 2012).
The above-ground biomass of target species also varied drastically when
compared to the non-competition, control pots (Fig. 2.3). Abutilon theophrasti, S.
scoparium, and S. integrifolium all had their biomass significantly reduced via
competition with S. altissima, with M. officianalis being the only target species
unaffected. Since M. officianalis is a nitrogen-fixing legume, this lack of impact is not
surprising. This species is known to increase nitrogen levels and accelerate the rate of
nitrogen cycling, allowing it to be very competitively dynamic and successful (Van Riper
and Larson, 2009). The significant reduction in the above-ground biomass of the other
three target species indicates that S. altissima was efficiently competing, either indirectly
via allocation of resources or directly via allelopathy (plant chemistry). As the legume
was the only target species unaffected by S. altissima, this suggests that competition for
nitrogen may have been important.
In order to determine what altered target species biomasses, I conducted a
multiple-regression analysis using S. altissima above-ground biomass, rhizome biomass
and foliar chemical NMDS axes as predictors (Table 2.1). The above ground and rhizome
biomasses of S. altissima did not show any correlation with target species biomass,

48
suggesting a functional role for chemistry within these competitive trials. NMDS
chemical axis 1 did in fact significantly affect the biomass of two of the target species,
signifying that chemistry is a critical driver of competition for S. altissima. Both A.
theophrasti (Fig. 2.4) and S. scoparium (Fig. 2.5) had their biomass significantly affected
by chemical NMDS axis 1, revealing that the chemicals related to this axis are the ones
responsible for the reduction of biomass growth. The associations between these two
target species and NMDS axis 1 were both positive, where target biomass increases with
chemicals positively associated with this axis. Though we know the association between
this chemical axis and target biomass, we still do not know whether or not this
association is due to the presence or absence of certain chemicals. Due to the design of
my analyses, the directionality of these associations cannot be determined, as my project
did not encompass chemical concentration and identification protocols. These chemicals
are playing a vital role in in mitigating interspecific competition within these competitive
trials, consistent with findings from other similar competitive experiments involving
Solidago (Abhilasha et al. 2008). Though these chemical traits are similar across
experimental competitive trials, this may not be a general competitive response across
both native and non-native ranges for S. altissima. Levels of secondary compounds have
been found to vary between native and non-native populations of Solidago, with higher
levels of some chemicals being found in native ranges. This suggests a lower investment
into these chemicals as plant competitors in these invasive ranges are naturally more
susceptible (Abhilasha et al. 2008).
Foliar chemistry of S. altissima also affected its own biomass, both above -ground
and rhizome. Chemical NMDS axis 2 and 3 were both correlated with above- and

49
belowground biomass growth (Table 2.2), with axis 2 negatively associated with
belowground biomass and axis 3 positively affecting aboveground biomass. This
suggests that there are certain costs to producing these chemicals related to these two
axes; possibly due to tradeoffs between expensive classes of compounds and cheap ones,
which may be offset by the benefits of chemical production (Neilson et al. 2013; Poorter
and De Jong, 1999). At whatever cost, foliar chemistry of S. altisisma seems to be
performing a variety of functions, causing physiological changes to both itself and
competitors in response to interspecific competition (Montesinos-Navarro et al. 2020).
These competition trials demonstrated that S. altissima competed at a high level,
even in competition with seedlings of multiple plant species. The data outlined here
shows a direct effect of biomass reduction when target plants are grown in competition
with S. altissima compared to control pots. The above and below-ground biomass of S.
altissima also varied greatly across genotypes. This suggests resource-allocation tradeoffs
between biomass investment and chemical production, where genotypes allocating more
resources to allelochemicals are expected to have reductions in growth and reproduction,
which is then offset by the benefits from the chemicals (Meiners et al. 2012). The
reduction in the biomass of target species may be a reflection of S. altissima’s
allelopathic capabilities, since chemistry was found to correlate with some of the target
species biomass. Though directionality is unknown, we do know that the target species’
biomass growth is influenced by chemicals related to axis 1. Foliar chemistry of S.
altissima was also found to affect other ecological functions outside of interspecific
competition. NMDS chemical axis 2 & 3 were found to correlate with S. altissima above-
and belowground biomass, possibly aiding in the functions of light attenuation and

50
nutrient absorption as there was no need for or benefit to herbivore defense in the
greenhouse.
The results reported here represent the diverse array of functions that are
performed or affected by S. altissima chemistry. These results are also consistent with my
findings in the previous chapter, highlighting the importance of chemistry as the main
driver for S. altissima, where chemical production is creating various tradeoffs between
competitive ability, biomass, insect associations, and other plant performance measures.

51
CONCLUDING REMARKS
In both the common garden study and the greenhouse experiment, S. altissima
showed marked variation in both above and below-ground biomass growth across
genotypes. Coupled with their variation in foliar chemistry, these S. altissima genotypes
showed great chemical and physiological diversity. The functional relationships of these
chemicals were also found to vary greatly as all three NMDS axes were found to be
associated with plant functions ranging from competitive ability, biomass resource
allocation, and insect associations. This study highlights the fact that plant chemistry is
playing a critical role in the ecological functioning of these plants, creating tradeoffs
between these functions across genotypes. Chemistry is clearly involved in the success of
S. altissima in its native range. However, we should not expect these chemical responses
to stay consistent across native and invasive ranges since selection pressure and
competitor community responses likely change with invasion.
The study of secondary metabolites and their roles in plants has been extensively
covered in the scientific community, particularly with regards to herbivore defenses.
However, the main focus on one or a few chemicals and their functions leaves many
questions unanswered. Recommendations from this study would be to focus on
separating allelochemical effects from others chemical roles as well as to include the
interaction between plant chemicals and soil biota. In order to create a broader, more
holistic view of the ecological importance of intraspecific chemical variation, the cost
and maintenance of chemical production must be studied in parallel with their functions
and underlying molecular mechanisms. This study is a good start in determining the
importance of allelopathy, however, much more will be needed in order to build upon the

52
foundation of studies focusing on the role and importance of these secondary metabolites,
as to build a broader ecological context.
53
LITERATURE CITED
Abhilasha D, Quintana N, Vivanco J, Joshi J. 2008. Do allelopathic compounds in
invasive Solidago canadensis s.I. restrain the native European flora? Journal of Ecology
96: 993-1001.
Abrahamson WG, McCrea KD, Whitwell AJ, Vernieri LA. 1991. The role of phenolics in
Goldenrod ball gall resistance and formation. Biochemical Systematics and Ecology 19
(8): 615-622.
Abrahamson WG, Weis AE. 1997. Evolutionary ecology across three trophic levels:
Goldenrods, gallmakers, and natural enemies. Princeton, NJ: Princeton University Press.
Adler LS, Wink M, Distl M, Lentz AJ. 2006. Leaf herbivory and nutrients increase nectar
alkaloids. Ecology Letters 9: 960-967.
Adomako MO, Ning L, Tang M, Du DL, van Kleunen M, Yu, FH. 2019. Diversity- and
density-mediated allelopathic effects of resident plant communities on invasion by an
exotic plant. Plant Soil 440: 581-592.
Ali JG, Agrawal AA. 2012. Specialist versus generalist insect herbivores and plant
defense. Trends in Plant Science 17 (5): 293.

54
Banta JA, Stark SC, Stevens MHH, Pendergast TH, Baumert A, Carson WP. 2008. Light
reduction predicts widespread patterns of dominance between Asters and Goldenrods.
Plant Ecology 199 (1): 65-76.
Bardgett RD, Wardle DA, Yeates GW. 1998. Linking above-ground and below-ground
interactions: How plant responses to foliar herbivory influence soil organisms. Soil Biol.
Biochem. 30 (14): 1867-1878.
Beran F, Kollner TG, Gershenzon J, Tholl D. 2019. Chemical convergence between
plants and insects: biosynthetic origins and functions of common secondary metabolites.
New Phytologist 223: 52-67.
Bosio CF, McCrea KD, Nitao JK, Abrahamson WG. 1990. Defense chemistry of
Solidago altissima: Effects on the generalist herbivore Trichoplusia ni (Lepidoptera:
Noctuidae). Entomological Society of America 19 (3): 465-468.
Carson WP, Pickett STA. 1990. Role of resources and disturbance in the organization of
an old-field plant community. Ecology: 71 (1): 226-238.
Carson WP, Root RB. 2000. Herbivory and plant species coexistence: Community
regulation by an outbreaking phytophagous insect. Ecological Monographs 70 (1): 73-99.

55
Duke SO. 2015. Proving allelopathy in crop-weed interactions. Weed Science 63: 121-
132.
Fay PA, Hartnett DC, Knapp AK. 1993. Increased photosynthesis and water potentials in
Silphium integrifolium galled by Cynipid wasps. Oecologia 93 (1): 114-120.
Gross RS, Werner PA. 1983. Relationships among flowering phenology, insect vectors,
and seed-set of individuals: Experimental studies on four co-occurring species of
Goldenrod (Solidago: Compositae). Ecological Monographs 53 (1): 95-117.
Hafdahl CE, Craig TP. 2014. Flowering phenology in Solidago altissima: adaptive
strategies against temporal variation in temperature. Journal of Plant Interactions 9 (1):
122-127.
Hakes AS, Cronin JT. 2012. Successional changes in plant resistance and tolerance to
herbivory. Ecology 93 (5): 1059-1070.
Hale AN, Kalisz S. 2012. Perspectives on allelopathic disruption of plant mutualisms: a
framework for individual- and population-level fitness consequences. Plant Ecol 213:
1991-2006.
Halligan JP. 1973. Bare areas associated with shrub stands in Grassland: The case of
“Artemisia californica”. BioScience 23 (7): 429-432.

56
Hartnett DC, Bazzaz FA. 1985. The genet and ramet population dynamics of Solidago
canadensis in an abandoned field. Journal of Ecology 73 (2): 407-413.
Heath JJ, Kessler A, Woebbe E, Cipollini D, Stireman JO. 2014. Exploring plant defense
theory in tall goldenrod, Solidago altissima. New Phytologist 202: 1357-1370.
Hierro JL, Maron JL, Callaway RM. 2005. A biogeographical approach to plant
invasions: the importance of studying exotics in their introduced and native range.
Journal of Ecology 93: 5-15.
Holopainen JK. 2004. Multiple functions of inducible plant volatiles. Trends in Plant
Science 9 (11): 529-533.
Hunter ME, Menges ES. 2002. Allelopathic effects and root distribution of Ceratiola
ericoides (Empetraceae) on seven Rosemary shrub species. American Journal of Botany
89 (7): 1113-1118.
Inderjit, del Moral R. 1997. Is Separating resource competition from allelopathy realistic?
Botanical Review 63 (3): 221-230.
Inderjit, Wardle D, Karban R, Callaway RM. 2011. The ecosystem and evolutionary
contexts of allelopathy. Trends in Ecology & Evolution 26 (12): 655-662.
57
Kegge W, Pierik R. 2009. Biogenic volatile organic compounds and plant competition.
Trends in Plant Science 15 (3): 126-132.
Klebesadel LJ. 1992. Extreme Northern ccclimatization in Biennial Yellow Sweetclover
(Melilotus officinalis) at the Arctic Circle. Bulletin 88.
Van Kleunen M, Fischer M, Schmid B. 2001. Effects of intraspecific competition on size
variation and reproductive allocation in a clonal plant. OIKOS 94 (3): 515-524.
Knauer AC, Schiestl FP. 2017. The effects of pollinators and herbivores on selection for
floral signals: a case study in Brassica rapa. Evol Ecol 31: 285-304.
Kong CH, Zhang SZ, Li YH, Xia ZC, Yang XF, Meiners SJ, Wang P. 2018. Plant
neighbor detection and allelochemical response are driven by root-secreted signaling
chemicals. Nature Communications 9: 1-9.
Lankau R. 2008. A chemical trait creates a genetic trade-off between intra- and
interspecific competitive ability. Ecology 89 (5): 1181-1187.
Lee TD, Bazzaz FA. 1980. Effects of defoliation and competition on growth and
reproduction in the annual plant Abutilon Theophrasti. Journal of Ecology 68 (3): 813-
821.
58
Lucas-Barbosa D. 2016. Integrating studies on plant-pollinator and plant-herbivore
interactions. Trends in Plant Science 21 (2): 125.
Maddox GD, Root RB. 1987. Resistance to 16 diverse species of herbivorous insects
within a population of Goldenrod, Solidago altissima: Genetic variation and heritability.
Oecologia 72 (1): 8-14.
McCune B, Grace JB. 2002. Analysis of ecological communities. MjM Software Design,
Gleneden Beach.
Meiners SJ, Kong CH, Ladwig LM, Pisula NL, Lang KA. 2012. Developing an
ecological context for allelopathy. Plant Ecol 213: 1221-1227.
Meiners SJ, Phipps KK, Pendergast TH, Canam T, Carson WP. 2017. Soil microbial
communities alter leaf chemistry and influence allelopathic potential among coexisting
plant species. Oecologia 183: 1155-1165.
Montesinos-Navarro A, Perez-Clemente RM, Sanchez-Martin R, Gomez-Cadenas A,
Verdu M. 2020. Phylogenetic analysis of secondary metabolites in a plant community
provides evidence for trade-offs between biotic and abiotic stress tolerance. Evolutionary
Ecology 34: 439-451.
59
Neilson EH, Goodger JQD, Woodrow IE, Moller BL. 2013. Plant chemical defense: At
what cost? Trends in Plant Science 18 (5): 250-258.
Novoplansky A. 2009. Picking battles wisely: plant behavior under competition. Plant,
Cell and Environment 32: 726-741.
Pearson DE, Ortega YK, Eren O, Hierro JL. 2018. Community assembly theory as a
framework for biological invasions. Trends in Ecology & Evolution 33 (5): 313-325.
Poorter H, De Jong R. 1999. A comparison of specific leaf area, chemical composition
and leaf construction costs of field plants from 15 habitats differing in productivity. New
Phytol. 143: 163-176.
Ramos SE, Schiestl FP. 2019. Rapid plant evolution driven by the interaction of
pollination and herbivory. Science 364: 193-196.
Rice EL. 1979. Allelopathy: An update. Botanical Review 45 (1): 15-109.
Van Riper LC, Larson DL. 2009. Role of invasive Melilotus officinalis in two native
plant communities. Plant Ecol 200: 129-139.
Root RB. 1996. Herbivore pressure on Goldenrods (Solidago altissima): Its variation and
cumulative effects. Ecology 77 (4): 1074-1087.

60
Sattin M, Zanin G, Berti A. 1992. Case history for weed competition/population ecology:
Velvetleaf (Abutilon theophrasti) in Corn (Zea mays). Weed Technology 6 (1): 213-219.
Siefert A, Violle C, Chalmandrier L, Albert CH, Taudiere A, Fajardo A, Aarssen LW,
Baraloto C, Carlucci MB, Cianciaruso MV, Dantas VL, de Bello F, Duarte LDS, Fonesca
CR, Freschet GT, Gaucherand S, Gross N, Hikosaka K, Jackson B, Jung V, Kamiyama C,
Katabuchi M, Kembel SW, Kichenin E, Kraft NJB, Lagerstrom A, Bagousse-Pinguet YL,
Li Y, Mason N, Messier J, Nakashizuka T, Overton JM, Peltzer DA, Perez-Ramos IM,
Pillar VD, Prentice HC, Richardson S, Sasaki T, Schamp BS, Schob C, Shipley B,
Sundqvist M, Sykes MT, Vandewalle M, Wardle DA. 2015. A global meta-analysis of
the relative extent of intraspecific trait variation in plant communities. Ecology Letters
18: 1406-1419.
Stamp N, 2003. Out of the quagmire of plant defense hypotheses. The Quarterly Review
of Biology 78 (1): 23-55.
Strauss SY, Agrawal AA. 1999. The ecology and evolution of plant tolerance to
herbivory. Tree 14 (5): 179-185.
Szymura M, Szymura TH. 2015. Growth, phenology, and biomass allocation of alien
Solidago species in central Europe. Plant Species Biology 30: 245-256.

61
Tasin M, Backman AC, Coracini M, Casado D, Ioriatti C, Witzgall P. 2007. Synergism
and redundancy in a plant volatile blend attracting grapevine moth females.
Phytochemistry 68: 203-209.
Thompson JD, Amiot J, Borron C, Linhart YB, Keeefover-Ring K, Gauthier P. 2019.
Spatial heterogeneity of gall formation in relation to chemotype distribution in Thymus
vulgaris. Plant Ecol 220: 777-788.
Tilman D. 1989. Competition, nutrient reduction and the competitive neighborhood of a
Bunchgrass. Functional Ecology 3 (2): 215-219.
Tooker JF, Hanks LM. 2006. Tritrophic interactions and reproductive fitness of the
prairie perennial Silphium laciniatum Gillette (Asteraceae). Environmental Entemology
35 (2): 537-545.
Uesugi A, Kessler A. 2013. Herbivore exclusion drives the evolution of plant
competitiveness via increased allelopathy. New Phytologist 198: 916-924.
Uesugi A, Connallon T, Kessler A, Monro K. 2017. Relaxation of herbivore-mediated
selection drives the evolution of genetic covariances between plant competitive and
defensive traits. Evolution 71 (6): 1700-1709.

62
Uesugi A, Johnson R, Kessler A. 2019. Context-dependent induction of allelopathy in
plants under competition. OIKOS 128: 1492-1502.
Van Auken OW, Bush JK. 1988. Competition between Schizachyrium scoparium and
Prosopis glandulosa. American Journal of Botany 75 (6): 782-789.
Van Riper LC, Larson DL. 2009. Role of invasive Melilotus officinalis in two native
plant communities. Plant Ecol 200: 129-139.
Weber E. 2000. Biological flora of Central Europe: Solidago altissima L. Flora 195: 123-
134.
Wetzel WC, Whitehead SR. 2020. The many dimensions of phytochemical diversity:
linking theory to practice. Ecology Letters 23: 16-32.
Williams RS, Avakian MA. 2015. Colonization of Solidago altissima by the specialist
aphid Uroleucon nigrotuberculatum: Effects of genetic identity and leaf chemistry. J
Chem Ecol 41: 129-138.
Wolf JJ, Beatty SW, Carey G. 2003. Invasion by Sweet Clover (Melilotus) in Montane
Grasslands, Rocky Mountain National Park. Annals of the Association of American
Geographers 93 (3): 531-543.
63
Yip EC, Sowers RP, Helms AM, Mescher MC, De Moraes CM, Tooker JF. 2019. Trade-
offs between defenses against herbivores in goldenrod (Solidago altissima). Arthropod-
Plant Interactions 13: 279-287.
Zytynska SE, Guenav Y, Sturm S, Clancy MV, Senft M, Schnitzler JP, Pophaly SD,
Wurmser C, Weisser WW. Effect of plant chemical variation and mutualistic ants on the
local population genetic structure of an aphid herbivore. Journal of Animal Ecology 88
(7): 1089-1099.