effects of chemical composition on solidification, microstructure...
TRANSCRIPT

IJRRAS 5 (2) ● November 2010 Liu & al. ● Effects of Chemical Composition on Alloy Systems
110
EFFECTS OF CHEMICAL COMPOSITION ON SOLIDIFICATION,
MICROSTRUCTURE AND HARDNESS OF Co-Cr-W-Ni and Co-Cr-Mo-Ni
ALLOY SYSTEMS
R. Liu
1,*, S.Q. Xi
1, S. Kapoor
1 & X.J. Wu
2
1 Department of Mechanical and Aerospace Engineering, Carleton University,
1125 Colonel By Drive, Ottawa, Ontario, Canada K1S 5B6 2 Institute for Aerospace Research, National Research Council of Canada, 1200 Montreal Road, Ottawa, Ontario,
Canada K1A 0R6
Email: *[email protected]
ABSTRACT
This article presents a study of solidification behavior and associate microstructure as well as hardness of Co-Cr-W-
Ni and Co-Cr-Mo-Ni alloy systems. The differential scanning calorimetry (DSC) technique is employed to
determine the transformation temperatures of these alloys. The focus is on investigating the effects of each
constituent of the alloys on their solidification behavior and associate microstructures. The hardness values of these
alloys are also determined using a Wilson Series 2000 Rockwell Hardness Tester. It is found that chemical
composition influences the solidification behavior, associate microstructures and hardness of cobalt-based alloys
significantly. Carbon content dominates the solidification behavior of these alloys when the contents of the
solution-strengthening elements Mo and Ni are within their saturation in the solution matrix. However, as the
contents of Mo and Ni reach a certain level, formation of intermetallic compounds changes the solidification
behavior of these alloys remarkably. The presence of boron greatly decreases the solidification temperature. The
volume fraction of carbides, Laves phase and other intermetallic compounds in the microstructure determines the
hardness of the alloys.
Keywords: Cobalt-based alloy, Solidification, Phase transformation temperature, Microstructure, Hardness,
Solidification, phase transformation, cobalt-based alloy, DSC technique, microstructure, solid solution,
eutectic, carbide, Laves phase, hardness
1. INTRODUCTION
Cobalt-based alloys are extensively used as wear/corrosion-resistant materials for industrial applications involving
unlubricated systems or elevated temperatures. They are constituted with multi-elements, mainly chromium (Cr),
molybdenum (Mo), tungsten (W), nickel (Ni), silicon (Si) and carbon (C). Chromium has a dual function in cobalt-
based alloys; it is of vital importance in precipitation strengthening as it is the predominant carbide former, that is,
most of the carbides are chromium-rich, and it is also the most important alloying element in the matrix, where it
provides added strength as a solute and resistance to corrosion and oxidation. Tungsten and molybdenum serve to
provide additional strength to the matrix, owing to the virtue of their large atomic size. When present in large
quantities, they participate in the formation of carbides or intermetallic compounds (Laves phase) during alloy
solidification and promote the precipitation of M6C. They also improve general corrosion resistance of the alloys [1].
Nickel has the similar function to molybdenum and tungsten as a solution strengthening element; but it can also
stabilize the fcc phase, thus suppressing the transformation to hcp phase of cobalt at low temperatures [2]. Carbon
content varies in cobalt-based alloys to a maximum of 3 wt%. The chief difference among individual carbon-
containing wear-resistant alloys is carbon content and, thus, carbide volume fraction in the alloys [1]. Silicon forms
Laves phase with molybdenum in Tribaloy alloys, when added at levels in excess of their solubility limit with the
objective of inducing the precipitation of the hard and corrosion-resistant Laves phase [3-5]. Carbon is held as low as
possible in these alloys to discourage carbide formation. However, for carbide-strengthened alloys, keeping a certain
level of silicon is mostly the need of processing. For example, when cobalt-based alloys are deposited as coatings by
the plasma transferred arc (PTA) welding process, the presence of silicon can intake oxygen to form silicon oxide
covering the PTA layer, thus protecting the layer from oxidation. In some cases, silicon also comes from ore
materials. Other elements may also be added to cobalt-based alloys for special purposes, for example, addition of
boron (B) can decrease the melting point of the alloy, thus reduce the required temperature for the furnace. On the
other hand, owing to the feature of low melting point the presence of boron can enhance the mobility of the alloy
during the hardfacing welding process [6, 7].

IJRRAS 5 (2) ● November 2010 Liu & al. ● Effects of Chemical Composition on Alloy Systems
111
The solidification behavior of cobalt-based alloys is very important for design and manufacturing of these alloys.
The constituent elements and their contents affect the solidification behavior of these alloys, thus their
microstructures, and final material properties. Solidification temperature and solidification range are the basis of
casting and welding process design of an alloy. For example, the pouring temperature in a casting process is
determined based on the solidification temperature and solidification range of the alloy such that the temperature
should insure the alloy in liquid state during the entire molding process. If the temperature is lower, solidification
would occur during the pouring, which results in the failure of the casting process. However, if the alloy liquid is
overheated, the mould will be heated by the high-temperature liquid during the molding, which increases the cooling
time of the cast product, leading to high thermal stresses. In general, it is desired to have a narrow solidification
range for an alloy to be cast and welded. If the range is larger, the primary phase would grow freely in the liquidus
alloy until the solidification process is complete. This would cause some areas of the mould unfilled for a cast
product and also result in an inhomogeneous microstructure.
In this research, the solidification behavior of four Co-Cr-W-Ni alloy systems and four Co-Cr-Mo-Ni alloy systems
were studied utilizing the DSC technique. The effects of the constituent elements and their contents on the phase
transformation temperature, solidification temperature and solidification range were investigated. The associate
microstructures and hardness of the alloys were discussed. These results are useful for material engineers in design
of new cobalt-based alloys and their manufacturing processes.
2. EXPERIMENTAL PROCEDURE
2.1. Samples for DSC test
Four Co-Cr-W-Ni alloy systems and four Co-Cr-Mo-Ni alloy systems, which were designed and developed at
Deloro Stellite Group recently, were studied in this research. These alloys can serve for various purposes, such as
cast products, powder metallurgy parts, PTA hardfacing layers and high velocity oxygen fuel (HVOF) coatings.
Their chemical compositions (wt%) are detailed in tables 1 and 2, respectively. These alloys have a chromium
content between 18 ~ 27%. In the Co-Cr-W-Ni alloy systems, tungsten content is between 8 ~ 15%, and nickel
between 10 ~ 22%; all the alloys contain carbon and silicon except alloy 1A; alloy 3A and alloy 4A also contain an
additional element, boron. In the Co-Cr-Mo-Ni alloy systems, molybdenum content is in a range of 6 ~ 23%, nickel
between 4 ~ 28%; these alloys all contain silicon; alloy 1B and alloy 2B also contain carbon, but with a low content;
alloy 4B contains boron. Each sample of the alloys was provided in powder state by Deloro Stellite Group, and a
small amount of each powder sample weighing around 80 mg was used for the DSC test.
Table 1. Chemical compositions (wt.%) of Co-Cr-W-Ni alloy systems
Cr W Ni Si C B Co
1A 20 15 10 Bal.
2A 25 13 22 1.2 1.8 Bal.
3A 19 8 13 2.6 0.8 1.8 Bal.
4A 19 13 13 2.8 1.5 2.5 Bal.
Table 2. Chemical compositions (wt.%) of Co-Cr-Mo-Ni alloy systems
Cr Mo Ni Si C B Co
1B 27 6 4 0.4 0.25 Bal.
2B 24 12 4 0.2 0.55 Bal.
3B 18 23 16 2.8 Bal.
4B 18 6 28 1.8 3.5 Bal.
Element
Alloy
Alloy
Element
IJRRAS 5 (2) ● November 2010 Liu & al. ● Effects of Chemical Composition on Alloy Systems
112
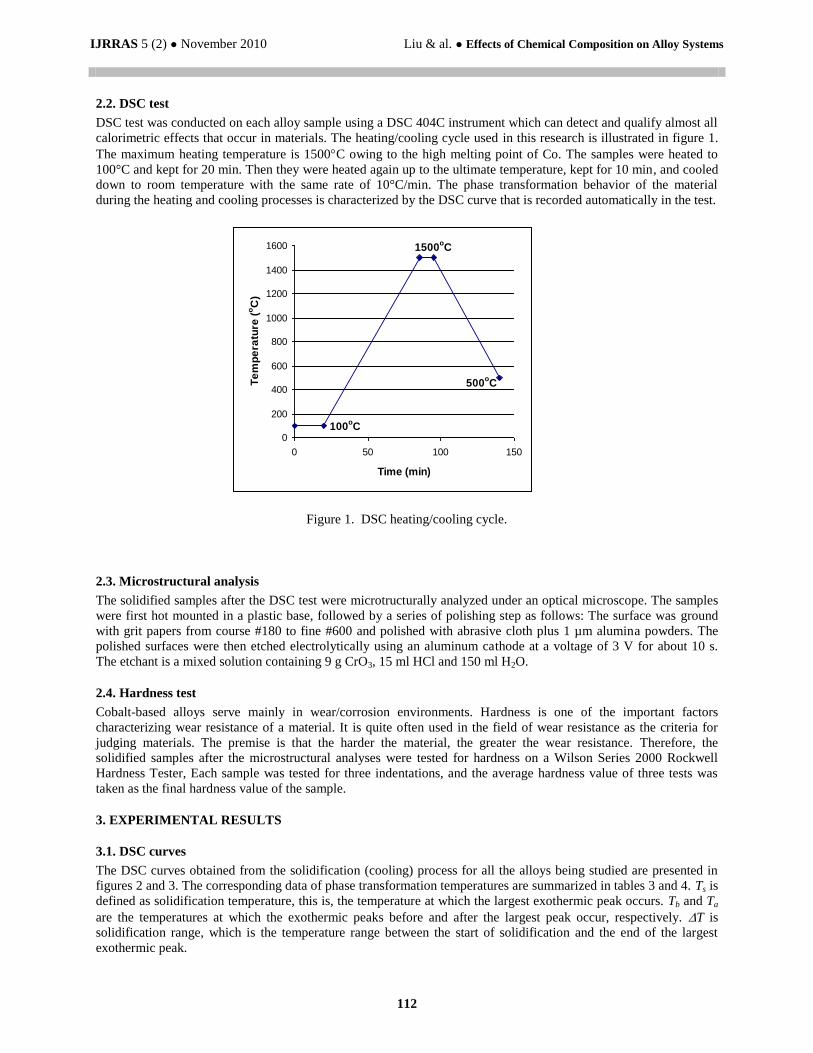
2.2. DSC test
DSC test was conducted on each alloy sample using a DSC 404C instrument which can detect and qualify almost all
calorimetric effects that occur in materials. The heating/cooling cycle used in this research is illustrated in figure 1.
The maximum heating temperature is 1500C owing to the high melting point of Co. The samples were heated to
100°C and kept for 20 min. Then they were heated again up to the ultimate temperature, kept for 10 min, and cooled
down to room temperature with the same rate of 10°C/min. The phase transformation behavior of the material
during the heating and cooling processes is characterized by the DSC curve that is recorded automatically in the test.
0
200
400
600
800
1000
1200
1400
1600
0 50 100 150
Time (min)
Te
mp
era
ture
(oC
)1500
oC
100oC
500oC
Figure 1. DSC heating/cooling cycle.
2.3. Microstructural analysis
The solidified samples after the DSC test were microtructurally analyzed under an optical microscope. The samples
were first hot mounted in a plastic base, followed by a series of polishing step as follows: The surface was ground
with grit papers from course #180 to fine #600 and polished with abrasive cloth plus 1 µm alumina powders. The
polished surfaces were then etched electrolytically using an aluminum cathode at a voltage of 3 V for about 10 s.
The etchant is a mixed solution containing 9 g CrO3, 15 ml HCl and 150 ml H2O.
2.4. Hardness test
Cobalt-based alloys serve mainly in wear/corrosion environments. Hardness is one of the important factors
characterizing wear resistance of a material. It is quite often used in the field of wear resistance as the criteria for
judging materials. The premise is that the harder the material, the greater the wear resistance. Therefore, the
solidified samples after the microstructural analyses were tested for hardness on a Wilson Series 2000 Rockwell
Hardness Tester, Each sample was tested for three indentations, and the average hardness value of three tests was
taken as the final hardness value of the sample.
3. EXPERIMENTAL RESULTS
3.1. DSC curves
The DSC curves obtained from the solidification (cooling) process for all the alloys being studied are presented in
figures 2 and 3. The corresponding data of phase transformation temperatures are summarized in tables 3 and 4. Ts is
defined as solidification temperature, this is, the temperature at which the largest exothermic peak occurs. Tb and Ta
are the temperatures at which the exothermic peaks before and after the largest peak occur, respectively. T is
solidification range, which is the temperature range between the start of solidification and the end of the largest
exothermic peak.

IJRRAS 5 (2) ● November 2010 Liu & al. ● Effects of Chemical Composition on Alloy Systems
113
(a)
(b)
Figure 2. DSC curves of (a) alloy 1A and alloy 2A and (b) alloy 3A and alloy 4A.

IJRRAS 5 (2) ● November 2010 Liu & al. ● Effects of Chemical Composition on Alloy Systems
114
(a)
(b)
Figure 3. DSC curves of (a) alloy 1B and alloy 2B and (b) alloy 3B and alloy 4B.
Table 3. DSC test data of Co-Cr-W-Ni alloy systems
Alloy Ts
(C)
Tb
(C)
Ta
(C) ΔT
(C)
1A 1352 38
2A 1250 1305 114
3A 1080 1160 1050 105
4A 1080 1020, 970 40

IJRRAS 5 (2) ● November 2010 Liu & al. ● Effects of Chemical Composition on Alloy Systems
115
Table 4. DSC test data of Co-Cr-Mo-Ni alloy systems
For the Co-Cr-W-Ni alloy systems, firstly, alloy A1 contains no C and it is a solution-strengthened alloy. As
demonstrated by its DSC curve in figure 2(a), it has the highest solidification temperature and the narrowest
solidification range among the alloys being discussed. It only has single exothermic peak representing the cobalt
solid solution formation. Secondly, compare alloy 2A with alloy 1A. Due to the presence of Si and C, the
solidification temperature of alloy 2A is apparently lower than that of alloy 1A; as seen figure 2(a). Moreover,
additional exothermic peak before the largest exothermic peak appears on the DSC curve of alloy 2A, which
represents the primary solid solution formation. The largest exothermic peak is for the eutectic transformation.
Thirdly, as shown in table 1, alloy 3A and alloy 4A have similar compositions, in addition to Co, Cr, W, Ni, Si and
C, these alloys also contain B. The significant difference in solidification behavior of these alloys from the alloys
discussed previously is that their solidification temperatures are very low, as seen in figure 2(b). These B-containing
alloys also contain a higher level of Si, as shown in table 1. Alloy 3A has exothermic peaks before and after the
largest exothermic peak, which means that there is a primary phase solidified in the liquidus state and also secondary
precipitation occurs in the solidus state in this alloy. Finally, for alloy 4A, since the largest exothermic peak occurs
first, this alloy may be a eutectic alloy; the eutectic product can be a mixture of the Co solid solution, carbides,
silicides and borides [8]. Because of the presence of two exothermic peaks after the largest exothermic peak,
secondary precipitation would occur in this alloy.
Regarding the Co-Cr-Mo-Ni alloy systems, firstly, consider alloy 1B. This alloy contains low C (0.25 wt.%),
therefore it is nearly a solution-strengthened alloy. Accordingly its DSC curve has single exothermic peak which
represents the cobalt solid solution transformation; see figure 3(a). There should be a small amount of carbides
precipitated in the solution matrix with the eutectic reaction [9], however, as the carbide amount is very small, the
exothermic peak is too weak to be visualized on the DSC curve. Secondly, compared with alloy 1B, alloy 2B
contains double C and Mo; see table 2, so that on its DSC curve after the largest exothermic peak (Co solid solution
transformation) there is a small exothermic peak which stands for the eutectic reaction; see figure 3(a). The eutectic
products consist of carbides and intermetallic compounds [9] that are attributed to the higher Mo content. It should
be noticed that in this alloy solid solution still takes most percentage of the volume. As demonstrated by its DSC
curve that the solid solution transformation peak is much larger than the eutectic formation peak; this is due to the
lower C content. However, for carbide-strengthened cobalt-based alloys, when the C content is great than 1 wt.%,
the eutectic reaction predominates the solidification process [10, 11]. Comparing the DSC curves between alloy 1B
and alloy 2B, the former with less amount of C has a higher solidification temperature and narrower solidification
range, as seen in table 4. Thirdly, alloy 3B does not contain C but contain a high level of Si. Due to the co-current
higher Mo and Si, intermetallic compounds, CoMoSi or/and Co3Mo2Si Laves phase, are formed in this alloy. In
other words, this alloy is a Tribaloy alloy; it is hypereutectic with the primary phase being the Laves phase. As
demonstrated on its DSC curve in figure 3(b), there is one peak before the largest exothermic peak, which represents
the primary Laves phase transformations; the largest exothermic peak represents the eutectic reaction which results
in a eutectic product of the Co solid solution and the Laves phase. Finally, compared with alloy 3B, alloy 4B
contains additional element, B, and it contains lower Mo and Si but higher Ni. With these differences, its
solidification behavior deviates significantly from that of alloy 3B, as seen in figure 3(b). The solidification
temperature of alloy 4B decreases significantly due to the presence of B. The largest exothermic peak occurs first,
followed by two small peaks in this alloy. Owing to the low Mo content, the CoMoSi or Co3Mo2Si Laves phase may
not form in this alloy, but the presence of Si may result in intermetallic compounds with the high amount of Ni [12].
This alloy is possibly a eutectic alloy according to its chemical composition and DSC curve; the largest exothermic
peak represents the eutectic reaction and the small peaks represent secondary precipitation of silicides and borides.
The solidification range of alloy 4B is similar to that of alloy 3B; as seen in table 4.
3.2. Microstructures
For the Co-Cr-W-Ni alloy systems, as mentioned above, alloy 1A contains no C so that it is a solution-strengthened
alloy. The DSC test shows that there is only single exothermic peak on the DSC curve of this alloy, which
corresponds to the solid solution transformation. The microstructure in figure 4(a) has confirmed this feature of the
Alloy Ts
(C)
Tb
(C)
Ta
(C) ΔT
(C)
1B 1380 53
2B 1340 1255 58
3B 1260 1305 105
4B 1090 988, 960 80

IJRRAS 5 (2) ● November 2010 Liu & al. ● Effects of Chemical Composition on Alloy Systems
116
alloy; one may see a single-phase structure that is cobalt solid solution. Alloy 2A contains a high level of C (1.8
wt.%) and a moderate level of Si (1.2 wt.%). Corresponding to its DSC curve showing the primary solid solution
forms at a higher temperature followed by the eutectic reaction occurring at a lower temperature, its microstructure
shown in figure 4(b) consists of the primary solid solution, which has a dendritic structure, and the eutectic of solid
solution and carbides (M7C3 and/or M23C6, where M represents the metal component) [1], which is in fishbone shape.
The eutectic may also include silicon compounds due to the moderate Si content. Alloy 3A and alloy 4A contain the
same constituents, especially they all contain B. Moreover, these alloys also contain a higher level of Si, compared
with alloy 2A. The microstructure of alloy 3A in figure 4(c) shows that this alloy is hypereutectic with the primary
phase being silicon compounds in needle shape, which corresponds to its DSC curve. The eutectic product is a
mixture of the solid solution, carbides, borides and silicon compounds as well, as seen in figure 4(c). The primary
silicon-compound phase is attributed to the high level of Si. Secondary precipitation also occurs in this alloy; the
precipitates may mainly be Cr-rich borides because B has a lower eutectic temperature, but secondary precipitation
of carbides is also possible. Shown on the DSC curves in figure 2(b), alloy 4A exhibits different solidification
behavior from alloy 3A. The largest exothermic peak occurs first on the DSC curve of alloy 4A. Incorporating with
its microstructure in figure 4(d), this alloy is a eutectic alloy. The eutectic product has a laminate structure,
consisting of the solid solution and carbon, silicon and boron compounds. There is also secondary precipitation
occurring in this alloy, as seen in the microstructure, which corresponds to the small peaks after the largest
exothermic peak on its DSC curve. Again, the precipitates may mainly be Cr-rich borides due to the lower eutectic
temperature of B.
(a)
Co solid solution Eutectic
Co solid solution

IJRRAS 5 (2) ● November 2010 Liu & al. ● Effects of Chemical Composition on Alloy Systems
117
(b)
(c)
(d)
Figure 4. Microstructures of (a) alloy 1A, (b) alloy 2A, (c) alloy 3A and (d) alloy 4A.
For the Co-Cr-Mo-Ni alloy systems, since alloy 1B contains a low content of carbon, its microstructure consists of
major dendritic Co solid solution and minor carbides in the eutectic mixture; see figure 5(a). The carbides are Cr7C3
and Cr23C6; the Cr7C3 carbides are eutectic with the Co solid solution, while the Cr23C6 carbides are a precipitate in
fishbone shape [9]. With the increase in C and Mo contents, alloy 2B contains more carbides than alloy 1B; it also
contains intermetallic compounds (Co3Mo and Co7Mo6) due to the higher Mo content [9], as seen in figure 5(b) (The
carbides are in black and the intermetallic compounds are in grey). Because of the presence of high contents of Mo
and Si, alloy 3B contains a large volume fraction of Laves phase (CoMoSi or/and Co3Mo2Si). This alloy has a
microstructure consisting of the primary Laves phase in a dendritic structure and the Co solid solution in the eutectic
mixture, as shown in figure 5(c). However, if the Si content is lower, for example, below 2.0 wt.%, hypoeutectic
reaction would take place with the primary phase being Co solid solution and the Laves phase as the eutectic
embedded in the solution matrix [13, 14]. The presence of B in alloy 4B makes this alloy differently from alloy 3B
in the solidification process. It is noticed on its DSC curve that the largest exothermic peak occurs first, consistent to
its microstructure in figure 5(d), this alloy looks like a eutectic alloy. The eutectic product can be a mixture of Si and
Eutectic Precipitates
Eutectic Silicon compounds
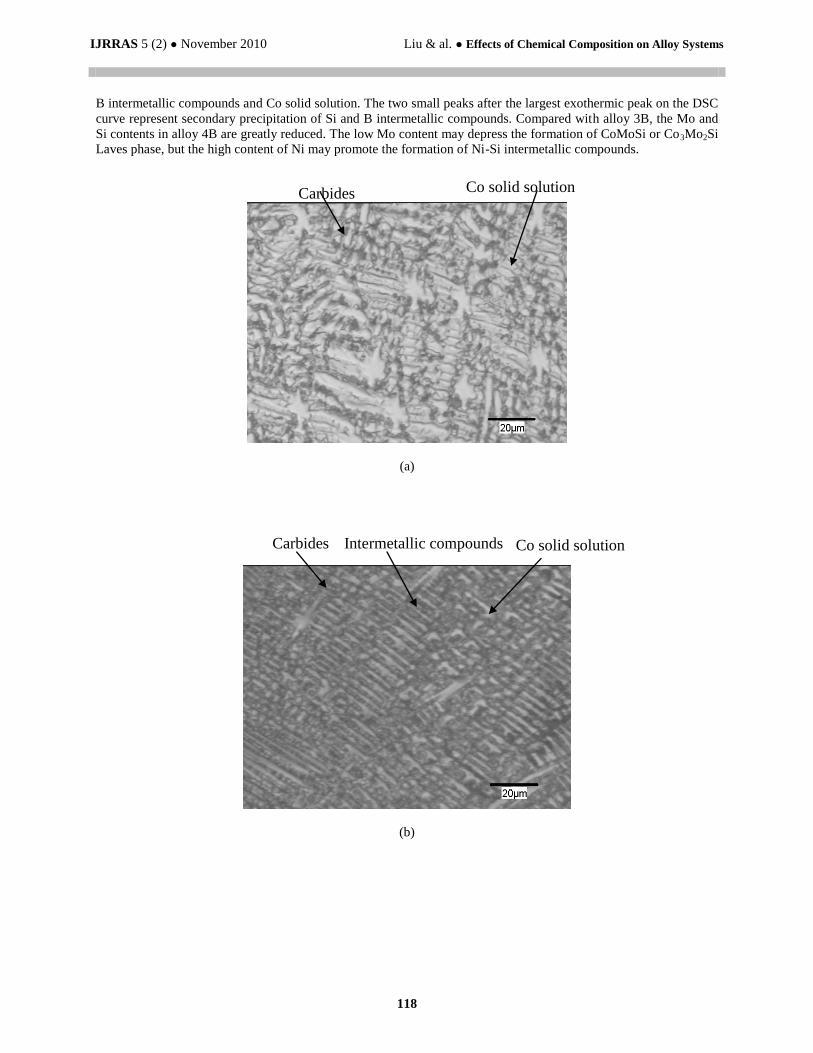
IJRRAS 5 (2) ● November 2010 Liu & al. ● Effects of Chemical Composition on Alloy Systems
118
B intermetallic compounds and Co solid solution. The two small peaks after the largest exothermic peak on the DSC
curve represent secondary precipitation of Si and B intermetallic compounds. Compared with alloy 3B, the Mo and
Si contents in alloy 4B are greatly reduced. The low Mo content may depress the formation of CoMoSi or Co3Mo2Si
Laves phase, but the high content of Ni may promote the formation of Ni-Si intermetallic compounds.
(a)
(b)
Co solid solution Carbides
Carbides Co solid solution Intermetallic compounds

IJRRAS 5 (2) ● November 2010 Liu & al. ● Effects of Chemical Composition on Alloy Systems
119
(c)
(d)
Figure 5. Microstructures of (a) alloy 1B, (b) alloy 2B, (c) alloy 3B and (d) alloy 4B.
3.3. Hardness
The average hardness values of the alloys being studied are illustrated in figure 6. Among the alloys, alloy
3B, which is a Tribaloy alloy, has the highest hardness. This is attributed to the larger volume fraction of Laves
phase (about 35 ~ 40%) [14]. Compared with alloy 3B, the Mo and Si contents in alloy 4B are reduced significantly,
which leads to reduction in the volume fraction of Laves phase, thus resulting in lower hardness. However, the
higher Ni and presence of B may induce formation of Ni-Si intermetallic compounds [12] and borides, which can
enhance hardness.
Laves phase Co solid solution
Co solid solution Silicides Borides

IJRRAS 5 (2) ● November 2010 Liu & al. ● Effects of Chemical Composition on Alloy Systems
120
Figure 6. Hardness values of Co-Cr-W-Ni and Co-Cr-Mo-Ni alloy systems.
Alloy 1A contains none of C and Si so that it has the lowest hardness. Alloy 1B contains C so that it has higher
hardness than alloy 1A. However, since this alloy contains a low level of C (0.25 wt.%) and the carbide volume
fraction is only about 3.25%, the hardness of this alloy is still lower. Alloy 2B contains double Mo and C compared
with alloy 1B; it is found that its hardness is much higher than that of alloy 1B. The tremendous increase in hardness
is attributed to two aspects; one is the increase in C content that results in increase of the carbides volume fraction;
the other is the considerable increase in Mo content that leads to formation of hard intermetallic compounds (Co3Mo
and Co7Mo6) [9].
Alloy 2A contains a high level of C and the volume fraction of carbides in this alloy is about 23% [1], therefore this
alloy exhibits higher hardness, as seen in figure 6, but it is softer than the Tribaloy alloy, alloy 3B. This may be
because the volume fraction of Laves phase in alloy 3B is much larger than the volume fraction of carbides in alloy
2A, although generally carbides are harder than Laves phase [1]. Alloy 3A and alloy 4A, containing lower C
compared with alloy 2A, exhibit lower hardness than alloy 2A. This is mainly due to the reduction in the volume
fraction of carbides. Between alloy 3A and alloy 4A, the latter contains nearly double C of the former so that the
latter is much harder than the former. It should also be noticed that Si content in alloy 3A and alloy 4A is doubled
compared with alloy 2A, and these two alloys contain additional element, B. Formation of silicides and borides,
especially borides, may contribute to hardness, because borides are hard. However, from the hardness results it can
be concluded that C content predominates the hardness of carbide-strengthened alloys.
4. DISCUSSION
The DSC results, microstructural analyses and hardness tests show that chemical composition affects significantly
the solidification behavior, and associate microstructure and hardness, of cobalt-based alloys. However, since these
alloys are multi-element alloy systems, theoretical understanding of these issues has substantial difficulty due to the
metallurgical complexity, although the effects of individual elements in these alloys have theoretical inhesion. The
experimental studies in and results from this research may help understand these issues instead.
4.1. Effects of carbon
Carbon in wear-resistant cobalt-based alloys plays an indispensable role. The chief difference among these alloys is
carbon content and, thus, carbide volume fraction in the material. For example, at a carbon level of 2.4 wt% (Stellite
3), the carbides constitute about 30 wt% of the material. These are of the M7C3 (chromium-rich primary) and M6C
(tungsten-rich eutectic) types, where M represents the metal component, for example, M7C3 corresponds to Cr7C3.
At a level of 1 wt% carbon (Stellite 6B), the carbides constitute approximately 13 wt% of the material, these being
predominantly chromium-rich eutectic carbides of the M7C3 type [1]. From the DSC tests, it is clear that carbon
influences significantly the solidification behavior of cobalt-based alloys. As reported above, alloy 1A contains no C
so that it is a solution-strengthened alloy. The DSC test shows that there is only single exothermic peak on its DSC
curve, which corresponds to the solid solution transformation. This alloy has the highest solidification temperature
and narrowest solidification range among the alloys being studied. In terms of the binary diagrams of Co-Cr, Co-W
and Co-Mo [15, 16], it could be expected that the solidification temperature of Co-Cr-W alloys and Co-Cr-Mo
alloys with the single transformation of liquid to solid phase is high and the solidification range is narrow. When
these alloys are cast, they would have good fluidity and properties for filling fully into the cast mould. Due to lack of
C, thus carbides, this type of alloys are relatively soft and ductile so that they are commonly used for high
temperature, high stress or strength applications.
IJRRAS 5 (2) ● November 2010 Liu & al. ● Effects of Chemical Composition on Alloy Systems
121
The presence of C decreases the solidification temperature and increases the solidification range, as demonstrated by
alloy 2A. This is easy to understand according to the Co–C binary phase diagram [17]. This alloy is hypoeutectic
with the primary phase being cobalt solid solution that has a dendritic structure and the eutectic being a mixture of
solid solution and Cr-rich carbides, as seen in figure 4(b). In accordance to its DSC curve in figure 2(a), the peak
occurring before the largest exothermic peak represents the transformation of the solid solution phase and the largest
exothermic peak represents the eutectic reaction. Owing to the high level of C, thus the large amount of carbides,
alloy 2A exhibits high hardness. Comparing the hardness value of alloy 2A containing 1.8 wt.% of C with that of
alloy 1B containing 0.25 wt.% of C, the hardness can be increased by 80% when the carbon content is increased by
7.2 times.
4.2. Effects of molybdenum
Molybdenum also influences the solidification behavior of cobalt-based alloys. It has a dual function in these alloys;
it mainly remains in the solid solution to strengthen the matrix when its content is low (approximately below 8 wt.%)
in these alloys; but it would form intermetallic compounds with other elements when its content is high (usually
above 12 wt.% up to 28 wt.%). As demonstrated by alloy 1B and alloy 2B, the former contains lower Mo (6 wt.%)
so that the Mo in this alloy pays the role in strengthening the solution matrix. However, as its content is increased to
12 wt.%, in alloy 2B, it is found that intermetallic compounds (Co3Mo and Co7Mo6) are formed [9]. Comparing the
DSC curves between these two alloys, it is observed that increase in the Mo content decreases the transformation
temperature of the solid solution but increases the solidification range, which agrees with the Co-Mo binary diagram
[15, 16]. The feature of precipitation of intermetallic compounds, Co3Mo and Co7Mo6, is demonstrated by the small
peak after the largest exothermic peak (solid solution transformation) on the DSC curve of alloy 2B. These hard
intermetallic compounds greatly enhance the hardness of the alloy, but they are brittle [9].
Compared with alloy 2B, Mo content is increased almost double in alloy 3B. Due to simultaneous increase in Si
content, the solidification behavior of alloy 3B differs significantly from that of alloy 2B. The high Mo and Si
contents promote formation of intermetallic CoMoSi or Co3Mo2Si Laves phase in alloy 3B. It can be seen in table 4
that solidification temperature is further decreased and solidification range is further increased with the increase in
Mo content, in comparison between alloy 1B – alloy 3B. Because of the large volume fraction of Laves phase
present, alloy 3B exhibits very high hardness, as seen in figure 6. Similar to most intermetallic compounds, Laves
phase is also brittle but harder than the solution matrix.
4.3. Effects of boron
The most special feature of B is its low eutectic temperature. As noticed from the DSC tests that addition of B
reduces remarkably the solidification temperature of cobalt-based alloys. Boron with chromium forms Cr-rich
borides, which are hard, so that it can enhance the hardness of the alloys. Among the alloys being studied alloy 3A,
alloy 4A and alloy 4B contain different amounts of B. As seen in figures 2(b) and 3(b), the solidification
temperatures of these alloys are much lower than those of the others. However, it is hard to know from this research
if higher B content would lead to lower solidification temperature, in other words, if the higher B content in an alloy,
the lower the solidification temperature of the alloy is. Among the three alloys containing B, alloy 4B has the
highest B content, but its solidification temperature is higher than those of the others. Alloy 3A and alloy 4A have
different levels of B, but they have the same solidification temperature. This is because the chemical compositions
of these alloys are quite different except that they all contain B. For example, alloy 4B does not contain C but
contains higher Ni, while alloy 3A and alloy 4A contain different amounts of C and Si. These differences result in
formation of different phases among these alloys, which complicates the quantitative valuation of the B effect on the
solidification temperature of these alloys.
4.4. Effects of other alloying elements
Finally, consider other alloying elements in these studied alloys. Chromium has a dual function in carbide-
strengthened cobalt-based alloys; it is the predominant carbide former, and it also strengthens the solution matrix as
a solute. As solution-strengthening elements, Cr, W, Mo and Ni play the same role, but Cr mainly provides
resistance to corrosion and oxidation; W and Mo provide resistance to wear; and Ni stabilizes the fcc phase. Since
the solidification behavior of cobalt-based alloys is determined predominantly by carbon, boron and their contents,
as discussed above, solution-strengthening elements have little effect in regard of this issue as long as their contents
are within their saturation in the solution matrix. For example, the main difference between alloy 1A and alloy 2A is
that the latter contains C while the former does not. Formation of carbides results in noticeable deviation of the
solidification behavior of alloy 2A from that of alloy 1A, thus even there is difference in the contents of the solution-
strengthening elements between these two alloys, the effect of this difference on the solidification behavior change
is negligible. However, if W content is excessively high, some of them may precipitate from the solution to form
tungsten carbides, which will influence the solidification behavior. Similarly, when Mo is less, as in alloy 1B and
alloy 4B, it remains in the solution matrix as a solute, but when its content reaches a certain level, as in alloy 2B and

IJRRAS 5 (2) ● November 2010 Liu & al. ● Effects of Chemical Composition on Alloy Systems
122
alloy 3B, it precipitates from the matrix to form intermetallic compounds, which changes the solidification behavior
of the alloy significantly. Similarly for Ni, as its content is excessively high, as in alloy 4B, it precipitates from the
matrix to form Ni-Si intermetallic compounds [12], which changes the solidification behavior of the alloy.
5. CONCLUSIONS
Cobalt-based alloys are multi-element alloy systems. Chemical composition influences the solidification behavior of
these alloys significantly. However, the effects of the constituents on the solidification behavior of these alloys are
very complex due to the multi-element constitution and the metallurgical complexity. The DSC technique provides
an effective approach in regard of this issue. The microstructural analyses and hardness tests of the solidified DSC
samples have confirmed and explained the DSC results, helping understand these effects.
It is found that the presence and contents of carbon and boron dominate the solidification behavior of cobalt-based
alloys and the effects of solution-strengthening elements are nearly negligible when the contents of the
solution-strengthening elements, W, Mo and Ni are within their saturation in the solution matrix.
Solution-strengthened alloy, which contains no carbon, has a higher solidification temperature and a narrower
solidification range, compared with carbide-strengthened alloys. Addition of carbon decreases the solidification
temperature and increases the solidification range. Addition of boron greatly lowers the solidification temperature.
When molybdenum content excesses a certain level (about 12 wt.%), it forms intermetallic compounds with Co and
Si when Si content is high, or with Co only when Si content is low, which changes the solidification behavior
significantly. Similar to molybdenum, as nickel content reaches a certain level (about 28 wt.%), it forms Ni-Si
intermetallic compounds when Si content is also high.
Solution-strengthened alloy has the lowest hardness. The hardness of carbide- strengthened alloy is determined by
the carbon content in the alloy. The higher the carbon content, the harder the alloy is. The Tribaloy alloy is the
hardest among the alloys studied in this research, which is attributed to the large volume fraction of hard Laves
phase. The presence of silicides and borides contributes to the hardness of the alloy, especially borides, which is
hard.
6. ACKNOWLEDGEMENTS
The authors are grateful for financial support from the Natural Science & Engineering Research Council of Canada
(NSERC), and both financial and in-kind support from Deloro Stellite Group.
7. REFERENCES
[1]. J.R. Davis, “Nickel, Cobalt, and Their Alloys”. Materials Park, USA (2000).
[2]. K. Ando, T. Omori, J. Sato, Y. Sutou, K. Oikawa, R. Kainuma, K. Ishida, Effect of alloying elements on fcc/hcp
martensitic transformation and shape memory properties in Co-Al alloys, Mater. Trans. 47(9), 2381-2386 (2006).
[3]. C.B. Cameron, D.P. Ferriss, Tribaloy intermetallic materials: New wear- and corrosion-resistant alloys, Anti-Corrosion
Method. Mater. 22(4), 5-8 (1975).
[4]. S.E. Mason, R.D. Rawlings, Fracture behavior of two Co-Mo-Cr-Si wear resistant alloys, J. Mater. Sci. 20(4), 1248-1256
(1985).
[5]. D. Raghu, J.B. Wu, Recent development in wear and corrosion-resistant alloys, Mater. Perform. 36(11), 27-36 (1997).
[6]. I. Campos, G. Ramirez, U. Figueroa, J. Martinez, O. Morales, Evaluation of boron mobility on the phases FeB, Fe2B and
diffusion zone in AISI 1045 and M2 steels, Appl. Surf. Sci. 253(7), 3469-3475 (2007).
[7]. I. Campos, G. Ramirez, U. Figueroa, C. Velazquez, Paste bonding process: Evaluation of boron mobility on borided
steels, Surf. Eng. 23(3), 216-222 (2007).
[8]. J.H. Schneibel, R.O. Ritchie, J.J. Kruzic, P.F. Tortorelli, Optimization of Mo-Si-B intermetallic alloys, Metall. Mater.
Trans. A 36, 525-531 (2005).
[9]. P. Huang, R. Liu, X.J. Wu, M.X. Yao, Effects of molybdenum content and heat treatment on mechanical and tribological
properties of a low-carbon Stellite alloy, J. Eng. Mater. Technol. 129(4), 523-529 (2007).
[10]. Y.N. Liu, H. Yang, G. Tan, S. Miyazaki, B.H. Jiang, Y. Liu, Stress-induced FCC ↔ HCP martensitic transformation in
CoNi, J. Alloys Compounds 368(14), 157-163 (2004).
[11]. A. Frenk, W. Kurz, Microstructural effects on the sliding wear resistance of a cobalt-based alloy, Wear 174, 81-91 (1994).
[12]. I.S. Maroef, M.D. Rowe, G.R. Edwards, “The Effect of Silicon and Iron on Weldability of Ni-Co-Cr-Si HR-160 Alloy”,
in Hot Crack Phenomena in Welds. Springer Berlin Heidelberg, New York (2005).
[13]. R. Liu, W. Xu, M.X. Yao, P.C. Patnaik, X.J. Wu, A newly developed Tribaloy alloy with increased ductility, Scripta
Materialia 53(12), 1351-1355 (2005).
[14]. W. Xu, R. Liu, P.C. Patnaik, M.X. Yao, X.J. Wu, Mechanical and tribological properties of newly developed Tribaloy
alloys, Mater. Sci. Eng. A 452-453, 427-436 (2007).
[15]. H. Baker, “Introduction to Phase Diagrams, Alloy Phase Diagrams” in ASM Handbook, Vol. 3. ASM International, USA
(1992).
[16]. J.R. Davis, “Metals Handbook”. ASM International, USA (1998).
[17]. W. Betteridge, “Cobalt and Its Alloys”. Halsted Press, UK (1982).