effects of anion size and concentration on electrolyte ...mmrl.ucsd.edu/pdf/njp_anionsize.pdf ·...
TRANSCRIPT

Effects of anion size and concentration on electrolyte invasion into molecular-sized nanopores
This article has been downloaded from IOPscience. Please scroll down to see the full text article.
2010 New J. Phys. 12 033021
(http://iopscience.iop.org/1367-2630/12/3/033021)
Download details:
IP Address: 132.239.93.179
The article was downloaded on 12/11/2010 at 17:18
Please note that terms and conditions apply.
View the table of contents for this issue, or go to the journal homepage for more
Home Search Collections Journals About Contact us My IOPscience

T h e o p e n – a c c e s s j o u r n a l f o r p h y s i c s
New Journal of Physics
Effects of anion size and concentration on electrolyteinvasion into molecular-sized nanopores
Ling Liu1, Xi Chen1,2,5, Taewan Kim3, Aijie Han3 and Yu Qiao3,4,5
1 Department of Earth and Environmental Engineering, Columbia University,New York, NY 10027, USA2 Department of Civil and Environmental Engineering, Hanyang University,Seoul 133-791, Korea3 Department of Structural Engineering, University ofCalifornia—San Diego, La Jolla, CA 92093-0085, USA4 Program of Materials Science and Technology, University of California—SanDiego, La Jolla, CA 92093-0085, USAE-mail: [email protected] and [email protected]
New Journal of Physics 12 (2010) 033021 (10pp)Received 1 October 2009Published 12 March 2010Online at http://www.njp.org/doi:10.1088/1367-2630/12/3/033021
Abstract. When an electrolyte solution is pressurized into a molecular-sizednanopore, oppositely charged ions are strongly inclined to aggregate, whicheffectively reduces the ion solubility to zero. Inside the restrictive confinement,a unique quasi-periodic structure is formed where the paired ion couples areperiodically separated by a number of water molecules. As the anion size or ionconcentration varies, the geometrical characteristics of the confined ion structurewould change considerably, leading to a significant variation in the transportpressure. Both experimental and simulation results indicate that, contradictoryto the prediction of conventional theory, infiltration pressure decreases as theanions become larger.
5 Authors to whom any correspondence should be addressed.
New Journal of Physics 12 (2010) 0330211367-2630/10/033021+10$30.00 © IOP Publishing Ltd and Deutsche Physikalische Gesellschaft
2
Contents
1. Introduction 22. Computational model and method 33. Results and discussion 4
3.1. Ion couple and quasi-periodic electrolyte structure inside themolecular-sized nanotube . . . . . . . . . . . . . . . . . . . . . . . . . . . . . 4
3.2. Theoretical verification of ion couple structure formation . . . . . . . . . . . . 43.3. Ion size/concentration-dependent parameters: a and b . . . . . . . . . . . . . . 63.4. Influence of ion couple structure on infiltration pressure . . . . . . . . . . . . . 7
4. Experimental validation 85. Conclusion 9Acknowledgments 9References 9
1. Introduction
The behavior of electrolytes in confined nanoenvironments, e.g. biological cavities [1] andvarious nanotubes/nanopores [2, 3], has drawn considerable attention owing to their keyroles in biological transport [3, 4], water purification [5], energy dissipation, conversion andstorage [6, 7], and many other promising applications of nanofluidics [8]–[10].
From the bulk to the confined state, both water molecules and ions experience substantialchanges in their molecular configurations and properties. For water, the local density is nolonger evenly distributed [11], the hydrogen bonding is typically weakened [12], and thedipole orientation usually becomes more ordered [13]; for ions, the hydration shell could beconsiderably distorted [14]. As a consequence, some unique molecular configurations havebeen discovered, such as the n-gonal ring [15] and the double helical chain [16] structures. Theresulting intrinsic nanofluid properties, such as infiltration and transport behavior, are stronglydependent on the characteristic length scale [17]–[19].
In a macroscopic channel, the required pressure associated with the intrusion of anonwettable liquid column is governed by the classic Laplace–Young equation. For electrolytesof different ion sizes but similar surface tensions, their infiltration pressures should be nearlythe same. That is, as the anions exist only beyond the outer Helmholtz plane (OHP) at a largesolid surface, their sizes have only negligible effects on the solid–liquid interfacial tension [20].For the infiltration of charged particles into nanometer-scale channels, the required pressuremay increase as the ion size becomes larger [20, 21], since a ‘free volume’ must be maintainedbetween the confined ion and the solid surface.
When the pore size is further reduced to the molecular scale, it is envisioned that newand counterintuitive phenomena may arise. Within the restrictive confinement (smaller than1 nm), the hydration shell surrounding the ions [22] can no longer exist and the ions and watermolecules must look for a new equilibrium configuration [2]. The infiltrated water moleculesand ions may form a quasi-one-dimensional structure that is unique to the molecular-sizednanopores; depending on the type/size and concentration of the ions, the structural features
New Journal of Physics 12 (2010) 033021 (http://www.njp.org/)
3
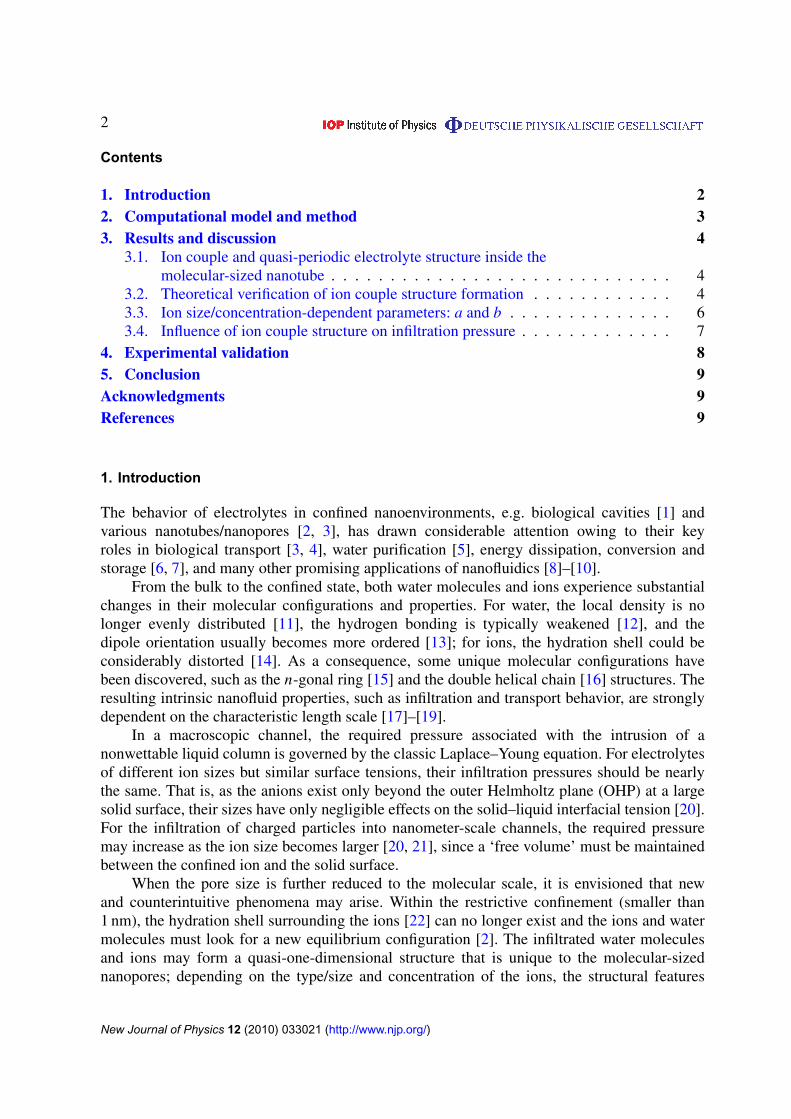
Figure 1. MD simulation of electrolyte infiltration into a molecular-sized silicondioxide nanotube: (a) the computational model, where the most notable resultis the ion couples formed right after the cation and anion enter the nanopore;(b) confined molecular structures of three electrolytes showing the size-dependent separations between neighboring ion couples and two paired ions.
of the confined molecules/ions may be different, which, during a pressure-induced infiltrationprocess, could lead to different pressure gradients and a new trend of ion-dependent infiltrationbehavior.
2. Computational model and method
To explore the underlying molecular mechanisms, we investigate the infiltration process of threeelectrolytes, which are of the same cation but different anions, into molecular-sized nanoporesusing molecular dynamics (MD) simulations. A long, straight and rigid silicon dioxide nanotubewith a diameter of 7.4 Å is adopted as a model structure of the molecular-sized nanopore(figure 1(a)). The partial charges are incorporated, and the dielectric permeability is fixed as 1.One of the ends of the nanotube is immersed in an electrolyte reservoir bounded by two rigidplanes in the axial direction, and the periodic boundary condition is imposed in the four lateraldirections of the computational cell. Initially, a specific amount of the electrolyte is contained inthe reservoir so that the pressure inside is close to the ambient condition (zero) after equilibrium.Subsequently, by moving the bottom rigid plane (piston) upwards (in a quasi-static manner,while holding the other rigid plane fixed), the pressure inside the reservoir is increased and theinfiltration of water molecules and ions starts. Three types of salts (NaF, NaCl and NaBr) at tworepresentative concentrations (mole fraction, X = 0.06 and 0.08) are examined. Simulations areperformed with the COMPASS forcefield [23] and the NVT ensemble. Long-range electrostaticinteraction is estimated by the Ewald summation technique.
New Journal of Physics 12 (2010) 033021 (http://www.njp.org/)
4
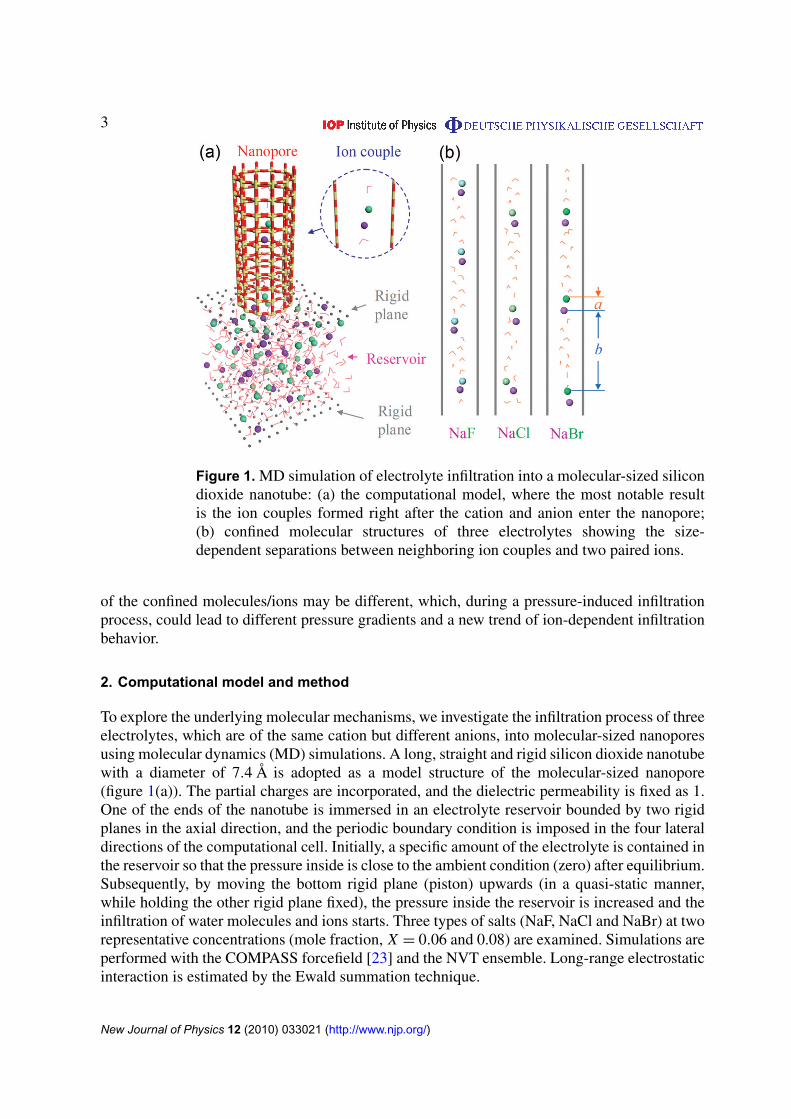
Figure 2. The infiltration sequence of ions identified in simulation is verifiedthrough energy analyses in (a) a schematic of three successive key stages. Inevery stage, (b) energy variations are associated with the motion of a cation oran anion, through which the energetically favorable option is identified.
3. Results and discussion
3.1. Ion couple and quasi-periodic electrolyte structure inside the molecular-sized nanotube
Figure 1(b) shows the ‘steady-state’ molecular structures of the three electrolytes (X = 0.08)when they infiltrate into the molecular-sized nanopore, where the confined liquid phase isentirely different from its continuum counterpart. These snapshots are obtained from MDsimulations. Interestingly, the infiltrated ions tend to form cation–anion couples in an orderedsequence; the spacing is different for different salts, and water molecules are sandwichedbetween ion couples. This unique structure raises several fundamental questions: Why and howdo the infiltrated ions form an ordered sequence? Are these nanocrystalline-like ion couplesstable? Why does the spacing between adjacent ion couples depend on ion size? What is theimplication for the required work of electrolyte infiltration?
3.2. Theoretical verification of ion couple structure formation
In order to theoretically verify the infiltration sequence discovered in simulation as well as thebasis for the formation of nanocrystalline-like ion couples, a separate energy analysis is carriedout. Starting from an empty nanotube, we compare the energy variations associated with theentry of a cation and an anion in three successive stages (figure 2(a)). Sodium bromide is takenas an illustrative example and all findings hold for the other two electrolytes. Stage 1 refersto the infiltration of the first ion, where ‘1C’ illustrates the possibility that a cation would firstinfiltrate the nanopore, and ‘1A’ corresponds to the alternative case of anion infiltration. In either
New Journal of Physics 12 (2010) 033021 (http://www.njp.org/)
5
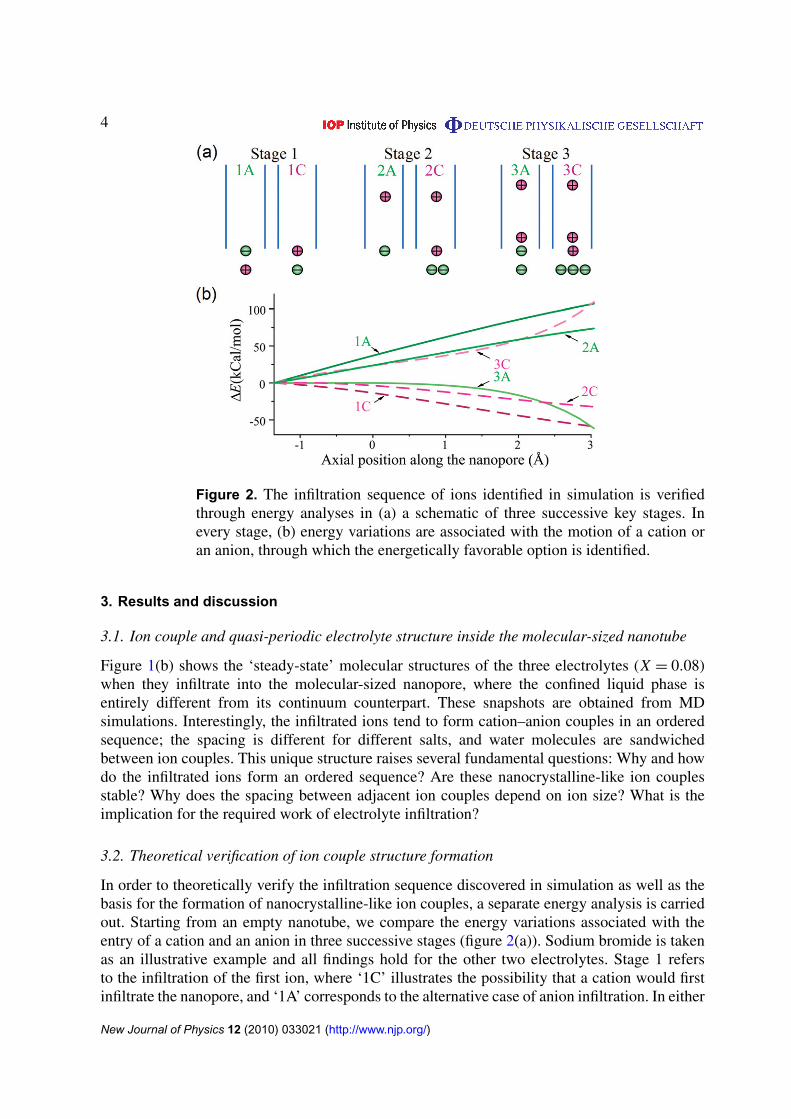
Figure 3. The formation and stability of the ion couple structure are examinedby comparing the energetics of three possible ionic configurations inside thenanopore: (a) a nanocrystalline-like structure that mimics the structure observedin MD simulation (figure 1), where a and b are averaged from MD snapshotsas approximately 2.5 and 21.5 Å, respectively; (b) a scattered structure thatassumes that no ion couple is formed and all ions are alternately and uniformlydistributed with a uniform spacing of 12 Å; (c) an aggregated structure thatassumes that ion couples further aggregate to form a continuous ion strand witha uniform spacing of 2.5 Å. (d) As a cation and an anion approach each other toform a couple, water molecules, if any in between, have to switch positions witha neighboring ion.
case, a counter charge is placed outside the tube so as to neutralize the system. The examinedion is then perturbed by several angstroms along the axial direction, causing a variation of thesystem potential energy, as plotted in figure 2(b). By comparing the energy variations of bothpossibilities, it is made clear that a cation should first infiltrate as it is able to decrease the systemenergy. In the subsequent stage 2 where a cation has already infiltrated, configuration ‘2C’ isfound to be more energetically favorable than ‘2A’ and thus another cation should enter thenanopore. Following the two previously infiltrated cations, the third infiltrated ion is found tobe a Br− anion6.
Driven by an energetic preference, the Na+ cation infiltrated in stage 2 and the Br− anioninfiltrated in stage 3 should approach each other inside the nanopore. For verification, weconsider two possible configurations of the confined Na+ and Br− ions: a nanocrystalline-like structure that mimics the structure observed in simulation (figure 3(a)), and a uniformlyscattered ion structure (figure 3(b)). The energy is calculated as −710 and −216 kcal mol−1,respectively, for these two configurations. That is, the formation of an ion couple could favorablyreduce the system potential by ∼90 kcal mol−1. Meanwhile, there is an energy barrier that needsto be overcome: for a cation and an anion to approach each other, any water molecule initiallybetween them must escape (figure 3(d)); when a water molecule and an ion are about to switchtheir positions, a moderate energy barrier may arise given the limited space inside the nanopore.Such an energy barrier is computed as ∼5 kcal mol−1 for bypassing Na+ and ∼ 94 kcal mol−1 for
6 Water molecules may infiltrate the nanopore before/after the infiltrated ions.
New Journal of Physics 12 (2010) 033021 (http://www.njp.org/)
6
bypassing Br−. Therefore, the formation of ion couples is energetically favored via consecutiveswitching of positions between H2O molecules and Na+.
After the infiltration of the first three ions, there is only one net positive charge inside thechannel and one counter-charge outside, which leads to a situation similar to the end of stage 1(‘1C’ in figure 2(a)). Thus, the subsequent infiltration of ions would repeat stages 2 and 3;more and more cations and anions would be driven into the nanopore and then paired inside toform ion couples (consistent with the MD simulation in figure 1(b)). If the nanocrystalline-likestructure (figure 3(a)) is stable, the ion couples should not further aggregate to form a continuousion strand (figure 3(c)). Although the energy analysis shows that the aggregated structure hasa lower energy (∼−880 kcal mol−1) than the nanocrystalline-like structure, it is important tonote that, for the aggregated structure to form, the bounded water molecules must be able toswitch their positions with Br−, which requires a prominent energy barrier (∼94 kcal mol−1 perswitch). Thus, from the energy point of view, aggregation of ion couples is unlikely to occur,and the ion couple structure is quite stable. Although such an ion couple structure is discoveredin a SiO2 nanotube, when the nanopore is neutral (e.g. a carbon nanotube, CNT), we envisionthat a similar periodic structure of ion couples would still form, although the overall infiltratedstructure should become neutral.
3.3. Ion size/concentration-dependent parameters: a and b
With the energetically driven formation of ion couples, eventually a quasi-periodic chain ofion couples (led by a cation) forms inside the nanopore, which holds for all electrolytes underinvestigation. Denote the separation between the cation and the anion in an ion couple as a,and the averaged spacing between ion couples as b (figure 1(b)). From MD simulations (andtaking average values), a is measured as 2.13, 2.55 and 2.64 Å, respectively, for the NaF, NaCland NaBr solutions (and it is insensitive to the ion concentration, X ); the corresponding valuesof b are 14.75, 19.16 and 21.58 Å, respectively, for X = 0.08, and 26.75, 36.29 and 40.00 Å,respectively, for X = 0.06.
The ionic bonding is the dominant factor that influences the distance between ions in acouple. The ionic bond lengths7 are calculated as 2.02, 2.39 and 2.52 Å, respectively, for F−,Cl− and Br−, which are quite close to the values of a reported above. The small difference isattributable to the environmental factors (nanopore, water molecules, other ions, etc).
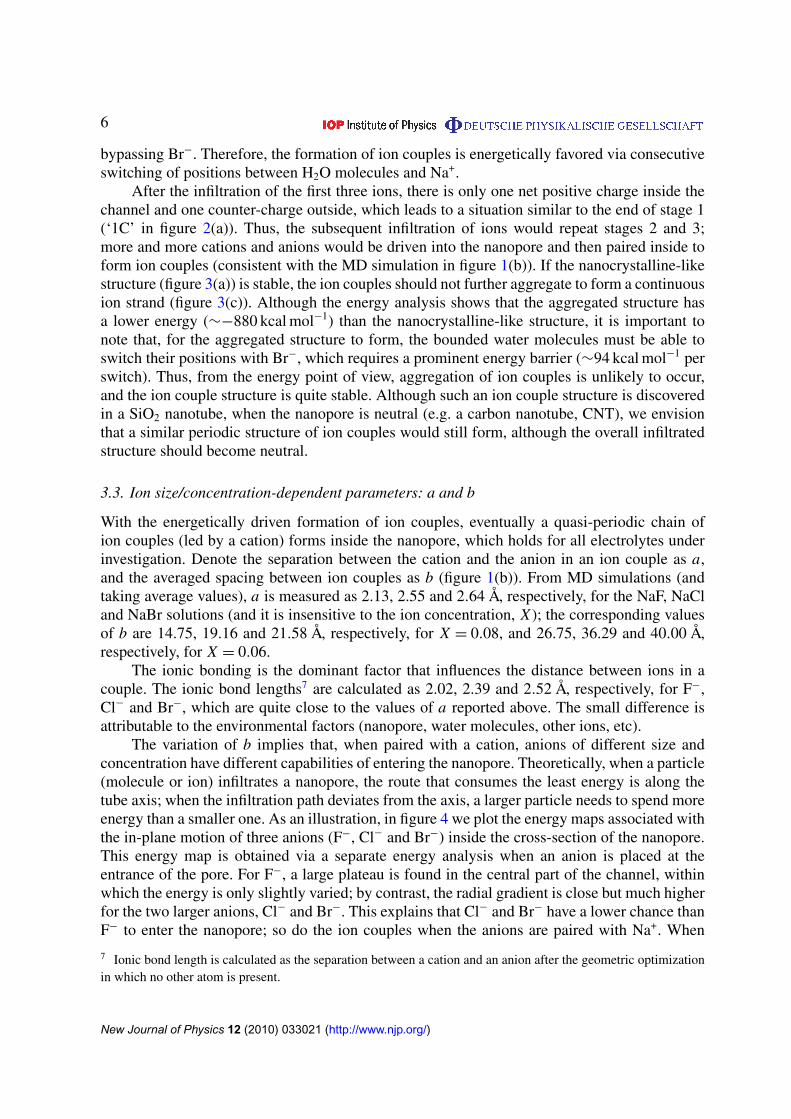
The variation of b implies that, when paired with a cation, anions of different size andconcentration have different capabilities of entering the nanopore. Theoretically, when a particle(molecule or ion) infiltrates a nanopore, the route that consumes the least energy is along thetube axis; when the infiltration path deviates from the axis, a larger particle needs to spend moreenergy than a smaller one. As an illustration, in figure 4 we plot the energy maps associated withthe in-plane motion of three anions (F−, Cl− and Br−) inside the cross-section of the nanopore.This energy map is obtained via a separate energy analysis when an anion is placed at theentrance of the pore. For F−, a large plateau is found in the central part of the channel, withinwhich the energy is only slightly varied; by contrast, the radial gradient is close but much higherfor the two larger anions, Cl− and Br−. This explains that Cl− and Br− have a lower chance thanF− to enter the nanopore; so do the ion couples when the anions are paired with Na+. When
7 Ionic bond length is calculated as the separation between a cation and an anion after the geometric optimizationin which no other atom is present.
New Journal of Physics 12 (2010) 033021 (http://www.njp.org/)
7
Figure 4. Energy contours of three individual cations moving within the cross-section of the nanopore under investigation. The energy value at the center isadopted as the ground state, and the diameter of the black circle equals 4.5 Å.
Axial position along the nanopore (Å)
∆E
(kC
alm
ol–1
)
0 100 200 300 400 5000.0
0.1
0.2
0.3
0.4
0.5
0.6Na+ -Br–
Na+ -Cl–
Na+ -F–
b
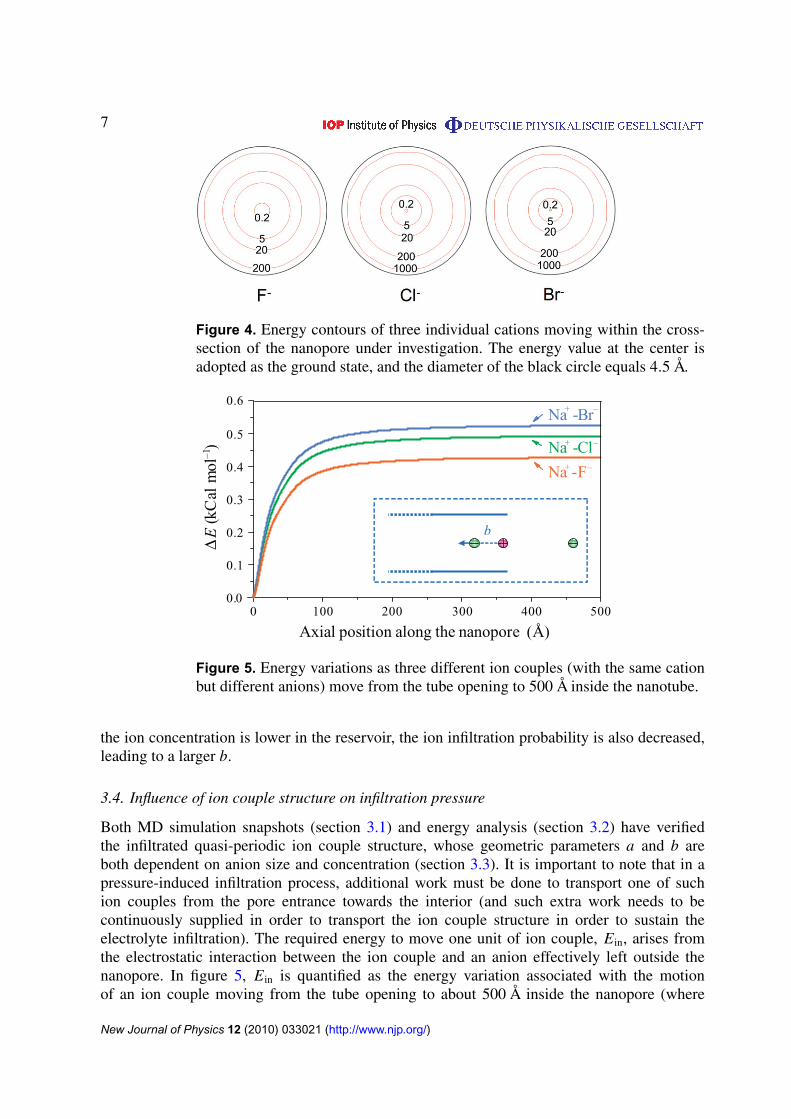
Figure 5. Energy variations as three different ion couples (with the same cationbut different anions) move from the tube opening to 500 Å inside the nanotube.
the ion concentration is lower in the reservoir, the ion infiltration probability is also decreased,leading to a larger b.
3.4. Influence of ion couple structure on infiltration pressure
Both MD simulation snapshots (section 3.1) and energy analysis (section 3.2) have verifiedthe infiltrated quasi-periodic ion couple structure, whose geometric parameters a and b areboth dependent on anion size and concentration (section 3.3). It is important to note that in apressure-induced infiltration process, additional work must be done to transport one of suchion couples from the pore entrance towards the interior (and such extra work needs to becontinuously supplied in order to transport the ion couple structure in order to sustain theelectrolyte infiltration). The required energy to move one unit of ion couple, Ein, arises fromthe electrostatic interaction between the ion couple and an anion effectively left outside thenanopore. In figure 5, Ein is quantified as the energy variation associated with the motionof an ion couple moving from the tube opening to about 500 Å inside the nanopore (where
New Journal of Physics 12 (2010) 033021 (http://www.njp.org/)
8
1.4 1.6 1.8 2.00
10
20
30
40
Pauling’s ionic radius (Å)
b(Å
)
Br–F– Cl–
X = 0.06
5
6
9
10
11
12
P in
(MP
a)
5.5
X = 0.06
X = 0.08
X = 0.08
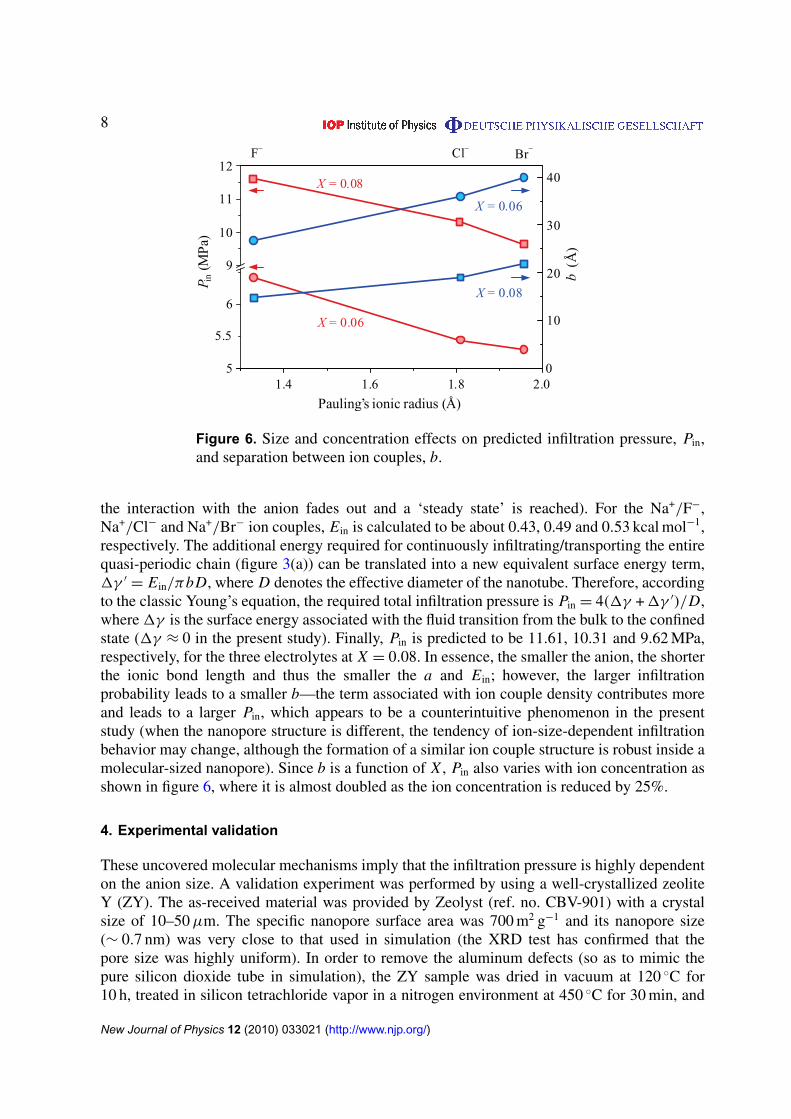
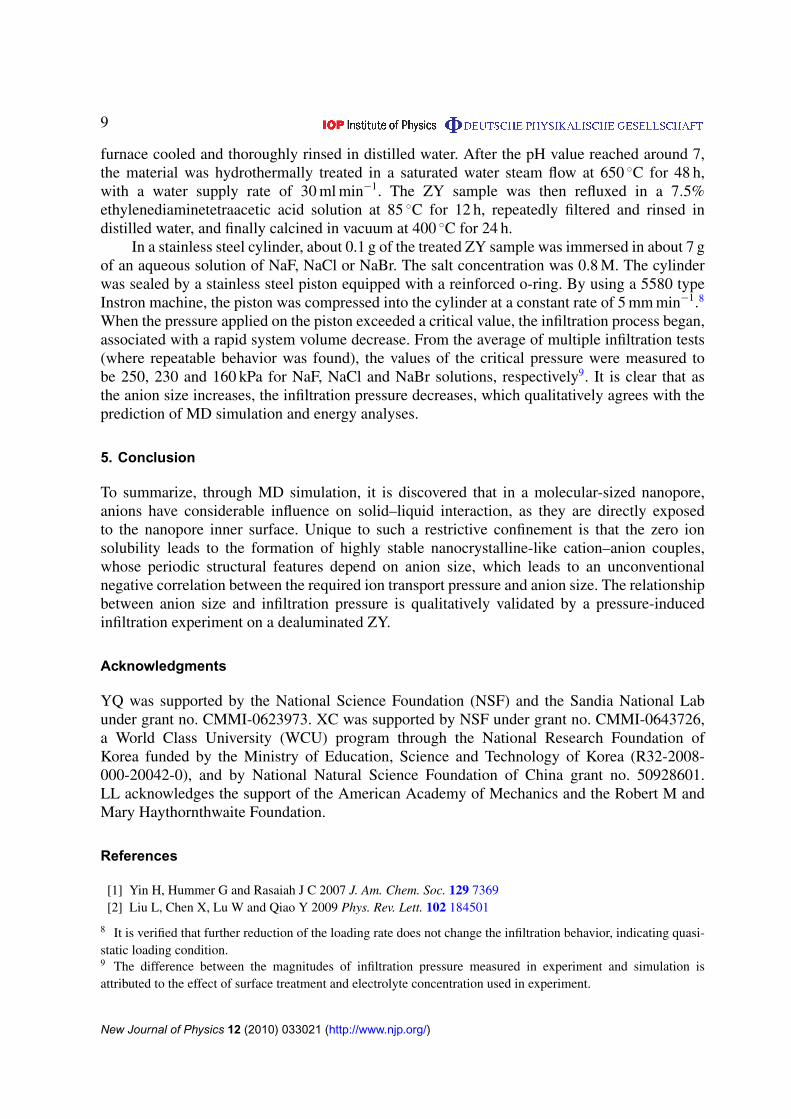
Figure 6. Size and concentration effects on predicted infiltration pressure, Pin,and separation between ion couples, b.
the interaction with the anion fades out and a ‘steady state’ is reached). For the Na+/F−,Na+/Cl− and Na+/Br− ion couples, Ein is calculated to be about 0.43, 0.49 and 0.53 kcal mol−1,respectively. The additional energy required for continuously infiltrating/transporting the entirequasi-periodic chain (figure 3(a)) can be translated into a new equivalent surface energy term,1γ ′
= Ein/πbD, where D denotes the effective diameter of the nanotube. Therefore, accordingto the classic Young’s equation, the required total infiltration pressure is Pin = 4(1γ + 1γ ′)/D,where 1γ is the surface energy associated with the fluid transition from the bulk to the confinedstate (1γ ≈ 0 in the present study). Finally, Pin is predicted to be 11.61, 10.31 and 9.62 MPa,respectively, for the three electrolytes at X = 0.08. In essence, the smaller the anion, the shorterthe ionic bond length and thus the smaller the a and Ein; however, the larger infiltrationprobability leads to a smaller b—the term associated with ion couple density contributes moreand leads to a larger Pin, which appears to be a counterintuitive phenomenon in the presentstudy (when the nanopore structure is different, the tendency of ion-size-dependent infiltrationbehavior may change, although the formation of a similar ion couple structure is robust inside amolecular-sized nanopore). Since b is a function of X , Pin also varies with ion concentration asshown in figure 6, where it is almost doubled as the ion concentration is reduced by 25%.
4. Experimental validation
These uncovered molecular mechanisms imply that the infiltration pressure is highly dependenton the anion size. A validation experiment was performed by using a well-crystallized zeoliteY (ZY). The as-received material was provided by Zeolyst (ref. no. CBV-901) with a crystalsize of 10–50 µm. The specific nanopore surface area was 700 m2 g−1 and its nanopore size(∼ 0.7 nm) was very close to that used in simulation (the XRD test has confirmed that thepore size was highly uniform). In order to remove the aluminum defects (so as to mimic thepure silicon dioxide tube in simulation), the ZY sample was dried in vacuum at 120 ◦C for10 h, treated in silicon tetrachloride vapor in a nitrogen environment at 450 ◦C for 30 min, and
New Journal of Physics 12 (2010) 033021 (http://www.njp.org/)
9
furnace cooled and thoroughly rinsed in distilled water. After the pH value reached around 7,the material was hydrothermally treated in a saturated water steam flow at 650 ◦C for 48 h,with a water supply rate of 30 ml min−1. The ZY sample was then refluxed in a 7.5%ethylenediaminetetraacetic acid solution at 85 ◦C for 12 h, repeatedly filtered and rinsed indistilled water, and finally calcined in vacuum at 400 ◦C for 24 h.
In a stainless steel cylinder, about 0.1 g of the treated ZY sample was immersed in about 7 gof an aqueous solution of NaF, NaCl or NaBr. The salt concentration was 0.8 M. The cylinderwas sealed by a stainless steel piston equipped with a reinforced o-ring. By using a 5580 typeInstron machine, the piston was compressed into the cylinder at a constant rate of 5 mm min−1.8
When the pressure applied on the piston exceeded a critical value, the infiltration process began,associated with a rapid system volume decrease. From the average of multiple infiltration tests(where repeatable behavior was found), the values of the critical pressure were measured tobe 250, 230 and 160 kPa for NaF, NaCl and NaBr solutions, respectively9. It is clear that asthe anion size increases, the infiltration pressure decreases, which qualitatively agrees with theprediction of MD simulation and energy analyses.
5. Conclusion
To summarize, through MD simulation, it is discovered that in a molecular-sized nanopore,anions have considerable influence on solid–liquid interaction, as they are directly exposedto the nanopore inner surface. Unique to such a restrictive confinement is that the zero ionsolubility leads to the formation of highly stable nanocrystalline-like cation–anion couples,whose periodic structural features depend on anion size, which leads to an unconventionalnegative correlation between the required ion transport pressure and anion size. The relationshipbetween anion size and infiltration pressure is qualitatively validated by a pressure-inducedinfiltration experiment on a dealuminated ZY.
Acknowledgments
YQ was supported by the National Science Foundation (NSF) and the Sandia National Labunder grant no. CMMI-0623973. XC was supported by NSF under grant no. CMMI-0643726,a World Class University (WCU) program through the National Research Foundation ofKorea funded by the Ministry of Education, Science and Technology of Korea (R32-2008-000-20042-0), and by National Natural Science Foundation of China grant no. 50928601.LL acknowledges the support of the American Academy of Mechanics and the Robert M andMary Haythornthwaite Foundation.
References
[1] Yin H, Hummer G and Rasaiah J C 2007 J. Am. Chem. Soc. 129 7369[2] Liu L, Chen X, Lu W and Qiao Y 2009 Phys. Rev. Lett. 102 184501
8 It is verified that further reduction of the loading rate does not change the infiltration behavior, indicating quasi-static loading condition.9 The difference between the magnitudes of infiltration pressure measured in experiment and simulation isattributed to the effect of surface treatment and electrolyte concentration used in experiment.
New Journal of Physics 12 (2010) 033021 (http://www.njp.org/)
10
[3] Fornasiero F, Park H G, Holt J K, Stadermann M, Grigoropoulos C P, Noy A and Bakajin O 2008 Proc. NatlAcad. Sci. USA 105 17250
[4] Chen X, Cui Q, Yoo J, Tang Y and Yethiraj A 2008 Biophys. J. 95 563[5] Shannon M A, Bohn P W, Elimelech M, Georgiadis J G, Marinas B J and Mayes A M 2008 Nature 452 301[6] Chen X, Surani F B, Kong X, Punyamurtula V K and Qiao Y 2006 Appl. Phys. Lett. 89 241918[7] Liu L, Qiao Y and Chen X 2008 Appl. Phys. Lett. 92 101927[8] Mattia D and Gogotsi Y 2008 Microfluid. Nanofluid. 5 289[9] Schoch R B, Han J Y and Renaud P 2008 Rev. Mod. Phys. 80 839
[10] Whitby M and Quirke N 2007 Nat. Nanotechnol. 2 87[11] Thomas J A and Mcgaughey A J H 2008 J. Chem. Phys. 128 084715[12] Gordillo M C and Marti J 2000 Chem. Phys. Lett. 329 341[13] Wang J, Zhu Y, Zhou J and Lu X H 2004 Phys. Chem. Chem. Phys. 6 829[14] Shao Q, Huang L L, Zhou J, Lu L H, Zhang L Z, Lu X H, Jiang S Y, Gubbins K E and Shen W F 2008 Phys.
Chem. Chem. Phys. 10 1896[15] Koga K, Gao G T, Tanaka H and Zeng X C 2001 Nature 412 802[16] Qiao Y, Liu L and Chen X 2009 Nano Lett. 9 984[17] Chen X, Cao G, Han A, Punyamurtula V K, Liu L, Culligan P J, Kim T and Qiao Y 2008 Nano Lett. 8 2988[18] Liu L, Zhao J B, Yin C, Culligan P J and Chen X 2009 Phys. Chem. Chem. Phys. 11 6520[19] Qiao Y, Cao G and Chen X 2007 J. Am. Chem. Soc. 129 2355[20] Han A and Qiao Y 2006 J. Am. Chem. Soc. 128 10348[21] Wasan D T and Nikolov A D 2003 Nature 423 156[22] Wieckowski A 1999 Interfacial Electrochemistry (New York: Marcel Dekker)[23] Sun H 1998 J. Phys. Chem. B 102 7338
New Journal of Physics 12 (2010) 033021 (http://www.njp.org/)