effects of anaerobic digester sludge … of anaerobic digester sludge age ... the residual...
TRANSCRIPT

EFFECTS OF ANAEROBIC DIGESTER SLUDGE AGE ON ODORS FROM DEWATERED BIOSOLIDS
Nitin Verma**, Chul Park*, John T. Novak*, Zeynep Erdal***, Bob Forbes*** and Robert
Morton****
*Department of Civil and Environmental Engineering Virginia Tech
Blacksburg VA 24061
**Carollo Engineers
***CH2M Hill
****Los Angeles County Sanitation District
ABSTRACT Dewatered sludge cakes from bench scale anaerobic digesters operated at mesophilic temperatures and solids retention times (SRT) ranging from 10 days to 40 days were evaluated for their sulfur odor generation potential. Extracellular Polymeric Substances (EPS) extraction for digested sludge samples was also carried out. Static headspace sulfur gas analysis was successfully used to compare different sludge digestion SRTs for their odor potential. Higher volatile solids destruction was observed at higher SRTs and also the quantity of sulfur gases was found to decrease with an increase in the SRT of the anaerobic digesters. Results also showed that the cake solids concentration affected the odor generation from dewatered sludge cakes. Three different EPS extraction techniques were used to selectively extract materials bound to Fe, Al and Ca-Mg in sludge. It was found that Fe-associated proteins correlated well with sulfur gas production. As the Fe-associated protein content declined, the odor potential declined. Operating anaerobic digesters at higher SRTs seem to provide benefit with regard to odor generation. However, even after 40 days of anaerobic digestion, the odor potential remained high. KEYWORDS Biosolids, odors, anaerobic digestion, solids retention time
INTRODUCTION
Odor produced from dewatered biosolids is a major cause of concern at many wastewater treatment plants and land application sites. Recent studies have shown that most odors are associated with volatile sulfur compounds (VSCs) and that the odor generation was largely influenced by the dewatering equipment [Adams et al. 2002, Muller et al. 2004]. The solids retention time (SRT) of anaerobic digesters was also reported by Adams et al. (2003) to affect the odor potential of digested biosolids. A recent WERF study (Adams et al., 2002), the odor threshold decreased with an increase in digester SRT, however, the data were for a variety of
1119
WEFTEC®.06
Copyright 2006 Water Environment Foundation. All Rights Reserved©

sludges so the results were not entirely clear. The mechanisms responsible for reduction in odor potential with longer SRT have not been evaluated. A recent study by Muller et al. (2004) showed that when biosolids in the presence of conditioning polymer are exposed to high shearing forces, proteins are released from sheared sludge particles and rendered bioavailable. The authors further suggested that degradation of this released material is a cause of odor generation from dewatered biosolids. If this reasoning is true, a better understanding of floc structure could be usefully linked to the study of odor generation from digested sludges. It is known that extracellular polymeric substances (EPS) compose a major organic fraction of biosolids floc (Frølund et al., 1996). It has been postulated that there are different pools of EPS that are bound with different metal ions in floc. Degradation of those materials are associated with different digestion conditions (Novak et al., 2003). Important biopolymeric fractions are:
• divalent cation-associated EPS, • Fe-linked EPS, and • Al-bound EPS
It was observed in previous studies conducted at Virginia Tech that anaerobic and aerobic digestion of a waste activated sludge, from several different wastewater treatment plants (WWTPs), resulted in remarkably different cation and biopolymer releases and different degrees of volatile solids (VS) destruction [Park, 2002]. A large amount of protein was recovered from the sludge solution following anaerobic digestion but the release of divalent cations was not observed. Furthermore, there was a correlation between the VS reduction by anaerobic digestion and the Fe concentration in feed sludges. These results further suggested that proteins associated with Ca and Mg are mainly degraded under aerobic conditions while exopolymers associated with Fe are readily degraded under anaerobic conditions (Park et al., 2004). It was also shown that Al plays a significant role in bioflocculation by improving effluent quality with higher Al content in floc but the impact of Al and its binding organic matter on sludge digestion is unclear (Park et al. 2004). Park et al. (2004) showed that three components of floc EPS can be selectively extracted by different chemical extraction methods. These are cation exchange resin (CER) extraction to extract Ca++ and Mg++ bound EPS, sulfide extraction of iron-bound EPS and aluminum-bound EPS extraction using base at pH 10.5. The objective of this study was to determine the impact of anaerobic digester SRT on the sulfur gas generation from dewatered biosolids cakes. The relationship between SRT and odors is an important conceptual issue. If additional solids destruction is possible at higher sludge ages and this leads to lower odors, then this would suggest that improvements in digestion process are likely to reduce odors. On the other hand, if at higher SRT substantial reduction in odor is not observed, that will indicate that post digestion processes are likely to be the best approach for reducing odors from dewatered biosolids cake. This study was also aimed at elucidating the nature and impact of the various EPS fractions on odors. The results of this study are also expected to help determine the floc composition with changing SRT and its impact on odor generation from dewatered biosolids.
1120
WEFTEC®.06
Copyright 2006 Water Environment Foundation. All Rights Reserved©

MATERIALS AND METHODS
Experimental Approach This study was conducted at Los Angeles County Sanitation District (LACSD) and Virginia Tech using pilot scale anaerobic digesters operated over a range of SRTs (10, 15, 20, 30 and 40 days). The pilot scale digesters were operated by the LACSD. The reactors were fed with a 75% primary and 25% waste activate sludge blend, the same mixture as in the treatment plant. Feed and digested sludge samples were periodically sent to Virginia Tech for odor testing and EPS extraction. Multiple odor vials were set up and odor thresholds were determined using the centrifuge simulation technique described below and Gas Chromatography/Mass Spectrometry for sulfur compound idenfication. The extraction methods described previously were used to determine the floc fraction that gives different characteristics of sludges between different SRTs and maybe associated with odors in biosolids.
Preparation of Incubation Vials Dewatered cakes of anaerobically digested sludges for odor analysis were prepared using a method that mimics the processes occurring in a centrifuge. Under high shear conditions, the optimum polymer dose for all sludge samples was determined using the capillary suction time (CST) test (Muller et al., 2004). The optimum polymer dose was determined by finding the polymer dose that produces the minimum CST. A Triton Type 304-M and Triton Type 165 CST apparatus were utilized with Whatman 17-CHR as the chromatography paper. Liquid cationic polymer solution was prepared for dosing. Clarifloc 3275 – a high molecular weight cationic polymer was used for all sludges to minimize the affects of varying polymer types on odors from biosolids. The overall approach to mimic the actions of centrifuge to generate odors was to provide shear that was similar to that occurring in the centrifuge, to dewater cakes to solids concentration that was similar to high-solids centrifuge and to provide polymer for conditioning at a dose similar to the centrifuge. A Warring Blender was used to shear the sludge. Liquid sludge was sheared for 30 sec at in 100 mL increments. The optimum dose of cationic polymer for each sample was determined by conducting a polymer dose test using 30 seconds shearing. Sludge dewatering using the optimum polymer dose was accomplished using a laboratory centrifuge followed by a mechanical filter press. The centrifuge was operated at 17,700 xG for 15 minutes at 25oC. Sludge cakes obtained from centrifuge were further dewatered to increase the solids content using a hydraulic piston press using Whatman 41 paper as the filter media. Cake storage experiments were performed on samples of the dewatered cake in odor vials. To accomplish this, 25g ± 1g of dewatered cake were placed in glass bottles (250 mL). The bottles were sealed with Teflon septa and stored at a constant temperature of 22oC for the duration of the experiments. Multiple odor vials containing dewatered cake samples with low and high solids content were prepared for each sludge for GC/MS analysis. Low-cake solids cake refer to cake samples that
1121
WEFTEC®.06
Copyright 2006 Water Environment Foundation. All Rights Reserved©

were dewatered using the laboratory centrifuge and having a solids content similar to dewatered cake achieved using a low-solids centrifuge. High-solids cake refer to cake samples that were further dewatered using the hydraulic piston to achieve solids concentrations similar to those derived from high solids centrifuges. For high-solids and low-solids cakes, samples both with and without the addition of Bromoethane-sulphonic acid (BESA), a methanogen inhibitor, were prepared. Five milliliters of BESA solution (0.127 mmole) was added to about 400 mL of liquid sludge before dewatering it using the lab centrifuge.
Odor profiling and qualification The characterization of odors was accomplished using the method described by Novak et al. (2002). This method was modified by using glass containers with Teflon lined septa rather than PET bottles. The compounds of interests were MT, DMS, DMDS with H2S being of secondary interest since it is a metabolic waste product of methylotropic methanogenesis and will react chemically with iron. Since the LACSD adds iron salts to the digester feed to reduce hydrogen sulfide, little H2S was found.The headspace in the incubation vial was analyzed periodically for sulfur gases by cryo-trapping and gas-chromatography with mass spectrometry. The headspace in the incubation vial was sampled periodically to produce a time response profile. Peak sulfur odor is the maximum concentration of headspace organic sulfur achieved over the incubation period. A typical odor profile for cake without BESA consists of two phases; a first phase in which organic sulfur gases are generated and a second phase when organic sulfur gases are consumed. The point of inflection between these two phases represents the peak sulfur odor for that particular sample. For cake samples to which BESA was added, the second phase does not occur. After attaining the peak, when BESA is added, the total sulfur concentration stays at the peak concentration. Peak organic sulfur gas concentration for all the cake samples was measured and used to compare the odor generation potential for various SRTs.
Other analysis In addition to the odor and cation analysis the following tests were conducted:
a. Total and volatile solids b. Residual biological activity c. Solution proteins and polysaccharides
All solids analyses were conducted according to Standard Methods (APHA, 1999). In order to prepare samples for cation and VFA analyses, a 500mL sample for digester biosolids was centrifuged at 17,700 xG for 15 minutes. The supernatant liquid was filtered through a 0.45 μm syringe filter. From this filtered sample, dilutions were made for cation testing. Liquid phase cations were measured on Dionex D-120 ion chromatograph utilizing a CS-12 column and conductivity detector with self generating suppression of the eluent(Dionex Corp., Sunnycale, CA). Twenty millimolar methanesulfonic acid was used for eluent at a flow rate of 1mL/min.
1122
WEFTEC®.06
Copyright 2006 Water Environment Foundation. All Rights Reserved©

The residual biological activity test (RBA) was a simplified modification of the additional digestion test method outlined by the EPA (1993). It was conducted by incubating 100mL digested sludge samples in serum vials at 36.5°C for at least 40 days. During the incubation period, the vials were periodically degassed and weighed. The weight lost from each vial was assumed to be from gasification of the VS in each sample. The RBA was calculated by dividing the weight lost from each sample at the end of incubation by the weight of its VS content (analyzed prior to incubation) and is reported as percent VS lost. Soluble and the extracted proteins were determined by the modified Lowry et al. (1951) method described by Frølund et al. (1996) using bovine serum albumin as the standard. Soluble and extracted polysaccharides were measured by the Dubois et al. (1956) method utilizing glucose as the standard. Laboratory centrifuge was used to separate the solution from majority of solids in sludge. The supernatant after centrifuge was filtered through a 1.5 μm membrane filter and then analyzed separately for proteins and polysaccharides. The values obtained were termed as solution protein and solution polysaccharide.
RESULTS AND DISCUSSION Multiple incubation vials for dewatered sludge cake samples from the different bench scale digesters were prepared using the methods previously described. The headspace in the incubation vial was sampled periodically to produce a headspace gas versus time profile. Total organic sulfur concentrations were calculated by summing the individual concentration of methanethiol, dimethylsulfide, and dimethyldisulfide as total volatile organic sulfur concentration (TVOSC). Figure 1 is an example of a TVOSC profile generated using the static headspace method. The data in Figure 1 is from the different vials prepared for a sample from the lab anaerobic digester operated at 10 days.
1123
WEFTEC®.06
Copyright 2006 Water Environment Foundation. All Rights Reserved©

0
500
1000
1500
2000
2500
3000
0 2 4 6 8 10 12 14 16 18 20
Incubation time (days)
Head
Spa
ce O
rgan
ic S
ulfu
r (m
g/m
3)High cake solids
High cake solids-replicate
Low cake solids
High cake solids-w / BESA
Low cake solids-w / BESA
Figure 1: Changes in headspace organic sulfur content under static headspace incubation of cakes obtained after dewatering liquid sludge sample from 10 day bench scale digester
Sulfur gas production and role of methanogens Research has shown that methanogenic bacteria are able to degrade VOSCs to sulfide. For example, in fresh water sediments a balance typically exists between the production of VOSCs and their degradation, resulting in little emission of these compound into the atmosphere unless the system is disturbed [Lomans et al., 2001]. A similar balance likely exists in anaerobic digesters since VOSCs are typically not emitted except under conditions that cause stress to the methanogenic bacteria. Higgins et al. (2006) have shown that methanogens play an important role in cycling of VOSCs from biosolids. Higgins et al. (2004) also showed that near stoichiometric amounts of VOSCs are produced to the amount of available sulfur containing substrate when the methanogens are inhibited. Data for TVOSCs from dewatered cakes from the 10 day SRT lab digesters are presented in Figure 1. As shown in Figure 1, the high solids dewatered cakes that were amended with BESA to reduce the methanogenic activity produced TVOSCs that were similar to those for which BESA was not added. For the low solids cake, the VOSC concentration without BESA did not peak as high and the concentration decreased faster than for the BESA amended sample. These data suggest that methanogens in the LA County biosolids are somewhat inhibited, since the BESA amended cakes were similar to the unamended. For the low cakes solids cakes, BESA resulted in higher VOSCs, indicating that inhibition was less in the lower solids cakes.
Variation in sulfur gas production with anaerobic digester SRT
1124
WEFTEC®.06
Copyright 2006 Water Environment Foundation. All Rights Reserved©

The headspace peak organic sulfur concentration plotted as a function of SRT of the laboratory anaerobic digesters is shown in Figure 2. The sulfur gas concentration from the dewatered cake of the feed sludge is shown as SRT = 0 days. The data show the peak organic sulfur concentration in headspace vials both with and without BESA. As suggested by Adams et al. (2002), the head space peak organic sulfur decreased as the SRT increased. The non-BESA amended samples with high-solids content differed little from high-solids cake samples amended with BESA; indicating BESA addition did not have much effect. These data support the idea that some type compound inhibitory to methanogenic organisms is present in the dewatered cake samples. Further study is required to verify this and improve our knowledge of toxicity effects on odor generation from dewatered cakes.
R2 = 0.93
R2 = 0.88
0
500
1000
1500
2000
2500
3000
3500
0 5 10 15 20 25 30 35 40 45
SRT (days)
Peak
Org
anic
Sul
fur (
mg/
m3 )
without BESA with BESA
Figure 2: Variation of peak headspace organic sulfur gas concentration for high-solids cake (for sample set 4) with anaerobic digester SRT. The peak organic sulfur gas concentration in the headspace of the odor vials ranged from about 2000 to 2500 mg/m3 for the feed sludge and from about 800 to 1000 mg/m3 for the 40 day SRT sludge. These concentrations are much higher than those reported by Adams et al. (2003) for 11 anaerobically digested sludges tested in the WERF study. None of the 11 sludges tested by Adams et al. (2003) produced an organic sulfur concentration exceeding 1000 mg/m3. These data show that sludge used from LACSD has a very high odor potential and even at a very long SRT, the odor potential remained high. Figure 3 shows the average headspace peak VOSC concentration in incubation vials containing dewatered cake sample having low(TS = 17.0%, VS= 12.3%) and high solids content(TS =
1125
WEFTEC®.06
Copyright 2006 Water Environment Foundation. All Rights Reserved©
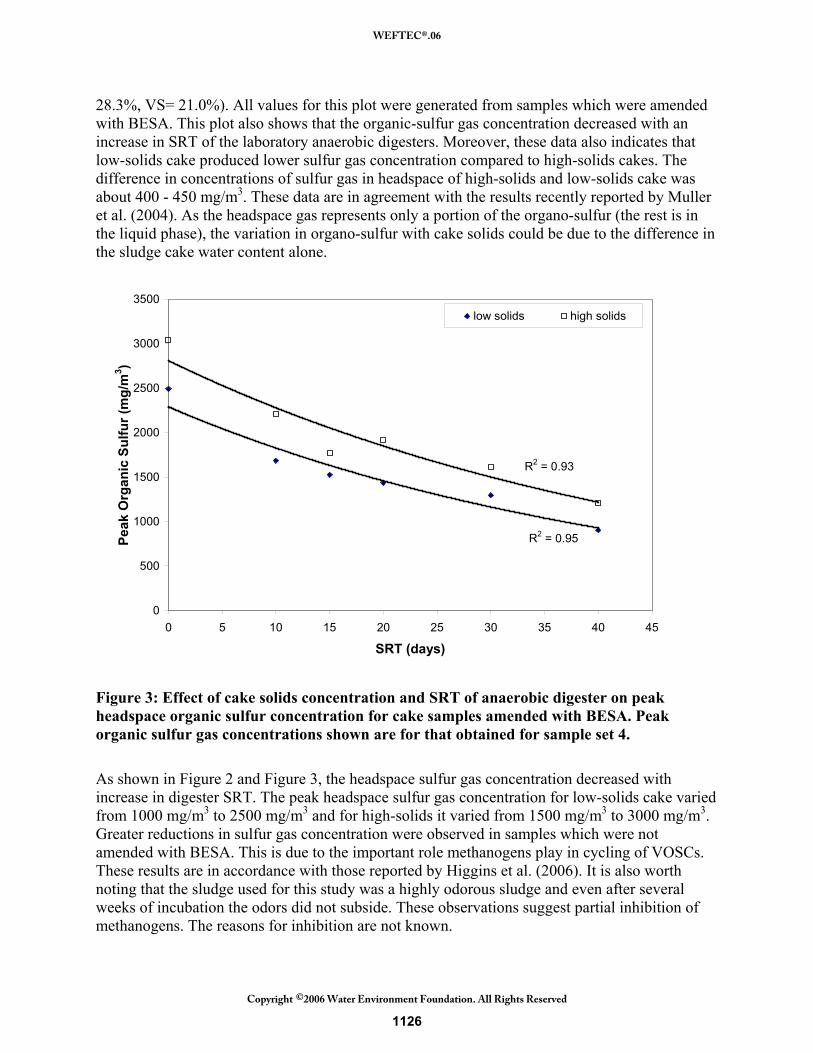
28.3%, VS= 21.0%). All values for this plot were generated from samples which were amended with BESA. This plot also shows that the organic-sulfur gas concentration decreased with an increase in SRT of the laboratory anaerobic digesters. Moreover, these data also indicates that low-solids cake produced lower sulfur gas concentration compared to high-solids cakes. The difference in concentrations of sulfur gas in headspace of high-solids and low-solids cake was about 400 - 450 mg/m3. These data are in agreement with the results recently reported by Muller et al. (2004). As the headspace gas represents only a portion of the organo-sulfur (the rest is in the liquid phase), the variation in organo-sulfur with cake solids could be due to the difference in the sludge cake water content alone.
R2 = 0.93
R2 = 0.95
0
500
1000
1500
2000
2500
3000
3500
0 5 10 15 20 25 30 35 40 45
SRT (days)
Peak
Org
anic
Sul
fur (
mg/
m3 )
low solids high solids
Figure 3: Effect of cake solids concentration and SRT of anaerobic digester on peak headspace organic sulfur concentration for cake samples amended with BESA. Peak organic sulfur gas concentrations shown are for that obtained for sample set 4. As shown in Figure 2 and Figure 3, the headspace sulfur gas concentration decreased with increase in digester SRT. The peak headspace sulfur gas concentration for low-solids cake varied from 1000 mg/m3 to 2500 mg/m3 and for high-solids it varied from 1500 mg/m3 to 3000 mg/m3. Greater reductions in sulfur gas concentration were observed in samples which were not amended with BESA. This is due to the important role methanogens play in cycling of VOSCs. These results are in accordance with those reported by Higgins et al. (2006). It is also worth noting that the sludge used for this study was a highly odorous sludge and even after several weeks of incubation the odors did not subside. These observations suggest partial inhibition of methanogens. The reasons for inhibition are not known.
1126
WEFTEC®.06
Copyright 2006 Water Environment Foundation. All Rights Reserved©

Figure 4 shows the percentage reduction in TVOSC as a function of digester SRT. Odor vials which contained low solids samples without BESA showed a greater TVOSC reduction (Figure 4b) and greater variability. For the low-solids concentration cake samples, a much greater reduction (about 75%) in peak headspace organic-sulfur gas concentration was observed for low solids without BESA, even at 10 days. These results suggest that cake solids content influences odor generation and also that methanogens play an important role in cycling of VOSCs. These data clearly show the odor problems that utilities have seen when switching from a low to high solids centrifuge. It is believed that methanogenic activity (Lomans et al., 2001) may be inhibited due to the dryness of cakes.
R2 = 0.90
R2 = 0.94
0%
10%
20%
30%
40%
50%
60%
70%
0 5 10 15 20 25 30 35 40 45SRT (days)
Peak
org
ano-
sulfu
r gas
redu
ctio
n (%
)
High solids without BESA High solids with BESA
Figure 4(a): Reduction in peak headspace organic sulfur gas concentrations for dewatered biosolids cakes compared to feed sludge for high cake solids biosolids cake.
1127
WEFTEC®.06
Copyright 2006 Water Environment Foundation. All Rights Reserved©

R2 = 0.85
R2 = 0.14
0%
10%
20%
30%
40%
50%
60%
70%
80%
90%
0 5 10 15 20 25 30 35 40 45SRT (days)
Peak
org
ano-
sulfu
r gas
redu
ctio
n (%
)
Low solids without BESA Low solids with BESA
Figure 4(b): Reduction in peak headspace organic sulfur gas concentrations for dewatered biosolids cakes compared to feed sludge for low cake solids biosolids cake.
Volatile solids destruction and odors Data in Figure 5 shows the average VS destruction versus digester SRT. The data show that VS destruction increases with an increase in digester SRT. About 50% VS reduction was observed in the 10 days digester. Evaluation of the data showed that VS destruction in anaerobic digestion for 10 days or more was greater than 38%, which is one of the major parameters for regulatory compliance with the Vector Attraction Reduction (VAR) requirement of 503 rule. On average, about 6 % additional VS destruction from 20 days to 30 days and 8% from 30 days to 40 days was observed. It is clear that the 38 % VS reduction does not guarantee a low odor sludge.
1128
WEFTEC®.06
Copyright 2006 Water Environment Foundation. All Rights Reserved©

49%
50%
51%
52%
53%
54%
55%
56%
57%
58%
59%
0 5 10 15 20 25 30 35 40 45
SRT (days)
VS d
estr
uctio
n (%
)
Figure 5: VS reduction as a function of digester SRT. VS reduction is used as a design parameter and also for the classification of biosolids as Class A or B. It was believed that higher VS destruction in the digester should have a beneficial impact on digested biosolids quality and dewatered biosolids odors. To investigate this relationship, peak headspace organic sulfur gas concentrations were plotted against digester VS destruction as shown in Figure 6. The organic sulfur concentration in the headspace of incubation vials containing high-solids cake varied from 1000 to 2500 mg/m3 over a 50 to 58% VS destruction range. Lower sulfur gas concentrations were observed for cake samples from digesters with higher VS destruction suggesting that VS destruction results in the degradation of odor generating organic matter. The percentage change in VS is small in comparison to the drop in organic sulfur concentration, indicating that the extra VS that is destroyed at longer SRTs is primarily comprised of odor generating organic material. Therefore, although additional VS destruction leads to lower TVOSC and therefore, lower odors, the relationship is not direct.
1129
WEFTEC®.06
Copyright 2006 Water Environment Foundation. All Rights Reserved©

R2 = 0.48
R2 = 0.67
51%
51%
52%
52%
53%
53%
54%
54%
55%
55%
56%
1000 1200 1400 1600 1800 2000 2200 2400
Peak Organic Sulfur (mg/m3)
VS d
estu
ctio
n (%
)with BESA without BESA
Figure 6: Odor as a function of VS destruction.
Residual biological activity with VS reduction and odors Residual biological activity is considered to be a measure of the biological stability of digested biosolids, since it represents the potential for further biological activity through endogenous decay and consumption of the substrate available in the form of volatile acids and proteins. Figure 7(a) illustrates the correlation between biosolids RBA measured at 40 days post digestion and VS reduction in the digester. The RBA test for each SRT digester was similar to the VS reduction pattern observed. The 40 day SRT digester had the lowest RBA of about 20%. Figure 7(b) shows the plot of RBA versus peak headspace organic sulfur gas concentration for sludge sample set four. The RBA varied from about 15% to 28% and headspace sulfur concentration varied from 1500 mg/m3 to 2800 mg/m3. These data suggest that as RBA decreased, the organic sulfur gas concentration decreased.
1130
WEFTEC®.06
Copyright 2006 Water Environment Foundation. All Rights Reserved©

R2 = 0.59
10%
12%
14%
16%
18%
20%
22%
24%
26%
28%
30%
51% 51% 52% 52% 53% 53% 54% 54% 55% 55% 56%
VS destruction (%)
RB
A (%
)
Figure 7(a): Relationship of Residual Biological Activity with VS destruction in anaerobic digester for biosolids from digesters operated at different SRT. (Data for sample set 4).
R2 = 0.91
10%
12%
14%
16%
18%
20%
22%
24%
26%
28%
30%
1000 1200 1400 1600 1800 2000 2200 2400 2600 2800
Peak organic sulfur (mg/m3)
RB
A (%
)
Figure 7(b): Relationship of RBA with peak headspace organic sulfur concentration. (Data for sample set 4).
1131
WEFTEC®.06
Copyright 2006 Water Environment Foundation. All Rights Reserved©

Variation of dewatering rate and solution biopolymer concentration with SRT Figure 8 shows the variation in the dewatering rate of digested sludge (Capillary Suction Time - CST) as a function of anaerobic digester SRT. The CST for the feed sludge was highest and the CST decreased with increase in digester SRT. Figure 9 shows the variation in the concentration of solution proteins and polysaccharides respectively in the digester effluent as a function of digester SRT. Both solution protein and polysaccharide concentrations decreased with an increase in SRT. These data suggest that within the first 10 days most of the organic material in feed sludge is hydrolyzed. This results in solubilization of proteins and polysaccharides and some of these constituents are colloidal and interfere with sludge filtration, resulting in a high CST. From 10 to 40 days much of the soluble and colloidal material and a smaller amount of solids are degraded and as a result, the CST goes down.
y = -0.06x3 + 5.54x2 - 175.45x + 2240.1R2 = 0.98
0
200
400
600
800
1000
1200
0 5 10 15 20 25 30 35 40 45
SRT (days)
CST
(sec
)
Figure 8: Dewatering measured as CST as a function of digester SRT. (Data for sample set 4)
1132
WEFTEC®.06
Copyright 2006 Water Environment Foundation. All Rights Reserved©

y = 0.1205x2 - 7.5936x + 314.61R2 = 0.89
100
140
180
220
260
300
0 5 10 15 20 25 30 35 40 45
SRT (days)
Solu
tion
Prot
eins
(mg/
L)
Figure 9(a): Protein concentration in solution as a function of anaerobic digester SRT. (Data for sample set 4)
y = 0.0191x2 - 1.2104x + 48.033R2 = 0.64
0
10
20
30
40
50
0 5 10 15 20 25 30 35 40 45
SRT (days)
Solu
tion
Poly
sacc
harid
es (m
g/L)
Figure 9(a): Polysaccharide concentration in solution as a function of anaerobic digester SRT. (Data for sample set 4)
1133
WEFTEC®.06
Copyright 2006 Water Environment Foundation. All Rights Reserved©

Extracellular Polymeric Substances (EPS) and odors The data from the first set of samples for odor and EPS extraction study are shown in Figure 10. Consistent with previous findings (Adams et al. 2003), the headspace peak organic sulfur concentration decreased as SRT increased. It was observed that protein extracted by addition of sulfide decreased while the CER extractable protein did not vary with SRT. These data suggest that decrease of odor potential with an increase in SRT was accompanied by the degradation of Fe-associated protein. The importance of Fe-bound protein in anaerobic digestion is in accordance with a previous study (Novak et al., 2003) showing that release of Fe-bound protein by reduction of Fe under anaerobic conditions and its further degradation is related to the digestibility of sludge by anaerobic digestion. The sulfide extraction data from the study further imply that there are still proteins bound with Fe in anaerobically digested sludges and this material leads to the generation of odor.
0
10
20
30
40
50
60
70
80
0 5 10 15 20 25 30 35
SRT (days)
Prot
eins
(mg/
gVS)
sulfide CER
Figure 10(a): Protein extracted by CER procedure and sulfide extraction technique with SRT. (Data for sample set 1)
1134
WEFTEC®.06
Copyright 2006 Water Environment Foundation. All Rights Reserved©

0
500
1000
1500
2000
2500
3000
0 5 10 15 20 25 30 35
SRT (days)
Peak
Org
anic
Sul
fur (
mg/
m3 )
Figure 10(b): Variation of peak organic sulfur. (Data for sample set 1) Figure 11 shows the protein concentration extracted from the feed sludge and the sludge following 40 days digestion using the three extraction techniques. The data in Figure 11 illustrates that anaerobic digestion of feed sludge was closely related to the degradation of Fe-bound protein (sulfide extractable protein). While proteins extracted by CER and base extractions did not change before and after digestion, almost 45% of the Fe-associated protein was removed after 40 days of anaerobic digestion. These data provide a strong indication that Fe-linked proteins were selectively and continuously degraded under anaerobic conditions. This result is also in accordance with earlier studies that iron and the proteins associated with iron play an important role in determining the digestibility of sludge under anaerobic conditions (Park et al., 2004). It is believed that this is most likely because Fe+3 undergoes reduction under anaerobic conditions, reducing the strength of the binding between Fe and proteins. This increases the bioavailability of proteins and makes them more susceptible to dispersion by shear.
1135
WEFTEC®.06
Copyright 2006 Water Environment Foundation. All Rights Reserved©

0
10
20
30
40
50
60
Sulfide CER BASE
Prot
eins
(mg/
gVS)
FEED 40 days
Figure 11: Proteins extracted from feed sludge and 40 day SRT anaerobic sludge by different extraction methods. (Note: Sulfide – extraction of Fe-bound material using sulfide extraction, CER – extraction of Ca-Mg bound material using cation exchange resin(CER), BASE – extraction of Al-bound material using strong base.) Figure 12 shows the plot of peak organic sulfur against sulfide extracted proteins for two sets of samples. For sludge from both set 2 and set 4, the extracted protein concentrations correlated well with the peak headspace organic sulfur gas concentrations. Headspace sulfur gas concentration increased with an increase in the amount of proteins bound to iron, extracted by sulfide extraction method. These data suggest that the sulfide extraction test may be a useful tool for determining if a sludge is likely to generate odors if it were to be dewatered by a high solids centrifuge. .
1136
WEFTEC®.06
Copyright 2006 Water Environment Foundation. All Rights Reserved©

R2 = 0.80
R2 = 0.95
0
500
1000
1500
2000
2500
3000
3500
0 5 10 15 20 25 30 35 40 45 50
Sulfide Extracted Protein (mg/gVS)
Pea
k O
rgan
ic S
ulfu
r (m
g-O
S/m
3 )Sample set 2 Sample set 4
Figure 12: Sulfide extracted protein versus peak organic sulfur odor. Figure 13 shows the plot of sulfide extracted proteins for set 4 sludge samples with the RBA values. These data suggest that the sulfide extraction protein correlated with the RBA data, suggesting that the materials associated with iron that are left un-degraded after anaerobic digestion are degraded during the extended digestion period of 40days. These data are preliminary and only for one sludge, hence any universal relationship is subject to speculation.
1137
WEFTEC®.06
Copyright 2006 Water Environment Foundation. All Rights Reserved©

R2 = 0.87
0
10
20
30
40
50
60
10% 12% 14% 16% 18% 20% 22% 24% 26% 28% 30%
RBA (%)
Sulfi
de e
xtra
cted
pro
tein
(mg/
gVS)
Figure 13: Sulfide extracted protein versus RBA. (Data for sample set 4)
SUMMARY This study was conducted to elucidate the effect of anaerobic digester SRT on the odor generation potential of dewatered biosolids cakes. A blend of primary and waste activated sludge, 75% primary and 25% WAS – the same mixture as in the treatment plant, was digested in lab scale anaerobic digesters operated at SRT ranging from 10 days to 40 days. Digested biosolids were tested for odor generation using a centrifuge simulation method developed at Virginia Tech along with EPS extraction studies which were aimed at improving our understanding of the odor generation and what fractions of EPS are related to odor production. It was observed that VS destruction increased with increase in SRT. This was corroborated with higher lower solution proteins for samples from digesters operated at higher SRT. Residual biological activity was measured by digesting biosolids samples for additional 40 days. RBA results showed a reasonable correlation with VS reduction and also correlated well with headspace organic sulfur gas concentration. Headspace gas analysis was conducted on dewatered cake samples with and without addition of BESA, a strong methanogenic inhibitor. It was observed that sulfur gas concentration decreased with increase in SRT. All headspace vials showed this trend. However, better reproducibility of headspace gas concentration data was observed for high solids content cake samples or for cakes that were amended with BESA. Lower sulfur gas concentrations were consistently observed from cake samples which had a lower cake solids concentration. These data suggest that solids concentration influences the generation of sulfur gases, hence odors. Peak sulfur gas concentration data showed a good correlation with VS destruction. It was seen that higher VS destruction resulted in lower odors.
1138
WEFTEC®.06
Copyright 2006 Water Environment Foundation. All Rights Reserved©

Three EPS extraction techniques were used to extract organic materials bound to different cations (Fe, Al, Ca and Mg). It was observed that proteins extracted by different chemical methods behaved in considerably different manner as anaerobic digestion proceeded and it is Fe-associated proteins that were primarily associated with VS destruction and sulfur gas generation.
Conclusions The main conclusions that can be drawn from this study are:
1. Higher volatile solids destruction is achieved by operating anaerobic digesters at higher SRT.
2. Sulfur gas concentration in headspace on dewatered cakes of anaerobically digested biosolids decreased with increase in digester SRT. The headspace organic sulfur gas concentration ranged from about 2200 mg/m3 to 1000 mg/m3 for SRT ranging from 10 days to 40 days.
3. A correlation of VS destruction with sulfur gas concentration in headspace was observed, suggesting that VS destruction can be used as a tool to estimate sulfur gas generation from dewatered biosolids. Reduction in sulfur odors with increase in SRT was observed, however, quite high concentrations of sulfur gases were observed even for biosolids cake from the digesters operated at 40 days detention time.
4. Headspace gas analysis on dewatered cake samples is a tool used to estimate the odor generation from biosolids cakes. Amending samples with a methanogenic inhibitor produced better repeatability of results, suggesting that methanogenic activity has a key role in reducing sulfur odors.
5. Sulfur gas generation was found to be a function of the EPS material bound to Fe. Good correlation of sulfur gas concentration with extracted Fe-bound protein was observed. However, the data was not consistent for multiple trials; suggesting that iron in sludge was found to be linked to sulfur production but the EPS extraction method may not be a universal tool to estimate odor generation.
Further research needs to be done to elucidate on the processes involved in sulfur gas generation and degradation from dewatered biosolids cake. The extraction data suggests iron associated EPS material is degraded during anaerobic digestion, however, all iron bound material is not degraded in anaerobic digestion and this iron-bound material is rendered bioavailable in the presence of shear. Once bioavailable these materials, primarily proteins, degrade to generate odor. The role of iron and aluminum needs to be explored further along with what changes in properties of anaerobically digested biosolids occurs when it is subject to high shear.
1139
WEFTEC®.06
Copyright 2006 Water Environment Foundation. All Rights Reserved©

REFERENCES
Adams, G.M., Witherspoon, J., Card, T., Forbes, R., Geselbracht, J., Glindemann, D., Hargreaves, R. Hentz, L., Higgins, M., McEwen, D., and Murthy, S. Identifying and Controlling the Municipal Wastewater Odor Environment Phase 2: Impacts of In-Plant Operational Parameters on Biosolids Odor Quality. 2003, Water Environment Research Foundation: Alexandria, VA.
American Public Health Association; American Water Works Association; and Water
Environment Federation (1995) Standard Methods for the Examination of Water and Wastewater. 19th Ed., Washington, D.C.
Dubois, M., Gilles, K.A., Hamilton, J.K., Rebers, P.A., and Smith, F. (1956) Colorimetric
Methods for Determination of Sugars and Related Substances. Analytical Chem., 28, 350. EPA (1999) Environmental regulations and technology: Control of pathogens and vector
attraction in sewage sludge. Office of Research and Development, Washington, D.C. Frølund, B., Palmgren, R., Keiding, K., and Nielsen, P.H. (1996) Extraction of Extracellular
Polymers from Activated Sludge Using a Cation Exchange Resin. Water Res., 30, 1749. Hartree, E.F. (1972) Determination of Protein: A Modification of the Lowry Method That
Gives a Linear Photometric Response. Anal. Biochem., 48, 422. Lomans, B.P., R. Luderer, P. Steenbakkers, A. Pol, C. Van Der Drift, G.D. Vogels, and J.J.M.
Op Den Camp (2001) Microbial Populations Involved in Cycling of Dimethyl Sulfide and Methanethiol in Freshwater Sediments. Applied and Env. Microbiol., 67, 1044-1051.
Lovley D.R. and Phillips E.J.P (1987) Competitive Mechanisms for Inhibition of Sulfate
Reduction and Methane Production in the Zone of Ferric Iron Reduction in Sediments. Applied and Environmental Microbiology, 1987, p. 2636-2641.
Lowry, O.H., Rosebrough, N.J., Farr, A.L., and Randall, R.J. (1951) Protein Measurement with
the Folin Phenol Reagent. J. Biol. Chem., 193, 265. Muller C.D., Nitin Verma, Matthew J. Higgins and John T. Novak. The role of shear in the
generation of nuisance odors from dewatered biosolids. WEFTEC 2004 Conference and Exhibition Proceedings, October, 2004, New Orleans, LA.
Nielsen, P.H., Frølund, B., and Keiding, K. (1996) Changes in the Composition of Extracellular
Polymeric Substances in Activated sludge during Anaerobic Storage. Appl. Microbiol. Biotechnol., 44, 823-830.
Novak, J., D. Glindemann, S.N. Murthy, S.C. Gerwin, C. Peot. Mechanisms for Generation and
Control of Trimethyl Amine and Dimethyl Disulfide from Lime Stablilized Biosolids. in WEF Odors and Toxic Air Emissions 2002 Conference. 2002. Albuquerque, NM: WEF.
1140
WEFTEC®.06
Copyright 2006 Water Environment Foundation. All Rights Reserved©

Novak, J.T., Sadler, M.E., and Murthy, S.N. (2003) Mechanisms of Floc Destruction During Anaerobic and Aerobic Digestion and The Effect on Conditioning and Dewatering of Biosolids. Water Res., 37, 3136 - 3144.
Park, C. Abu-Orf, M.M and Novak, J.T. Analysis of Floc Structure and Predicting Sludge
Digestibility Using Different Cation-Associated EPS Extraction Methods. WEFTEC 2004 Conference and Exhibition Proceedings, October, 2004, New Orleans, LA
U.S. Environmental Protection Agency (1996), Method 3050 Acid Digestion of Soils, Sediments, and Sludges. U.S. E.P.A., 2000.
U.S. Environmental Protection Agency (1993) Standards for the disposal of sewage sludge. Fed.
Regist., 58, 32, 40 CFR Part 503. Wilén, B.-M., Jin, B., and Lant, P. (2003) The Influence of Key Chemical Constituents in
Activated Sludge on Surface and Flocculating Properties. Water Res., 37, 2127-2139.
1141
WEFTEC®.06
Copyright 2006 Water Environment Foundation. All Rights Reserved©