effectiveness of pretensioners and load limiters for
TRANSCRIPT
DOT HS 811 835 November 2013
Effectiveness of Pretensioners And Load Limiters for Enhancing Fatality Reduction By Seat Belts
DISCLAIMER
This publication is distributed by the U.S. Department of Transportation, National Highway Traffic Safety Administration, in the interest of information exchange. The opinions, findings, and conclusions expressed in this publication are those of the authors and not necessarily those of the Department of Transportation or the National Highway Traffic Safety Administration. The United States Government assumes no liability for its contents or use thereof. If trade names, manufacturers’ names, or specific products are mentioned, it is because they are considered essential to the object of the publication and should not be construed as an endorsement. The United States Government does not endorse products or manufacturers.
Suggested APA Format Citation:
Kahane, C. J. (2013, November). Effectiveness of pretensioners and load limiters for enhancing fatality reduction by seat belts. (Report No. DOT HS 811 835). Washington, DC: National Highway Traffic Safety Administration.

i
Technical Report Documentation Page
1. Report No.
DOT HS 811 835 2. Government Accession No. 3. Recipient’s Catalog No.
4. Title and Subtitle
Effectiveness of Pretensioners and Load Limiters for Enhancing Fatality Reduction by Seat Belts
5. Report Date
November 2013 6. Performing Organization Code
7. Author(s)
Charles J. Kahane, Ph.D. 8. Performing Organization Report No.
9. Performing Organization Name and Address
Office of Vehicle Safety National Highway Traffic Safety Administration Washington, DC 20590
10. Work Unit No. (TRAIS)
11. Contract or Grant No.
12. Sponsoring Agency Name and Address
National Highway Traffic Safety Administration 1200 New Jersey Avenue SE. Washington, DC 20590
13. Type of Report and Period Covered
NHTSA Technical Report 14. Sponsoring Agency Code
15. Supplementary Notes 16. Abstract
Pretensioners and load limiters are technologies designed to make seat belts more effective. Pretensioners retract the seat belt to remove excess slack almost instantly upon sensing the vehicle has crashed. Load limiters allow the belt to “give” or yield when forces on the belt rise above a predetermined level. NHTSA has long encouraged -- but never required -- installation of these technologies in the front seats of vehicles. By model year 2008, all new cars and LTVs sold in the United States were equipped with pretensioners and load limiters at the driver’s and right-front passenger’s seats. Double-pair comparison analyses of FARS data for 1986 to 2011 compare the fatality-reducing effectiveness of seat belts with and without pretensioners and load limiters at those seats. In passenger cars, CUVs, and minivans, a belted driver or right-front passenger has an estimated 12.8 percent lower fatality risk if the belt is equipped with a pretensioner and a load limiter than if it is not equipped with either (95% confidence bounds: 2.6% to 23.0%). By contrast, the analyses of the currently available data do not yet show a significant effect for pretensioners and load limiters in truck-based LTVs (pickup trucks, SUVs with body-and-frame construction, and full-sized vans); it may be advisable to rerun the analyses in about 4 or 5 years when more data will be available.
17. Key Words
FARS, occupant protection, fatality reduction, outcome evaluation, effectiveness, crashworthiness, safety belt
18. Distribution Statement
Document is available to the public from the National Technical Information Service www.ntis.gov
19. Security Classif. (Of this report)
Unclassified 20. Security Classif. (Of this page)
Unclassified 21. No. of Pages
60 22. Price
Form DOT F 1700.7 (8-72) Reproduction of completed page authorized

ii
TABLE OF CONTENTS
List of abbreviations .................................................................................................................... iii
Executive summary ...................................................................................................................... iv
1. Description, history, and previous studies of pretensioners and load limiters..................... 1
2. Analysis method and database ............................................................................................. 4 2.1 Double-pair comparison.............................................................................................. 4 2.2 Significance testing with CATMOD ........................................................................ 11 3. Results ................................................................................................................................ 15
3.1 Effectiveness by vehicle type .................................................................................... 15 3.2 Estimating overall effectiveness while controlling for vehicle type ......................... 19 3.3 Car-CUV-minivan models produced with/without pretensioners/load limiters ....... 21 3.4 Truck-based LTVs: Estimating effectiveness while controlling for crash type ....... 24 3.5 Effectiveness by crash type ....................................................................................... 26 3.6 Effectiveness by occupant age groups ...................................................................... 31 3.7 Effectiveness by occupant’s gender .......................................................................... 32 3.8 Effectiveness by driver height groups ....................................................................... 34 3.9 Effectiveness by driver weight groups ...................................................................... 35 Appendix A: Pretensioners and load limiters at the front-outboard seat belts of cars and LTVs equipped with dual frontal air bags (no on-off switches), MY 1987 to 2011 .................. 37 Appendix B: MY 1996 to 2011 SUVs considered CUVs in this report ..................................... 51
iii
LIST OF ABBREVIATIONS CDS Crashworthiness Data System of NASS
CUV crossover utility vehicle
CY calendar year
df degrees of freedom
DOT United States Department of Transportation
ESC electronic stability control
FARS Fatality Analysis Reporting System, a census of fatal crashes in the United States since 1975
HIC Head Injury Criterion
IIHS Insurance Institute for Highway Safety
LTV light trucks and vans, includes pickup trucks, SUVs, minivans, and full-size vans
MY model year
NASS National Automotive Sampling System, a probability sample of police-reported crashes in the United States since 1979, investigated in detail
NCAP New Car Assessment Program: Ratings of new vehicles since 1979 based on performance in frontal impact tests
NHTSA National Highway Traffic Safety Administration
RF right-front seat
SAS statistical and database management software produced by SAS Institute, Inc.
SUV sport utility vehicle
UEF universal exaggeration factor for belt effectiveness estimates after buckle-up laws
VIN Vehicle Identification Number
iv
EXECUTIVE SUMMARY
Pretensioners and load limiters are technologies designed to make seat belts more effective. Pretensioners retract the seat belt to remove excess slack almost instantly upon sensing the vehicle has crashed, typically by firing a pyrotechnic device. When forces on the shoulder belt rise above a predetermined level, load limiters allow the belt to give or yield while controlling the tension in the belt, typically by spooling it out of the retractor, to avoid concentrating too much force on the occupant’s chest. NHTSA has never required installation of these technologies, but encouraged it by listing the makes and models of vehicles that offer them in its Buying a Safer Car brochures from 1997 to 2004 and, subsequently, on the Internet at www.safercar.gov. Furthermore, NHTSA’s NCAP tests demonstrated that pretensioners and load limiters improve belt performance. While pretensioners were offered on some cars as early as 1981 and load limiters in 1995, a move to industry-wide application began around 1998. By model year 2008, all new cars and LTVs sold in the United States were equipped with pretensioners and load limiters at the driver’s and right-front passenger’s seats.
NHTSA’s Fatality Analysis Reporting System for 1986 to 2011 now has enough crash data to evaluate whether pretensioners and load limiters enhance the fatality-reducing effectiveness of seat belts for drivers and right-front passengers. This report presents double-pair comparison analyses, the agency’s preferred method for estimating belt effectiveness, of 16,642 FARS cases of vehicles equipped with both technologies and 27,389 comparison vehicles equipped with dual frontal air bags, but neither pretensioners nor load limiters.
The analyses show that the combination of pretensioners and load limiters (and perhaps other belt or belt-related improvements introduced at about the same time) has significantly enhanced belt effectiveness in passenger cars, CUVs and minivans. A belted driver or right-front passenger has an estimated 12.8 percent lower fatality risk if the belt is equipped with a pretensioner and a load limiter than if it is not equipped with either (95% confidence bounds: 2.6% to 23.0%). In other words, the analyses typically show a fatality-reducing effectiveness of belts about 5 to 7 percentage points higher with pretensioners and load limiters than without them. By contrast, the analyses of the currently available data do not yet show a significant effect for pretensioners and load limiters in truck-based LTVs (pickup trucks, SUVs with body-and-frame construction, and full-sized vans). Although there is enough data for statistically significant results for cars, CUVs, and minivans, the relatively wide confidence bounds demonstrate that effectiveness of pretensioners and load limiters cannot yet be estimated precisely; it may be advisable to rerun the analyses in about 4 or 5 years when more data will be available.
Pretensioners and load limiters are effective in frontal impacts of cars, CUVs, and minivans, but it is also possible that they have some benefits in side impacts and rollovers. Researchers have expressed concern that load limiters might allow excessive occupant motion in oblique-frontal or front-corner impacts, but in the FARS analyses, the combination of pretensioners and load limiters was clearly beneficial in those crashes. It might be surmised that load limiters would especially benefit older occupants (who are more vulnerable to high belt loads), but not tall or heavy occupants (who might spool out the belt too far and contact interior components); the analysis results lean slightly, but not yet convincingly, in those directions. The analyses show the technologies are about equally effective for male and female occupants.
1
1. Description, history, and previous studies of pretensioners and load limiters Seat belt pretensioners retract the safety belt almost instantly in a crash to remove excess slack. Load limiters control the tension in the seat belts, allowing them to yield in a crash, preventing the shoulder belt from exerting too much force on the chest of an occupant.
In a crash, a seat belt needs to firmly engage the occupant's pelvis, clavicle, and rib cage to restrict occupant motion within the vehicle such that injurious contacts with other interior components are minimized. This process needs to occur early in the crash in order to couple the occupant to the decelerating vehicle and provide the most controlled ride-down. Any slack in the seat belt works against this process. Seat belt pretensioners are used to eliminate small amounts of slack in the lap and/or torso portion of the belt almost immediately when a crash occurs. Mercedes-Benz introduced pretensioners in the front seats of their S-class cars in 1981. Pretensioners are typically pyrotechnic devices but some are electro-mechanical. They are triggered by the same crash sensors that are used to determine the need to deploy the vehicle's air bags. In minor collisions, the seat belt pretensioners may be fired without the air bags being deployed. In more serious crashes, both the pretensioners and the air bags will be deployed.
Where pretensioning is applied to the lap belt, the pyrotechnic device usually forms part of the buckle assembly. A steel cable links the seat belt's buckle to a piston that can move along a steel tube. When the pyrotechnic charge is ignited, gas is produced very rapidly and this propels the piston down the tube. The steel cable attached to the piston pulls down on the seat belt buckle and eliminates any slack in the belt system. Shoulder belt pretensioners generally feature a turbine device connected to the seat belt retractor spool. The gas generated by the pyrotechnic charge drives the turbine so as to rewind the retractor, thus removing slack in the seat belt. Some vehicles employ a pretensioner at the outboard anchor location.
A load limiter is designed to allow the seat belt force applied to the chest to rise to a pre-determined point where the injury risk is still relatively low. The seat belt is then allowed to spool out of the retractor in a controlled manner, maintaining a constant restraining force as it absorbs energy. In a severe impact where the extension of the belt could be substantial, a frontal, side, or curtain air bag would in many cases work in conjunction with the belt and arrest the occupant's motion before it results in potentially injurious contact with the vehicle interior. Volvo introduced load limiters on its 850 series in 1995.1
A simple form of load limiter is a fold sewn into the seat belt webbing. The stitching holding the fold in place is designed to pull apart when a certain amount of force is applied to the belt. If this force is exceeded, the stitches are ripped out. The webbing unfolds, allowing the occupant greater forward motion. A mechanical device that uses the same principle takes the form of a "ladder" with a set of open, metal teeth. The seat belt retractor is held in place at the bottom end of the ladder and its motion restricted by the presence of the teeth. As the seat belt force increases, the teeth begin to deform, allowing the seat belt anchor to move along the length of the ladder device. An alternative type of load limiter uses a torsion bar built into the seat belt
1 Brumbelow, M. L., Baker, B. C., & Nolan, J. M. (2007). Effects of Seat Belt Load Limiters on Driver Fatalities in Frontal Crashes of Passenger Cars,. Proceedings, 20th International Technical Conference on the Enhanced Safety of Vehicles. Washington, DC: National Highway Traffic Safety Administration. Available at www-nrd.nhtsa.dot.gov/pdf/esv/esv20/07-0067-W.pdf.

2
retractor. The torsion bar is a metal rod that will twist when sufficient torque is applied. In minor collisions, the torsion bar will hold its shape, and the seat belt retractor will lock normally. But, when the force applied by the webbing reaches the design limit, the torsion bar twists and allows the webbing to spool out of the retractor.2
NHTSA has not mandated pretensioners or load limiters for seat belts in vehicles, but has long encouraged their installation. The agency began publishing Buying a Safer Car brochures in 1996. From 1997 to 2004, these annual brochures described pretensioners and load limiters as “additional features that improve seat belt performance” [emphasis added] and have listed what new cars and LTVs offer them as standard or optional equipment; subsequently, information was available on the Internet at http://www.safercar.gov/.3
Furthermore, the agency may have indirectly encouraged their installation through its frontal New Car Assessment Program test, a 35 mph impact into a rigid barrier with belted dummies. It soon became apparent that vehicles could improve their test results by adding pretensioners and load limiters to their belt systems. In 2003, NHTSA published a statistical analysis tracking the improvements in NCAP results for various makes and models over the preceding five model years. In the models that added pretensioners and load limiters, the Head Injury Criterion was reduced (i.e., improved) by an average of 232 units, chest acceleration by 6.6 g's, and chest deflection by 10.6 mm, for drivers and right front passengers. Each of these reductions was statistically significant. This is a promising indication that pretensioners and load limiters make belts more effective in at least one type of crash: collinear full frontal impacts. Moreover, the analysis attributed 154 units of the HIC reduction to pretensioners and 78 to load limiters; a reduction of 2.9 chest g's to pretensioners and 3.7 to load limiters; and a reduction of 5.6 mm chest deflection to pretensioners and 5.0 mm due to load limiters. In other words, both technologies are individually beneficial and their combination even more so.4
Appendix A of this report lists all makes and models of passenger cars and LTVs that have been equipped with dual frontal air bags, indicating the first MY when pretensioners were standard equipment at both front-outboard seats and the first MY for load limiters. LTVs include pickup trucks, SUVs, and vans.5 SUVs comprise truck-based SUVs, typically of body-on-frame construction and often sharing platforms with pickup trucks and CUVs, typically of unibody construction and often sharing platforms with passenger cars. Appendix B lists the make-models
2 Canadian Association of Road Safety Professionals, available at www.carsp.ca/hitech/hitech_pretensioners.htm and www.carsp.ca/hitech/hitech_load_limiters.htm. 3 Load limiters are called “energy management features” in the brochures. Buying a Safer Car, 1998 describes the features as follows: Seat belt pretensioner. Pretensioners retract the seat belt to remove excess slack almost instantly in a crash. Like air bags, pretensioners are usually “one-use” devices and need to be replaced after a crash. Pretensioners are not powerful enough to pull you back into your seat. For this reason, seat belts should be adjusted as snugly as possible. Energy management features. In very severe crashes, forces in the seat belt may rise above levels considered safe. If forces on the shoulder belt rise to a predetermined maximum level, some seat belts are designed to “give” or yield to avoid concentrating too much force on your chest. Energy management features can include load limiters built into the seat belt retractor and/or “tear stitching” in the webbing. 4 Walz, M. C. (2003). NCAP Test Improvements with Pretensioners and Load Limiters. (Report No. DOT HS 809 562). Washington, DC: National Highway Traffic Safety Administration Available at www-nrd.nhtsa.dot.gov/Pubs/809562.PDF 5 The analyses of this report include pickup trucks and vans exceeding 10,000 pounds GVWR if they are built on the 3500 chassis, but exclude any pickup trucks or vans built on a 4500 or larger chassis.
3
of SUVs that are considered CUVs in this report. Vans include minivans and full-sized vans.6 Although CUVs and minivans are classified as LTVs for regulatory purposes, they resemble passenger cars in some respects. Many of the analyses of this report consider passenger cars, CUVs, and minivans as one group of vehicles, as opposed to the other, truck-based LTVs (while other analyses compare cars versus all LTVs).
The introduction of pretensioners was spread over many years, although most models received them sometime between 1998 and 2006. Load limiters started later but entered the new-vehicle fleet quickly, mostly between 1997 and 2002. By MY 2002, approximately 63 percent of new cars and LTVs were already being equipped with pretensioners and 84 percent with load limiters.7 All new cars were equipped with pretensioners by MY 2006 and load limiters by MY 2007 at front-outboard seats. All new LTVs were equipped with pretensioners and load limiters by MY 2008 at the front-outboard positions. Before 2007, a moderate number of vehicles were equipped with load limiters but not pretensioners or vice-versa. No such vehicles were produced in MY 2007 or later (and all vehicles of MY 2008 or later were equipped with both). As stated above, these installations were always voluntary on the part of the manufacturers; no regulation specifically required pretensioners or load limiters.
During the 1997-to-2006 timeframe when pretensioners and load limiters were introduced in most new vehicles, some makes and models also received other improvements to their belts, such as adjustable anchors or integrated belt systems, both of which help belts fit right for occupants of various sizes or who position the seat far back or forward. Buying a Safer Car also discussed these features and listed the makes and models equipped with them. Engineers also became more proficient at tuning belts’ performance to work in tandem with the air bag, tailoring the energy-absorption of the vehicle structure to optimize ride-down for a belted occupant, and redesigning vehicle seats to promote better belt-hip interaction during a crash.
In 2007, Brumbelow, Baker, and Nolan of the Insurance Institute for Highway Safety questioned the overall effectiveness of load limiters in frontal impacts with long crash pulses and high intrusion, such as some types of oblique-frontal or front-corner impacts, while acknowledging that load limiters mitigated belt-induced thoracic injury and were effective overall in impacts with severe crash pulses of short duration, such as full-width frontal impacts resembling the NCAP tests. The issue is that the spooling or stretching of the load limiter allows the occupant to move forward, resulting in especially large head excursions. When the occupant’s motion is directly forward, the deployed air bag is usually sufficient to arrest it without severe injury. But if oblique forces or vehicle rotation due to a corner impact diminish the occupant’s interaction with the air bag, head excursion could result in injurious contacts with the vehicle interior, especially if intrusion has reduced the available ride-down space. A statistical analysis of CY 1996 to 2003 FARS data by the IIHS authors suggested that load limiters had not reduced and were possibly increasing fatality rates per million vehicle registration years for belted occupants in frontal impacts.8
6 Full-sized vans include Dodge Ram Van, Sprinter, Ford Econoline, and GM Express/Savana; Astro and Safari, although somewhat smaller, are also included, as their designs are closer to full-sized vans than to minivans. 7 Ibid. 8 Brumbelow, Baker, & Nolan, (2007).
4
NHTSA announced in its evaluation plans of 1998, 2004, and 2008 that the agency would perform its own statistical analyses of FARS data to estimate the effects of pretensioners and load limiters on fatality risk.9 This evaluation has been a long time coming because, until now, there was not enough FARS data for statistically meaningful results based on double-pair comparison analysis, the agency’s preferred method for estimating belt effectiveness.
This evaluation will compare the fatality-reducing effectiveness of seat belts with and without pretensioners or load limiters in vehicles with dual frontal air bags and check if belts have become significantly more effective after installation of these technologies. The analyses will consider drivers and right-front passengers of several types of light vehicles: cars, truck-based LTVs, and CUVs/minivans. Given the issues raised by Brumbelow, Baker, and Nolan, the report will compare effects in different types of frontal crashes, to the extent they can be differentiated in FARS data and also, for that matter, in other types of crashes such as side impacts or rollovers. The report will also consider groups of occupants who might be especially vulnerable to injury from belt forces, such as older occupants or females, or who might experience substantial head excursion when load limiters spool out, such as tall or heavy drivers.
2. Analysis method and database 2.1 Double-pair comparison Since the mid-1980s, fatality-reducing effectiveness estimates for occupant protection requiring activation (namely, buckling up), such as seat belts or child safety seats, have usually been based on double-pair comparison analyses of FARS data.10 NHTSA started FARS, a census of the fatal traffic crashes in the United States, in 1975. Double-pair comparison is valuable because it allows the direct use of FARS data, which have a much higher N of fatalities than any other crash files. A second major advantage is that double-pair comparison implicitly “adjusts” or “controls” for the differences in the severity of crashes involving belted and unrestrained occupants. It separates belt effectiveness from other factors that influence fatality risk, such as an occupant’s age, the type and severity of the crash, or the overall crashworthiness of the vehicle.
9 NHTSA (1998). Evaluation Program Plan, 1998-2002. (Report No. DOT HS 808 709). Washington, DC: National Highway Traffic Safety Administration Available at www-nrd.nhtsa.dot.gov/Pubs/808709.PDF; NHTSA (2004). National Highway Traffic Safety Administration Evaluation Program Plan, Calendar Years 2004-2007. (Report No. DOT HS 809 699). Washington, DC: National Highway Traffic Safety Administration Available at www-nrd.nhtsa.dot.gov/Pubs/809699.PDF; NHTSA (2008). Evaluation Program Plan, 2008-2012. (Report No. DOT HS 810 983). Washington, DC: National Highway Traffic Safety Administration Available at www-nrd.nhtsa.dot.gov/Pubs/810983.PDF. 10 Partyka, S. C. (1984). Restraint Use and Fatality Risk for Infants and Toddlers. Washington, DC: National Highway Traffic Safety Administration; Evans, L. (1986a). Double Pair Comparison – A New Method to Determine How Occupant Characteristics Affect Fatality Risk in Traffic Crashes. Accident Analysis and Prevention, 18, pp. 217-227; Evans, L. (1986b). The Effectiveness of Safety Belts in Preventing Fatalities. Accident Analysis and Prevention, 18, pp. 229-241; Kahane, C. J. (1986). An Evaluation of Child Passenger Safety: The Effectiveness and Benefits of Safety Seats. (Report No. DOT HS 806 890, Chapter 4). Washington, DC: National Highway Traffic Safety Administration. Available at www-nrd.nhtsa.dot.gov/Pubs/806890.PDF ; Partyka, S. C. (1988). “Belt Effectiveness in Pickup Trucks and Passenger Cars by Crash Direction and Accident Year,” Papers on Adult Seat Belts – Effectiveness and Use. (Report No. DOT HS 807 285). Washington, DC: National Highway Traffic Safety Administration; Kahane, C. J. (2000). Fatality Reduction by Safety Belts for Front-Seat Occupants of Cars and Light Trucks: Updated and Expanded Estimates Based on 1986-99 FARS Data. (Report No. DOT HS 809 199).

5
In this analysis, the fatality-reducing effectiveness of seat belts for drivers and right front (RF) passengers of cars and LTVs equipped with pretensioners and load-limiters at those seats will be compared to the effectiveness of belts in corresponding baseline vehicles not equipped with either technology. If possible, vehicles equipped with just one or the other technology may also be considered. The database needed to drive the analysis comprises FARS cases of vehicles occupied by a driver and a RF passenger (and perhaps other occupants), where at least one and possibly both the driver and the RF passenger were fatalities. Because almost all vehicles with pretensioners and load limiters are also equipped with dual frontal air bags, the analysis will be limited to vehicles with dual air bags. Specifically, the “corresponding baseline vehicles” are those with dual frontal air bags but without pretensioners or load limiters.
Dual frontal air bags that can be identified from the first 12 characters of the VIN began to appear in passenger cars in MY 1987 (Porsche 944) and in LTVs in 1994 (Chrysler Corp. minivans, Toyota Previa).11 FARS data for CY 1986 to 2011 includes 57,882 cases of vehicles with dual air bags, occupied by a driver and a RF passenger, at least one or possibly both fatalities, also meeting the following conditions:
• The make, model, and MY must be decodable from the first 12 characters of the VIN, using the VIN-decode programs developed by NHTSA’s Evaluation Division;
• The driver’s and RF passenger’s age and gender are known in FARS and both of these occupants must be at least 13 years old;
• Cases with unknown belt use for the driver, RF passenger or both are excluded. The driver’s and RF passenger’s restraint-use code, REST_USE has to be 0 (in CY 1986 to 2009 only), 1, 2, 3, 7 (in CY 2010 or 2011 only), 8, or 13; 0 or 7 mean unbelted, the other codes mean belted;
• The study excludes those pickup trucks and other vehicles without a back seat that are equipped with a manual on-off switch for the passenger air bag (because an impact might deploy only the driver air bag if the passenger bag is switched off); and
• The belts must be the manual 3-point type; vehicles with automatic 2-point belts and dual air bags are excluded.
Appendix A lists the makes and models of cars and LTVs with dual air bags, indicating the MY when pretensioners first became standard equipment for the driver and RF passenger seats and the MY when load limiters became standard equipment. The primary source of information on pretensioners and load limiters is material compiled at www.safercar.gov from data furnished to NHTSA by the manufacturers. Information was also gleaned from www.cars.com, www.motortrend.com, and the Walz and Brumbelow reports.12 The determinations in Appendix A are judgments of the most likely status of the vehicles, based on the various sources and taking into account the findings for similar vehicles; the status of pretensioners and/or load limiters was marked unknown if the information was inconsistent or ambiguous. The 57,882 vehicle cases have the following distribution of pretensioners and load limiters:
Washington, DC: National Highway Traffic Safety Administration. Available at www-nrd.nhtsa.dot.gov/Pubs/809199.PDF. 11 There are earlier cars with dual frontal air bags, but the 1987 Porsche were the first ones that could be identified from the first 12 characters of the VIN. 12 Walz (2003); Brumbelow et al. (2007).

6
27,389 No pretensioners or load limiters at the driver and RF passenger seats, 1,705 Pretensioners at both seats but no load limiters at either seat, 11,040 Load limiters at both seats but no pretensioners, 16,642 Pretensioners and load limiters at both seats, and 1,106 Cases that cannot be used because pretensioner and/or load-limiter
availability is unknown for one or both seats, or because availability is different for the driver and passenger seats
The analysis will focus on the two conditions with the most data: no pretensioners or load limiters versus both. There are also enough cases with load limiters but not pretensioners to pursue at least a preliminary analysis – but not enough with pretensioners in the absence of load limiters.
Here are examples of the analysis techniques of this report, applied to the full database of 57,882 FARS cases of crash-involved vehicles occupied by a driver and an RF passenger, at least one of them a fatality, in cars and LTVs with dual frontal air bags. Actually, NHTSA has estimated effectiveness separately for cars and LTVs in the past and will do so again in this report, but in these initial examples cars and LTVs are combined for relative simplicity and to maximize the database.
This is how double-pair comparison estimates the overall fatality reduction by seat belts for drivers and RF passengers in the subset of 27,389 vehicles without pretensioners or load limiters. Table 1 counts the 27,389 vehicle cases, based on each occupant’s belt use (as reported in FARS) and survival:
Table 1: Vehicles by Front-Outboard Belt Use and Survival Status (Cars and LTVs with dual air bags, with a driver and an RF passenger,
at least one a fatality, FARS 1986 to 2011)
Vehicles Driver Died Driver Survived Both RF Survived RF Died Died Both unrestrained 3,539 3,317 1,810 Driver unrestrained, RF belted 1,972 428 377 Driver belted, RF unrestrained 482 2,133 419 Both belted 5,186 5,585 2,141
Table 2 tallies fatality counts rather than vehicle cases by adding the “both died” column to each of the preceding columns. There are 32,136 fatalities (15,926 drivers and 16,210 RF passengers) in the 27,389 vehicles, classified as follows:

7
Table 2: Fatalities by Belt Use and Seat Position (Cars and LTVs with dual air bags, with a driver and RF passenger, FARS 1986 to 2011)
Fatalities Driver RF Driver/RF Fatalities Fatalities Risk Ratio Both unrestrained 5,349 5,127 1.043 Driver unrestrained, RF belted 2,349 805 2.918 Driver belted, RF unrestrained 901 2,552 0.353 Both belted 7,327 7,726 0.948
In these vehicles with dual air bags, it is clear that (1) unrestrained drivers and RF passengers are at approximately equal risk in the same crash; (2) belted drivers and RF passengers are also at approximately equal risk; and (3) whoever buckled up substantially reduced their risk.
The four rows of data in Table 2 allow a total of four double-pair comparisons, two for computing the effectiveness of belts for drivers, and two for RF passengers. The first comparison for the driver is based on the first and third rows of data in Table 2:
Driver RF Driver/RF Fatalities Fatalities Risk Ratio Driver unrestrained RF unrestrained 5,349 5,127 1.043 Driver belted RF unrestrained 901 2,552 0.353
In both pairs, the driver’s fatality risk is compared to the same control group: the unrestrained RF passenger. The unrestrained driver has essentially the same fatality risk as the unrestrained RF passenger in the same crash; the belted driver has about one-third the fatality risk as the unrestrained RF passenger (if FARS reporting of belt use is accepted at face value). The observed fatality reduction for belts is
1 - (0.353/1.043) = 66.2 percent.
The other comparison for the driver is based on the second and fourth rows of data in Table 2:
Driver RF Driver/RF Fatalities Fatalities Risk Ratio Driver unrestrained RF belted 2,349 805 2.918 Driver belted RF belted 7,327 7,726 0.948

8
Here, the control group is the belted RF passenger. The unrestrained driver has higher fatality risk than the belted RF passenger in the same crash, the belted driver, lower. The fatality reduction is:
1 - (0.948/2.918) = 67.5 percent.
It is important that the effectiveness estimates are quite similar with the two control groups: it suggests the estimates are robust and not affected by the choice of control group.
The first double-pair comparison for estimating belt effectiveness for the RF passenger is obtained by using the first two rows of data in Table 2, reversing the order of the columns and computing the RF/Driver rather than the Driver/RF risk ratio:
RF Driver RF/Driver Fatalities Fatalities Risk Ratio RF unrestrained Driver unrestrained 5,127 5,349 0.958 RF belted Driver unrestrained 805 2,349 0.343 The control group is the unrestrained driver. The fatality reduction for the belted RF passenger is:
1 - (0.343/0.958) = 64.2 percent.
The second estimate uses the last two rows of data in Table 2:
RF Driver RF/Driver Fatalities Fatalities Risk Ratio RF unrestrained Driver belted 2,552 901 2.832 RF belted Driver belted 7,726 7,327 1.054 The control group is the belted driver. The fatality reduction for the belted RF passenger is:
1 - (1.054/2.832) = 62.8 percent.
Again, the two control groups produce similar estimates. Also, as in earlier studies, belt effectiveness is slightly lower for the RF passenger than for the driver.
The next task is to develop a weighting procedure that combines the two driver estimates into a single number, and likewise for the two RF passenger estimates. In Table 2, the actual number of driver fatalities is:
Actual driver fatalities = 5,349 + 2,349 + 901 + 7,327 = 15,926

9
The first two numbers in that sum are unrestrained drivers, the last two, belted. However, if every driver had been unrestrained, that sum would have increased to:
All-unrestrained driver fatalities = 5,349 + 2,349 + (1.043 x 2,552) + (2.918 x 7,726) = 32,904
(Here, 2,552 was the number of unrestrained RF passenger fatalities that accompanied the 901 belted drivers and 1.043 is the risk ratio of unrestrained driver to unrestrained RF passenger fatalities; 7,726 is the number of belted RF passenger fatalities that accompanied the 7,327 belted drivers and 2.918 is the risk ratio of unrestrained drivers to belted RF passenger fatalities.) On the other hand, if every driver had buckled up, the sum would have dropped to:
All-belted driver fatalities = (0.353 x 5,127) + (0.948 x 805) + 901 + 7,327 = 10,801.
The overall effectiveness of 3-point belts for drivers (if FARS reporting of belt use is accepted at face value) is:
(32,904 – 10,801) / 32,904 = 67.2 percent,
which is between the results of the two separate double-pair comparisons for drivers (66.2 and 67.5 percent).
Similarly, the actual number of RF passenger fatalities in Table 2is
Actual RF fatalities = 5,127 + 805 + 2,552 + 7,726 = 16,210
If every RF passenger had been unrestrained, that sum would have increased to
All-unrestrained RF fatalities = 5,127 + (0.958 x 2,349) + 2,552 + (2.832 x 7,327) = 30,679
(Here, 2,349 was the number of unrestrained driver fatalities that accompanied the 805 belted RF passengers and 0.958 is the risk ratio of unrestrained RF to unrestrained driver fatalities; 7,327 is the number of belted driver fatalities that accompanied the 7,726 belted RF and 2.832 is the risk ratio of unrestrained RF to belted driver fatalities.)
But if every RF passenger had buckled up, the sum would have dropped to
All-belted RF fatalities = (0.343 x 5,349) + 805 + (1.054 x 901) + 7,726 = 11,315
The overall effectiveness of belts for RF passengers (if FARS reporting of belt use is accepted at face value) is
(30,679 - 11,315) / 30,679 = 63.1 percent,
which is between the results of the two separate double-pair comparisons for RF passengers (64.2 and 62.8 percent).
FARS data from CY 1986 and later adds a complication when it is used for double-pair comparison analyses of belt effectiveness for drivers and RF passengers with the reported belt use taken at face value. The observed effectiveness of belts is higher than in analyses of earlier
10
calendar years of FARS data, even for vehicles of the same model years. During the mid-1980s, large numbers of States began to pass buckle-up laws for drivers and RF passengers.
“Specifically, New York was the first [S]tate to enact a belt use law, effective December 1, 1984. After a brief ‘wait and see,’ 21 [S]tates, including 9 of the 10 most populous [S]tates had belt laws effective by August 1986 for front-seat occupants of passenger cars. For the first time, unbelted people had a tangible incentive - avoidance of a fine - to report that they were belted. NHTSA hypothesized that uninjured or slightly injured occupants are often up and about before police arrive at the crash scene. Since the investigating officer is not an eye-witness to their belt use, they have an opportunity – and now also a motive – to say they wore belts, even if they hadn’t. Mortally injured occupants may be in their original post-crash location when police arrive, often allowing direct observation of belt use. Thus, NHTSA believes belt use of fatalities is reported without net biases on FARS before and after belt laws. However, after the laws, belt use of survivors is over-reported. A bias has apparently been introduced in the reporting of this one data element, for survivors, as a consequence of belt use laws.”13
NHTSA empirically derived a universal exaggeration factor to adjust estimates based on FARS data after 1985 and make them comparable to estimates from earlier data.14 The UEF is 1.369 and it is applied as follows to the observed effectiveness (percentage fatality reduction) E* to estimate the actual effectiveness E:
E = 100 - [1.369 x (100 - E*)]
For example, if the observed effectiveness is 60 percent, the actual effectiveness is 45.24 percent. The analyses of this report are based entirely on FARS data from CY 1986 and later. Every point estimate based directly on FARS data needs to be corrected downward with the UEF. Tables of point estimates will indicate if they have been corrected or are based on the actual FARS data.
Table 3 compares belt effectiveness with and without pretensioners and/or load limiters, for the complete database of all cars and LTVs equipped with dual air bags, showing both the uncorrected and the corrected estimates. The uncorrected estimates for vehicles without pretensioners or load limiters were derived above. Corresponding estimates for vehicles equipped with pretensioners and/or load limiters are derived by the same techniques. The few cases (1,705) with pretensioners but no load limiters are excluded from the analysis and so are the 1,106 cases with unknowns or where the driver and RF seat belts are differently equipped.
13 Kahane (2000), pp. 2-3. 14 Ibid., pp. 10-19.
11
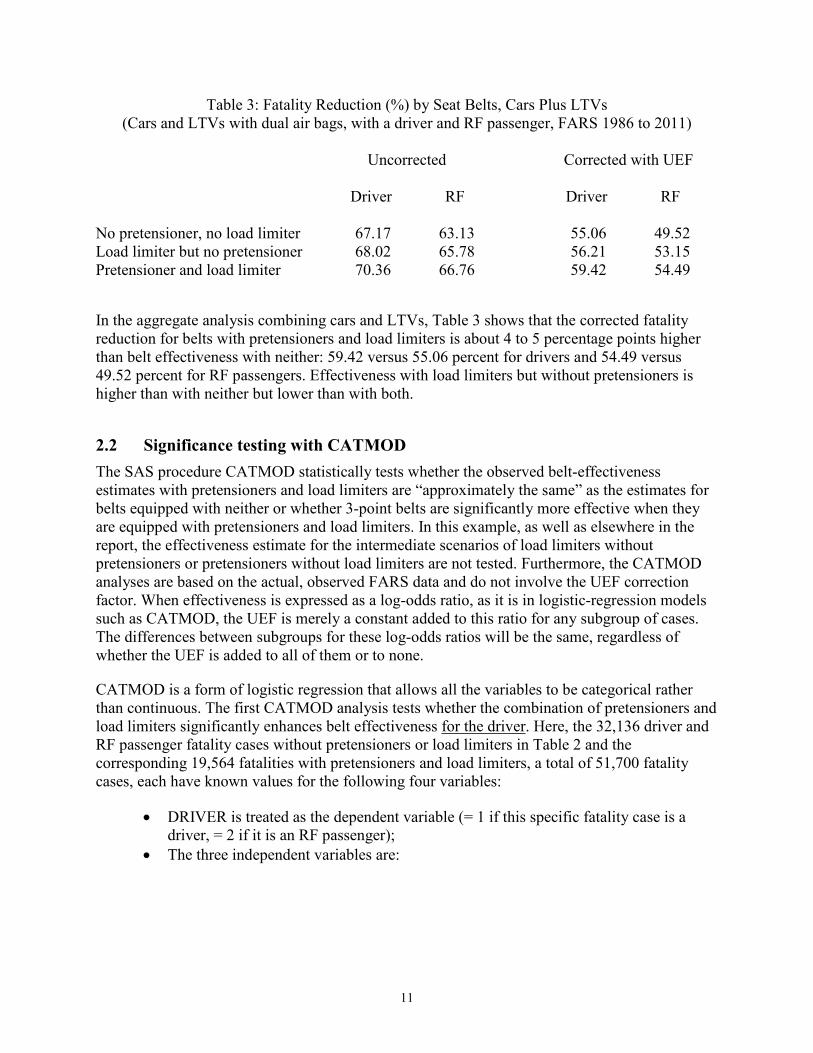
Table 3: Fatality Reduction (%) by Seat Belts, Cars Plus LTVs (Cars and LTVs with dual air bags, with a driver and RF passenger, FARS 1986 to 2011)
Uncorrected Corrected with UEF Driver RF Driver RF No pretensioner, no load limiter 67.17 63.13 55.06 49.52 Load limiter but no pretensioner 68.02 65.78 56.21 53.15 Pretensioner and load limiter 70.36 66.76 59.42 54.49
In the aggregate analysis combining cars and LTVs, Table 3 shows that the corrected fatality reduction for belts with pretensioners and load limiters is about 4 to 5 percentage points higher than belt effectiveness with neither: 59.42 versus 55.06 percent for drivers and 54.49 versus 49.52 percent for RF passengers. Effectiveness with load limiters but without pretensioners is higher than with neither but lower than with both.
2.2 Significance testing with CATMOD The SAS procedure CATMOD statistically tests whether the observed belt-effectiveness estimates with pretensioners and load limiters are “approximately the same” as the estimates for belts equipped with neither or whether 3-point belts are significantly more effective when they are equipped with pretensioners and load limiters. In this example, as well as elsewhere in the report, the effectiveness estimate for the intermediate scenarios of load limiters without pretensioners or pretensioners without load limiters are not tested. Furthermore, the CATMOD analyses are based on the actual, observed FARS data and do not involve the UEF correction factor. When effectiveness is expressed as a log-odds ratio, as it is in logistic-regression models such as CATMOD, the UEF is merely a constant added to this ratio for any subgroup of cases. The differences between subgroups for these log-odds ratios will be the same, regardless of whether the UEF is added to all of them or to none.
CATMOD is a form of logistic regression that allows all the variables to be categorical rather than continuous. The first CATMOD analysis tests whether the combination of pretensioners and load limiters significantly enhances belt effectiveness for the driver. Here, the 32,136 driver and RF passenger fatality cases without pretensioners or load limiters in Table 2 and the corresponding 19,564 fatalities with pretensioners and load limiters, a total of 51,700 fatality cases, each have known values for the following four variables:
• DRIVER is treated as the dependent variable (= 1 if this specific fatality case is a driver, = 2 if it is an RF passenger);
• The three independent variables are:
12
o BELT115 (= 1 if the driver of the vehicle in which the fatality occurred is belted, = 2 if unrestrained);
o BELT3 (= 1 if the RF passenger of the vehicle in which the fatality occurred is belted, = 2 if unrestrained); and
o PRETENLL (= 1 if the vehicle in which the fatality occurred is equipped with pretensioners and load limiters at the driver and RF seats, = 2 if not equipped with either).
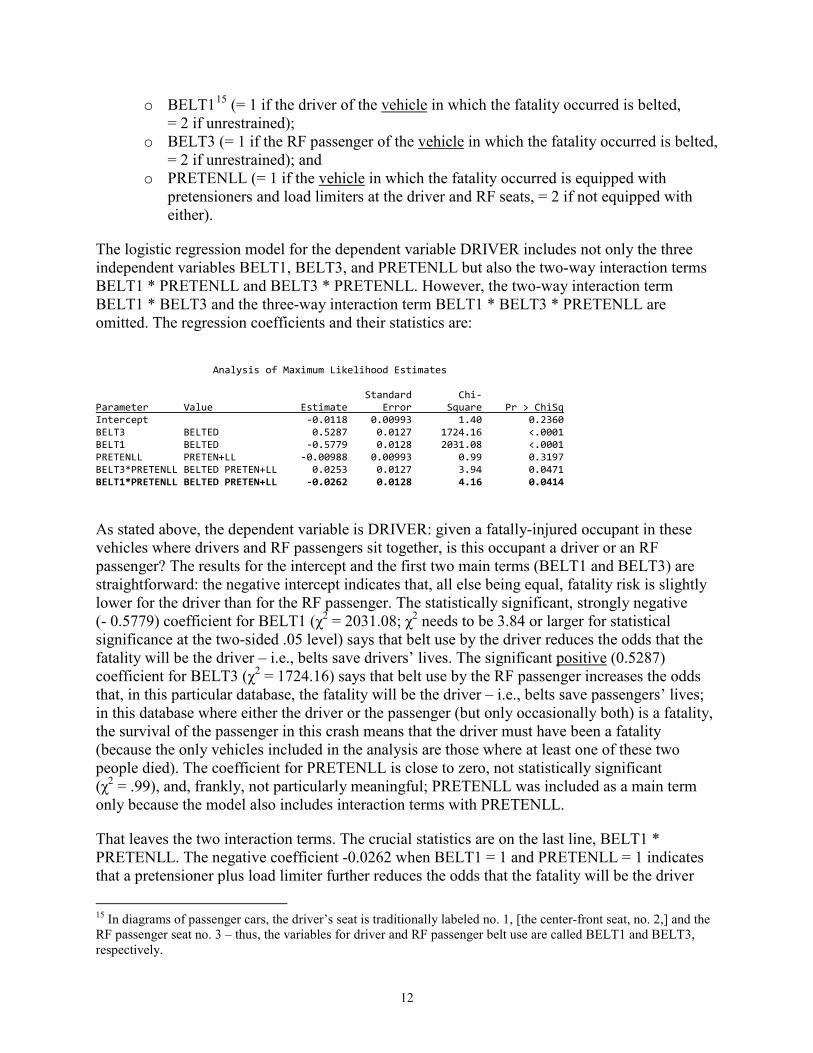
The logistic regression model for the dependent variable DRIVER includes not only the three independent variables BELT1, BELT3, and PRETENLL but also the two-way interaction terms BELT1 * PRETENLL and BELT3 * PRETENLL. However, the two-way interaction term BELT1 * BELT3 and the three-way interaction term BELT1 * BELT3 * PRETENLL are omitted. The regression coefficients and their statistics are:
Analysis of Maximum Likelihood Estimates Standard Chi- Parameter Value Estimate Error Square Pr > ChiSq Intercept -0.0118 0.00993 1.40 0.2360 BELT3 BELTED 0.5287 0.0127 1724.16 <.0001 BELT1 BELTED -0.5779 0.0128 2031.08 <.0001 PRETENLL PRETEN+LL -0.00988 0.00993 0.99 0.3197 BELT3*PRETENLL BELTED PRETEN+LL 0.0253 0.0127 3.94 0.0471 BELT1*PRETENLL BELTED PRETEN+LL -0.0262 0.0128 4.16 0.0414
As stated above, the dependent variable is DRIVER: given a fatally-injured occupant in these vehicles where drivers and RF passengers sit together, is this occupant a driver or an RF passenger? The results for the intercept and the first two main terms (BELT1 and BELT3) are straightforward: the negative intercept indicates that, all else being equal, fatality risk is slightly lower for the driver than for the RF passenger. The statistically significant, strongly negative (- 0.5779) coefficient for BELT1 (χ2 = 2031.08; χ2 needs to be 3.84 or larger for statistical significance at the two-sided .05 level) says that belt use by the driver reduces the odds that the fatality will be the driver – i.e., belts save drivers’ lives. The significant positive (0.5287) coefficient for BELT3 (χ2 = 1724.16) says that belt use by the RF passenger increases the odds that, in this particular database, the fatality will be the driver – i.e., belts save passengers’ lives; in this database where either the driver or the passenger (but only occasionally both) is a fatality, the survival of the passenger in this crash means that the driver must have been a fatality (because the only vehicles included in the analysis are those where at least one of these two people died). The coefficient for PRETENLL is close to zero, not statistically significant (χ2 = .99), and, frankly, not particularly meaningful; PRETENLL was included as a main term only because the model also includes interaction terms with PRETENLL.
That leaves the two interaction terms. The crucial statistics are on the last line, BELT1 * PRETENLL. The negative coefficient -0.0262 when BELT1 = 1 and PRETENLL = 1 indicates that a pretensioner plus load limiter further reduces the odds that the fatality will be the driver
15 In diagrams of passenger cars, the driver’s seat is traditionally labeled no. 1, [the center-front seat, no. 2,] and the RF passenger seat no. 3 – thus, the variables for driver and RF passenger belt use are called BELT1 and BELT3, respectively.
13
when the belt is in use, but of course has no effect when the belt is not in use. With a chi-square of 4.16, the effect is statistically significant. In other words, pretensioners and load limiters make belts more effective for the driver. BELT3 * PRETENLL has a statistically significant positive coefficient (0.0253, χ2 = 3.94). Because pretensioners and load limiters make belts more effective for the RF passenger, the better chance of survival for the passenger implies a higher fatality risk for the driver in this database, where at least one of the two occupants is a fatality.
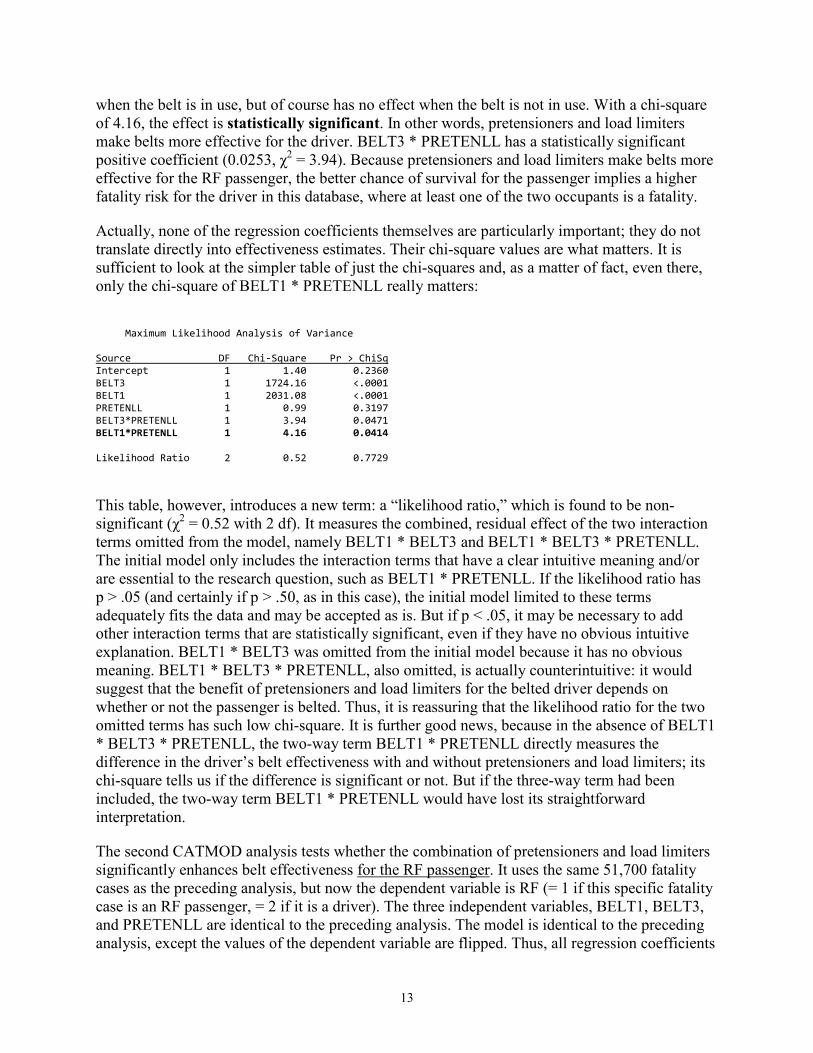
Actually, none of the regression coefficients themselves are particularly important; they do not translate directly into effectiveness estimates. Their chi-square values are what matters. It is sufficient to look at the simpler table of just the chi-squares and, as a matter of fact, even there, only the chi-square of BELT1 * PRETENLL really matters:
Maximum Likelihood Analysis of Variance Source DF Chi-Square Pr > ChiSq Intercept 1 1.40 0.2360 BELT3 1 1724.16 <.0001 BELT1 1 2031.08 <.0001 PRETENLL 1 0.99 0.3197 BELT3*PRETENLL 1 3.94 0.0471 BELT1*PRETENLL 1 4.16 0.0414 Likelihood Ratio 2 0.52 0.7729
This table, however, introduces a new term: a “likelihood ratio,” which is found to be non-significant (χ2 = 0.52 with 2 df). It measures the combined, residual effect of the two interaction terms omitted from the model, namely BELT1 * BELT3 and BELT1 * BELT3 * PRETENLL. The initial model only includes the interaction terms that have a clear intuitive meaning and/or are essential to the research question, such as BELT1 * PRETENLL. If the likelihood ratio has p > .05 (and certainly if p > .50, as in this case), the initial model limited to these terms adequately fits the data and may be accepted as is. But if p < .05, it may be necessary to add other interaction terms that are statistically significant, even if they have no obvious intuitive explanation. BELT1 * BELT3 was omitted from the initial model because it has no obvious meaning. BELT1 * BELT3 * PRETENLL, also omitted, is actually counterintuitive: it would suggest that the benefit of pretensioners and load limiters for the belted driver depends on whether or not the passenger is belted. Thus, it is reassuring that the likelihood ratio for the two omitted terms has such low chi-square. It is further good news, because in the absence of BELT1 * BELT3 * PRETENLL, the two-way term BELT1 * PRETENLL directly measures the difference in the driver’s belt effectiveness with and without pretensioners and load limiters; its chi-square tells us if the difference is significant or not. But if the three-way term had been included, the two-way term BELT1 * PRETENLL would have lost its straightforward interpretation.
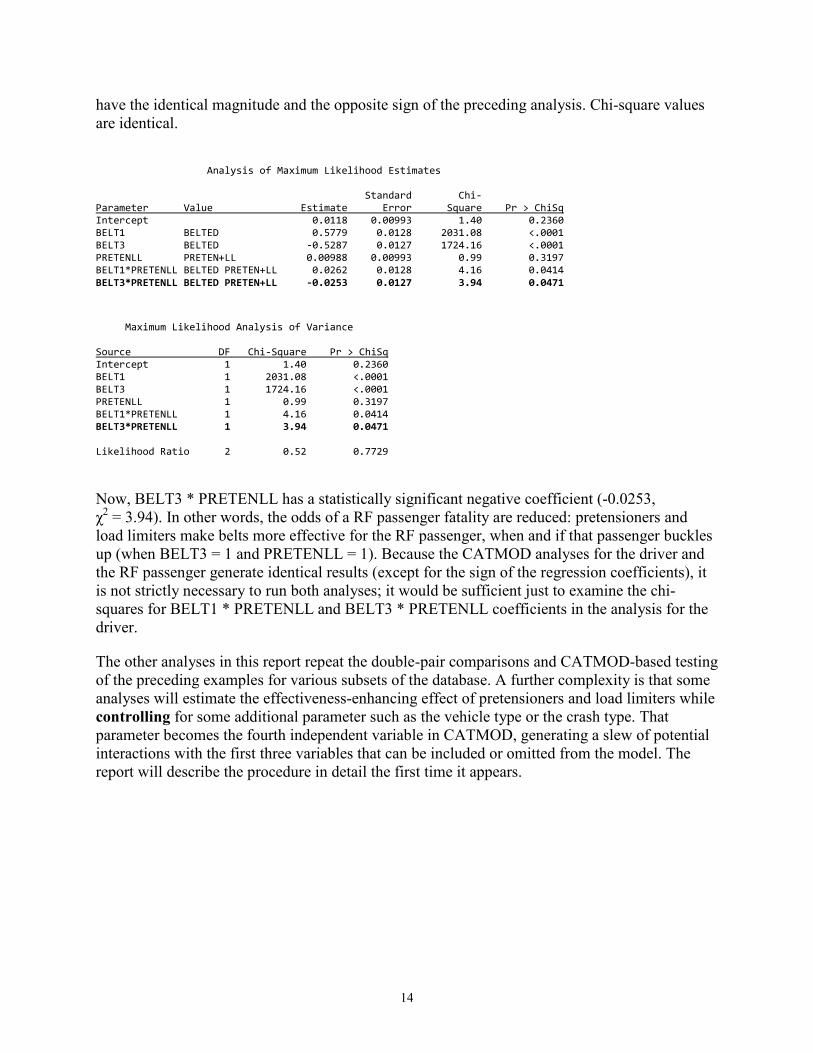
The second CATMOD analysis tests whether the combination of pretensioners and load limiters significantly enhances belt effectiveness for the RF passenger. It uses the same 51,700 fatality cases as the preceding analysis, but now the dependent variable is RF (= 1 if this specific fatality case is an RF passenger, = 2 if it is a driver). The three independent variables, BELT1, BELT3, and PRETENLL are identical to the preceding analysis. The model is identical to the preceding analysis, except the values of the dependent variable are flipped. Thus, all regression coefficients
14
have the identical magnitude and the opposite sign of the preceding analysis. Chi-square values are identical.
Analysis of Maximum Likelihood Estimates Standard Chi- Parameter Value Estimate Error Square Pr > ChiSq Intercept 0.0118 0.00993 1.40 0.2360 BELT1 BELTED 0.5779 0.0128 2031.08 <.0001 BELT3 BELTED -0.5287 0.0127 1724.16 <.0001 PRETENLL PRETEN+LL 0.00988 0.00993 0.99 0.3197 BELT1*PRETENLL BELTED PRETEN+LL 0.0262 0.0128 4.16 0.0414 BELT3*PRETENLL BELTED PRETEN+LL -0.0253 0.0127 3.94 0.0471
Maximum Likelihood Analysis of Variance Source DF Chi-Square Pr > ChiSq Intercept 1 1.40 0.2360 BELT1 1 2031.08 <.0001 BELT3 1 1724.16 <.0001 PRETENLL 1 0.99 0.3197 BELT1*PRETENLL 1 4.16 0.0414 BELT3*PRETENLL 1 3.94 0.0471 Likelihood Ratio 2 0.52 0.7729
Now, BELT3 * PRETENLL has a statistically significant negative coefficient (-0.0253, χ2 = 3.94). In other words, the odds of a RF passenger fatality are reduced: pretensioners and load limiters make belts more effective for the RF passenger, when and if that passenger buckles up (when BELT3 = 1 and PRETENLL = 1). Because the CATMOD analyses for the driver and the RF passenger generate identical results (except for the sign of the regression coefficients), it is not strictly necessary to run both analyses; it would be sufficient just to examine the chi-squares for BELT1 * PRETENLL and BELT3 * PRETENLL coefficients in the analysis for the driver.
The other analyses in this report repeat the double-pair comparisons and CATMOD-based testing of the preceding examples for various subsets of the database. A further complexity is that some analyses will estimate the effectiveness-enhancing effect of pretensioners and load limiters while controlling for some additional parameter such as the vehicle type or the crash type. That parameter becomes the fourth independent variable in CATMOD, generating a slew of potential interactions with the first three variables that can be included or omitted from the model. The report will describe the procedure in detail the first time it appears.
15
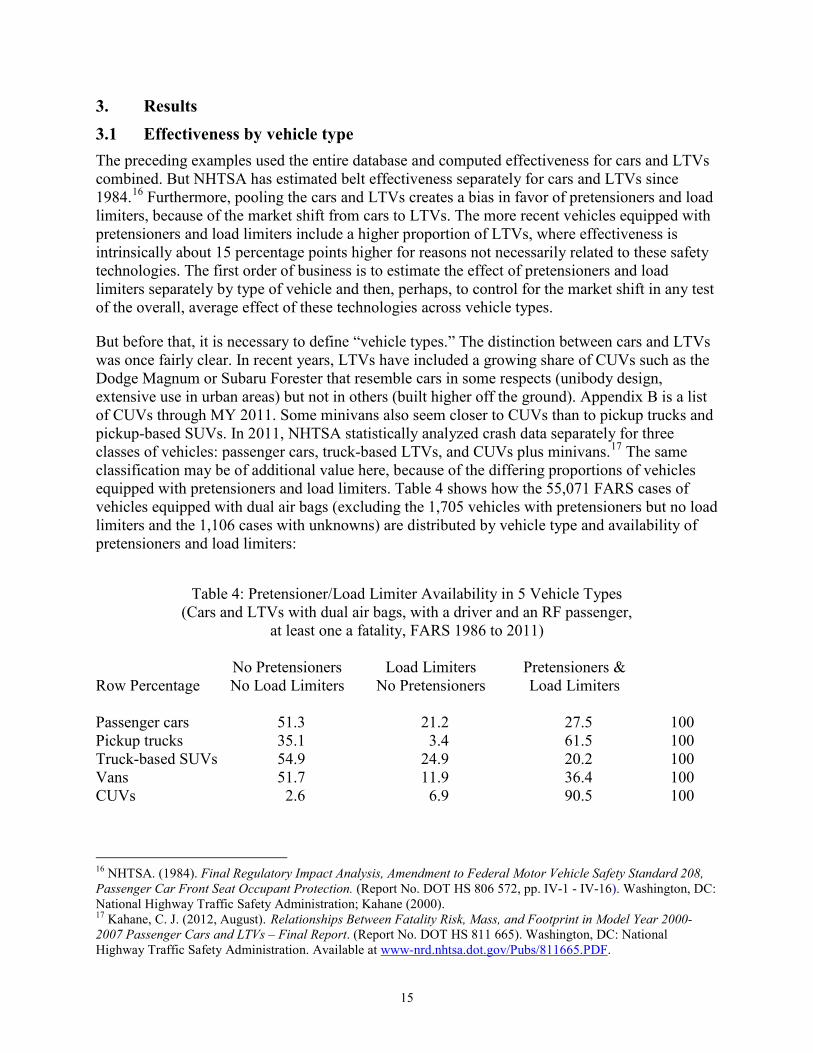
3. Results 3.1 Effectiveness by vehicle type The preceding examples used the entire database and computed effectiveness for cars and LTVs combined. But NHTSA has estimated belt effectiveness separately for cars and LTVs since 1984.16 Furthermore, pooling the cars and LTVs creates a bias in favor of pretensioners and load limiters, because of the market shift from cars to LTVs. The more recent vehicles equipped with pretensioners and load limiters include a higher proportion of LTVs, where effectiveness is intrinsically about 15 percentage points higher for reasons not necessarily related to these safety technologies. The first order of business is to estimate the effect of pretensioners and load limiters separately by type of vehicle and then, perhaps, to control for the market shift in any test of the overall, average effect of these technologies across vehicle types.
But before that, it is necessary to define “vehicle types.” The distinction between cars and LTVs was once fairly clear. In recent years, LTVs have included a growing share of CUVs such as the Dodge Magnum or Subaru Forester that resemble cars in some respects (unibody design, extensive use in urban areas) but not in others (built higher off the ground). Appendix B is a list of CUVs through MY 2011. Some minivans also seem closer to CUVs than to pickup trucks and pickup-based SUVs. In 2011, NHTSA statistically analyzed crash data separately for three classes of vehicles: passenger cars, truck-based LTVs, and CUVs plus minivans.17 The same classification may be of additional value here, because of the differing proportions of vehicles equipped with pretensioners and load limiters. Table 4 shows how the 55,071 FARS cases of vehicles equipped with dual air bags (excluding the 1,705 vehicles with pretensioners but no load limiters and the 1,106 cases with unknowns) are distributed by vehicle type and availability of pretensioners and load limiters:
Table 4: Pretensioner/Load Limiter Availability in 5 Vehicle Types (Cars and LTVs with dual air bags, with a driver and an RF passenger,
at least one a fatality, FARS 1986 to 2011)
No Pretensioners Load Limiters Pretensioners & Row Percentage No Load Limiters No Pretensioners Load Limiters Passenger cars 51.3 21.2 27.5 100 Pickup trucks 35.1 3.4 61.5 100 Truck-based SUVs 54.9 24.9 20.2 100 Vans 51.7 11.9 36.4 100 CUVs 2.6 6.9 90.5 100
16 NHTSA. (1984). Final Regulatory Impact Analysis, Amendment to Federal Motor Vehicle Safety Standard 208, Passenger Car Front Seat Occupant Protection. (Report No. DOT HS 806 572, pp. IV-1 - IV-16). Washington, DC: National Highway Traffic Safety Administration; Kahane (2000). 17 Kahane, C. J. (2012, August). Relationships Between Fatality Risk, Mass, and Footprint in Model Year 2000-2007 Passenger Cars and LTVs – Final Report. (Report No. DOT HS 811 665). Washington, DC: National Highway Traffic Safety Administration. Available at www-nrd.nhtsa.dot.gov/Pubs/811665.PDF.

16
It would be futile to analyze CUVs separately in this report because so few of these relatively late-model vehicles were not equipped with pretensioners and load limiters. Pickup trucks in the database mostly have pretensioners and load limiters, because so many of the earlier models were excluded from the database due to having manual on-off switches for the passenger air bag. However, Table 4a shows that combining CUVs with minivans18 and combining pickups, truck-based SUVs and full-sized vans make it possible to obtain three fairly distinct groups of vehicles that each have substantial numbers of cases with and without pretensioners and load limiters. Furthermore, cars and truck-based LTVs have nearly identical distributions; only CUVs and minivans have a substantially higher proportion of vehicles with pretensioners and load limiters.
Table 4a: Pretensioner/Load Limiter Availability in 3 Vehicle Types (Cars and LTVs with dual air bags, with a driver and an RF passenger,
at least one a fatality, FARS 1986 to 2011)
No Pretensioners Load Limiters Pretensioners & Row Percent No Load Limiters No Pretensioners Load Limiters Passenger cars 51.3 21.2 27.5 100 Truck-based LTVs 51.6 19.6 28.7 100 CUVs and minivans 29.8 10.6 59.6 100
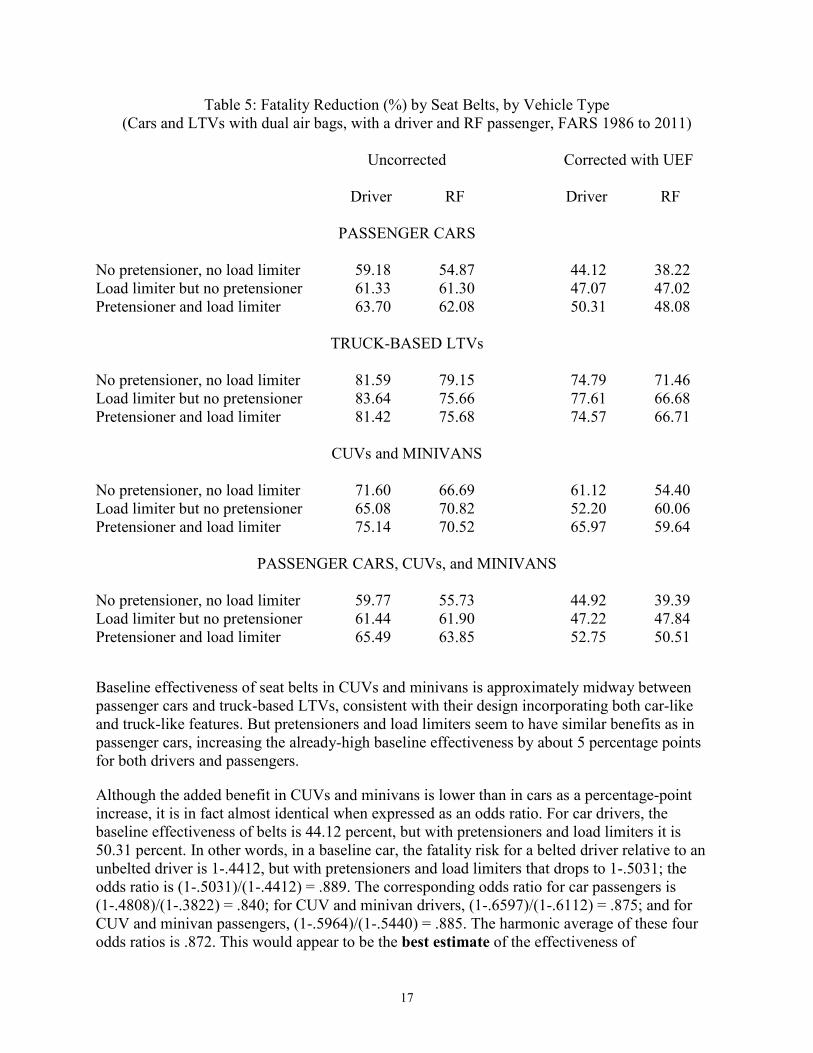
Table 5 separately compares belt effectiveness with and without pretensioners and/or load limiters for each of those three vehicle types and also for cars, CUVs, and minivans combined. In passenger cars, pretensioners and load limiters enhance the effectiveness of seat belts. The UEF-corrected baseline fatality reduction is 44 percent for drivers and 38 percent for RF passengers in cars with dual air bags. With pretensioners and load limiters, effectiveness increases by about 6 percentage points for drivers, to 50 percent and by nearly 10 percentage points for RF passengers, to 48 percent. With load limiters but no pretensioners, belt effectiveness is 47 percent for both drivers and passengers: higher than baseline, but not as high as with both pretensioners and load limiters (although it comes close for RF passengers).
The baseline effectiveness of seat belts is much higher in truck-based LTVs (75% for drivers and 71% for RF passengers) than in passenger cars (44% and 38%). That is primarily because such a large percentage of fatalities in LTVs, at least in the past, were in rollover crashes, where belts are highly effective. Another reason is that the high sills, mass, and rigidity of truck-based LTVs make them less vulnerable to structural collapse in side impacts, allowing seat belts to better protect the occupants. Pretensioners and load limiters, however, at first glance have not enhanced belt effectiveness: fatality reduction is unchanged for drivers and drops by 4 percentage points for passengers.
18 Chevrolet Astro van and GMC Safari are sometimes called minivans but are here included with full-sized vans, which they more closely resemble in structure.
17
Table 5: Fatality Reduction (%) by Seat Belts, by Vehicle Type (Cars and LTVs with dual air bags, with a driver and RF passenger, FARS 1986 to 2011)
Uncorrected Corrected with UEF Driver RF Driver RF
PASSENGER CARS
No pretensioner, no load limiter 59.18 54.87 44.12 38.22 Load limiter but no pretensioner 61.33 61.30 47.07 47.02 Pretensioner and load limiter 63.70 62.08 50.31 48.08
TRUCK-BASED LTVs
No pretensioner, no load limiter 81.59 79.15 74.79 71.46 Load limiter but no pretensioner 83.64 75.66 77.61 66.68 Pretensioner and load limiter 81.42 75.68 74.57 66.71
CUVs and MINIVANS
No pretensioner, no load limiter 71.60 66.69 61.12 54.40 Load limiter but no pretensioner 65.08 70.82 52.20 60.06 Pretensioner and load limiter 75.14 70.52 65.97 59.64
PASSENGER CARS, CUVs, and MINIVANS
No pretensioner, no load limiter 59.77 55.73 44.92 39.39 Load limiter but no pretensioner 61.44 61.90 47.22 47.84 Pretensioner and load limiter 65.49 63.85 52.75 50.51
Baseline effectiveness of seat belts in CUVs and minivans is approximately midway between passenger cars and truck-based LTVs, consistent with their design incorporating both car-like and truck-like features. But pretensioners and load limiters seem to have similar benefits as in passenger cars, increasing the already-high baseline effectiveness by about 5 percentage points for both drivers and passengers.
Although the added benefit in CUVs and minivans is lower than in cars as a percentage-point increase, it is in fact almost identical when expressed as an odds ratio. For car drivers, the baseline effectiveness of belts is 44.12 percent, but with pretensioners and load limiters it is 50.31 percent. In other words, in a baseline car, the fatality risk for a belted driver relative to an unbelted driver is 1-.4412, but with pretensioners and load limiters that drops to 1-.5031; the odds ratio is (1-.5031)/(1-.4412) = .889. The corresponding odds ratio for car passengers is (1-.4808)/(1-.3822) = .840; for CUV and minivan drivers, (1-.6597)/(1-.6112) = .875; and for CUV and minivan passengers, (1-.5964)/(1-.5440) = .885. The harmonic average of these four odds ratios is .872. This would appear to be the best estimate of the effectiveness of
18
pretensioners and load limiters in cars, CUVs, and minivans: the addition of pretensioners and load limiters reduces fatality risk by 1 - .872 = 12.8 percent relative to a belted occupant in a vehicle without pretensioners and load limiters. Note that this effectiveness of 12.8 percent translates into considerably smaller percentage-point increases in belt effectiveness, depending on the baseline effectiveness. Also, the estimate may to some extent reflect the effects of other belt or belt-related improvements introduced in some makes and models at about the same time as pretensioners and load limiters, such as adjustable anchorages; integrated belt systems; or tuning the air bag, vehicle structure, or seats especially to improve protection for a belted occupant.
For load limiters without pretensioners, the available data is fairly limited in truck-based LTVs and in CUVs/minivans and results are ambiguous: in truck-based LTVs, effectiveness is relatively highest for drivers and lowest for RF passengers, whereas in CUVs/minivans it is the other way around. In other words, none of the three vehicle types show a large risk increase (or reduction, for that matter) with load limiters but no pretensioners.
The last section of Table 5 simply pools the data for cars, CUVs, and minivans. Effectiveness increases by almost 8 percentage points for drivers and more than 11 for passengers. These numbers appear to be unrealistically high, because they exceed the percentage point increases for cars alone (6 and 10) or CUVs/minivans alone (5 and 5). The effect is biased upward because so many of the CUVs and minivans (where baseline belt effectiveness is higher than in cars) have pretensioners and load limiters. It is not a reliable estimate.
The CATMOD analysis for car drivers generates a coefficient of -0.0338 for BELT1 * PRETENLL when BELT1 = 1 and PRETENLL = 1. It is statistically significant (χ2 = 4.75). Similarly, the CATMOD analysis for car passengers generates a coefficient of -0.0392 for BELT3 * PRETENLL when BELT3 = 1 and PRETENLL = 1. It is also statistically significant (χ2 = 6.43). In other words, the combination of pretensioners and load limiters significantly enhances belt effectiveness in passenger cars, for both drivers and RF passengers.
The CATMOD analyses for truck-based LTVs generate coefficients of +0.0202 for BELT1 * PRETENLL and +0.0270 for BELT3 * PRETENLL, neither of which is statistically significant (χ2 = .53 and .95, respectively). Note, however, that the coefficients have positive signs, indicating (for the time being) point estimates that fatality risk is higher with pretensioners and load limiters than without them.
The CATMOD analyses for CUVs and minivans generate coefficients of -0.0524 for BELT1 * PRETENLL and -0.0227 for BELT3 * PRETENLL, neither of which is statistically significant (χ2 = 1.21 and .22, respectively). Although the coefficients are in the same direction and of similar magnitude as for cars, the quantity of data is lower for CUVs and minivans, not enough to achieve statistical significance.
CATMOD analyses for the pooled data in the last section of Table 5 (cars + CUVs + minivans) generate coefficients of -0.0427 for BELT1 * PRETENLL and -0.0467 for BELT3 * PRETENLL, both of which are statistically significant (χ2 = 8.61 and 10.44, respectively). As stated above, these analyses are biased and the coefficients and their chi-square values likely exaggerate the true benefits of pretensioners and load limiters.
19
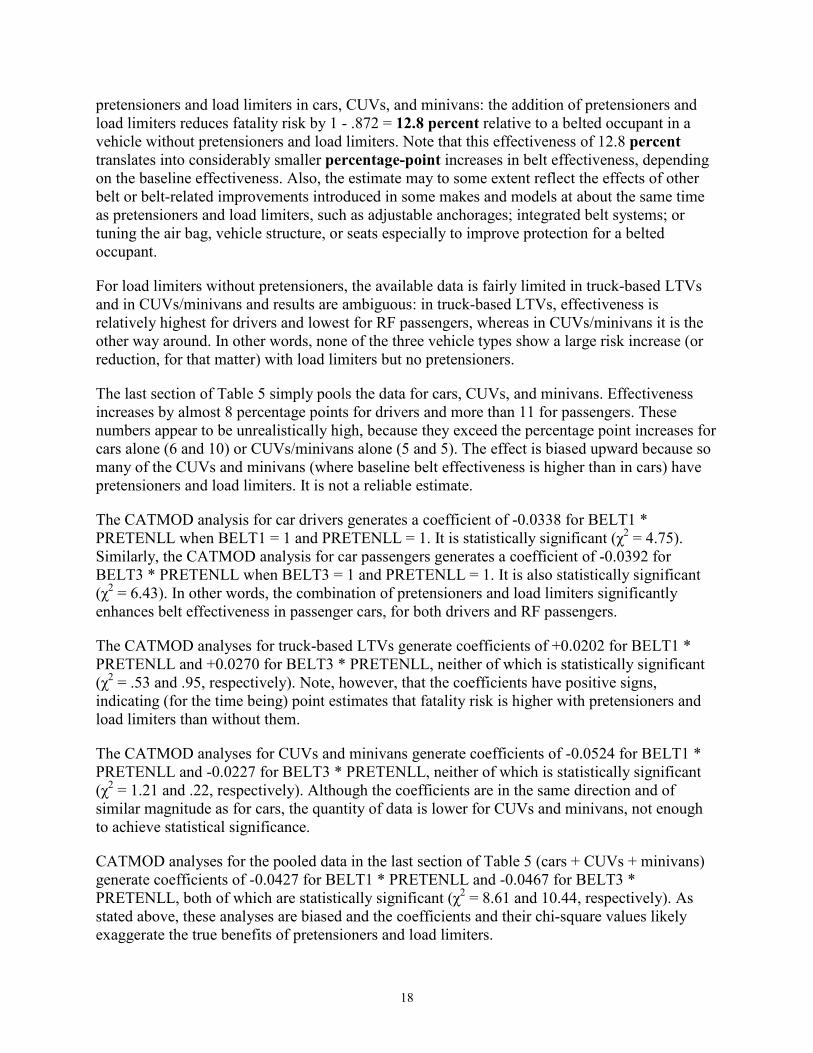
3.2 Estimating overall effectiveness while controlling for vehicle type The bias in the pooled data for cars, CUVs, and minivans (the last section of Table 5) can be addressed in CATMOD analyses by adding one more independent variable, NEWVTYP (= 1 if the vehicle is a car, = 3 if it is a CUV or minivan) and, initially, the two interaction terms BELT1 * NEWVTYP and BELT3 * NEWVTYP. Adding the main effect NEWVTYP will control for the fact that a higher proportion of the CUVs and minivans are equipped with pretensioners, while adding the two interaction terms will control for baseline belt effectiveness being higher in CUVs and minivans than in passenger cars. At first glance, no other potential interaction terms seem to have a clear intuitive meaning – and no others are included in the model. The CATMOD analysis for drivers generates the following statistics:
Analysis of Maximum Likelihood Estimates Standard Chi- Parameter Value Estimate Error Square Pr > ChiSq Intercept -0.0403 0.0197 4.19 0.0407 BELT3 BELTED 0.5199 0.0241 464.80 <.0001 BELT1 BELTED -0.5496 0.0251 478.98 <.0001 PRETENLL PRETEN+LL -0.0174 0.0115 2.29 0.1303 NEWVTYP PASSENGER CAR -0.00981 0.0199 0.24 0.6223 BELT3*NEWVTYP BELTED PASSENGER CAR -0.0807 0.0245 10.87 0.0010 BELT1*NEWVTYP BELTED PASSENGER CAR 0.0701 0.0255 7.57 0.0059 BELT3*PRETENLL BELTED PRETEN+LL 0.0375 0.0147 6.51 0.0107 BELT1*PRETENLL BELTED PRETEN+LL -0.0354 0.0148 5.73 0.0167
Maximum Likelihood Analysis of Variance Source DF Chi-Square Pr > ChiSq Intercept 1 4.19 0.0407 BELT3 1 464.80 <.0001 BELT1 1 478.98 <.0001 PRETENLL 1 2.29 0.1303 NEWVTYP 1 0.24 0.6223 BELT3*NEWVTYP 1 10.87 0.0010 BELT1*NEWVTYP 1 7.57 0.0059 BELT3*PRETENLL 1 6.51 0.0107 BELT1*PRETENLL 1 5.73 0.0167 Likelihood Ratio 7 2.20 0.9480
The “likelihood ratio” is not statistically significant (χ2 = 2.20 with 7 df), indicating that the model limited to these terms adequately fits the data. The coefficient for BELT1 * PRETENLL, -0.0354 is negative (indicating a benefit for pretensioners and load limiters) and it is statistically significant (χ2 = 5.73). Nevertheless, the coefficient and its chi-square are both of lower magnitude than in the immediately preceding analysis, based on the same data, but without controlling for NEWVTYP (-.0427 and 8.61, respectively). NHTSA believes the new analysis controls for the bias due to the market shift from cars to CUVs, yet it continues to show a significant benefit for pretensioners and load limiters in the combined population of cars, CUVs, and minivans. Similarly, the CATMOD analysis for RF passengers generates a coefficient of -0.0375 for BELT3 * PRETENLL, which is also statistically significant (χ2 = 6.51), although of smaller magnitude than in the preceding, biased analysis.
20
The regression coefficients and their standard errors for BELT1 * PRETENLL and BELT3 * PRETENLL (and the resultant chi-squares) indicate how strong the results are, statistically speaking. They also allow estimation of a heuristic 95-percent confidence interval for the earlier best estimate that pretensioners plus load limiters in cars, CUVs, and minivans reduce fatality risk by 12.8 percent relative to a belted occupant in a vehicle without pretensioners and load limiters.19 The two coefficients are -0.0354 and -0.0375, averaging to -0.03645. Their standard errors (shown in the second column of numbers in the preceding “Analysis of Maximum Likelihood Estimates”) are 0.0148 and 0.0147, respectively, averaging to 0.01475. The average of 1.96 standard errors20 relative to the average magnitude of the coefficients is
(1.96 x 0.01475) / 0.03645 = .793
The same ratio may be applied to the best effectiveness estimate (12.8%) to obtain 95-percent confidence bounds of 12.8 ± (.793 x 12.8): an interval of approximately 2.6 to 23.0 percent.
These confidence bounds demonstrate that the effectiveness of pretensioners and load limiters, although statistically significant, cannot yet be estimated precisely from the currently available data. The best estimate can serve as a working number for the time being, but it would be advisable to rerun the analyses in about four or five years when somewhat more data will be available, especially for vehicles equipped with pretensioners and load limiters.
These CATMOD analyses controlling for vehicle type can also be applied to the full database in Table 2 – i.e., also including truck-based LTVs. NEWVTYP now has 3 categories (= 1 if the vehicle is a car, = 2 if it is a truck-based LTV, = 3 if it is a CUV or minivan); otherwise the models are unchanged. These models generate coefficients of -0.0239 for BELT1 * PRETENLL and -0.0227 for BELT3 * PRETENLL, neither of which is statistically significant (χ2 = 3.35 and 3.04, respectively). Whereas the simpler but biased CATMOD analyses on Table 2, without controlling for NEWVTYP showed significant benefits for pretensioners and load limiters, these drop out of the significant range, when truck-based LTVs are included in the data, after controlling for NEWVTYP.
3.3 Car-CUV-minivan models produced with/without pretensioners/load limiters Recent NHTSA evaluations of safety technologies often compare absolute fatality rates or they compare fatalities in crashes affected by the technology relative to control group crashes – before and after the technology is introduced. To avoid potential bias in the analyses, the database was usually limited to (1) makes and models that were produced both with and without the safety feature; (2) a limited number of model years before and after the transition to the new technology, say 2 to 4 MY; (3) further limiting the range of model years, if necessary, to avoid a major redesign of that model or the introduction of another important safety technology during the timespan included.21
19 This “best estimate” was an average of four partially correlated results; it would be difficult to calculate confidence bounds for it directly. 20 The 95% confidence bounds of a normally distributed statistic are the point estimate ±1.96 standard errors. 21 Greenwell, N. K. (2013, July). Evaluation of the Certified-Advanced Air Bags. (Report No. DOT HS 811 834). Washington, DC: National Highway Traffic Safety Administration. Available at
21
This report, however, is based on double-pair comparison analyses and compares belt effectiveness – i.e., the difference in fatality risk between a belted and an unbelted occupant – before and after the introduction of pretensioners and load limiters. A drawback is that double-pair comparison needs a lot of crash cases: to begin with, the database is restricted to vehicles that had a RF passenger as well as a driver. Further limiting the analysis to selected models for a narrow range of years could shrink the database and preclude statistically significant findings. But a compensatory advantage is a lower risk of bias. Broadly speaking, a safety improvement or change in the crash environment that benefits unbelted occupants would tend to also help belted occupants, and vice-versa; belt effectiveness (the difference between belted and unbelted risk) should stay about the same. The obvious exceptions are technologies that by definition work only for belted occupants – such as pretensioners or load limiters. That permits consideration of a wider range of models, including even those that were never, or always equipped with pretensioners and load limiters.
Nevertheless, there are some trends that conceivably, over a long time span, might have slightly increased the gap between belted and unbelted risk. For example, if vehicle structures have been modified over the years to better resist intrusion, it might have helped the belted occupant somewhat more than the unbelted occupant. The same could have happened if air bags had been gradually redesigned for optimal performance when the occupant is belted. As a check on the preceding results, it would be appropriate to limit the analyses to a narrower range of models, at least to the extent that the results remain statistically meaningful.
The first step is to limit the database of cars, CUVs, and minivans to make-models that were produced at one time without pretensioners and load limiters and subsequently with both. Only 72 of the 369 make-models equipped with dual air bags meet that criterion; the first step nearly cuts the database in half, from 40,453 to 21,188 fatality cases.
The second step is to further limit the database to a range of 8 or at most 9 model years for each individual make-model. If a make-model transitioned directly from no pretensioners or load limiters to being equipped with both, the range comprises the last 4 MY without and the first 4 MY with the two technologies. If there was one intervening MY with only one of the two technologies, or with unknown equipment, this MY is excluded from the analysis, but the last 4 MY without and the first 4 MY with pretensioners and load limiters are still included. However, if there were two intervening years, both are excluded and only the last 3 MY without and the first 3 MY with pretensioners and load limiters are included. There are 60 make-models still left in the analysis after this step, which again cuts the database approximately in half, to 11,794 fatality cases. Make-models, however, are not excluded, nor are the ranges of MY reduced if the models were redesigned at some point during those years.
www-nrd.nhtsa.dot.gov/Pubs/811834.PDF; Kahane, C. J. (2011, November). Evaluation of the 1999-2003 Head Impact Upgrade of FMVSS No. 201 – Upper-Interior Components: Effectiveness of Energy-Absorbing Materials Without Head-Protection Air Bags. (Report No. DOT HS 811 538, pp. 39-41). Washington, DC: National Highway Traffic Safety Administration. Available at www-nrd.nhtsa.dot.gov/Pubs/811538.PDF; Kahane, C. J. (2009, August). The Long-Term Effect of ABS in Passenger Cars and LTVs. (Report No. DOT HS 811 182, pp. 19-22). Washington, DC: National Highway Traffic Safety Administration. Available at www-nrd.nhtsa.dot.gov/Pubs/811182.PDF; Allen, K. C. (2009, April). The Effectiveness of Amber Rear Turn Signals for Reducing Rear Impacts. (Report No. DOT HS 811 115). Washington, DC: National Highway Traffic Safety Administration. Available at www-nrd.nhtsa.dot.gov/Pubs/811115.PDF.

22
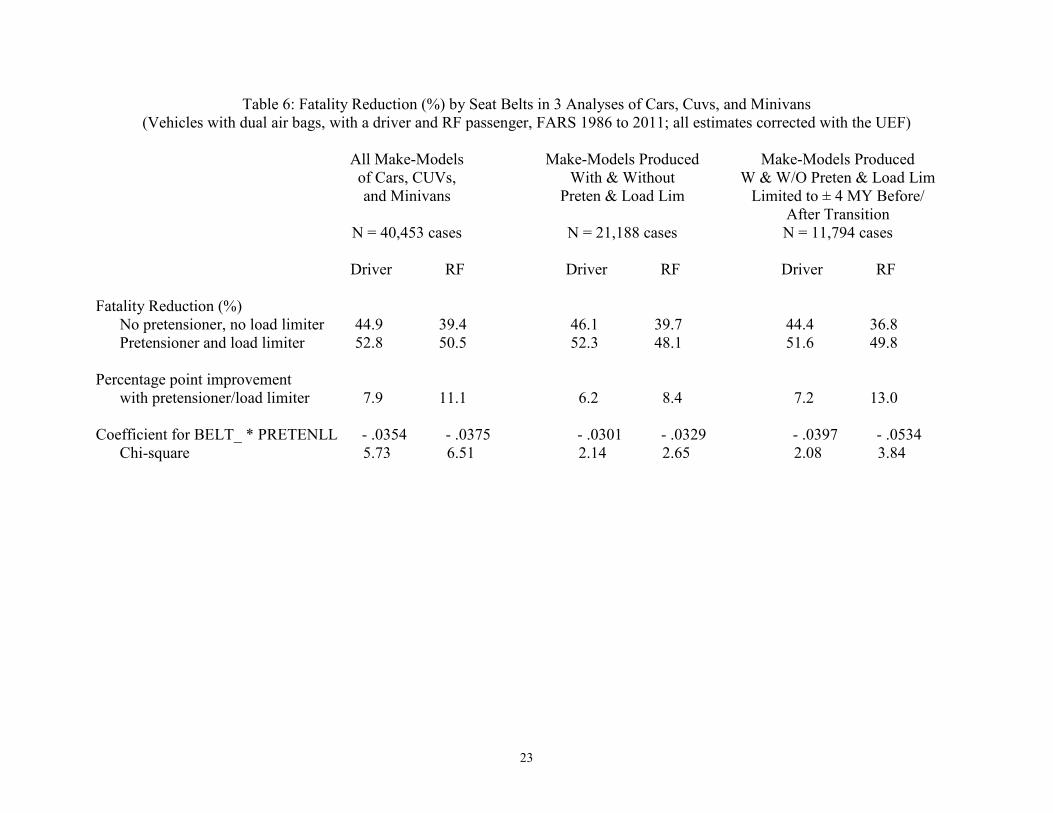
Table 6 shows that the effectiveness estimates for the two limited analyses are quite similar to the analysis of all cars, CUVs, and minivans. The left column of Table 6 analyzes the full database. The point estimates of belt effectiveness (corrected with the UEF) are copied from the last section of Table 5. Belts reduce fatality risk for drivers by 44.9 percent without pretensioners and load limiters and by 52.8 percent with both technologies, an improvement of 7.9 percentage points. For RF passengers, the improvement is 11.1 percentage points. When the analysis is initially limited to the models produced at one time without pretensioners or load limiters but later with both, the point estimates of effectiveness are little changed. However, the improvements with pretensioners and load limiters diminish slightly, to 6.2 percentage points for drivers and 8.4 percentage points for RF passengers. When the analysis is further limited to at most 4 MY without pretensioners or load limiters and at most 4 MY with both, the improvements are a bit larger: 7.2 percentage points for drivers and 13.0 percentage points for RF passengers, which are similar to the results for the full database.
23
Table 6: Fatality Reduction (%) by Seat Belts in 3 Analyses of Cars, Cuvs, and Minivans (Vehicles with dual air bags, with a driver and RF passenger, FARS 1986 to 2011; all estimates corrected with the UEF)
All Make-Models Make-Models Produced Make-Models Produced of Cars, CUVs, With & Without W & W/O Preten & Load Lim and Minivans Preten & Load Lim Limited to ± 4 MY Before/ After Transition N = 40,453 cases N = 21,188 cases N = 11,794 cases Driver RF Driver RF Driver RF Fatality Reduction (%) No pretensioner, no load limiter 44.9 39.4 46.1 39.7 44.4 36.8 Pretensioner and load limiter 52.8 50.5 52.3 48.1 51.6 49.8 Percentage point improvement with pretensioner/load limiter 7.9 11.1 6.2 8.4 7.2 13.0 Coefficient for BELT_ * PRETENLL - .0354 - .0375 - .0301 - .0329 - .0397 - .0534 Chi-square 5.73 6.51 2.14 2.65 2.08 3.84
24
The last section of Table 6 provides statistics from the CATMOD analyses controlling for vehicle type. For the full database, this analysis is discussed in Section 3.2: the coefficient for BELT1 * PRETENLL was -0.0354 and for BELT3 * PRETENLL, -0.0374. Both were statistically significant (χ2 = 5.73 and 6.51, respectively). If the more limited analyses produce consistent results, the coefficients should stay about the same as in the full database, but the chi-square values will be smaller, because, given similar coefficients, the chi-square statistic is approximately proportional to the N of cases. Table 6 shows that the coefficients were -0.0301 and -0.0329 in the first-step limited analysis and -0.0397 and -0.0534 on the second step, all quite similar to the full database. The chi-squares, as expected, are smaller in the analyses with less data; only the coefficient for RF passengers in the ± 4 MY analysis is significant (3.84 or greater). The chi-squares demonstrate that it would be futile to even further limit the database to a smaller range of model years or by excluding years when a model was redesigned, because results would likely not be statistically meaningful.
The results for the limited databases instill some confidence that the observed increases in belt effectiveness in the full database are due primarily to pretensioners and load limiters rather than reflecting a diffuse long-term trend in vehicle design that has gradually improved safety for belted occupants more than for unbelted occupants. However, these results do not preclude that at least some of the observed effect could be due to other belt or belt-related improvements if they were introduced in some makes and models at nearly the same time as pretensioners and load limiters – such as adjustable anchorages; integrated belt systems; or tuning the air bag, vehicle structure, or seats especially to improve protection for a belted occupant.
3.4 Truck-based LTVs: estimating effectiveness while controlling for crash type The basic CATMOD analyses of truck-based LTVs in Section 3.1 generated coefficients of +0.0202 for BELT1 * PRETENLL and +0.0270 for BELT3 * PRETENLL – i.e., estimated fatality increases. Although neither was statistically significant (χ2 = .53 and .95, respectively), point estimates that large in the unfavorable direction warrant a further look. Here, unlike the preceding situation, there may be a bias working against pretensioners and load limiters, namely, that rollovers, especially first-event rollovers have decreased in late-model truck-based LTVs (because of ESC and improved static stability, reasons unrelated to pretensioners or load limiters).22 (Cars, CUVs, and minivans do not show similar reduction in rollovers in the timeframe of the database.) Belt effectiveness is higher in rollovers than in other crash types; thus, belt effectiveness is lowered in the late-model vehicles (the ones with pretensioners and load limiters) because they have relatively fewer rollovers. Table 7 demonstrates that the proportion of fatal crash involvements in which a rollover is the first harmful event has declined substantially in truck-based LTVs. There has also been a slight decline in rollovers that are subsequent but most harmful events.
22 Walz, M. C. (2005, June). Trends in the Static Stability Factor of Passenger Cars, Light Trucks, and Vans. (Report No. DOT HS 809 868). Washington, DC: National Highway Traffic Safety Administration. Available at www-nrd.nhtsa.dot.gov/Pubs/809868.PDF; Sivinski, R. (2011, June). Crash Prevention Effectiveness of Light-Vehicle Electronic Stability Control: An Update of the 2007 NHTSA Evaluation. (Report No. DOT HS 811 486). Washington, DC: National Highway Traffic Safety Administration. Available at www-nrd.nhtsa.dot.gov/Pubs/811486.PDF.
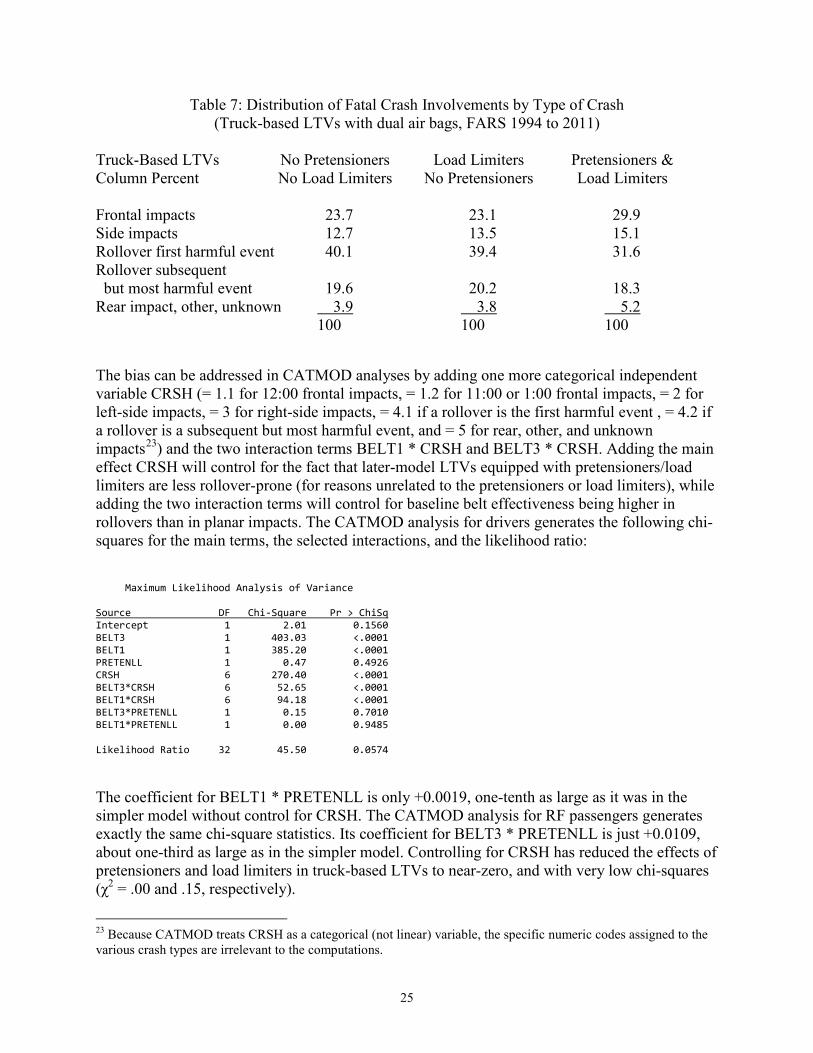
25
Table 7: Distribution of Fatal Crash Involvements by Type of Crash (Truck-based LTVs with dual air bags, FARS 1994 to 2011)
Truck-Based LTVs No Pretensioners Load Limiters Pretensioners & Column Percent No Load Limiters No Pretensioners Load Limiters Frontal impacts 23.7 23.1 29.9 Side impacts 12.7 13.5 15.1 Rollover first harmful event 40.1 39.4 31.6 Rollover subsequent but most harmful event 19.6 20.2 18.3 Rear impact, other, unknown 3.9 3.8 5.2 100 100 100
The bias can be addressed in CATMOD analyses by adding one more categorical independent variable CRSH (= 1.1 for 12:00 frontal impacts, = 1.2 for 11:00 or 1:00 frontal impacts, = 2 for left-side impacts, = 3 for right-side impacts, = 4.1 if a rollover is the first harmful event , = 4.2 if a rollover is a subsequent but most harmful event, and = 5 for rear, other, and unknown impacts23) and the two interaction terms BELT1 * CRSH and BELT3 * CRSH. Adding the main effect CRSH will control for the fact that later-model LTVs equipped with pretensioners/load limiters are less rollover-prone (for reasons unrelated to the pretensioners or load limiters), while adding the two interaction terms will control for baseline belt effectiveness being higher in rollovers than in planar impacts. The CATMOD analysis for drivers generates the following chi-squares for the main terms, the selected interactions, and the likelihood ratio:
Maximum Likelihood Analysis of Variance Source DF Chi-Square Pr > ChiSq Intercept 1 2.01 0.1560 BELT3 1 403.03 <.0001 BELT1 1 385.20 <.0001 PRETENLL 1 0.47 0.4926 CRSH 6 270.40 <.0001 BELT3*CRSH 6 52.65 <.0001 BELT1*CRSH 6 94.18 <.0001 BELT3*PRETENLL 1 0.15 0.7010 BELT1*PRETENLL 1 0.00 0.9485 Likelihood Ratio 32 45.50 0.0574
The coefficient for BELT1 * PRETENLL is only +0.0019, one-tenth as large as it was in the simpler model without control for CRSH. The CATMOD analysis for RF passengers generates exactly the same chi-square statistics. Its coefficient for BELT3 * PRETENLL is just +0.0109, about one-third as large as in the simpler model. Controlling for CRSH has reduced the effects of pretensioners and load limiters in truck-based LTVs to near-zero, and with very low chi-squares (χ2 = .00 and .15, respectively).
23 Because CATMOD treats CRSH as a categorical (not linear) variable, the specific numeric codes assigned to the various crash types are irrelevant to the computations.
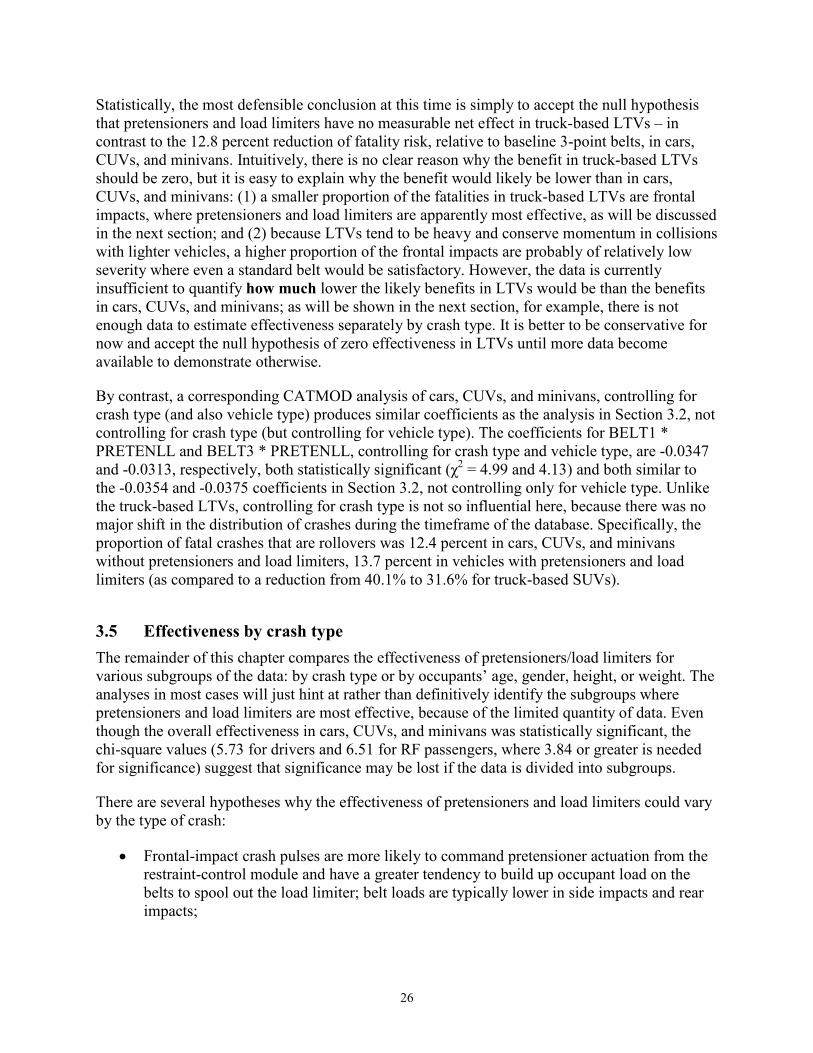
26
Statistically, the most defensible conclusion at this time is simply to accept the null hypothesis that pretensioners and load limiters have no measurable net effect in truck-based LTVs – in contrast to the 12.8 percent reduction of fatality risk, relative to baseline 3-point belts, in cars, CUVs, and minivans. Intuitively, there is no clear reason why the benefit in truck-based LTVs should be zero, but it is easy to explain why the benefit would likely be lower than in cars, CUVs, and minivans: (1) a smaller proportion of the fatalities in truck-based LTVs are frontal impacts, where pretensioners and load limiters are apparently most effective, as will be discussed in the next section; and (2) because LTVs tend to be heavy and conserve momentum in collisions with lighter vehicles, a higher proportion of the frontal impacts are probably of relatively low severity where even a standard belt would be satisfactory. However, the data is currently insufficient to quantify how much lower the likely benefits in LTVs would be than the benefits in cars, CUVs, and minivans; as will be shown in the next section, for example, there is not enough data to estimate effectiveness separately by crash type. It is better to be conservative for now and accept the null hypothesis of zero effectiveness in LTVs until more data become available to demonstrate otherwise.
By contrast, a corresponding CATMOD analysis of cars, CUVs, and minivans, controlling for crash type (and also vehicle type) produces similar coefficients as the analysis in Section 3.2, not controlling for crash type (but controlling for vehicle type). The coefficients for BELT1 * PRETENLL and BELT3 * PRETENLL, controlling for crash type and vehicle type, are -0.0347 and -0.0313, respectively, both statistically significant (χ2 = 4.99 and 4.13) and both similar to the -0.0354 and -0.0375 coefficients in Section 3.2, not controlling only for vehicle type. Unlike the truck-based LTVs, controlling for crash type is not so influential here, because there was no major shift in the distribution of crashes during the timeframe of the database. Specifically, the proportion of fatal crashes that are rollovers was 12.4 percent in cars, CUVs, and minivans without pretensioners and load limiters, 13.7 percent in vehicles with pretensioners and load limiters (as compared to a reduction from 40.1% to 31.6% for truck-based SUVs).
3.5 Effectiveness by crash type The remainder of this chapter compares the effectiveness of pretensioners/load limiters for various subgroups of the data: by crash type or by occupants’ age, gender, height, or weight. The analyses in most cases will just hint at rather than definitively identify the subgroups where pretensioners and load limiters are most effective, because of the limited quantity of data. Even though the overall effectiveness in cars, CUVs, and minivans was statistically significant, the chi-square values (5.73 for drivers and 6.51 for RF passengers, where 3.84 or greater is needed for significance) suggest that significance may be lost if the data is divided into subgroups.
There are several hypotheses why the effectiveness of pretensioners and load limiters could vary by the type of crash:
• Frontal-impact crash pulses are more likely to command pretensioner actuation from the restraint-control module and have a greater tendency to build up occupant load on the belts to spool out the load limiter; belt loads are typically lower in side impacts and rear impacts;
27
• Some pretensioner actuation algorithms may be designed for actuation only in frontal impacts; and
• Even among frontal impacts, there could be a difference between purely longitudinal impacts with full structural engagement and oblique or corner impacts: increased occupant excursion due to the load limiter might have a different effect in the oblique or corner impact where the frontal air bag might not intercept the occupant’s forward motion.24
Crash data collected for NHTSA in the Crashworthiness Data System of NASS during CY 2005 to 2009 provides statistics on how often pretensioners activate. In crash involvements that resulted in a fatality to at least one occupant of the vehicle and where the driver was belted, the pretensioners activated in 84 percent of the frontal impacts (including 93 percent of the frontal impacts involving vehicles of MY 2007 or later), 61 percent of the side impacts, and 48 percent of the most-harmful-event rollovers. In other words, while it is true that activation is most likely in frontal impacts, it is by no means uncommon in side impacts and rollovers.
Table 8 separately compares belt effectiveness with and without pretensioners and/or load limiters, by type of crash, for each of the three vehicle types. Table 8 and all subsequent tables only show the belt-effectiveness estimates that have been corrected with the UEF. It is evident from the large variations in observed effectiveness that some of the estimates are based on limited data, especially those for the less frequent crash types and for vehicles other than passenger cars; in some cases, there is no estimate at all because at least one of the eight cells (as shown in the example of Table 2) needed to run a double-pair comparison has zero cases. The objective here is to look for directional trends. Specifically, is effectiveness in, say, frontal crashes consistently higher, across vehicle types and at both seat positions, with pretensioners and load limiters? CATMOD is useful for testing significance of effectiveness differences across vehicle types.
The first section of Table 8 analyzes all frontal impacts except those where FARS judged a subsequent rollover to be the most harmful event. For cars, CUVs, and minivans, point estimates of belt effectiveness are consistently higher with pretensioners and load limiters than without them: 53 versus 34 percent (car drivers), 49 versus 43 percent (car passengers), 52 versus 50 percent (CUV/minivan drivers) and 52 versus 45 percent (CUV/minivan passengers). Nevertheless, in the CATMOD analysis combining cars, CUVs, and minivans and controlling for vehicle type, the effectiveness enhancement is statistically significant only for drivers (χ2 = 9.43), not for passengers (χ2 = 2.38). For truck-based LTVs, there is no consistent trend even in the point estimates: a small improvement for drivers, but a change in the opposite direction for passengers.
In frontal impacts of cars, CUVs, and minivans, the effect of load limiters without pretensioners is inconsistent: effectiveness is sometimes higher, sometimes lower, and sometimes between the estimates with both technologies and with neither.
24 Brumbelow et al. (2007).

28
Table 8: Fatality Reduction (%) by Seat Belts, by Crash Type and Vehicle Type (Vehicles with dual air bags, with a driver and RF passenger, FARS 1986 to 2011; all estimates corrected with the UEF)
Passenger Cars Truck-Based LTVs CUVs and Minivans Driver RF Driver RF Driver RF ALL FRONTAL IMPACTS25 No pretensioner, no load limiter 34.0 42.6 52.5 52.6 49.5 44.8 Load limiter but no pretensioner 40.2 50.1 52.4 40.8 34.0 53.4 Pretensioner and load limiter 52.9 48.8 55.9 48.8 52.0 52.1 12:00 FRONTAL IMPACTS26 No pretensioner, no load limiter 32.7 41.5 48.5 48.1 62.8 51.8 Load limiter but no pretensioner 43.1 51.9 51.4 32.8 44.0 48.3 Pretensioner and load limiter 50.4 43.2 61.4 50.9 50.7 50.9 OTHER FRONTAL IMPACTS No pretensioner, no load limiter 37.6 45.8 64.3 65.5 - 31.7 12.8 Load limiter but no pretensioner 30.8 44.1 55.5 60.4 -27 70.5 Pretensioner and load limiter 59.6 63.8 31.7 46.5 56.8 56.1 NEARSIDE IMPACTS28 No pretensioner, no load limiter - 2.3 - 25.6 6.5 83.4 7.1 .5 Load limiter but no pretensioner - 27.8 - 26.1 71.2 - 18.1 14.5 - 7.9 Pretensioner and load limiter - 20.8 - 1.3 63.1 35.0 4.5 13.2 FAR-SIDE IMPACTS29 No pretensioner, no load limiter 39.9 30.0 69.1 37.5 51.6 67.8 Load limiter but no pretensioner 35.8 30.0 64.7 66.8 48.5 56.1 Pretensioner and load limiter 40.3 37.2 60.9 56.9 76.2 51.5
25 The frontal-, side-, and rear-impact groups all exclude any crash where a subsequent rollover was the most harmful event. 26 IMPACT1 = IMPACT2 = 12. 27 Insufficient data to perform double-pair comparison analysis; specifically, at least one of the eight cells (as shown in the example of Table 2) has zero cases. 28 Left side for the driver, right side for the RF passenger. 29 Right side for the driver, left side for the RF passenger.
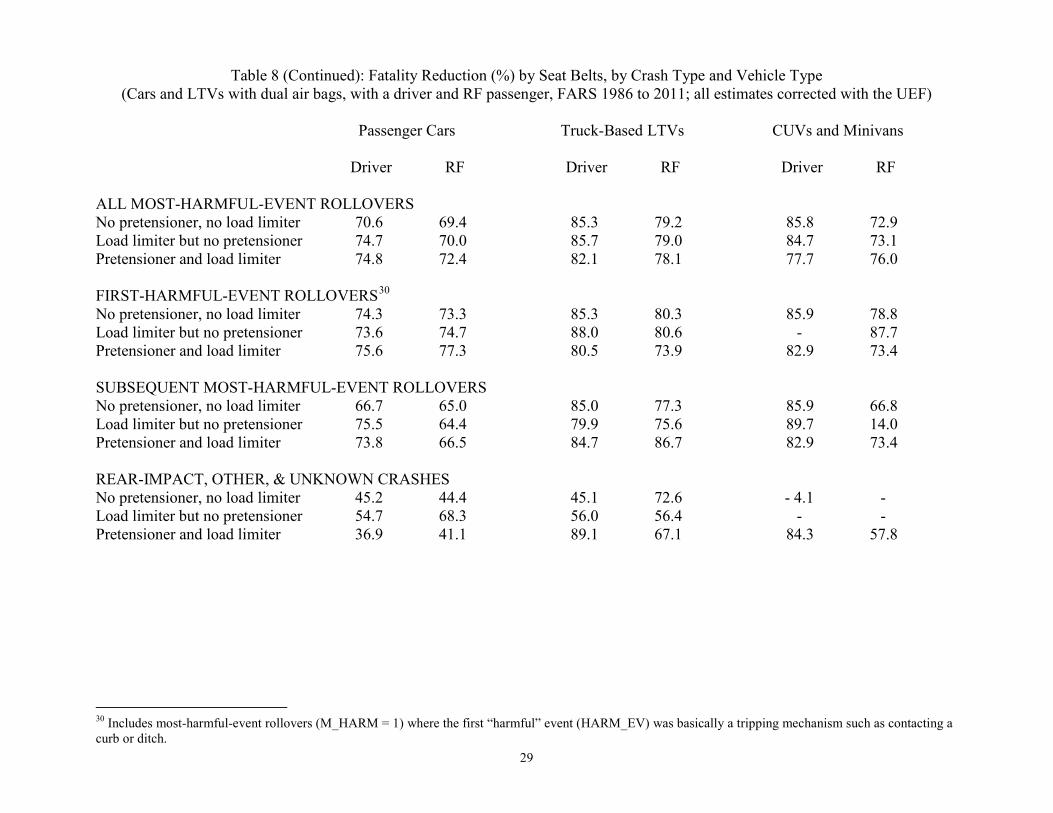
29
Table 8 (Continued): Fatality Reduction (%) by Seat Belts, by Crash Type and Vehicle Type (Cars and LTVs with dual air bags, with a driver and RF passenger, FARS 1986 to 2011; all estimates corrected with the UEF)
Passenger Cars Truck-Based LTVs CUVs and Minivans Driver RF Driver RF Driver RF ALL MOST-HARMFUL-EVENT ROLLOVERS No pretensioner, no load limiter 70.6 69.4 85.3 79.2 85.8 72.9 Load limiter but no pretensioner 74.7 70.0 85.7 79.0 84.7 73.1 Pretensioner and load limiter 74.8 72.4 82.1 78.1 77.7 76.0 FIRST-HARMFUL-EVENT ROLLOVERS30 No pretensioner, no load limiter 74.3 73.3 85.3 80.3 85.9 78.8 Load limiter but no pretensioner 73.6 74.7 88.0 80.6 - 87.7 Pretensioner and load limiter 75.6 77.3 80.5 73.9 82.9 73.4 SUBSEQUENT MOST-HARMFUL-EVENT ROLLOVERS No pretensioner, no load limiter 66.7 65.0 85.0 77.3 85.9 66.8 Load limiter but no pretensioner 75.5 64.4 79.9 75.6 89.7 14.0 Pretensioner and load limiter 73.8 66.5 84.7 86.7 82.9 73.4 REAR-IMPACT, OTHER, & UNKNOWN CRASHES No pretensioner, no load limiter 45.2 44.4 45.1 72.6 - 4.1 - Load limiter but no pretensioner 54.7 68.3 56.0 56.4 - - Pretensioner and load limiter 36.9 41.1 89.1 67.1 84.3 57.8
30 Includes most-harmful-event rollovers (M_HARM = 1) where the first “harmful” event (HARM_EV) was basically a tripping mechanism such as contacting a curb or ditch.
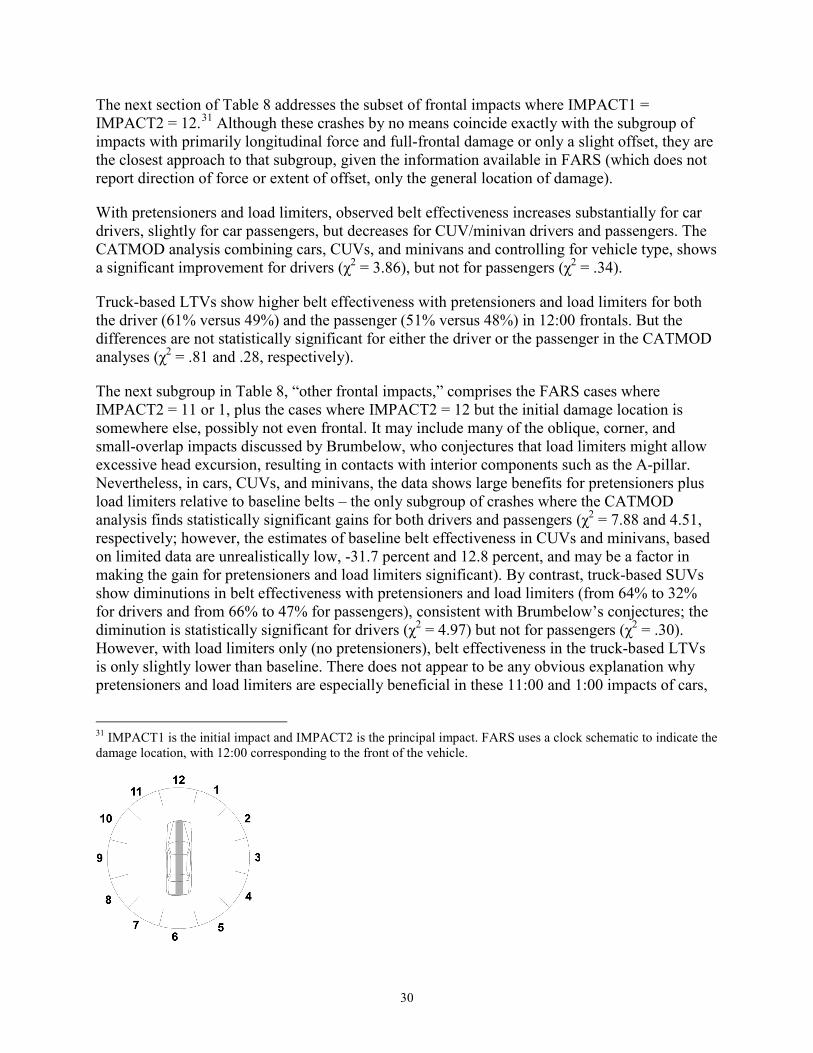
30
The next section of Table 8 addresses the subset of frontal impacts where IMPACT1 = IMPACT2 = 12.31 Although these crashes by no means coincide exactly with the subgroup of impacts with primarily longitudinal force and full-frontal damage or only a slight offset, they are the closest approach to that subgroup, given the information available in FARS (which does not report direction of force or extent of offset, only the general location of damage).
With pretensioners and load limiters, observed belt effectiveness increases substantially for car drivers, slightly for car passengers, but decreases for CUV/minivan drivers and passengers. The CATMOD analysis combining cars, CUVs, and minivans and controlling for vehicle type, shows a significant improvement for drivers (χ2 = 3.86), but not for passengers (χ2 = .34).
Truck-based LTVs show higher belt effectiveness with pretensioners and load limiters for both the driver (61% versus 49%) and the passenger (51% versus 48%) in 12:00 frontals. But the differences are not statistically significant for either the driver or the passenger in the CATMOD analyses (χ2 = .81 and .28, respectively).
The next subgroup in Table 8, “other frontal impacts,” comprises the FARS cases where IMPACT2 = 11 or 1, plus the cases where IMPACT2 = 12 but the initial damage location is somewhere else, possibly not even frontal. It may include many of the oblique, corner, and small-overlap impacts discussed by Brumbelow, who conjectures that load limiters might allow excessive head excursion, resulting in contacts with interior components such as the A-pillar. Nevertheless, in cars, CUVs, and minivans, the data shows large benefits for pretensioners plus load limiters relative to baseline belts – the only subgroup of crashes where the CATMOD analysis finds statistically significant gains for both drivers and passengers (χ2 = 7.88 and 4.51, respectively; however, the estimates of baseline belt effectiveness in CUVs and minivans, based on limited data are unrealistically low, -31.7 percent and 12.8 percent, and may be a factor in making the gain for pretensioners and load limiters significant). By contrast, truck-based SUVs show diminutions in belt effectiveness with pretensioners and load limiters (from 64% to 32% for drivers and from 66% to 47% for passengers), consistent with Brumbelow’s conjectures; the diminution is statistically significant for drivers (χ2 = 4.97) but not for passengers (χ2 = .30). However, with load limiters only (no pretensioners), belt effectiveness in the truck-based LTVs is only slightly lower than baseline. There does not appear to be any obvious explanation why pretensioners and load limiters are especially beneficial in these 11:00 and 1:00 impacts of cars,
31 IMPACT1 is the initial impact and IMPACT2 is the principal impact. FARS uses a clock schematic to indicate the damage location, with 12:00 corresponding to the front of the vehicle.

31
CUVs, and minivans, but not for truck-based LTVs. Although several of the observed differences are statistically significant, data on this type of crash is limited, making it difficult to reach firm conclusions.
Data is also relatively limited for side impacts. Table 8 shows that belt effectiveness is consistently higher in far-side impacts (where belts may readily prevent occupant contacts with interior components) than in nearside impacts (where belts may be unable to mitigate contact with the intruding side structure immediately adjacent to the occupant) and that belts are generally more effective in LTVs, CUVs, and minivans than in passenger cars (whose lower sills make them structurally more vulnerable in side impact).32 But the effect of pretensioners and load limiters relative to baseline belts shows no strong, consistent pattern across vehicle types or seat positions in either nearside or far-side impacts, although observed effectiveness does increase in far-side impacts at both seat positions for cars and one position for CUVs and minivans. However, none of the CATMOD tests shows a statistically significant difference.
In rollover crashes, pretensioners might potentially be helpful by reducing occupant excursion while load limiters might conceivably have the opposite effect. It is unknown to what extent first-event rollovers produce acceleration pulses interpreted by the restraint controller as warranting pretensioner triggering or build up belt loads to spool out load limiters. Subsequent-event rollovers, on the other hand, might follow an impact that does both. The second page of Table 8 analyzes rollover crashes: all most-harmful-event rollovers combined, then separately for first-harmful-event and subsequent-most-harmful-event rollovers. Passenger cars show a slight tendency toward higher belt effectiveness with pretensioners and load limiters: observed effectiveness is always higher at both seat positions; however, the CATMOD tests do not show significant differences (χ2 ranges from .13 to 1.25 in the various tests). In the truck-based LTVs, CUVs, and minivans there are no clear trends in the observed results and CATMOD tests do not show significant differences.
In rear impacts and other crash types, the limited data does not show significant effects for pretensioners and load limiters.
The overall impression from Table 8 is that the beneficial effect of pretensioners and load limiters for cars, CUVs, and minivans may be most noticeable in frontal impacts, but it is not necessarily limited to those impacts. There might be comparable benefits in far-side impacts and rollovers in passenger cars, for example.
3.6 Effectiveness by occupant age groups Table 9 compares the effectiveness of pretensioners/load limiters for occupants 55 and older to drivers less than 55 years old and RF passengers 13 to 54 years old. A working hypothesis here is that load limiters would especially help older people, because they are more vulnerable to injury (particularly in the chest area) from belt forces. Pretensioners might also be effective for
32 Nevertheless, the observed negatives for some of the side impact categories may reflect not only limited data but also the UEF correction. The UEF is a single factor applied across all crash types, when in fact it might vary to some extent across crash types. Without the UEF correction, all observed effectiveness estimates, even in nearside impacts, are positive.
32
older people if they reduce peak forces by starting the occupant’s ride-down sooner and spreading it over a longer time.
For passenger cars, Table 9 shows a small additional improvement in the benefits of pretensioners/load limiters for older drivers, compared to younger drivers. Belt effectiveness increases with pretensioners and load limiters by 5 percentage points for drivers less than 55 (i.e., from 45.0% to 49.9%) and by 9 percentage points for drivers 55 or older. But effectiveness increases are similar for RF passengers, increasing by 11 percentage points for younger RF passengers and by 9 percentage points for older passengers.
For truck-based LTVs, however, the observed effectiveness of seat belts declines by about 5 percentage points for younger occupants at both seat positions, while it increases by 5 to 10 percentage points for older people. For CUVs, and minivans, observed effectiveness of seat belts declines by 3 to 5 percentage points for younger occupants at both seat positions and increases by 20 percentage points at both positions for older people. In fact, with pretensioners and load limiters, belts have become about equally effective for the two age groups in LTVs, CUVs, and minivans.
A CATMOD analysis of drivers 55 and older in all vehicles, controlling for vehicle type, indicates that belt effectiveness is significantly higher with pretensioners and load limiters (χ2 = 4.02). CATMOD analyses of RF passengers in cars, CUVs, and minivans, controlling for vehicle type, estimate the same regression coefficient for PRETENLL, -.042, for younger and older passengers, indicating a similar relative benefit for pretensioners and load limiters in the two age groups; however, this coefficient is statistically significant only for the younger passengers, where there are more crash cases. No other CATMOD analysis produced statistically significant coefficients. In other words, the results lean in the direction of showing relatively greater benefits for older occupants, although they do not yet establish a firm conclusion to that effect.
3.7 Effectiveness by occupant’s gender Table 10 compares the effectiveness of pretensioners/load limiters for male and female occupants. The working hypothesis from the preceding section might also apply here – namely, that load limiters and pretensioners would especially help females, because they are somewhat more vulnerable to chest or abdominal injury from belt forces than males. Load limiters could have a disadvantage for males who are tall or large, if they contribute to head excursion.

33
Table 9: Fatality Reduction (%) by Seat Belts, by Occupant Age Groups and Vehicle Type (Vehicles with dual air bags, with a driver and RF passenger, FARS 1986 to 2011; all estimates corrected with the UEF)
Passenger Cars Truck-Based LTVs CUVs and Minivans Driver RF Driver RF Driver RF 13 TO 54 YEARS OLD No pretensioner, no load limiter 45.0 43.8 76.5 74.2 68.4 69.1 Load limiter but no pretensioner 47.5 50.3 79.3 68.1 61.8 77.8 Pretensioner and load limiter 49.9 54.9 74.9 69.1 63.8 66.1 55 AND OLDER No pretensioner, no load limiter 38.3 34.8 63.7 67.3 47.2 31.8 Load limiter but no pretensioner 39.3 49.8 76.1 66.9 34.9 27.3 Pretensioner and load limiter 46.8 43.4 73.3 72.3 70.0 56.1
Table 10: Fatality Reduction (%) by Seat Belts, by Occupant’s Gender and Vehicle Type (Vehicles with dual air bags, with a driver and RF passenger, FARS 1986 to 2011; all estimates corrected with the UEF)
Passenger Cars Truck-Based LTVs CUVs and Minivans Driver RF Driver RF Driver RF MALES No pretensioner, no load limiter 40.6 40.5 72.8 74.7 53.5 63.2 Load limiter but no pretensioner 46.6 44.6 75.2 64.3 41.0 61.2 Pretensioner and load limiter 48.6 44.8 70.9 70.7 56.7 65.2 FEMALES No pretensioner, no load limiter 56.1 39.6 79.9 68.1 76.0 48.9 Load limiter but no pretensioner 49.0 51.2 82.5 68.8 73.1 60.5 Pretensioner and load limiter 52.0 54.4 84.8 62.1 80.0 55.3
34
The results in Table 10 do not strongly support these hypotheses. In fact, for passenger cars, the results are not easy to interpret. For car drivers, belt effectiveness increased with pretensioners and load limiters by 8 percentage points above baseline for males while it decreased by 4 percentage points from baseline for females. However, the baseline effectiveness estimates are a surprisingly low 41 percent for male drivers, but a high 56 percent for female drivers. Even though effectiveness increases for males and decreases for females, it still remains higher for females (52%) than males (49%) after cars were equipped with pretensioners and load limiters. Thus, it is not clear if the observed changes in effectiveness are really due to pretensioners and load limiters or are merely a sort of “regression to the mean” from the baseline. For car passengers, baseline effectiveness was almost equal for males and females. With pretensioners and load limiters, effectiveness increased by 15 percentage points for females and only 4 percentage points for males. With pretensioners and load limiters, belt effectiveness is higher for females than males at both seat positions.
In CUVs and minivans, belt effectiveness increased for both males and females at both seat positions, all by similar increments. For truck-based LTVs, effectiveness declined with pretensioners and load limiters in three of the four comparisons, improving only for female drivers.
A CATMOD analysis of male drivers in cars, CUVs, and minivans, controlling for vehicle type, showed significantly higher belt effectiveness with pretensioners and load limiters (χ2 = 4.05). A CATMOD analysis of female passengers in cars, CUVs, and minivans, controlling for vehicle type, likewise showed significantly higher belt effectiveness with pretensioners and load limiters (χ2 = 8.21). These were the only CATMOD analyses that produced significant coefficients. In all, the data do not strongly support a conclusion that pretensioners and load limiters are more beneficial for females than males, or vice-versa.
3.8 Effectiveness by driver height groups FARS began recording the height and weight of drivers, if they were available from driver-license files or other State record systems, in CY 1998. It has never reported passengers’ height or weight. The driver’s height is reported in 86 percent of the FARS cases considered in this report and the weight is reported in 66 percent of the cases. Table 11 compares the effects of pretensioners/load limiters for drivers 70 inches or taller to drivers less than 70 inches tall (where 70 inches is the height of the 50th percentile male in this fairly recent FARS data). The working hypothesis, as already discussed in the preceding section, is that load limiters might be relatively less advantageous for taller drivers because they would be even more likely to contact interior components of the vehicle if the load limiters spool out extensively.
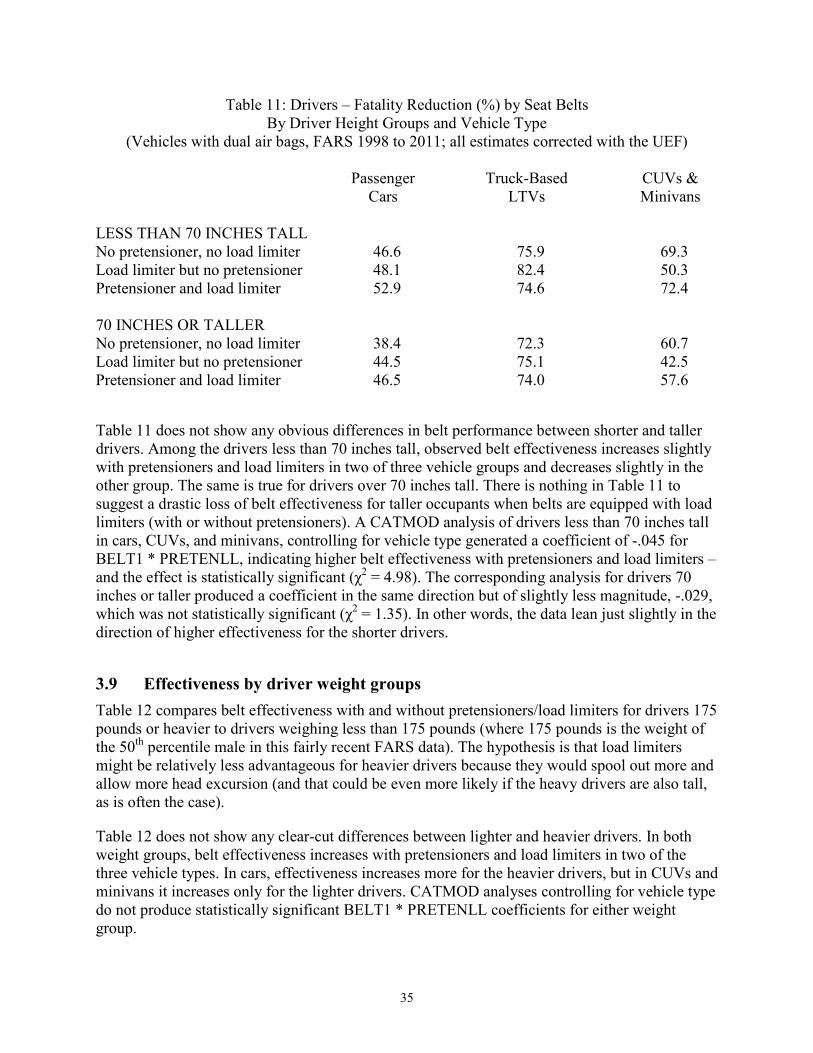
35
Table 11: Drivers – Fatality Reduction (%) by Seat Belts By Driver Height Groups and Vehicle Type
(Vehicles with dual air bags, FARS 1998 to 2011; all estimates corrected with the UEF)
Passenger Truck-Based CUVs & Cars LTVs Minivans LESS THAN 70 INCHES TALL No pretensioner, no load limiter 46.6 75.9 69.3 Load limiter but no pretensioner 48.1 82.4 50.3 Pretensioner and load limiter 52.9 74.6 72.4 70 INCHES OR TALLER No pretensioner, no load limiter 38.4 72.3 60.7 Load limiter but no pretensioner 44.5 75.1 42.5 Pretensioner and load limiter 46.5 74.0 57.6
Table 11 does not show any obvious differences in belt performance between shorter and taller drivers. Among the drivers less than 70 inches tall, observed belt effectiveness increases slightly with pretensioners and load limiters in two of three vehicle groups and decreases slightly in the other group. The same is true for drivers over 70 inches tall. There is nothing in Table 11 to suggest a drastic loss of belt effectiveness for taller occupants when belts are equipped with load limiters (with or without pretensioners). A CATMOD analysis of drivers less than 70 inches tall in cars, CUVs, and minivans, controlling for vehicle type generated a coefficient of -.045 for BELT1 * PRETENLL, indicating higher belt effectiveness with pretensioners and load limiters – and the effect is statistically significant (χ2 = 4.98). The corresponding analysis for drivers 70 inches or taller produced a coefficient in the same direction but of slightly less magnitude, -.029, which was not statistically significant (χ2 = 1.35). In other words, the data lean just slightly in the direction of higher effectiveness for the shorter drivers.
3.9 Effectiveness by driver weight groups Table 12 compares belt effectiveness with and without pretensioners/load limiters for drivers 175 pounds or heavier to drivers weighing less than 175 pounds (where 175 pounds is the weight of the 50th percentile male in this fairly recent FARS data). The hypothesis is that load limiters might be relatively less advantageous for heavier drivers because they would spool out more and allow more head excursion (and that could be even more likely if the heavy drivers are also tall, as is often the case).
Table 12 does not show any clear-cut differences between lighter and heavier drivers. In both weight groups, belt effectiveness increases with pretensioners and load limiters in two of the three vehicle types. In cars, effectiveness increases more for the heavier drivers, but in CUVs and minivans it increases only for the lighter drivers. CATMOD analyses controlling for vehicle type do not produce statistically significant BELT1 * PRETENLL coefficients for either weight group.

36
Table 12: Drivers – Fatality Reduction (%) by Seat Belts By Driver Weight Groups and Vehicle Type
(Vehicles with dual air bags, FARS 1998 to 2011; all estimates corrected with the UEF)
Passenger Truck-Based CUVs & Cars LTVs Minivans LIGHTER THAN 175 POUNDS No pretensioner, no load limiter 48.8 76.7 58.6 Load limiter but no pretensioner 49.7 82.9 43.3 Pretensioner and load limiter 49.7 70.9 71.1 175 POUNDS OR HEAVIER No pretensioner, no load limiter 41.1 72.2 63.9 Load limiter but no pretensioner 44.2 81.1 32.3 Pretensioner and load limiter 49.7 76.3 54.7
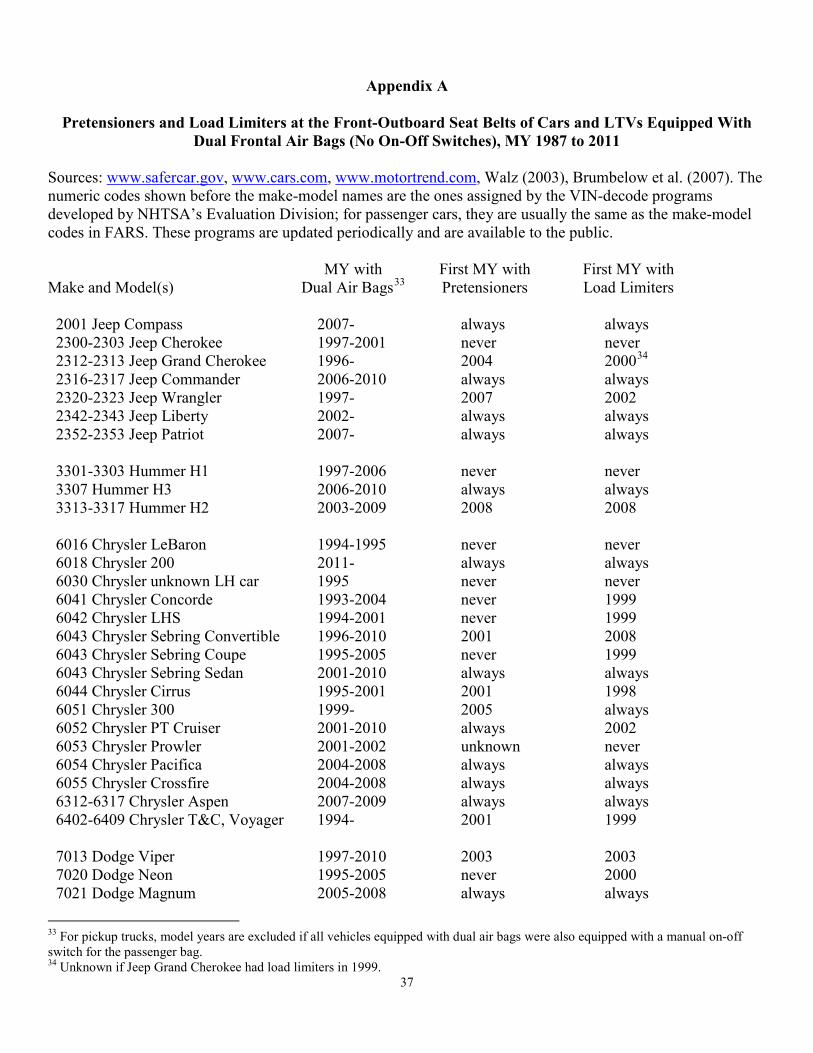
37
Appendix A
Pretensioners and Load Limiters at the Front-Outboard Seat Belts of Cars and LTVs Equipped With Dual Frontal Air Bags (No On-Off Switches), MY 1987 to 2011
Sources: www.safercar.gov, www.cars.com, www.motortrend.com, Walz (2003), Brumbelow et al. (2007). The numeric codes shown before the make-model names are the ones assigned by the VIN-decode programs developed by NHTSA’s Evaluation Division; for passenger cars, they are usually the same as the make-model codes in FARS. These programs are updated periodically and are available to the public. MY with First MY with First MY with Make and Model(s) Dual Air Bags33 Pretensioners Load Limiters 2001 Jeep Compass 2007- always always 2300-2303 Jeep Cherokee 1997-2001 never never 2312-2313 Jeep Grand Cherokee 1996- 2004 200034 2316-2317 Jeep Commander 2006-2010 always always 2320-2323 Jeep Wrangler 1997- 2007 2002 2342-2343 Jeep Liberty 2002- always always 2352-2353 Jeep Patriot 2007- always always 3301-3303 Hummer H1 1997-2006 never never 3307 Hummer H3 2006-2010 always always 3313-3317 Hummer H2 2003-2009 2008 2008 6016 Chrysler LeBaron 1994-1995 never never 6018 Chrysler 200 2011- always always 6030 Chrysler unknown LH car 1995 never never 6041 Chrysler Concorde 1993-2004 never 1999 6042 Chrysler LHS 1994-2001 never 1999 6043 Chrysler Sebring Convertible 1996-2010 2001 2008 6043 Chrysler Sebring Coupe 1995-2005 never 1999 6043 Chrysler Sebring Sedan 2001-2010 always always 6044 Chrysler Cirrus 1995-2001 2001 1998 6051 Chrysler 300 1999- 2005 always 6052 Chrysler PT Cruiser 2001-2010 always 2002 6053 Chrysler Prowler 2001-2002 unknown never 6054 Chrysler Pacifica 2004-2008 always always 6055 Chrysler Crossfire 2004-2008 always always 6312-6317 Chrysler Aspen 2007-2009 always always 6402-6409 Chrysler T&C, Voyager 1994- 2001 1999 7013 Dodge Viper 1997-2010 2003 2003 7020 Dodge Neon 1995-2005 never 2000 7021 Dodge Magnum 2005-2008 always always
33 For pickup trucks, model years are excluded if all vehicles equipped with dual air bags were also equipped with a manual on-off switch for the passenger bag. 34 Unknown if Jeep Grand Cherokee had load limiters in 1999.
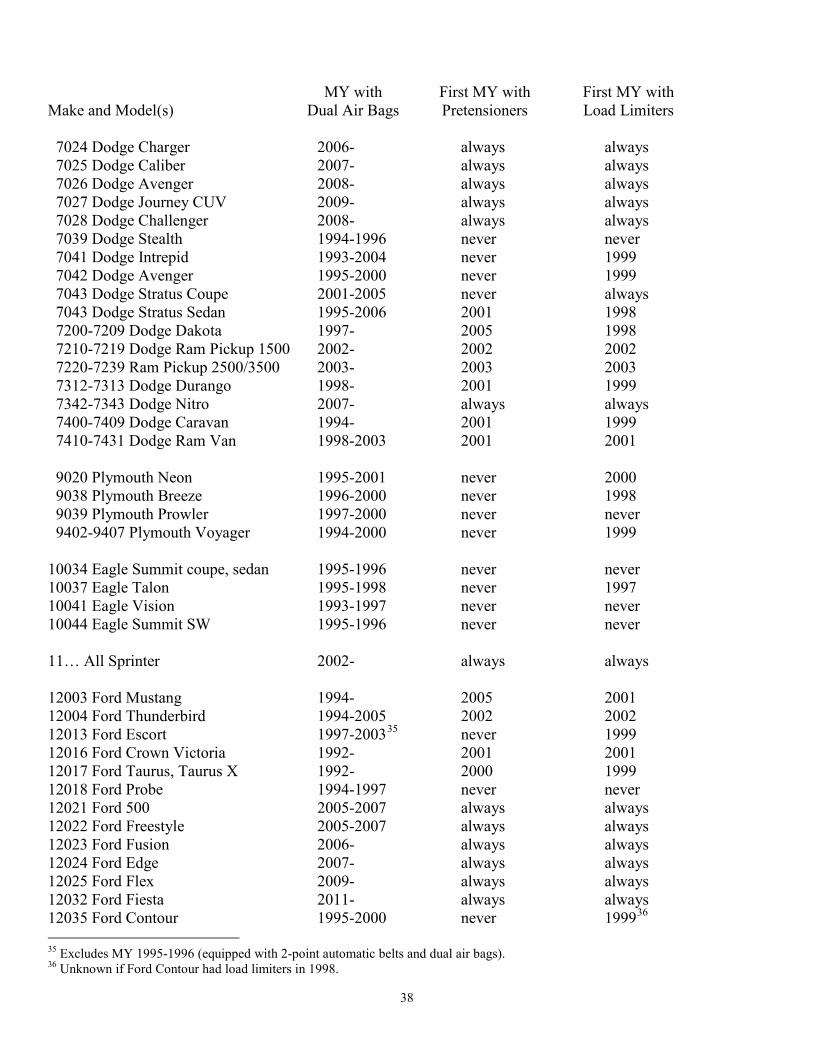
MY with First MY with First MY with Make and Model(s) Dual Air Bags Pretensioners Load Limiters
38
7024 Dodge Charger 2006- always always 7025 Dodge Caliber 2007- always always 7026 Dodge Avenger 2008- always always 7027 Dodge Journey CUV 2009- always always 7028 Dodge Challenger 2008- always always 7039 Dodge Stealth 1994-1996 never never 7041 Dodge Intrepid 1993-2004 never 1999 7042 Dodge Avenger 1995-2000 never 1999 7043 Dodge Stratus Coupe 2001-2005 never always 7043 Dodge Stratus Sedan 1995-2006 2001 1998 7200-7209 Dodge Dakota 1997- 2005 1998 7210-7219 Dodge Ram Pickup 1500 2002- 2002 2002 7220-7239 Ram Pickup 2500/3500 2003- 2003 2003 7312-7313 Dodge Durango 1998- 2001 1999 7342-7343 Dodge Nitro 2007- always always 7400-7409 Dodge Caravan 1994- 2001 1999 7410-7431 Dodge Ram Van 1998-2003 2001 2001 9020 Plymouth Neon 1995-2001 never 2000 9038 Plymouth Breeze 1996-2000 never 1998 9039 Plymouth Prowler 1997-2000 never never 9402-9407 Plymouth Voyager 1994-2000 never 1999 10034 Eagle Summit coupe, sedan 1995-1996 never never 10037 Eagle Talon 1995-1998 never 1997 10041 Eagle Vision 1993-1997 never never 10044 Eagle Summit SW 1995-1996 never never 11… All Sprinter 2002- always always 12003 Ford Mustang 1994- 2005 2001 12004 Ford Thunderbird 1994-2005 2002 2002 12013 Ford Escort 1997-200335 never 1999 12016 Ford Crown Victoria 1992- 2001 2001 12017 Ford Taurus, Taurus X 1992- 2000 1999 12018 Ford Probe 1994-1997 never never 12021 Ford 500 2005-2007 always always 12022 Ford Freestyle 2005-2007 always always 12023 Ford Fusion 2006- always always 12024 Ford Edge 2007- always always 12025 Ford Flex 2009- always always 12032 Ford Fiesta 2011- always always 12035 Ford Contour 1995-2000 never 199936 35 Excludes MY 1995-1996 (equipped with 2-point automatic belts and dual air bags). 36 Unknown if Ford Contour had load limiters in 1998.
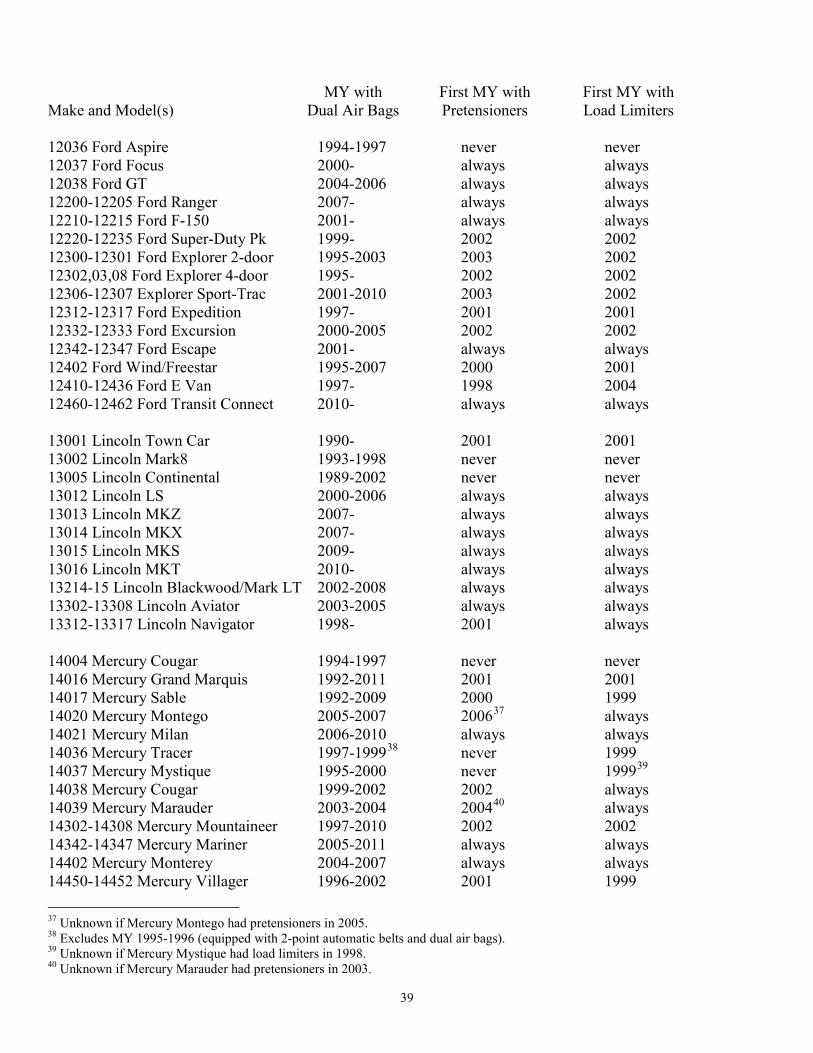
MY with First MY with First MY with Make and Model(s) Dual Air Bags Pretensioners Load Limiters
39
12036 Ford Aspire 1994-1997 never never 12037 Ford Focus 2000- always always 12038 Ford GT 2004-2006 always always 12200-12205 Ford Ranger 2007- always always 12210-12215 Ford F-150 2001- always always 12220-12235 Ford Super-Duty Pk 1999- 2002 2002 12300-12301 Ford Explorer 2-door 1995-2003 2003 2002 12302,03,08 Ford Explorer 4-door 1995- 2002 2002 12306-12307 Explorer Sport-Trac 2001-2010 2003 2002 12312-12317 Ford Expedition 1997- 2001 2001 12332-12333 Ford Excursion 2000-2005 2002 2002 12342-12347 Ford Escape 2001- always always 12402 Ford Wind/Freestar 1995-2007 2000 2001 12410-12436 Ford E Van 1997- 1998 2004 12460-12462 Ford Transit Connect 2010- always always 13001 Lincoln Town Car 1990- 2001 2001 13002 Lincoln Mark8 1993-1998 never never 13005 Lincoln Continental 1989-2002 never never 13012 Lincoln LS 2000-2006 always always 13013 Lincoln MKZ 2007- always always 13014 Lincoln MKX 2007- always always 13015 Lincoln MKS 2009- always always 13016 Lincoln MKT 2010- always always 13214-15 Lincoln Blackwood/Mark LT 2002-2008 always always 13302-13308 Lincoln Aviator 2003-2005 always always 13312-13317 Lincoln Navigator 1998- 2001 always 14004 Mercury Cougar 1994-1997 never never 14016 Mercury Grand Marquis 1992-2011 2001 2001 14017 Mercury Sable 1992-2009 2000 1999 14020 Mercury Montego 2005-2007 200637 always 14021 Mercury Milan 2006-2010 always always 14036 Mercury Tracer 1997-199938 never 1999 14037 Mercury Mystique 1995-2000 never 199939 14038 Mercury Cougar 1999-2002 2002 always 14039 Mercury Marauder 2003-2004 200440 always 14302-14308 Mercury Mountaineer 1997-2010 2002 2002 14342-14347 Mercury Mariner 2005-2011 always always 14402 Mercury Monterey 2004-2007 always always 14450-14452 Mercury Villager 1996-2002 2001 1999 37 Unknown if Mercury Montego had pretensioners in 2005. 38 Excludes MY 1995-1996 (equipped with 2-point automatic belts and dual air bags). 39 Unknown if Mercury Mystique had load limiters in 1998. 40 Unknown if Mercury Marauder had pretensioners in 2003.

MY with First MY with First MY with Make and Model(s) Dual Air Bags Pretensioners Load Limiters
40
18002 Buick LeSabre 1994-2005 never never 18003 Buick Park Avenue 1994-2005 never never 18004 Buick Roadmaster 1994-1996 never never 18005 Buick Riviera 1995-1999 never never 18017 Buick Century 1997-2005 never 1999 18018 Buick Skylark 1996-1998 never never 18019 Buick Regal 2011- always always 18020 Buick Regal 1995-2004 never 1999 18022 Buick LaCrosse 2005- always always 18023 Buick Lucerne 2006- always always 18024 Buick Enclave 2008- always always 18302-18303 Buick Rainier 2004-2007 2005 always 18356-18357 Buick Rendezvous 2002-2007 2004 always 18454-18457 Buick Teraza 2005-2007 always always 19003 Cadillac DeVille 1993-2005 2000 2001 19005 Cadillac Eldorado 1993-2002 never never 19014 Cadillac Seville 1993-2004 1998 2001 19017 Cadillac Catera 1997-2001 always always 19018 Cadillac CTS 2003- always always 19019 Cadillac XLR 2004- always always 19020 Cadillac SRX 2004- always always 19021 Cadillac STS 2005- always always 19022 Cadillac DTS 2006- always always 19312-19343 Cadillac Escalade 1999- 2007 2007 20002 Chevrolet Caprice 1994-1995 never never 20002 Chevrolet Impala 2000- 2006 2000 20004 Chevrolet Corvette 1994- 2005 2005 20009 Chevrolet Camaro 1993-2002, 2010- 2010 2010 20016 Chevrolet Cavalier 1995-2005 never 199741 20020 Chevrolet Lumina 1995-2001 never 2000 20022 Chevrolet Cobalt 2005-2010 2006 always 20023 Chevrolet HHR 2006- always always 20024 Chevrolet Traverse 2009- always always 20025 Chevrolet Cruze 2011- always always 20026 Chevrolet Volt 2011- always always 20027 Chevrolet Caprice Police 2011- always always 20032 Chevrolet Prizm 1994-2002 1998 1998 20034 Chevrolet Metro 1995-2001 never never 20036 Chevrolet Monte Carlo 1995-2007 2006 2000 20037 Chevrolet Malibu 1997- 200442 always 41 Unknown if Chevrolet Cavalier had load limiters in 1996. 42 2004-2005 Chevrolet Classic (MM2=20037, CG=18068) did not have pretensioners.
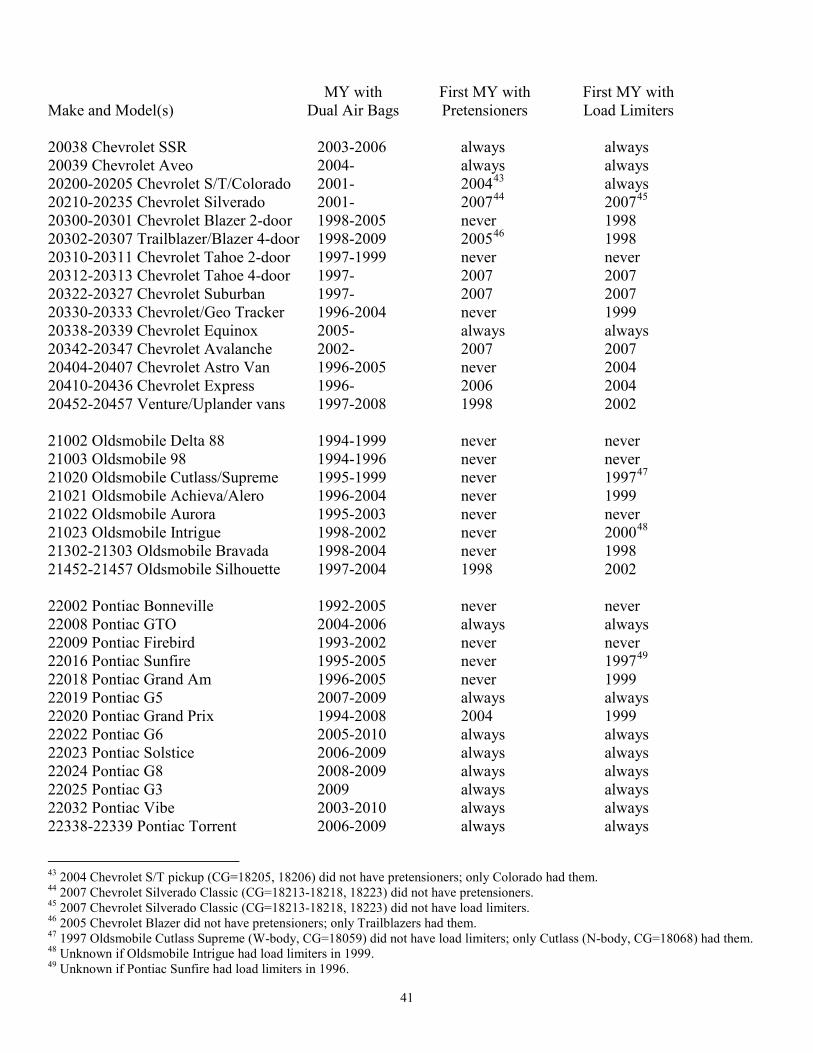
MY with First MY with First MY with Make and Model(s) Dual Air Bags Pretensioners Load Limiters
41
20038 Chevrolet SSR 2003-2006 always always 20039 Chevrolet Aveo 2004- always always 20200-20205 Chevrolet S/T/Colorado 2001- 200443 always 20210-20235 Chevrolet Silverado 2001- 200744 200745 20300-20301 Chevrolet Blazer 2-door 1998-2005 never 1998 20302-20307 Trailblazer/Blazer 4-door 1998-2009 200546 1998 20310-20311 Chevrolet Tahoe 2-door 1997-1999 never never 20312-20313 Chevrolet Tahoe 4-door 1997- 2007 2007 20322-20327 Chevrolet Suburban 1997- 2007 2007 20330-20333 Chevrolet/Geo Tracker 1996-2004 never 1999 20338-20339 Chevrolet Equinox 2005- always always 20342-20347 Chevrolet Avalanche 2002- 2007 2007 20404-20407 Chevrolet Astro Van 1996-2005 never 2004 20410-20436 Chevrolet Express 1996- 2006 2004 20452-20457 Venture/Uplander vans 1997-2008 1998 2002 21002 Oldsmobile Delta 88 1994-1999 never never 21003 Oldsmobile 98 1994-1996 never never 21020 Oldsmobile Cutlass/Supreme 1995-1999 never 199747 21021 Oldsmobile Achieva/Alero 1996-2004 never 1999 21022 Oldsmobile Aurora 1995-2003 never never 21023 Oldsmobile Intrigue 1998-2002 never 200048 21302-21303 Oldsmobile Bravada 1998-2004 never 1998 21452-21457 Oldsmobile Silhouette 1997-2004 1998 2002 22002 Pontiac Bonneville 1992-2005 never never 22008 Pontiac GTO 2004-2006 always always 22009 Pontiac Firebird 1993-2002 never never 22016 Pontiac Sunfire 1995-2005 never 199749 22018 Pontiac Grand Am 1996-2005 never 1999 22019 Pontiac G5 2007-2009 always always 22020 Pontiac Grand Prix 1994-2008 2004 1999 22022 Pontiac G6 2005-2010 always always 22023 Pontiac Solstice 2006-2009 always always 22024 Pontiac G8 2008-2009 always always 22025 Pontiac G3 2009 always always 22032 Pontiac Vibe 2003-2010 always always 22338-22339 Pontiac Torrent 2006-2009 always always
43 2004 Chevrolet S/T pickup (CG=18205, 18206) did not have pretensioners; only Colorado had them. 44 2007 Chevrolet Silverado Classic (CG=18213-18218, 18223) did not have pretensioners. 45 2007 Chevrolet Silverado Classic (CG=18213-18218, 18223) did not have load limiters. 46 2005 Chevrolet Blazer did not have pretensioners; only Trailblazers had them. 47 1997 Oldsmobile Cutlass Supreme (W-body, CG=18059) did not have load limiters; only Cutlass (N-body, CG=18068) had them. 48 Unknown if Oldsmobile Intrigue had load limiters in 1999. 49 Unknown if Pontiac Sunfire had load limiters in 1996.
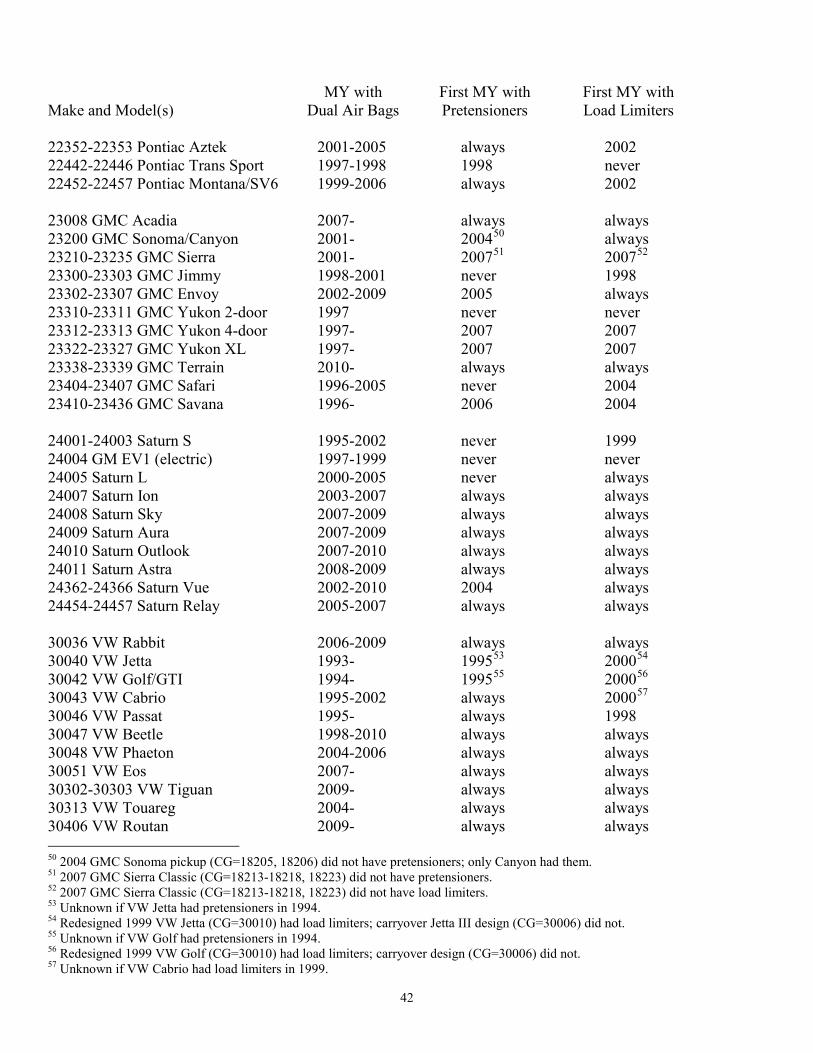
MY with First MY with First MY with Make and Model(s) Dual Air Bags Pretensioners Load Limiters
42
22352-22353 Pontiac Aztek 2001-2005 always 2002 22442-22446 Pontiac Trans Sport 1997-1998 1998 never 22452-22457 Pontiac Montana/SV6 1999-2006 always 2002 23008 GMC Acadia 2007- always always 23200 GMC Sonoma/Canyon 2001- 200450 always 23210-23235 GMC Sierra 2001- 200751 200752 23300-23303 GMC Jimmy 1998-2001 never 1998 23302-23307 GMC Envoy 2002-2009 2005 always 23310-23311 GMC Yukon 2-door 1997 never never 23312-23313 GMC Yukon 4-door 1997- 2007 2007 23322-23327 GMC Yukon XL 1997- 2007 2007 23338-23339 GMC Terrain 2010- always always 23404-23407 GMC Safari 1996-2005 never 2004 23410-23436 GMC Savana 1996- 2006 2004 24001-24003 Saturn S 1995-2002 never 1999 24004 GM EV1 (electric) 1997-1999 never never 24005 Saturn L 2000-2005 never always 24007 Saturn Ion 2003-2007 always always 24008 Saturn Sky 2007-2009 always always 24009 Saturn Aura 2007-2009 always always 24010 Saturn Outlook 2007-2010 always always 24011 Saturn Astra 2008-2009 always always 24362-24366 Saturn Vue 2002-2010 2004 always 24454-24457 Saturn Relay 2005-2007 always always 30036 VW Rabbit 2006-2009 always always 30040 VW Jetta 1993- 199553 200054 30042 VW Golf/GTI 1994- 199555 200056 30043 VW Cabrio 1995-2002 always 200057 30046 VW Passat 1995- always 1998 30047 VW Beetle 1998-2010 always always 30048 VW Phaeton 2004-2006 always always 30051 VW Eos 2007- always always 30302-30303 VW Tiguan 2009- always always 30313 VW Touareg 2004- always always 30406 VW Routan 2009- always always 50 2004 GMC Sonoma pickup (CG=18205, 18206) did not have pretensioners; only Canyon had them. 51 2007 GMC Sierra Classic (CG=18213-18218, 18223) did not have pretensioners. 52 2007 GMC Sierra Classic (CG=18213-18218, 18223) did not have load limiters. 53 Unknown if VW Jetta had pretensioners in 1994. 54 Redesigned 1999 VW Jetta (CG=30010) had load limiters; carryover Jetta III design (CG=30006) did not. 55 Unknown if VW Golf had pretensioners in 1994. 56 Redesigned 1999 VW Golf (CG=30010) had load limiters; carryover design (CG=30006) did not. 57 Unknown if VW Cabrio had load limiters in 1999.
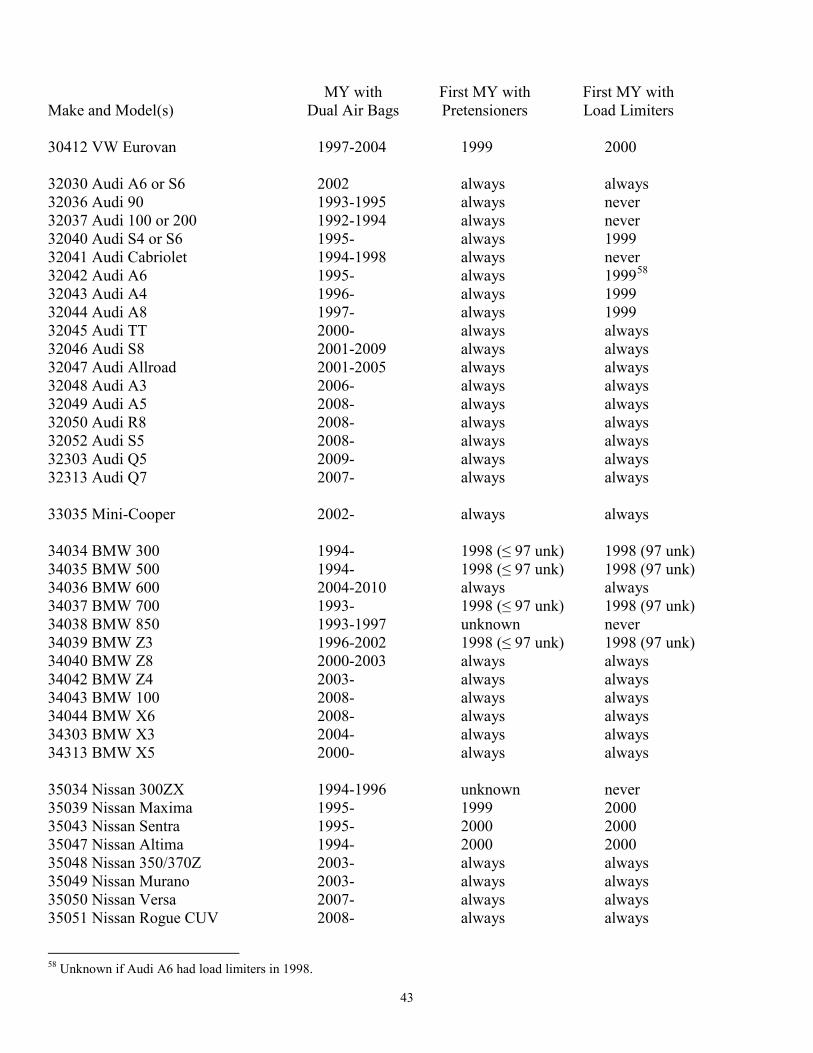
MY with First MY with First MY with Make and Model(s) Dual Air Bags Pretensioners Load Limiters
43
30412 VW Eurovan 1997-2004 1999 2000 32030 Audi A6 or S6 2002 always always 32036 Audi 90 1993-1995 always never 32037 Audi 100 or 200 1992-1994 always never 32040 Audi S4 or S6 1995- always 1999 32041 Audi Cabriolet 1994-1998 always never 32042 Audi A6 1995- always 199958 32043 Audi A4 1996- always 1999 32044 Audi A8 1997- always 1999 32045 Audi TT 2000- always always 32046 Audi S8 2001-2009 always always 32047 Audi Allroad 2001-2005 always always 32048 Audi A3 2006- always always 32049 Audi A5 2008- always always 32050 Audi R8 2008- always always 32052 Audi S5 2008- always always 32303 Audi Q5 2009- always always 32313 Audi Q7 2007- always always 33035 Mini-Cooper 2002- always always 34034 BMW 300 1994- 1998 (≤ 97 unk) 1998 (97 unk) 34035 BMW 500 1994- 1998 (≤ 97 unk) 1998 (97 unk) 34036 BMW 600 2004-2010 always always 34037 BMW 700 1993- 1998 (≤ 97 unk) 1998 (97 unk) 34038 BMW 850 1993-1997 unknown never 34039 BMW Z3 1996-2002 1998 (≤ 97 unk) 1998 (97 unk) 34040 BMW Z8 2000-2003 always always 34042 BMW Z4 2003- always always 34043 BMW 100 2008- always always 34044 BMW X6 2008- always always 34303 BMW X3 2004- always always 34313 BMW X5 2000- always always 35034 Nissan 300ZX 1994-1996 unknown never 35039 Nissan Maxima 1995- 1999 2000 35043 Nissan Sentra 1995- 2000 2000 35047 Nissan Altima 1994- 2000 2000 35048 Nissan 350/370Z 2003- always always 35049 Nissan Murano 2003- always always 35050 Nissan Versa 2007- always always 35051 Nissan Rogue CUV 2008- always always
58 Unknown if Audi A6 had load limiters in 1998.

MY with First MY with First MY with Make and Model(s) Dual Air Bags Pretensioners Load Limiters
44
35052 Nissan Cube CUV 2009- always always 35053 Nissan GT-R 2009- always always 35055 Nissan Leaf 2011- always always 35200-35205 Nissan Frontier 1999- 2000 1999 35212-35215 Nissan Titan 2004- always always 35302-35303 Nissan Pathfinder 1996- 2000 2000 35312-35313 Nissan Armada 2004- always always 35322-35323 Nissan Xterra 2000- always always 35332-35333 Nissan Juke 2011- always always 35452 Nissan Quest 1996- 2001 1999 37030 Honda Civic Del Sol 1993-1997 never never 37031 Honda Civic 1994- 2001 1999 37032 Honda Accord 1993- 2001 200159 37033 Honda Prelude 1992-2001 never 1999 37035 Honda S2000 2000-2009 always always 37036 Honda EV Plus 1997-1999 never 1999 37037 Honda Insight 2000- always always 37039 Honda Fit 2007- always always 37041 Honda CR-Z 2011- always always 37205 Honda Ridgeline 2006- always always 37302-37303 Honda CR-V 1997- 1998 1997 37322-37323 Honda Passport 1995-2002 never 1998 37322-37323 Honda Pilot 2003- always always 37332-37333 Honda Element 2003- always always 37402 Honda Odyssey 1996- 1999 1999 38202-38205 Isuzu Pickups 2006-2008 always always 38300-38301 Isuzu Amigo/Rodeo Sport 1998-2003 never 1998 38302-38307 Isuzu Ascender 2003-2008 2005 always 38311-38313 Isuzu Trooper 1995-2002 never 200060 38322-38323 Isuzu Rodeo 1996-2004 never 1998 38326-38327 Isuzu Axiom 2002-2004 never always 38331 Isuzu Vehicross 1999-2002 never always 38402 Isuzu Oasis 1996-1999 never never 39031 Jaguar XJ-S, XK coupes 1994-2006 199861 200262 39032 Jaguar XJ sedans 1994- 1998 200263 39034 Jaguar S-Type 2000-2008 always always 39035 Jaguar XK coupes 2007- always always
59 Unknown if Honda Accord had load limiters in 2000. 60 Unknown if Isuzu Trooper had load limiters in 1998-1999. 61 Unknown if Jaguar XK Coupes had pretensioners in 1997. 62 Unknown if Jaguar XK Coupes had load limiters in 1999-2001. 63 Unknown if Jaguar XJ Sedans had load limiters in 1999-2001.

MY with First MY with First MY with Make and Model(s) Dual Air Bags Pretensioners Load Limiters
45
39036 Jaguar X-Type 2002-2008 always always 39037 Jaguar XF 2009- always always 41035 Mazda Protégé 1995-2003 2001 1997 41037 Mazda 626 1994-2002 never 1997 41043 Mazda 929 1992-1995 never never 41044 Mazda MX-6 1994-1997 never 1997 41045 Mazda Miata/MX-5 1994- 2001 1997 41046 Mazda MX-3 1994-1995 never never 41047 Mazda Millenia 1995-2002 never 1997 41049 Mazda RX-8 2004- always always 41050 Mazda 6 2003- always always 41051 Mazda 3 2004- always always 41052 Mazda 5 2006-2010 always always 41053 Mazda CX-7 2007- always always 41054 Mazda CX-9 2007- always always 41055 Mazda 2 2011- always always 41200-41205 Mazda B pickup 2007-2009 always always 41342-41347 Mazda Tribute 2001- always always 41402-41403 Mazda MPV wagon 1996-2006 2002 2000 42031 Mercedes E (thru 1995) 1989-1995 always never 42033 Mercedes SL (thru 1989) 1989 always never 42036 Mercedes SEL/SEC 1989-1993 always never 42037 Mercedes S (thru 1991) 1989-1991 always never 42039 Mercedes 190 1990-1993 always never 42042 Mercedes C 1994- always 2000 42043 Mercedes S 1992- always 2000 42044 Mercedes SL 1990- always 2003 42045 Mercedes SLK 1998- always always 42046 Mercedes CL 1998- always 2000 42047 Mercedes CLK 1998-2009 always 2000 42048 Mercedes E 1996- always always 42049 Mercedes SLR 2005-2009 always always 42051 Mercedes CLS 2006- always always 42052 Mercedes SLS 2011- always always 42302-42307 Mercedes ML 1998- always always 42313 Mercedes G 2002- always always 42323 Mercedes R 2006- always always 42333 Mercedes GL 2007- always always 42336-42337 Mercedes GLK 2010- always always 45030 Porsche unknown model 1992-1994 never never
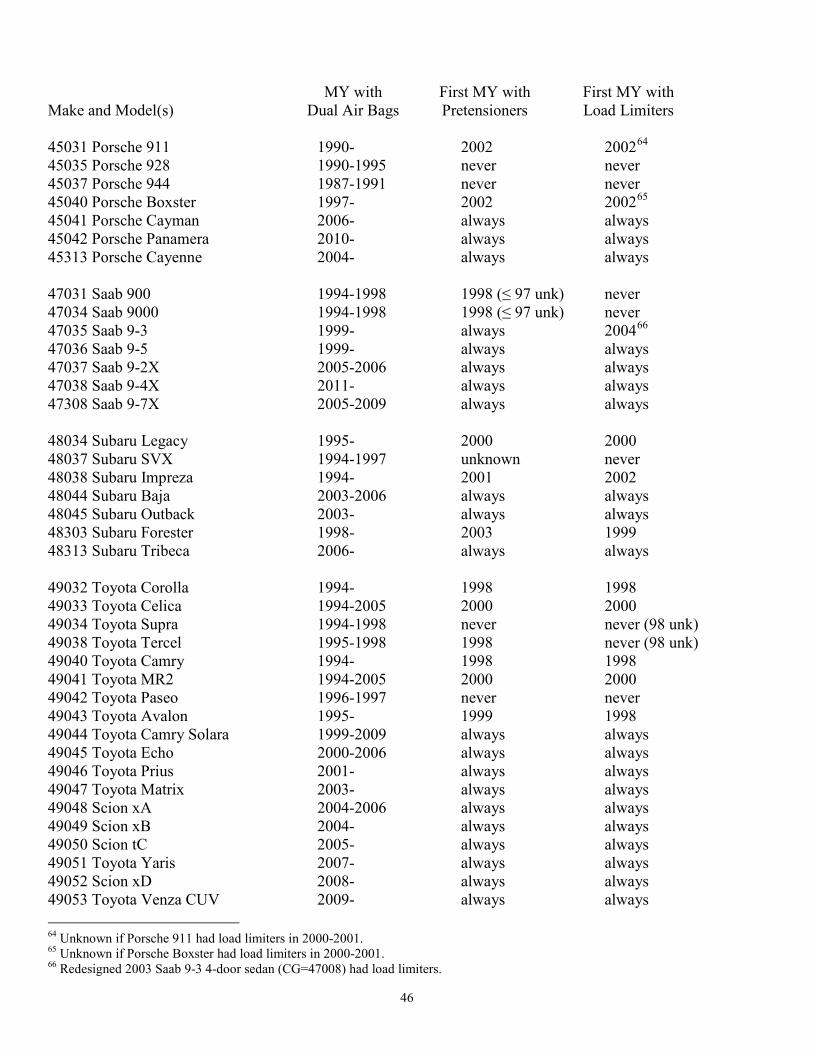
MY with First MY with First MY with Make and Model(s) Dual Air Bags Pretensioners Load Limiters
46
45031 Porsche 911 1990- 2002 200264 45035 Porsche 928 1990-1995 never never 45037 Porsche 944 1987-1991 never never 45040 Porsche Boxster 1997- 2002 200265 45041 Porsche Cayman 2006- always always 45042 Porsche Panamera 2010- always always 45313 Porsche Cayenne 2004- always always 47031 Saab 900 1994-1998 1998 (≤ 97 unk) never 47034 Saab 9000 1994-1998 1998 (≤ 97 unk) never 47035 Saab 9-3 1999- always 200466 47036 Saab 9-5 1999- always always 47037 Saab 9-2X 2005-2006 always always 47038 Saab 9-4X 2011- always always 47308 Saab 9-7X 2005-2009 always always 48034 Subaru Legacy 1995- 2000 2000 48037 Subaru SVX 1994-1997 unknown never 48038 Subaru Impreza 1994- 2001 2002 48044 Subaru Baja 2003-2006 always always 48045 Subaru Outback 2003- always always 48303 Subaru Forester 1998- 2003 1999 48313 Subaru Tribeca 2006- always always 49032 Toyota Corolla 1994- 1998 1998 49033 Toyota Celica 1994-2005 2000 2000 49034 Toyota Supra 1994-1998 never never (98 unk) 49038 Toyota Tercel 1995-1998 1998 never (98 unk) 49040 Toyota Camry 1994- 1998 1998 49041 Toyota MR2 1994-2005 2000 2000 49042 Toyota Paseo 1996-1997 never never 49043 Toyota Avalon 1995- 1999 1998 49044 Toyota Camry Solara 1999-2009 always always 49045 Toyota Echo 2000-2006 always always 49046 Toyota Prius 2001- always always 49047 Toyota Matrix 2003- always always 49048 Scion xA 2004-2006 always always 49049 Scion xB 2004- always always 49050 Scion tC 2005- always always 49051 Toyota Yaris 2007- always always 49052 Scion xD 2008- always always 49053 Toyota Venza CUV 2009- always always 64 Unknown if Porsche 911 had load limiters in 2000-2001. 65 Unknown if Porsche Boxster had load limiters in 2000-2001. 66 Redesigned 2003 Saab 9-3 4-door sedan (CG=47008) had load limiters.

MY with First MY with First MY with Make and Model(s) Dual Air Bags Pretensioners Load Limiters
47
49200-49205 Toyota Tacoma Pk 2001- always always 49210-49215 Toyota Tundra Pk 2000- always always 49302-49303 Toyota 4Runner 1996- 1999 1998 49313 Toyota Land Cruiser 1995- 1998 1998 49320-49323 Toyota RAV4 1996- 1998 1998 49342-49347 Toyota Highlander 2001- always always 49352 Toyota Sequoia 2001- always always 49362 Toyota FJ Cruiser 2007- always always 49400-49403 Toyota Sienna Van 1998- always always 49422 Toyota Previa Van 1994-1997 never never67 51040 Volvo 940 1994-1995 always never (95 unk) 51041 Volvo 960 1993-1997 always never68 51042 Volvo 850 1993-1997 always 1995 51043 Volvo S70, V70, C70, XC70 1998- always always 51044 Volvo 90-Series 1998 always always 51045 Volvo S80 1999- always always 51046 Volvo 40 2000- always always 51047 Volvo S60, XC60 2001- always always 51048 Volvo V50 2005- always always 51049 Volvo C30 2008- always always 51312-51313 Volvo XC90 2003- always always 52034 Mitsubishi Galant 1994- 2004 199969 52035 Mitsubishi Mirage 1995-2002 never70 1997 52037 Mitsubishi Eclipse 1995- 2006 1997 52039 Mitsubishi 3000GT 1994-1997 never 1997 52040 Mitsubishi Diamante 1994-2004 199971 1997 52046 Mitsubishi Lancer 2002- always always 52047 Mitsubishi Outlander 2003- always always 52202-52205 Mitsubishi Raider 2006-2009 always always 52312-52313 Mitsubishi Endeavor 2004- always always 52333 Mitsubishi Montero 1996-2006 2002 1997 52336-52337 Mitsubishi Montero Sport 1997-2004 200372 1997 53031 Suzuki Swift 1995-2001 never never 53032 Suzuki Esteem 1995-2002 never never 53033 Suzuki Aerio 2002-2007 always always 53034 Suzuki Forenza 2004-2008 always always
67 Toyota Previa never had load limiters for RF passengers; unknown for drivers. 68 Unknown if Volvo 960 had load limiters in 1995-1997. 69 Unknown if Mitsubishi Galant had load limiters in 1997-1998. 70 Unknown if Mitsubishi Mirage had pretensioners in 2000-2002. 71 Unknown if Mitsubishi Diamante had pretensioners in 1994-1998. 72 In 2001-2002, Mitsubishi Montero Sport had pretensioners for drivers but not RF passengers (exclude from analysis).

MY with First MY with First MY with Make and Model(s) Dual Air Bags Pretensioners Load Limiters
48
53035 Suzuki Verona 2004-2006 always always 53036 Suzuki Reno 2005-2008 always always 53040 Suzuki SX4 2007- always always 53041 Suzuki Kizashi 2010- always always 53202-53205 Suzuki Equator 2009- always always 53310-53313 Suzuki Sidekick 1996-1998 never never 53320-53321 Suzuki X-90 1996-1998 never never 53332-53333 Suzuki Vitara 1999-2004 never always 53336-53337 Suzuki Grand Vitara 1999- 2006 always 53338-53339 Suzuki XL-7 2001- always always 54031 Acura Integra 1994-2001 never 1999 54032 Acura Legend 1991-1995 199273 never 54033 Acura NSX 1993-2005 1993 never 54034 Acura Vigor 1993-1994 never never 54035 Acura TL 1995- 2002 2000 54036 Acura RL 1996- always 1999 54037 Acura CL 1997-2003 2001 1999 54038 Acura RSX 2002-2006 always always 54039 Acura TSX 2004- always always 54040 Acura ZDX 2010- always always 54302-54303 Acura RDX 2007- always always 54313 Acura SLX 1996-1999 never never 54323 Acura MDX 2001- always always 55033 Hyundai Sonata 1994- 1999 2003 55035 Hyundai Elantra 1996- 1999 2004 55036 Hyundai Accent 1995- 2000 2004 55037 Hyundai Tiburon 1997-2008 2000 2004 55038 Hyundai XG300 2001-2005 always 2003 55039 Hyundai Azera 2006- always always 55040 Hyundai Equus 2011- always always 55041 Hyundai Genesis 2009- always always 55302-55309 Hyundai Santa Fe 2001- always always 55322-55323 Hyundai Tucson 2005- always always 55332-55323 Hyundai Veracruz 2007- always always 55402 Hyundai Entourage 2007-2009 always always 58032 Infiniti Q45 1994-2006 1994 1999 58033 Infiniti G20 1993-2002 1993 1999 58034 Infiniti J30 1993-1997 1994 never 58035 Infiniti I30 1996-2001 1999 2000 58036 Infiniti I35 2002-2004 always always
73 Unknown if Acura Legend had pretensioners in 1991.
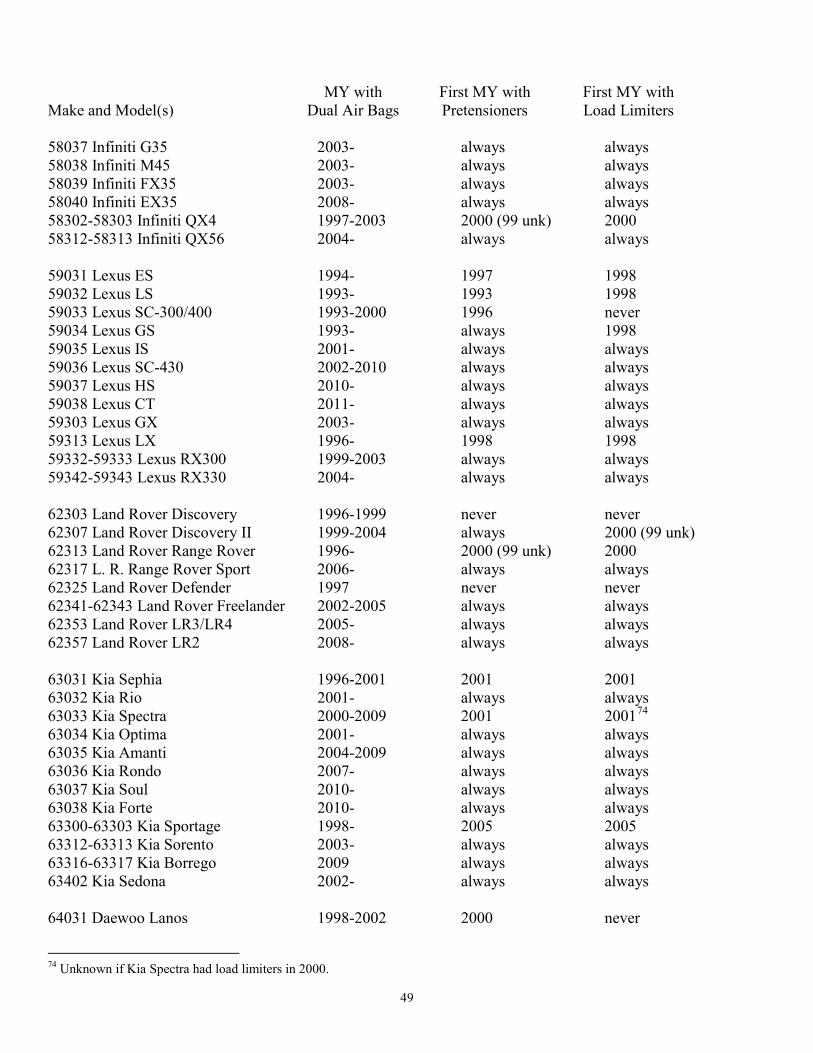
MY with First MY with First MY with Make and Model(s) Dual Air Bags Pretensioners Load Limiters
49
58037 Infiniti G35 2003- always always 58038 Infiniti M45 2003- always always 58039 Infiniti FX35 2003- always always 58040 Infiniti EX35 2008- always always 58302-58303 Infiniti QX4 1997-2003 2000 (99 unk) 2000 58312-58313 Infiniti QX56 2004- always always 59031 Lexus ES 1994- 1997 1998 59032 Lexus LS 1993- 1993 1998 59033 Lexus SC-300/400 1993-2000 1996 never 59034 Lexus GS 1993- always 1998 59035 Lexus IS 2001- always always 59036 Lexus SC-430 2002-2010 always always 59037 Lexus HS 2010- always always 59038 Lexus CT 2011- always always 59303 Lexus GX 2003- always always 59313 Lexus LX 1996- 1998 1998 59332-59333 Lexus RX300 1999-2003 always always 59342-59343 Lexus RX330 2004- always always 62303 Land Rover Discovery 1996-1999 never never 62307 Land Rover Discovery II 1999-2004 always 2000 (99 unk) 62313 Land Rover Range Rover 1996- 2000 (99 unk) 2000 62317 L. R. Range Rover Sport 2006- always always 62325 Land Rover Defender 1997 never never 62341-62343 Land Rover Freelander 2002-2005 always always 62353 Land Rover LR3/LR4 2005- always always 62357 Land Rover LR2 2008- always always 63031 Kia Sephia 1996-2001 2001 2001 63032 Kia Rio 2001- always always 63033 Kia Spectra 2000-2009 2001 200174 63034 Kia Optima 2001- always always 63035 Kia Amanti 2004-2009 always always 63036 Kia Rondo 2007- always always 63037 Kia Soul 2010- always always 63038 Kia Forte 2010- always always 63300-63303 Kia Sportage 1998- 2005 2005 63312-63313 Kia Sorento 2003- always always 63316-63317 Kia Borrego 2009 always always 63402 Kia Sedona 2002- always always 64031 Daewoo Lanos 1998-2002 2000 never
74 Unknown if Kia Spectra had load limiters in 2000.

MY with First MY with First MY with Make and Model(s) Dual Air Bags Pretensioners Load Limiters
50
64032 Daewoo Nubira 1998-2002 always never 64033 Daewoo Leganza 1998-2002 always never 65031 Smart Fortwo 2008- always always

Appendix B
MY 1996 to 2011 SUVs Considered CUVs in This Report Ward’s Automotive Yearbooks began to list certain makes and models as “CUVs” in MY 2002 in its “Light-Duty Truck Specifications” and its narrative descriptions of the new vehicles.75 In general, the list of vehicles considered CUVs in this report includes all those called CUVs by Ward’s but also some other vehicles (among them, any CUVs of designs discontinued before 2002, since Ward’s was not yet using the term), based on sources or criteria documented in the footnotes.76 Typically, SUVs of unibody construction are considered CUVs, while SUVs of body-and-frame construction are called truck-based SUVs, but there are a few exceptions (see footnotes). The “LTV groups” are the 5-digit codes assigned by the VIN-decode programs developed by NHTSA’s Evaluation Division; an LTV group includes all of a manufacturer’s vehicles of the same type and wheelbase, and runs for several years, until those vehicles are redesigned – e.g., Ford Escape, Mercury Mariner, and Mazda Tribute belong to the same LTV group. These programs are updated periodically and are available to the public. First Last LTV Groups Included MY MY77 (NHTSA 5-Digit Codes) Chrysler PT Cruiser 2001 2010 6304 Chrysler Pacifica 2004 2008 6307 Dodge Magnum 2005 2008 6310 Jeep Compass/Patriot 2007 2011 6312 Dodge Journey 2009 2011 6316 Ford Escape/Merc Mariner/Mazda Tribute 2001 2009 12309 Ford Freestyle 2005 2007 12312 Ford Edge/Lincoln MKX 2007 2011 12314 Ford Flex/Lincoln MKT 2009 2011 12318 Pontiac Aztec 2001 2005 18313 Buick Rendezvous 2002 2007 18315 Saturn Vue 2002 2010 18317 Cadillac SRX/Saab 9-4X 2004 2011 18319, 18327 Chevrolet HHR 2006 2011 18321 Buick Enclave/Chevrolet Traverse/ GMC Acadia/Saturn Outlook 2007 2011 18323 VW Touareg/Porsche Cayenne 2004 2011 30301, 30303
75 Southfield, MI: Penton Media, Inc. 76 Ward’s does not call the Jeep Liberty a CUV, nor the Dodge Nitro (a related design with a longer wheelbase, according to cars.com). Although these vehicles are of unibody design, they have additional structure for the front and rear suspension to provide better off-road and towing capabilities and for that reason it is probably more appropriate to consider them truck-based SUVs. 77 2011 is the last model year in the VIN decoder used for this report; however, most of these vehicles continued as CUVs beyond MY 2011.
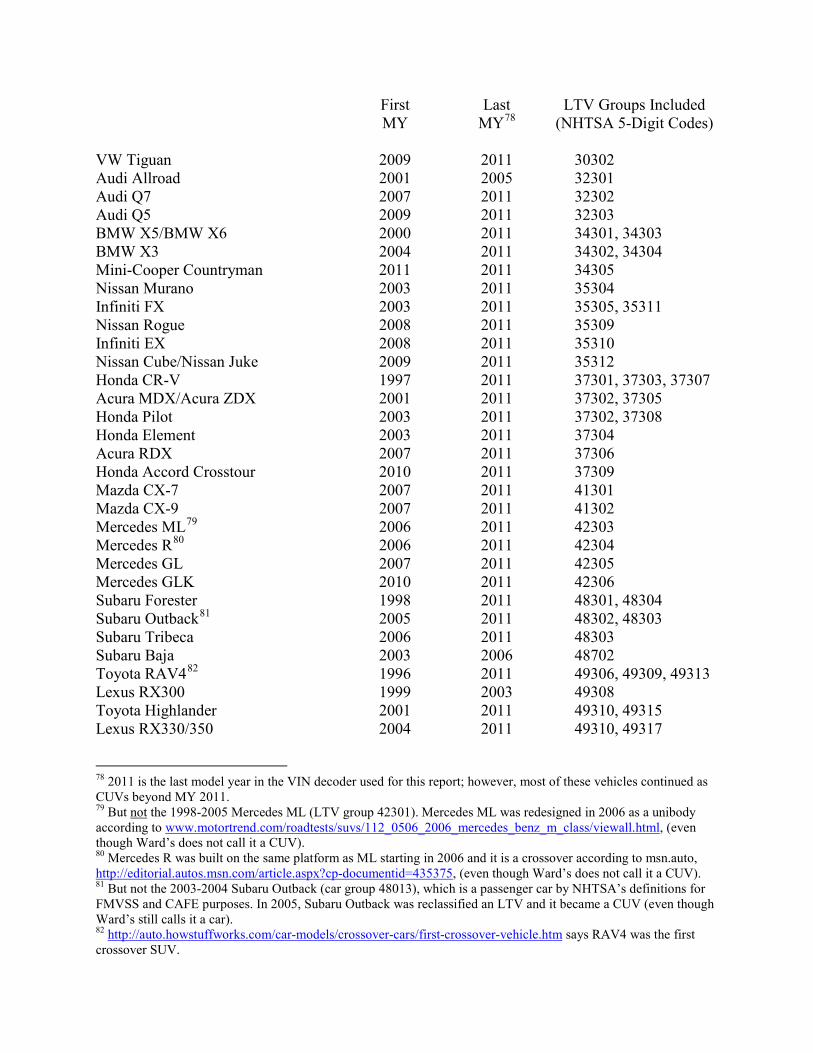
First Last LTV Groups Included MY MY78 (NHTSA 5-Digit Codes) VW Tiguan 2009 2011 30302 Audi Allroad 2001 2005 32301 Audi Q7 2007 2011 32302 Audi Q5 2009 2011 32303 BMW X5/BMW X6 2000 2011 34301, 34303 BMW X3 2004 2011 34302, 34304 Mini-Cooper Countryman 2011 2011 34305 Nissan Murano 2003 2011 35304 Infiniti FX 2003 2011 35305, 35311 Nissan Rogue 2008 2011 35309 Infiniti EX 2008 2011 35310 Nissan Cube/Nissan Juke 2009 2011 35312 Honda CR-V 1997 2011 37301, 37303, 37307 Acura MDX/Acura ZDX 2001 2011 37302, 37305 Honda Pilot 2003 2011 37302, 37308 Honda Element 2003 2011 37304 Acura RDX 2007 2011 37306 Honda Accord Crosstour 2010 2011 37309 Mazda CX-7 2007 2011 41301 Mazda CX-9 2007 2011 41302 Mercedes ML79 2006 2011 42303 Mercedes R80 2006 2011 42304 Mercedes GL 2007 2011 42305 Mercedes GLK 2010 2011 42306 Subaru Forester 1998 2011 48301, 48304 Subaru Outback81 2005 2011 48302, 48303 Subaru Tribeca 2006 2011 48303 Subaru Baja 2003 2006 48702 Toyota RAV482 1996 2011 49306, 49309, 49313 Lexus RX300 1999 2003 49308 Toyota Highlander 2001 2011 49310, 49315 Lexus RX330/350 2004 2011 49310, 49317
78 2011 is the last model year in the VIN decoder used for this report; however, most of these vehicles continued as CUVs beyond MY 2011. 79 But not the 1998-2005 Mercedes ML (LTV group 42301). Mercedes ML was redesigned in 2006 as a unibody according to www.motortrend.com/roadtests/suvs/112_0506_2006_mercedes_benz_m_class/viewall.html, (even though Ward’s does not call it a CUV). 80 Mercedes R was built on the same platform as ML starting in 2006 and it is a crossover according to msn.auto, http://editorial.autos.msn.com/article.aspx?cp-documentid=435375, (even though Ward’s does not call it a CUV). 81 But not the 2003-2004 Subaru Outback (car group 48013), which is a passenger car by NHTSA’s definitions for FMVSS and CAFE purposes. In 2005, Subaru Outback was reclassified an LTV and it became a CUV (even though Ward’s still calls it a car). 82 http://auto.howstuffworks.com/car-models/crossover-cars/first-crossover-vehicle.htm says RAV4 was the first crossover SUV.
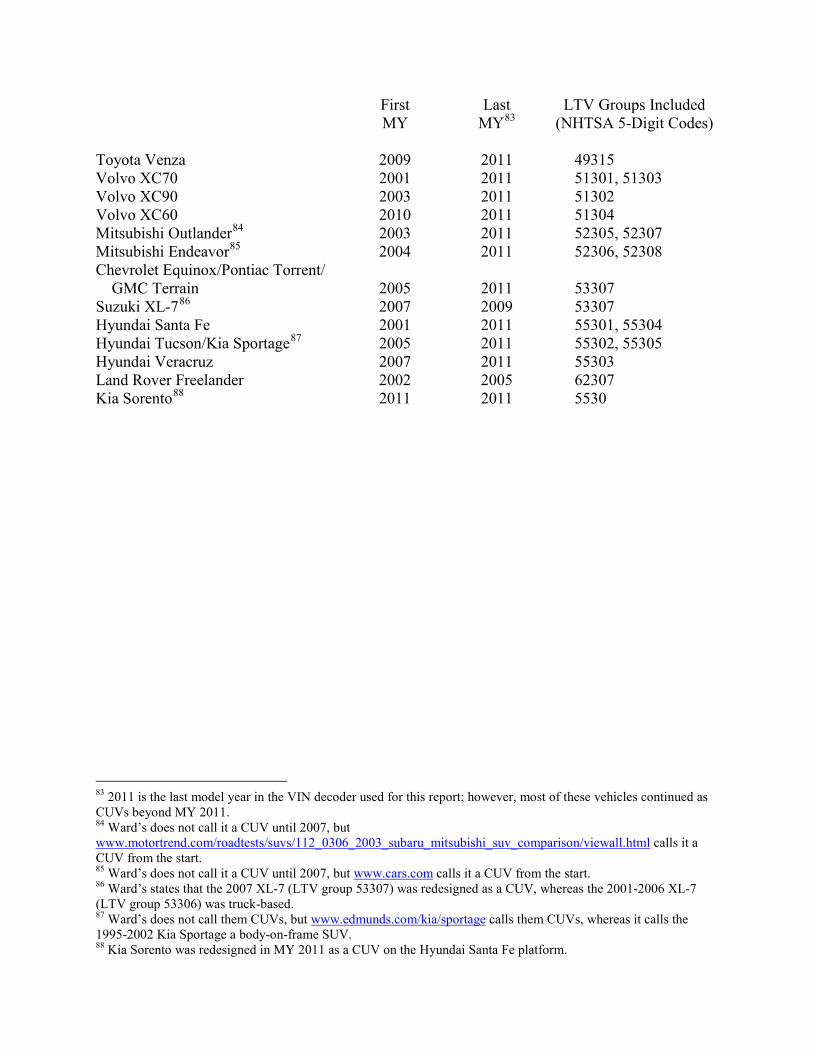
First Last LTV Groups Included MY MY83 (NHTSA 5-Digit Codes) Toyota Venza 2009 2011 49315 Volvo XC70 2001 2011 51301, 51303 Volvo XC90 2003 2011 51302 Volvo XC60 2010 2011 51304 Mitsubishi Outlander84 2003 2011 52305, 52307 Mitsubishi Endeavor85 2004 2011 52306, 52308 Chevrolet Equinox/Pontiac Torrent/ GMC Terrain 2005 2011 53307 Suzuki XL-786 2007 2009 53307 Hyundai Santa Fe 2001 2011 55301, 55304 Hyundai Tucson/Kia Sportage87 2005 2011 55302, 55305 Hyundai Veracruz 2007 2011 55303 Land Rover Freelander 2002 2005 62307 Kia Sorento88 2011 2011 5530
83 2011 is the last model year in the VIN decoder used for this report; however, most of these vehicles continued as CUVs beyond MY 2011. 84 Ward’s does not call it a CUV until 2007, but www.motortrend.com/roadtests/suvs/112_0306_2003_subaru_mitsubishi_suv_comparison/viewall.html calls it a CUV from the start. 85 Ward’s does not call it a CUV until 2007, but www.cars.com calls it a CUV from the start. 86 Ward’s states that the 2007 XL-7 (LTV group 53307) was redesigned as a CUV, whereas the 2001-2006 XL-7 (LTV group 53306) was truck-based. 87 Ward’s does not call them CUVs, but www.edmunds.com/kia/sportage calls them CUVs, whereas it calls the 1995-2002 Kia Sportage a body-on-frame SUV. 88 Kia Sorento was redesigned in MY 2011 as a CUV on the Hyundai Santa Fe platform.

DOT HS 811 835November 2013
9884-110513-v4